

Abstract
We extended a generic whole‐body physiologically based pharmacokinetic (PBPK) model for rats and humans for organs of the reproductive and endocrine systems (i.e., the testes and the thyroid gland). An extensive literature search was performed, first, to determine the most generic organ model structures for testes and thyroid across species, and, second, to identify the corresponding anatomic and physiological parameters in rats and humans. The testes and thyroid organ models were implemented in the PBPK modeling software PK‐Sim and MoBi. The capability of the PBPK approach to simulate the testes and thyroid tissue concentration data was demonstrated using a series of test compounds. The presented organ model structures and parameterization yielded a close agreement between observed and simulated tissue concentrations over time. The organ models are ready to be used to predict the pharmacokinetics of passively entering drugs in the testes and thyroid tissue in a generic PBPK modeling framework.
Study Highlights.
WHAT IS THE CURRENT KNOWLEDGE ON THE TOPIC?
☑ The majority of PBPK models represent only a set of organs and tissues known to have a substantial impact on absorption, distribution, metabolism, and elimination of a certain compound (e.g., eliminating organs, such as the kidneys and liver), the organs of the gastrointestinal tract as site of drug absorption, and large organs acting as a potential storage depot, such as adipose tissue, muscle, and skin. Further organs are not routinely incorporated in generic PBPK models.
WHAT QUESTION DID THIS STUDY ADDRESS?
☑ We developed a generic PBPK model, including the testes and the thyroid gland, which are relevant for the assessment of toxicity and related side effects of a drug.
WHAT THIS STUDY ADDS TO OUR KNOWLEDGE
☑ We provide the generic organ model structures and the respective set of anatomic and physiological data required to predict the tissue concentration of drugs in the testes and thyroid tissue.
HOW MIGHT THIS CHANGE DRUG DISCOVERY, DEVELOPMENT, AND/OR THERAPEUTICS?
☑ This will allow broadening the field of PBPK modeling applications, for example, in human risk assessment.
Physiologically based pharmacokinetic (PBPK) modeling is widely used to predict the concentration of drugs in plasma and at the site of drug action. Further applications include the extrapolation from animal species to humans (e.g., to predict the first dose in man), and scaling from adults to pediatrics or diseased populations. Most of the PBPK models available in literature or implemented in software platforms represent only a set of organs and tissues chosen because they are known to have a substantial impact on absorption, distribution, metabolism, and elimination (ADME) of a compound (e.g., eliminating organs, such as the kidneys and liver, the organs of the gastrointestinal tract as site of drug absorption, and large organs acting as potential storage depot such as adipose tissue, muscle, and skin). Additional organs (including e.g., bone marrow and organs of the reproductive system) are covered to a different extent by PBPK platforms.
A further field of PBPK modeling includes human risk assessment. Here, the focus lies on predicting the drug concentration in organs that are relevant for the assessment of toxicity and related side effects. Among them are organs of the reproductive and endocrine system, such as the testes and ovaries, the thyroid gland, and the adrenal glands. Typically, these organs are small in size and even though significant tissue concentrations can be reached, no significant impact on the overall pharmacokinetics of a drug in the body is observable. Consequently, there is no consolidated summary of anatomic and physiological data needed to parameterize the respective PBPK models. Furthermore, there are few PBPK models available in literature that incorporates organs of the reproductive system or the thyroid gland. These models are tailored to a specific question and cannot be easily implemented in a generic PBPK framework. One reason is the inconsistent use of the organ model structures across publications (e.g., blood‐flow limited and permeability limited distribution, active transport processes). Second, these models do not make use of established in silico methods to predict the tissue‐to‐plasma partition coefficients.1, 2, 3, 4 As a result, currently, little attention has been shown to the precise handling of organs relevant for toxicity assessment in a generic PBPK model.
In the present study, we focused on the development of organ models for the testes and the thyroid gland. The testes are responsible for spermatogenesis and the synthesis of androgens, primarily testosterone.5, 6 Substances targeting the testes may cause dysregulation of the homeostasis of sexual hormones or even lead to infertility. The thyroid gland is the site of production of thyroid hormones, primarily T3 and T4, as well as calcitonin. Thyroid hormones are responsible for the regulation of metabolism, and play an essential role in the development and differentiation of all cells of the body, whereas calcitonin is essential in the control of bone resorption and calcium homeostasis.7, 8
Based on an extensive literature search, we identified the most generic organ model structure for the testes and thyroid across species to be used in a generic whole‐body PBPK model. The literature survey included the collection of the corresponding set of anatomic and physiological parameters in rats and humans in addition to the parameters that are required to determine the tissue‐to‐plasma partition coefficients by the most prominent in silico methods. We completed our analyses with the development of the organ models using observed tissue concentration data for a series of test compounds. Finally, the newly identified organ model structures and parameters were implemented in the commercial modeling platform PK‐Sim and MoBi (http://www.systems-biology.com/products/pk-sim/).
METHODS
Literature search
In the first step, a systematic literature search was performed to identify the anatomic compartments of the testes and the thyroid gland that are most relevant for drug distribution into these organs in rats and humans. Once the organ model structure was set, available literature data for the respective anatomic and physiological parameters (i.e., volume of the organs, blood flow rate through the organs, volume fractions of vascular, interstitial, intracellular and luminal (in case of thyroid) space, and interstitial‐to‐cellular surface area) was included. Last, the physiological parameters required to calculate the tissue‐to‐plasma partition coefficients by the PK‐Sim standard method1, 2 and the method by Rodgers et al.3 and Rogers and Rowland4 were identified from the literature sources. The literature search was performed using PubMed and/or Google Scholar.
The acceptance rules for a particular parameter value were: (1) clear assignment of species, and (2) clear description of the method of analysis or source of the value. If more than one value was available in the literature for a specific parameter, the most reasonable one was chosen based on the following criteria: (1) for consistency, parameter values from identical references were preferred over parameters from different references; (2) if a particular parameter value was supported by more than one reference, this value was chosen over potential values from further references; (3) we preferentially chose parameter values that were determined using the most advanced measurement methods and experimental setup (e.g., blood flow rates should have been determined in unconscious animals); and (4) if there was no obvious preference for a particular reference, the mean of all literature values was used.
In case no information on a particular parameter value could be found in the literature, the respective value was determined based on cross‐species (i.e., the rat value was used for the human or vice versa) or cross‐organ scaling (i.e., the value of other organs was used for the testes or thyroid).
Selection of compounds for organ model development
Test compounds were chosen based on the following criteria: (1) availability of intense sampling data in rat plasma and tissue, as well as human plasma; (2) compound is given as an intravenous application in rats and humans; (3) passive diffusion is the main route of tissue penetration; and (4) diverse set of compounds with respect to electrostatic charges (to develop the organ models using partition coefficients calculated by the method of Rodgers et al.3 and Rodgers & Rowland4; for the testes only).
For testes, fentanyl, alfentanil, and thiopental, and for thyroid gland, omadacycline, amiodarone and its metabolite desethylamiodarone, and propylthiouracil were selected to be suitable as test compounds.
Workflow and organ model development approach
The development of the whole‐body PBPK model, including the testes and thyroid organ models, was done in a stepwise approach. An overview of the workflow is depicted in Figure 1.1, 2 Please note that, for the thyroid, the extrapolation from rat to human was not performed because there was no biological information on how to extrapolate the parameters of the binding kinetics of amiodarone/desethylamiodarone and propylthiouracil to the constituents of the thyroid gland.
Figure 1.
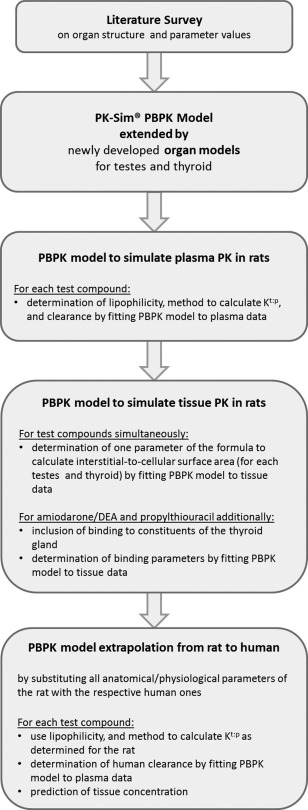
Workflow of the organ model development approach for testes and thyroid gland in rats and humans. A detailed description of the generic physiologically based pharmacokinetic (PBPK) model implemented in PK‐Sim can be found e.g., in ref. 1 and 2. Kt:p, tissue‐to‐plasma partition coefficient; PK, pharmacokinetic.
PBPK model development for the test compounds
Table 1, 1, 2, 3, 4,9, 10, 11, 12, 13, 14, 15 summarizes all processes and input parameters relevant for the PBPK models of the six test compounds. A more detailed description of the test compounds and the respective PBPK models can be found in the Supplementary Section SI.
Table 1.
Summary of the input parameters of the PBPK models of the six compounds used for the validation of the testes and thyroid organ models
| Fentanyl | Alfentanil | Thiopental | |
|---|---|---|---|
| Protein binding | Linear over the therapeutic concentration range | ||
| Fraction unbound, rat, % | 16.69 | 16.49 | 21.710 |
| Fraction unbound, human, % | 15.69 | 7.99 | 13.611,12 |
| Distribution | |||
| Partition coefficient model | Rodgers & Rowland3,4 | Rodgers & Rowland3,4 | PK‐Sim standard3,4 |
| pKa | 9.0, base3 | 6.5, weak base4 | |
| Lipophilicity | 2.59 | 1.79 | 1.97 |
| Cellular permeability model | PK‐Sim standard3,4 | PK‐Sim standard3,4 | PK‐Sim standard3,4 |
| Metabolism | Hepatic via CYP3A4 | Hepatic via CYP3A4 | Hepatic |
| Clearance, rat, mL/min/kg | 154.38 | 28.67 |
Saturable mechanism Vmax: 2.98 µmol/L/min KM: 0.39 µM |
| Clearance, human, mL/min/kg | 10.20 | 4.64 | 3.87 |
| Omadacycline | AMD | Propylthiouracil | |
| Protein binding | Linear over the therapeutic concentration range | ||
| Fraction unbound, % | 74.113 |
0.085 AMD14
0.085 DEAa |
43.015 |
| Distribution | |||
| Partition coefficient model | PK‐Sim standard3,4 | PK‐Sim standard3,4 | PK‐Sim standard3,4 |
| Lipophilicity | 2.42 |
5.29 AMD 6.33 DEA |
0.70 |
| Binding to constituents of the thyroidal colloid |
Interaction with ID‐1 KD = 14.3 nM AMD KD = 4.2 nM DEA |
Inhibition of TPO‐mediated iodination kon = 0.0041 L/min/µmol kel = 0.0018 min−1 |
|
| Cellular permeability model | PK‐Sim standard3,4 | PK‐Sim standard3,4 | PK‐Sim standard3,4 |
| Metabolism | Hepatic | Hepatic | |
| Intrinsic clearance, L/min |
12.92 AMD 146.85 DEA |
Saturable mechanism Vmax: 0.33 µmol/L/min KM: 3.4 µM |
|
| Excretion | |||
| GFR fractionb | 1 | ||
| Biliary clearance, mL/min/kg | 6.45 | ||
If no reference is given, the particular parameter value was determined by fitting the PBPK model to the observed data.
AMD, amiodarone; CYP, cytochrome P450; DEA, desethylamiodarone; GFR, glomerular filtration rate; ID‐1, type 1 iodothyronine deiodinase; KD, dissociation constant; KM, Michaelis‐Menten constant (substrate concentration at half‐maximum reaction rate); PBPK, physiologically based pharmacokinetic; TPO, thyroid peroxidase; Vmax, maximum reaction rate.
Assumed to be identical to the value observed for AMD.
Fraction of GFR used for passive renal elimination.
Software
The PBPK model was implemented using the software PK‐Sim and MoBi version 6.3.2. Parameter identifications were performed using the built‐in module (method: Monte‐Carlo with predefined settings).
RESULTS
Anatomic Compartments
The main constituent of the testes are the seminiferous tubules where spermatogenesis occurs.5, 6 The seminiferous tubules are located in the lobules of the testis and are surrounded by interstitial fluid and blood vessels. The interstitial fluid contains Leydig cells, which are responsible for the production of testosterone to regulate spermatogenesis. The blood vessels are surrounded by a layer of unfenestrated endothelial cells, which form a tight junction barrier as part of the blood‐testis barrier.5, 6 Figure 2 a shows a schematic representation of a cross section of three seminiferous tubules. In rodents, the outer membrane consists of a single layer of peritubular myeloid cells, whereas in primates, several layers surround the tubule.5, 6 The peritubular cells were shown to restrict the penetration of particular substances into the tubule of rodent testes and are thought to contribute to the blood‐testis barrier. The seminiferous epithelium is built of Sertoli cells. Specialized junctions between adjacent Sertoli cells form the main part of the blood‐testis barrier (also known as Sertoli cell barrier), which divides the epithelium into the basal and the adluminal compartment. Transport proteins involved in the blood‐testis barrier include transferrin, P‐glycoprotein (P‐gp), and multidrug resistance protein (MDR).5, 6
Figure 2.
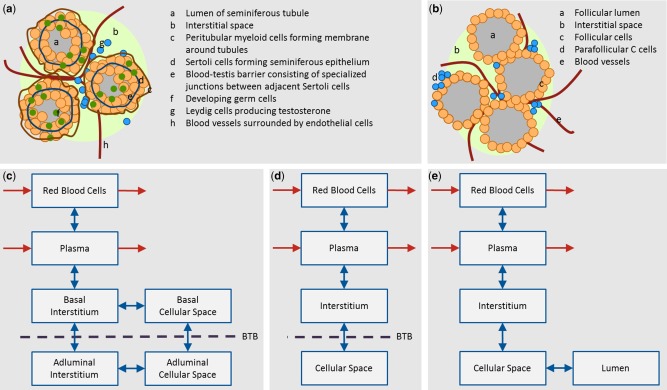
(a) Cross section of three seminiferous tubules of the testes. (b) Cross section of four follicles of the thyroid gland. (c, d, e) Proposed organ model structures in a generic whole body physiologically based pharmacokinetic model for testes and thyroid. Red arrows indicate the distribution of a drug into and out of the organ via the blood flow. Blue arrows indicate passive diffusion between the compartments of the organ. (c) Structure most closely representing the physiology of the testes by dividing the interstitial and cellular space into the basal and adluminal compartments. (d) Final lumped model structure assuming that the blood‐testis barrier (BTB) is located between the interstitial and cellular space – see text for details. (e) Structure representing the physiology of the thyroid gland.
The thyroid gland consists of two lobes that are connected by an isthmus. The lobes are composed of spherical follicles, which are the secretory units of the organ.7 Figure 2 b shows a schematic representation of a cross section of four follicles. Each follicle is surrounded by a single layer of follicular cells. The follicular lumen is filled with colloid, which contains thyroglobulin and other proteins that are required for the synthesis of thyroid hormones. It is noteworthy, that the luminal space can make up to 45% of the thyroid volume depending on the iodide supply and sex. The spaces between follicles are filled with interstitial fluid. Clusters of parafollicular C cells, which are responsible for the secretion of calcitonin, can be found there.7, 8
Generic organ model structure
From a PBPK modeling point of view, the testes divide into the following compartments relevant for drug distribution: vascular space (i.e., red blood cells and plasma), interstitial space, and cellular space. The blood‐testis barrier further divides the interstitial and cellular spaces into the basal and adluminal sides. Please note that this is only relevant for drugs that are prevented from entering or are actively transported out of the adluminal compartment. Figure 2 c shows a schematic representation of the six‐compartment organ structure of the testes. To our knowledge, there are no data available to specify the size of the basal or adluminal compartments on the one hand. On the other hand, when measuring drug concentration in the testes, one will not be able to distinguish the basal and adluminal compartments. Thus, we reduced the six‐compartment structure to four compartments in the following way: if we assume that (1) the cellular space is densely packed (i.e., drugs directly pass from the basal cellular space into the adluminal cellular space without re‐entering the interstitial space); and (2) the adluminal compartment is much larger in volume compared to the basal compartment (i.e., all cells belong to the adluminal compartment), we can lump together the basal and adluminal interstitial space to form the interstitial compartment as well as the basal and adluminal cellular space to form the cellular compartment. The blood‐testis barrier would now act between the interstitial and cellular spaces. The final four‐compartment organ structure of the testes is shown in Figure 2 d.
The thyroid gland divides into five compartments relevant for drug distribution: vascular space (i.e., red blood cells and plasma), interstitial space, cellular space, and luminal space (compare Figure 2 e). The follicular lumen is considered as a separate compartment as it takes up a considerable size of the thyroid gland and it is the major site of action of drugs interfering with thyroid activity.8
Parameterization
A summary of the anatomic and physiological parameters as well as parameters required for the calculation of tissue‐to‐plasma partition coefficients based on the PK‐Sim standard method1, 2 and the method by Rodgers et al.3 and Rodgers and Rowland4 are listed in Table 2.16, 17, 18, 19, 20, 21, 22, 23, 24, 25, 26, 27, 28, 29, 30, 31, 32, 33, 34, 35, 36, 37, 38, 39, 40
Table 2.
Anatomic and physiological parameters of the testes and thyroid gland in the standard rat and human and parameters required for the calculation of tissue‐to‐plasma partition coefficients for small molecule drugs
| Male rat (0.23 g) | Male human (73 kg) | |||||||
|---|---|---|---|---|---|---|---|---|
| Testes | Thyroid | Testes | Thyroid | |||||
| Volume, L | 0.002a | 18–24 | 1.14e‐5 | 23,24 | 0.035 | 25 | 0.02 | 25 |
| Specific blood flow rate, mL/min/100 g organ weight | 18.91 | 16,26 | 833.33 | 27 | 9.29 | 25 | 487.50 | 25 |
| Volume fraction of vascular space, % | 3.0 | 19 | 5.6 | 28 | 6.1l | 25 | 15.9l | 25 |
| Volume fraction of interstitial space, % | 6.2 | 29 | 10.0i | 6.2m | 8.9o | |||
| Volume fraction of cellular space, % | 90.8b | 60.0 | 30 | 87.7b | 53.5o | |||
| Volume fraction of luminal space, % | – | 24.4 | 30 | – | 21.7o | |||
| Surface area between interstitial and cellular space, cm2 | 1,970c | Fit | 20.65j | Fit | 16,854c | 36,193j | ||
| Partition coefficients based on PK‐Sim standard | ||||||||
| Total water, % of tissue volume | 86.0 | 31, 32 | 74.4 | 33 | 81.0 | 25 | 78.4 | 25 |
| Total lipid, % of tissue volume | 3.32 | 31 | 4.4d | 1.60 | 34 | 4.4 | 25 | |
| Protein % of tissue volume | 12.0d | 6.7 | 35 | 12.0 | 25 | 14.0 | 25 | |
| Partition coefficients based on Rodgers & Rowland3,4 | ||||||||
| Total water, % of tissue volume | 86.0 | 31,32 | 74.4 | 33 | 81.0 | 25 | 78.4 | 25 |
| Intracellular water, % of tissue volume | 82.88e | 56.4e | 78.06n | 59.4n | ||||
| Extracellular water, % of tissue volume | 3.12 | 36 | 18.0 | 36 | 2.94n | 19.0n | ||
| Total phospholipid, % of tissue volume | 1.42 | 31,32,34 | 0.34d | 0.90 | 34 | 0.34 | 37 | |
| Neutral phospholipid, % of tissue volume | 1.16 | 31 | 0.302k | 35 | 0.78 | 38 | 0.28 | 37 |
| Tissue concentration of acidic phospholipids, mg/g | 2.6 | 31 | 0.38k | 35 | 1.2 | 38 | 0.60 | 37 |
| Neutral lipid, % of tissue volume | 1.90f | 4.06f | 0.70f | 3.86f | ||||
| Tissue‐to‐plasma albumin ratio | 0.031g, h | 42 | 0.050g, h | 42 | 0.019g, h | 42 | 0.027g, h | 42 |
| Tissue‐to‐plasma lipoprotein ratio | 0.031g, h | 41 | 0.050g, h | 41 | 0.031g, h | 41 | 0.045g, h | 41 |
It is assumed that reported literature values refer to wet organ weights if not stated otherwise. Conversions from weight to volume and vice versa were based on a tissue density of 1 g/mL.
Mean of literature values.
Calculated as 100% minus the volume fractions of vascular and interstitial space.
Determined based on the formula2: , where p1 and p2 are scaling parameters. p2 was set to 2.5 as reported in ref. 2; and p1 was estimated using the rat tissue data, see Supplementary Section SII for details.
Human value.
Calculated as the difference between total and extracellular water.
Calculated as the difference between total lipid and total phospholipid.
Most frequent value of reported organs/value of carcass.
Conversion from interstitial‐to‐plasma (I2P) into tissue‐to‐plasma ratio by I2P times fractional volume of interstitial space
Calculated as the difference between volume fraction of stroma (interstitial space, connective tissue, and blood vessels)30 and volume fraction of follicular capillaries.28
Determined based on the formula: , where SAcell is the surface area of a single thyroidal cell, Ncells is the number of cells per g thyroid tissue, and OW is the thyroid organ weight. Malendowicz & Bednarek30 reported the number of cells to be 508.9 106 cells/g thyroid in male rats and the rat tissue data was used to estimate SAcell, see Supplementary Section SII for details.
Scaled so that neutral and acidic phospholipids sum up to 100% (in ref. 37 neutral and acidic phospholipids sum up to 97.7%, remaining part declared as “others”).
Conversion from % of total blood volume to % of organ weight based on total blood volume of 5.3 L.25
Rat value.
Total water divided according to ratio of intracellular to extracellular water in rats.
Fractions scaled to sum up to 100% minus the volume fraction of vascular space according to the ratios of volume fractions of interstitial to cellular to luminal space observed in rats.
A total of 70 parameters were collected from the literature in order to parameterize both organ models in rats and human. Twenty‐five of 34 and 27 of 36 parameters could be clearly identified based on literature information for testes and thyroid, respectively. The remaining parameters were determined based on cross‐species and cross‐organ scaling, and two parameters were determined by fitting the testes and thyroid organ model with experimental data.
Parameter values for volume and blood flow rate in rats and humans were readily available in the literature with an average coefficient of variation of about 25–30%. For testes, no parameter value could be found for the volume fraction of interstitial space in humans. Here, the rat value was used. Similarly, the rat value was used for the ratio of extracellular to intracellular water in humans, and the human value was used for the volume fraction of proteins in rats. For the thyroid, the ratios of volume fractions of interstitial, cellular, and luminal spaces, as well as the ratio of extracellular to intracellular water were taken from the rat, whereas the human values were used for the volume fractions of total lipids and total phospholipids in rats.
The albumin and lipoprotein tissue‐to‐plasma ratios have not been determined in the testes and thyroid glands. Here, we used the most frequent value reported for other organs,41, 42 which also corresponds to the value of their carcass compartment.
The interstitial‐to‐cellular surface area was estimated to be 1,970 cm2 (95% confidence interval ranging from 761–3,130 cm2) in rat testes and 20.65 cm2 (95% confidence interval ranging from 4.24–37.13 cm2) in rat thyroid by simultaneously fitting the PBPK models of the test compounds to the observed tissue concentration data. Extrapolation to humans yielded a surface area of 16,854 cm2 in the testes and 36,193 cm2 in the thyroid (see Supplementary Section SII for details). For the thyroid, we assumed that the cellular‐to‐lumen surface area is identical to the interstitial‐to‐cellular surface area due to the even arrangement in a single layer of densely packed cuboidal cells in the follicle.7
Due to the lack of a generally accepted a priori method to determine the distribution of a drug into the constituents of the colloid in the follicular lumen of the thyroid gland, we assumed that the lumen‐to‐plasma partition coefficient is identical to the intracellular‐to‐plasma partition coefficient.
In the whole‐body PBPK model implemented in PK‐Sim,2 all organ masses sum up to the body weight. The mass gain due to the introduction of an additional organ was corrected by evenly subtracting mass from the two largest organs with respect to volume (i.e., adipose tissue and muscle). In PK‐Sim, the cardiac output is defined as the blood flow rate of the lungs, which is the sum of the organ blood flows entering the lungs. Organ blood flow rates are implemented as specific blood flow rates per organ weight. When reducing the size of adipose and muscle tissue, this in turn leads to a decrease, whereas the introduction of the testes and thyroid compartment leads to an increase of blood flow entering the lungs. Overall, the cardiac output is only marginally changed (0.05% for rats and 1.60% for humans) due to the introduction of the testes and thyroid glands.
Development of the testes organ model in rats
Figure 3 39, 43 (left) shows the simulated and observed plasma concentration of fentanyl, alfentanil, and thiopental in the rat. For all three drugs, the PBPK model describes very well the experimental data. Figure 3 39, 43 (right) shows the modeling results for testes tissue. For fentanyl and alfentanil, the model describes very well the observed data demonstrating that the anatomic and physiological parameterization of the testes, in combination with the parameters required for the calculation of the tissue‐to‐plasma partition coefficient, is reasonable. For thiopental, the model tends to overestimate the observed tissue concentration in an acceptable range by a factor of no more than two.
Figure 3.
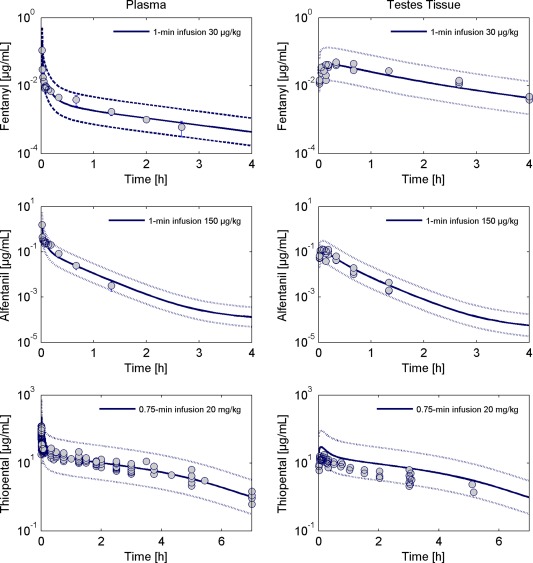
Observed and simulated total concentration of fentanyl (top), alfentanil (middle), and thiopental (bottom) in plasma (left) and testes tissue (right) in rats. The simulated tissue concentration corresponds to the volume‐weighted sum of the interstitial and intracellular concentrations. Circles represent individual or mean ± SD of observed data extracted from literature.39, 43 The solid lines are the model simulations and the dotted lines margin the 95% predictive check interval resulting from the measurement error.
The ratio between drug exposure in testes tissue and plasma is the highest for fentanyl, which is also reflected by the higher value of the intracellular‐to‐plasma partition coefficient for fentanyl (Kic:p = 6.81) compared to alfentanil (Kic:p = 0.39) and thiopental (Kic:p = 0.93).
Extrapolation to humans
Extrapolation from rats to humans was done by substituting the respective anatomic and physiological data of rats with the human values while the organ model structure was kept. Figure 4 11, 12, 39, 40 (left) shows that the extrapolated model describes very well the plasma pharmacokinetics of fentanyl, alfentanil, and thiopental in humans. The predicted tissue concentration in testes is shown in Figure 4 11, 12, 39, 40 (right). In accordance with the observation in rats, fentanyl shows a higher ratio of drug exposure in testes tissue and plasma compared to alfentanil and thiopental. For all three compounds, the intracellular‐to‐plasma partition coefficients in humans are predicted to be a factor of two to three lower than the values in rats (fentanyl Kic:p = 2.74, alfentanil Kic:p = 0.13, and thiopental Kic:p = 0.35) suggesting that, overall, the drug exposure in testes tissue is less pronounced in humans compared with rats. Looking at the physiological parameters relevant for the calculation of the intracellular‐to‐plasma partition coefficients, the fractional volume of total lipid content is about a factor two lower in humans compared with rats. Thus, the volume fractions of neutral and acidic phospholipids and neutral lipids are lower as well, whereas all other parameters (e.g., water and protein content) are in a comparable range between rats and humans. Thus, the differences in lipid composition result in the differently predicted values for the intracellular‐to‐plasma partition coefficients in rats and humans.
Figure 4.
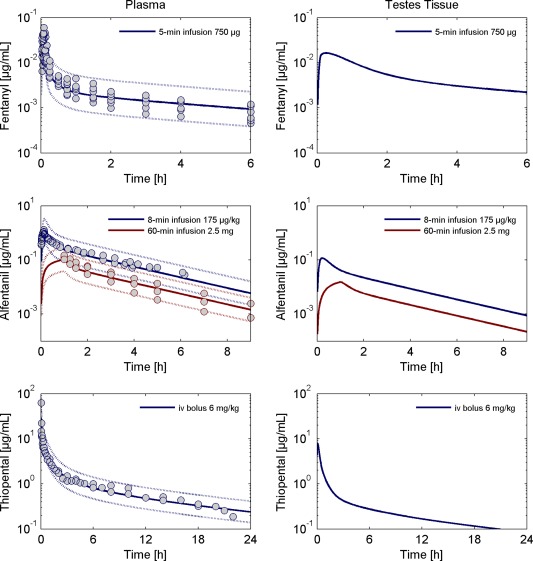
Left: Observed and simulated total concentration of fentanyl (top), alfentanil (middle), and thiopental (bottom) in plasma in humans. Circles represent individual or mean ± SD of observed data extracted from literature.11, 12, 39, 40 The solid lines are the model simulations and the dotted lines margin the 95% predictive check interval resulting from the measurement error. Right: Predictions of the testes tissue concentration for the standard human. The predicted tissue concentration corresponds to the volume‐weighted sum of the interstitial and intracellular concentrations.
Development of the thyroid organ model
Figure 5 13, 44, 45 (left) shows the simulated and observed concentrations of omadacycline, amiodarone and its metabolite, and propylthiouracil in plasma of rats. For all test compounds, the plasma pharmacokinetics is well described by the PBPK model.
Figure 5.
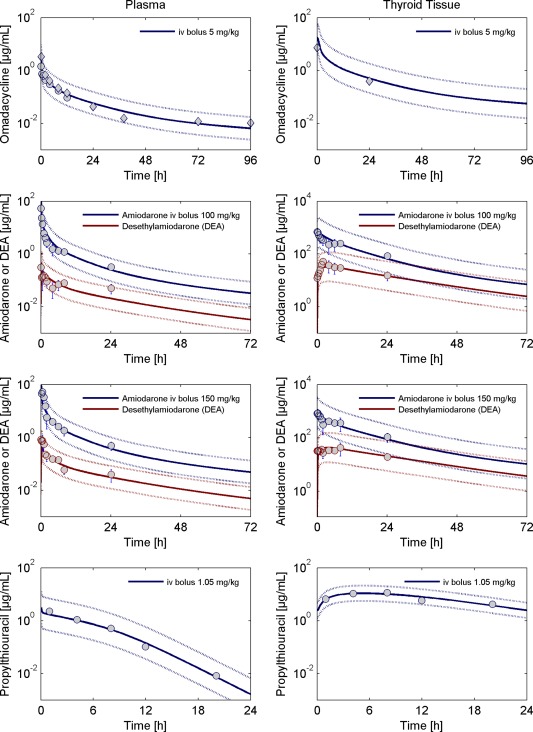
Left: Observed and simulated total concentration of omadacycline (top), amiodarone and desethylamiodarone (middle), and propylthiouracil (bottom) in plasma in rats. Right: Observed and simulated concentration time profiles in thyroid tissue of rats. The simulated tissue concentration corresponds to the volume‐weighted sum of the interstitial, intracellular, and luminal concentrations. Circles represent individual or mean ± SD of observed data extracted from literature.13, 44, 45 For omadacycline, diamonds represent the concentration of total radioactivity (as omadacycline does not undergo metabolism, the total radioactivity is assumed to reflect the concentration of the parent drug). The solid lines are the model simulations and the dotted lines margin the 95% predictive check interval resulting from the measurement error.
After establishing the PBPK models describing the plasma concentration of all test compounds, model development for the thyroid gland was done in a stepwise approach. First, the PBPK model for omadacycline was developed because, to our knowledge, there are no active processes involved in the distribution of omadacycline into the compartments of the thyroid gland. In ref. 13, measurements of omadacycline in the thyroid gland are based on total radioactivity. As omadacycline does not undergo metabolism, the total radioactivity is assumed to reflect the concentration of the parent drug. This is supported by the similar levels of plasma measurements based on concentration data and total radioactivity (compare Figure 5).13, 44, 45
Second, the PBPK model for amiodarone and its metabolite desethylamiodarone (DEA) was developed. Using the passive diffusion model of drug influx into and the efflux out of the thyroid compartments demonstrated that the initial distribution phase is driven by passive diffusion, whereas the terminal phase is influenced by some kind of trapping mechanism. Amiodarone and DEA are known to interfere with the action of thyroid hormones by several mechanisms, including the inhibition of type 1 iodothyronine deiodinase in the follicular lumen of the thyroid gland.46 Thus, we incorporated a hypothetical reversible binding of amiodarone and DEA to the iodothyronine deiodinase.
In a simultaneous model fit, we determined the parameters of amiodarone and DEA binding, as well as together with the omadacycline data, the interstitial‐to‐cellular/cellular‐to‐lumen surface area. The surface area was estimated to be 20.63 cm2 (95% confidence interval ranging from 4.24–37.13 cm2). Figure 5 13, 44, 45 shows that our model simulations correspond well with the experimental thyroid tissue concentration data for omadacycline, amiodarone, and DEA.
In the last step, we developed the model for propylthiouracil (PTU), which is known to significantly accumulate in the thyroid gland. PTU inhibits the synthesis of thyroid hormones by irreversibly inhibiting the thyroid peroxidase‐mediated iodination of tyrosine residues in thyroglobulin in the follicular lumen. This process leads to the formation of an inactive form of PTU.8 In our model, we included the irreversible formation of inactive PTU in addition to a slow elimination of the inactive form. As shown in Figure 5,13, 44, 45 this results in a very good description of the observed thyroid tissue concentration data.
DISCUSSION
The presented PBPK modeling approach based on a sound review of the literature provides generic organ model structures and parameterizations of the testes and the thyroid gland in rats and humans. In addition, parameters required for the calculation of partition coefficients, based on the PK‐Sim standard method1, 2 and the method by Rodgers et al.3 and Rodgers and Rowland,4 were collected in order to provide a generic PBPK modeling framework. The presented models can be applied to the prediction of tissue pharmacokinetics of further compounds of interest.
The testes and thyroid organ models were developed using a series of test compounds that preferentially enter the testes or thyroid tissue by passive diffusion. The limiting factor in the selection of test compounds, however, was the availability of densely sampled tissue concentration data in literature. For testes, we identified a total of three compounds, alfentanil, fentanyl, and thiopental that fulfilled our criteria to be accepted as candidates for model development.
For the thyroid, typically, tissue concentration data was only available for compounds with the site of a desired (like propylthiouracil) or undesired (like amiodarone) action in the thyroid gland; therefore, these compounds accumulate in the thyroid tissue by drug‐specific processes. As the only compound with available tissue concentration data, omadacycline enters the thyroid gland by passive diffusion only. Therefore, we used omadacycline to demonstrate that the generic organ model structure and parameterization of the thyroid gland yielded a good description of the thyroid tissue concentration.
To describe the thyroidal drug accumulation in our PBPK model, we incorporated an irreversible binding of propylthiouracil and a reversible binding of amiodarone to the constituents of the follicular colloid according to their respective mechanism of action. However, these processes are unique to the drugs under consideration and cannot be applied 1:1 with other drugs. When applying the thyroid organ model to other compounds, it is critical to evaluate if interactions with thyroid‐specific tissue constituents are to be expected. This is particularly relevant when looking at compounds that are known to interfere with the activity of the thyroid gland (e.g., by inhibiting the synthesis of thyroid hormones or the maintenance of calcium homeostasis). It is noteworthy that the presented thyroid organ model can be applied to identify the existence of such processes if it is not known for a particular drug.
For humans, there was no reference reporting tissue concentration data for testes or thyroid so that it was not possible to compare our model predictions to observed data. Extrapolation of the modeling approach from rats to humans, therefore, relies on the well‐reviewed literature database of the anatomic and physiological parameters. Importantly, the simulations of tissue concentration in rats are in very close agreement with the experimental data. Therefore, one can argue that the predications of tissue levels in the testes and thyroid gland in humans are expected to be within a reasonable range of the real data.
About three‐fourths of all parameters required to parameterize the testes and thyroid organ models could be clearly identified from literature references. Among them there were typically more than two references for organ volumes and blood flow rates with an average coefficient of variation of about 25–30%. The most variable parameter was the blood flow rate through the testes and thyroid in humans. For parameters not available in literature, we provided reasonable assumptions to replace the missing value (e.g., by cross‐species scaling; i.e., the rat value was used for the human one and vice versa). As the only organ‐specific parameter, the interstitial‐to‐cellular/cellular‐to‐lumen surface areas were estimated using our compound database. To identify the impact of variability/uncertainty in the model parameters, we performed a sensitivity analysis exemplary for the prediction of the testes tissue concentration. We found that the tissue‐to‐plasma partition coefficient is the parameter with the highest uncertainty and the strongest impact on the tissue pharmacokinetics. As expected, changes in the blood flow rate as well as the interstitial‐to‐cellular surface area (SA) yielded a proportional change in maximum tissue concentration (tCmax), whereas the impact on tissue area under the curve (tAUC) was negligible for the drugs under consideration (see Supplementary Section SIII). The impact of changes in SA on tCmax and tAUC will become more pronounced for drugs with a lower permeability.
For the thyroid gland, the organ volume as well as the size of the luminal space is varied between sexes and dependent on the iodine supply. Female rats are reported to have a larger organ volume relative to the body weight, and the volume fraction of the luminal space in female rats is about twice the size of the lumen in male animals. This is a result of the different supply by sex hormones and starts to develop during puberty.30 In humans, it is shown that iodine insufficiency leads to a significant increase in the volume of the thyroid gland together with a reduction in the size of the follicular lumen.7, 25 These changes need to be considered when applying the thyroid organ model to PBPK models of female subjects or populations with suspected iodine insufficiency.
Due to the lack of a generally accepted a priori method to determine the distribution of a drug into the constituents of the colloid in the follicular lumen of the thyroid gland, we assumed that the lumen‐to‐plasma partition coefficient is identical to the intracellular‐to‐plasma partition coefficient. This can also be regarded as lumping together the cellular and luminal spaces of the thyroid gland to form a single compartment for drug distribution. As demonstrated for omadacycline, this is a reasonable assumption for compounds that do not show a particularly high affinity for any of the constituents of the follicular colloid. In other cases, additional active processes need to be considered in the model.
Overall, the presented organ model structures and parameterizations for testes and thyroid adequately described the tissue pharmacokinetics of a series of test compounds. The sound database of anatomic and physiological data renders it possible to use the organ models in a generic framework to predict the levels of tissue concentration in rats and humans for passively diffusing drugs.
Supporting information
Supporting Information
Supporting Information
Conflict of Interest/Disclosure
S.P., T.G., M.B., and L.G. are employees of Bayer AG.
Author Contributions
S.P. wrote the manuscript. S.P., L.G., and M.B. designed the research. S.P. and T.G. performed the research. S.P. and T.G. analyzed the data.
References
- 1. Willmann, S. , Lippert, J. & Schmitt, W. From physicochemistry to absorption and distribution: predictive mechanistic modelling and computational tools. Expert Opin. Drug Metab. Toxicol. 1, 159–168 (2005). [DOI] [PubMed] [Google Scholar]
- 2. Willmann, S. , Lippert, J. , Sevestre, M. , Solodenko, J. , Fois, F. & Schmitt, W. PK‐sim®: a physiologically based pharmacokinetic ‘whole‐body’ model. Biosilico 1, 121–124 (2003). [Google Scholar]
- 3. Rodgers, T. , Leahy, D. & Rowland, M. Physiologically based pharmacokinetic modeling 1: predicting the tissue distribution of moderate‐to‐strong bases. J. Pharm. Sci. 94, 1259–1276 (2005). [DOI] [PubMed] [Google Scholar]
- 4. Rodgers, T. & Rowland, M. Physiologically based pharmacokinetic modelling 2: predicting the tissue distribution of acids, very weak bases, neutrals and zwitterions. J. Pharm. Sci. 95, 1238–1257 (2006). [DOI] [PubMed] [Google Scholar]
- 5. Cheng, C.Y. & Mruk, D.D. The blood‐testis barrier and its implications for male contraception. Pharmacol. Rev. 64, 16–64 (2012). [DOI] [PMC free article] [PubMed] [Google Scholar]
- 6. Setchell, B.P. Blood‐testis barrier, junctional and transport proteins and spermatogenesis pp 212–233. In: Molecular Mechanisms in Spermatogenesis (Springer, New York, NY, 2009). [DOI] [PubMed] [Google Scholar]
- 7. Dumont, J. , Christophe, D. , Vassart, G. , Roger, P. & Maenhaut, C. Ontogeny, Anatomy, Metabolism and Physiology of the Thyroid (MDText.com, Inc, South Dartmouth, MA, 2011). [Google Scholar]
- 8. Manna, D. , Roy, G. & Mugesh, G. Antithyroid drugs and their analogues: synthesis, structure, and mechanism of action. Acc. Chem. Res. 46, 2706–2715 (2013). [DOI] [PubMed] [Google Scholar]
- 9. Meuldermans, W.E. , Hurkmans, R.M. & Heykants, J.J. Plasma protein binding and distribution of fentanyl, sufentanil, alfentanil and lofentanil in blood. Arch. Int. Pharmacodyn. Ther. 257, 4–19 (1982). [PubMed] [Google Scholar]
- 10. Igari, Y. , Sugiyama, Y. , Awazu, S. & Hanano, M. Comparative physiologically based pharmacokinetics of hexobarbital, phenobarbital, and thiopental in the rat. J. Pharmacokinet. Biopharm. 10, 53–75 (1982). [DOI] [PubMed] [Google Scholar]
- 11. Sorbo, S. , Hudson, R.J. & Loomis, J.C. The pharmacokinetics of thiopental in pediatric surgical patients. Anesthesiology 61, 666–670 (1984). [DOI] [PubMed] [Google Scholar]
- 12. Burch, P.G. & Stanski, D.R. The role of metabolism and protein binding in thiopental anesthesia. Anesthesiology 58, 146–152 (1983). [DOI] [PubMed] [Google Scholar]
- 13. Lin, W. et al Pharmacokinetics, distribution, metabolism, and excretion of omadacycline following a single intravenous or oral dose of 14C‐omadacycline in rats. Antimicrob. Agents Chemother. 61, e01784–16 (2016). [DOI] [PMC free article] [PubMed] [Google Scholar]
- 14. Shayeganpour, A. , Jun, A.S. & Brocks, D.R. Pharmacokinetics of amiodarone in hyperlipidemic and simulated high fat‐meal rat models. Biopharm. Drug Dispos. 26, 249–257 (2005). [DOI] [PubMed] [Google Scholar]
- 15. Sitar, D.S. & Thornhill, D.P. Propylthiouracil: absorption, metabolism and excretion in the albino rat. J. Pharmacol. Exp. Ther. 183, 440–448 (1972). [PubMed] [Google Scholar]
- 16. Nishiyama, K. , Nishiyama, A. & Frohlich, E.D. Regional blood flow in normotensive and spontaneously hypertensive rats. Am. J. Physiol. 230, 691–698 (1976). [DOI] [PubMed] [Google Scholar]
- 17. Atanassova, N. et al Comparative effects of neonatal exposure of male rats to potent and weak (environmental) estrogens on spermatogenesis at puberty and the relationship to adult testis size and fertility: evidence for stimulatory effects of low estrogen levels. Endocrinology 141, 3898–3907 (2000). [DOI] [PubMed] [Google Scholar]
- 18. Mylchreest, E. , Wallace, D.G. , Cattley, R.C. & Foster, P.M. Dose‐dependent alterations in androgen‐regulated male reproductive development in rats exposed to Di(n‐butyl) phthalate during late gestation. Toxicol. Sci. 55, 143–151 (2000). [DOI] [PubMed] [Google Scholar]
- 19. Campbell, A. Development of PBPK model of molinate and molinate sulfoxide in rats and humans. Regul. Toxicol. Pharmacol. 53, 195–204 (2009). [DOI] [PMC free article] [PubMed] [Google Scholar]
- 20. Akingbemi, B.T. , Sottas, C.M. , Koulova, A.I. , Klinefelter, G.R. & Hardy, M.P. Inhibition of testicular steroidogenesis by the xenoestrogen bisphenol A is associated with reduced pituitary luteinizing hormone secretion and decreased steroidogenic enzyme gene expression in rat Leydig cells. Endocrinology 145, 592–603 (2004). [DOI] [PubMed] [Google Scholar]
- 21. Stott, W.T. , Dryzga, M.D. & Ramsey, J.C. Blood‐flow distribution in the mouse. J. Appl. Toxicol. 3, 310–312 (1983). [DOI] [PubMed] [Google Scholar]
- 22. Saypol, D.C. , Howards, S.S. , Turner, T.T. & Miller E.D. Jr. Influence of surgically induced varicocele on testicular blood flow, temperature, and histology in adult rats and dogs. J. Clin. Invest. 68, 39–45 (1981). [DOI] [PMC free article] [PubMed] [Google Scholar]
- 23. Brown, R.P. , Delp, M.D. , Lindstedt, S.L. , Rhomberg, L.R. & Beliles, R.P. Physiological parameter values for physiologically based pharmacokinetic models. Toxicol. Ind. Health 13, 407–484 (1997). [DOI] [PubMed] [Google Scholar]
- 24. Kapitola, J. , Schüllerová, M. & Schreiberová, O. Blood flow and radioiodine uptake in the thyroid gland of rats after administration and discontinuation of methylthiouracil. Acta Endocrinol. (Copenh). 65, 435–441 (1970). [DOI] [PubMed] [Google Scholar]
- 25.[No authors listed]. Basic anatomical and physiological data for use in radiological protection: reference values. A report of age‐ and gender‐related differences in the anatomical and physioloical characteristics of reference individuals. ICRP publication 89. Ann. ICRP 32, 5–265 (2002). [PubMed] [Google Scholar]
- 26. Tsuchiya, M. , Ferrone, R.A. , Walsh, G.M. & Frohlich, E.D. Regional blood flows measured in conscious rats by combined Fick and microsphere methods. Am. J. Physiol. 235, H357–H360 (1978). [DOI] [PubMed] [Google Scholar]
- 27. Delp, M.D. , Evans, M.V. & Duan, C. Effects of aging on cardiac output, regional blood flow, and body composition in Fischer‐344 rats. J. Appl. Physiol. (1985) 85, 1813–1822 (1998). [DOI] [PubMed] [Google Scholar]
- 28. Colin, I.M. et al Expression of nitric oxide synthase isoforms in the thyroid gland: evidence for a role of nitric oxide in vascular control during goiter formation. Endocrinology 136, 5283–5290 (1995). [DOI] [PubMed] [Google Scholar]
- 29. Widmark, A. , Damber, J.E. & Bergh, A. Relationship between human chorionic gonadotrophin‐induced changes in testicular microcirculation and the formation of testicular interstitial fluid. J. Endocrinol. 109, 419–425 (1986). [DOI] [PubMed] [Google Scholar]
- 30. Malendowicz, L.K. & Bednarek, J. Sex dimorphism in the thyroid gland. IV. Cytologic aspects of sex dimorphism in the rat thyroid gland. Acta Anat. (Basel) 127, 115–118 (1986). [DOI] [PubMed] [Google Scholar]
- 31. Rodgers, T. , Jones, H.M. & Rowland, M. Tissue lipids and drug distribution: dog versus rat. J. Pharm. Sci. 101, 4615–4626 (2012). [DOI] [PubMed] [Google Scholar]
- 32. Rodgers, T. , Leahy, D. & Rowland, M. Tissue distribution of basic drugs: accounting for enantiomeric, compound and regional differences amongst beta‐blocking drugs in rat. J. Pharm. Sci. 94, 1237–1248 (2005). [DOI] [PubMed] [Google Scholar]
- 33. Pretell, E.A. , DeGroot, L.J. & Vickery, A.L. Albumin penetration into the rat thyroid gland: thyroid gland compartments and in vivo metabolism of chromated and iodinated albumin. Endocrinology 82, 1103–1116 (1968). [DOI] [PubMed] [Google Scholar]
- 34. Bieri, J.G. & Prival, E.L. Lipid composition of testes from various species. Comp. Biochem. Physiol. 15, 275–282 (1965). [DOI] [PubMed] [Google Scholar]
- 35. Macchia, V. , Meldolesi, M.F. & Chiariello, M. Adenyl‐cyclase in a transplantable thyroid tumor: loss of ability to respond to TSH. Endocrinology 90, 1483–1491 (1972). [DOI] [PubMed] [Google Scholar]
- 36. Pierson, R.N. Jr, Price, D.C. , Wang, J. & Jain, R.K. Extracellular water measurements: organ tracer kinetics of bromide and sucrose in rats and man. Am. J. Physiol. 235, F254–F264 (1978). [DOI] [PubMed] [Google Scholar]
- 37. Levis, G.M. , Karli, J.N. & Malamos, B. The phospholipids of the thyroid gland. Clin. Chim. Acta. 41, 335–345 (1972). [DOI] [PubMed] [Google Scholar]
- 38. Diagne, A. , Fauvel, J. , Record, M. , Chap, H. & Douste‐Blazy, L. Studies on ether phospholipids. II. Comparative composition of various tissues from human, rat and guinea pig. Biochim. Biophys. Acta. 793, 221–231 (1984). [DOI] [PubMed] [Google Scholar]
- 39. Björkman, S. , Wada, D.R. , Stanski, D.R. & Ebling, W.F. Comparative physiological pharmacokinetics of fentanyl and alfentanil in rats and humans based on parametric single‐tissue models. J. Pharmacokinet. Biopharm. 22, 381–410 (1994). [DOI] [PubMed] [Google Scholar]
- 40. Meuldermans, W. et al Alfentanil pharmacokinetics and metabolism in humans. Anesthesiology 69, 527–534 (1988). [DOI] [PubMed] [Google Scholar]
- 41. Kawai, R. , Lemaire, M. , Steimer, J.L. , Bruelisauer, A. , Niederberger, W. & Rowland, M. Physiologically based pharmacokinetic study on a cyclosporin derivative, SDZ IMM 125. J. Pharmacokinet. Biopharm. 22, 327–365 (1994). [DOI] [PubMed] [Google Scholar]
- 42. Tsuji, A. , Nishide, K. , Minami, H. , Nakashima, E. , Terasaki, T. & Yamana, T. Physiologically based pharmacokinetic model for cefazolin in rabbits and its preliminary extrapolation to man. Drug Metab. Dispos. 13, 729–739 (1985). [PubMed] [Google Scholar]
- 43. Ebling, W.F. , Wada, D.R. & Stanski, D.R. From piecewise to full physiologic pharmacokinetic modeling: applied to thiopental disposition in the rat. J. Pharmacokinet. Biopharm. 22, 259–292 (1994). [DOI] [PubMed] [Google Scholar]
- 44. Plomp, T.A. , Wiersinga, W.M. , van Rossum, J.M. & Maes, R.A. Pharmacokinetics and body distribution of amiodarone and desethylamiodarone in rats after intravenous administration. In Vivo 3, 33–47 (1989). [PubMed] [Google Scholar]
- 45. Marchant, B. , Alexander, W.D. , Robertson, J.W. & Lazarus, J.H. Concentration of 35S‐propylthiouracil by the thyroid gland and its relationship to anion trapping mechanism. Metabolism 20, 989–999 (1971). [DOI] [PubMed] [Google Scholar]
- 46. Basaria, S. & Cooper, D.S. Amiodarone and the thyroid. Am. J. Med. 118, 706–714 (2005). [DOI] [PubMed] [Google Scholar]
Associated Data
This section collects any data citations, data availability statements, or supplementary materials included in this article.
Supplementary Materials
Supporting Information
Supporting Information