

Abstract
Purpose
To evaluate if cardiac magnetic resonance elastography (MRE) can measure increased stiffness in patients with cardiac amyloidosis. Myocardial tissue stiffness plays an important role in cardiac function. A noninvasive quantitative imaging technique capable of measuring myocardial stiffness could aid in disease diagnosis, therapy monitoring, and disease prognostic strategies. We recently developed a high‐frequency cardiac MRE technique capable of making noninvasive stiffness measurements.
Materials and Methods
In all, 16 volunteers and 22 patients with cardiac amyloidosis were enrolled in this study after Institutional Review Board approval and obtaining formal written consent. All subjects were imaged head‐first in the supine position in a 1.5T closed‐bore MR imager. 3D MRE was performed using 5 mm isotropic resolution oblique short‐axis slices and a vibration frequency of 140 Hz to obtain global quantitative in vivo left ventricular stiffness measurements. The median stiffness was compared between the two cohorts. An octahedral shear strain signal‐to‐noise ratio (OSS‐SNR) threshold of 1.17 was used to exclude exams with insufficient motion amplitude.
Results
Five volunteers and six patients had to be excluded from the study because they fell below the 1.17 OSS‐SNR threshold. The myocardial stiffness of cardiac amyloid patients (median: 11.4 kPa, min: 9.2, max: 15.7) was significantly higher (P = 0.0008) than normal controls (median: 8.2 kPa, min: 7.2, max: 11.8).
Conclusion
This study demonstrates the feasibility of 3D high‐frequency cardiac MRE as a contrast‐agent‐free diagnostic imaging technique for cardiac amyloidosis.
Level of Evidence: 2
Technical Efficacy: Stage 2
J. Magn. Reson. Imaging 2017;46:1361–1367.
Keywords: magnetic resonance elastography, myocardial stiffness, quantitative stiffness imaging, #cardiac amyloidosis, #cardiac MRE
Myocardial stiffness plays an important role in cardiac function. Increased stiffness in the myocardium can cause poor function and restrictive diastolic filling, which can lead to heart failure symptoms, even with a normal left ventricular (LV) ejection fraction.1 Myocardial infarcts can cause abnormal tissue stiffness that can affect LV wall stress and the pattern of LV remodeling.2 However, there is currently no conventional imaging technique for directly measuring myocardial stiffness in vivo. In vivo myocardial stiffness may be inferred from pressure–volume relationships, which are invasive and rarely performed in clinical practice.3 Noninvasive strain imaging, performed with either ultrasound4 or magnetic resonance imaging (MRI),5 measures tissue displacements throughout the cardiac cycle, which in actively contracting myocardium is a measure of tissue contraction, and not stiffness.6, 7
Shear wave elastography is an emerging imaging approach for measuring myocardial stiffness in vivo.8, 9, 10, 11, 12, 13, 14, 15 Shear wave elastography approaches rely on an external vibrating source to generate shear waves inside a tissue of interest. An imaging technique (either MRI or ultrasound) then measures the vibrational displacements in the tissue.8, 9, 10, 11, 12, 13, 14, 15 The displacement field is used to calculate a stiffness map through one of several mathematical techniques collectively referred to as inversion algorithms.16
Currently, a 3D high‐frequency cardiac MR elastography (MRE) technique is being developed, which has shown a high level of concordance with dynamic material testing17 and has been shown to be feasible in normal volunteers.18
Cardiac amyloidosis leads to myocardial stiffness, where stiffness is inferred from existing ex vivo and in vivo techniques,19, 20, 21, 22, 23 and therefore this patient group is an excellent cohort to validate whether or not 3D cardiac MRE can detect changes in stiffness in a patient population. Amyloid fibrils have been shown to have increased stiffness when using dynamic testing with 4D electron microscopy.19 Amyloid infiltrated explanted human myocardial trabecula have increased stiffness by length–tension relationships.24 Patients with cardiac amyloid have increased LV diastolic pressures with decreased LV volumes, indicating increased global myocardial stiffness.20, 21 At autopsy, amyloid infiltrative hearts are described as firm, waxy, and rubbery.25 For these reasons, cardiac amyloidosis has been referred to as the “stiff heart syndrome.”22, 23 This patient population is ideal for accessing and validating in vivo cardiac MRE stiffness measurements.
Therefore, the objective of this study was to evaluate if 3D high‐frequency cardiac MRE can measure increased stiffness in patients with cardiac amyloidosis as compared with healthy volunteers.
Materials and Methods
Study Population
Twenty‐two patients with cardiac amyloidosis and 16 healthy volunteers were enrolled in this study after approval by our Institutional Review Board and written informed consent was received from each subject. All subjects underwent cardiac MRI/MRE and echocardiography with speckle tracking strain imaging Doppler evaluation of diastolic function.
Patients with tissue diagnosis of amyloidosis and LV maximal wall thickness of greater than 12 mm by echocardiography were classified as having cardiac amyloidosis.26 Thirteen of the 22 patients had right ventricular (RV) biopsy confirmed cardiac amyloidosis. In the remaining nine patients, tissue was obtained from fat aspirate, muscle, kidney, and/or bone marrow.
Healthy volunteers had no history of coronary artery disease, heart failure, hypertension, hypertensive medication, valvular heart disease, congenital heart disease, or diabetes. The healthy volunteers had no symptoms of chest pain or shortness of breath, and exhibited normal heart sounds, normal breath sounds, had a systolic blood pressure of less than 140 mmHg, and a diastolic blood pressure of less than 90 mmHg. Healthy volunteers were selected to fall within the same age range (50–85 years old) and have a similar male‐to‐female ratio as the amyloidosis patients.
All subjects were excluded if they had any contraindications or relative contraindications to MRI scanning.
MRE
MRI/MRE: Acquisition
Cardiac MRE was used to quantitatively measure myocardial stiffness across the LV of each subject. The experimental setup is shown in Fig. 1. An active driver, outside of the scan room, generated acoustic vibrations that were transmitted through acoustic tubing to a passive driver in contact with the subject. The passive driver surface was coated with acoustic gel and placed in direct contact with the subject's skin, just to the left of the sternum and superior to the xiphoid process. An elastic tension strap was used to keep the passive driver in place and to help improve coupling between the passive driver diaphragm and the volunteer's skin surface. To help avoid signal interference from shear wave vibrations, cardiac gating was performed by placing electrocardiography leads on the back of the left shoulder of each subject instead of on the chest.
Figure 1.
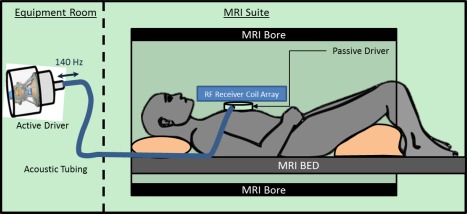
Cardiac MRE experimental setup. An active driver delivers 140 Hz vibrations through acoustic tubing to a passive cardiac driver that is strapped to the subject's chest. Shear waves are transmitted into the myocardium and the wave displacement field is imaged with the MRI.
Imaging was performed with a 1.5T closed‐bore MR imager (Optima MR450W; GE Healthcare, Milwaukee, WI) in an oblique orientation to obtain short‐axis MRE images of the heart using the built‐in, receive‐only, integrated whole‐body phased array system (GEM anterior–posterior array, GE Healthcare). Imaging was conducted using the same procedure as previously described.18 Only a vibration frequency of 140 Hz was used; however, the previous study demonstrated that it gave the highest median octahedral shear strain signal‐to‐noise ratio (OSS‐SNR) across the LV volume in healthy volunteers when compared with frequencies of 80 Hz, 100 Hz, 180 Hz, and 220 Hz. Briefly, a flow‐compensated, cardiac‐gated, spin‐echo, single‐shot echo planar imaging MRE sequence was used with TR matched to each volunteer's heart rate with electrocardiogram‐gating, TE = 69 msec; field of view (FOV) = 32 cm; 64 × 64 image matrix; parallel imaging acceleration factor = 2; 5 contiguous 5‐mm‐thick axial slices; two motion‐encoding gradient pairs on each side of the refocusing pulse matched to the vibration frequency; alternating x, y, z, and 0 motion‐encoding gradient directions; and four phase offsets spaced evenly over one vibration period. For image processing purposes the image matrix was reformatted to 256 × 256 × 20 to give an isotropic voxel size of 1.25 mm. Images were acquired at the minimum delay possible in the cardiac cycle (∼100 msec) after the R‐wave ECG trigger, which is believed to be the most reproducible phase in the cardiac cycle.
For measurement of myocardial mass and volumes, cardiac MRI balanced steady‐state free precession (bSSFP) images were obtained in the short axis. The following imaging parameters were used to acquire 15 slices with the bSSFP acquisition; FOV 38 cm, imaging matrix 224 × 224, TR/TE = 3.3/1.1, slice thickness 8 mm, flip angle 60°, and a total scan time of ∼2 minutes with 15 breath‐holds of ∼17 seconds (depending on the heart rate).
MRE: Postprocessing/Inversion
MRE inversion was implemented by taking the curl of the 3D displacement field and performing a 3D local frequency estimation algorithm (LFE)16, 27 to invert the wave‐field and generate stiffness maps. The LFE algorithm was chosen because it is very robust in the presence of noise and is not affected by wave reflections. The LV of the heart was semiautomatically segmented using a random walker segmentation algorithm28 and a previously described quantitative quality factor referred to as the OSS‐SNR was calculated on the curl wave fields. The LV mask was eroded by two pixels in all directions to reduce edge effects. The median stiffness and mean (OSS‐SNR) over the remaining volume were measured.
To establish a baseline of noise, the MRE exam was repeated with the vibrational motion turned off (“no motion” scan) and OSS‐SNR29 was calculated. An MRE exam was considered successful only if the mean OSS‐SNR in the myocardium was at least two standard deviations above the mean OSS‐SNR of all “no‐motion” scans (ie, noise) across all subjects.
Cardiac MRI Processing
The short axis bSSFP images were used to calculate LV mass and volumes using commercially available software (cvi42, Circle Cardiovascular Imaging, Calgary, Alberta, Canada) by manually tracing the LV endocardial and epicardial contours.
Echocardiography
Echocardiography was performed on all subjects. Diastology data (early filling velocity [E velocity], late filling velocity [A velocity], the E/A ratio, the diastolic peak velocities of the medial mitral annulus [e' medial], and the E/e' ratio) were obtained at the apical 4‐chamber acoustic window using 2D and Doppler color flow techniques. Left atrial maximal volume was calculated with the method of discs from the 2‐chamber and 4‐chamber views. Global, average, peak systolic longitudinal strain, and basal, average, peak, and systolic strain were obtained using speckle tracking techniques.
Statistical Analysis
The cardiac amyloidosis patients were compared to healthy volunteers with respect to MRE stiffness, cardiac MRI mass and volumes, and echocardiography diastolic and strain parameters using a commercial software package (OriginPro 2015, OriginLab, Northampton, MA) that implemented a Mann–Whitney U‐test of significance.30 For the MRE stiffness measurements a one‐sided Mann–Whitney U‐test was used to see if there was an elevated stiffness in the cardiac amyloidosis patient group. All other metrics were tested for difference using a two‐sided test. P < 0.05 was considered statistically significant.
Results
Study Population
Eleven healthy volunteers and 16 patients with cardiac amyloidosis had sufficient image quality to be included in the MRE analysis. The population demographics of all subjects included in the study are summarized in Table 1.
Table 1.
Study Population Demographics
| Normal | Amyloid | P value | |
|---|---|---|---|
| Median age (years) | 57 (min: 52, max: 84) | 66.5 (min: 50, max 85) | 0.27 |
| Sex (m/f) | (10/1) | (13/3) | 0.52 |
| Amyloid subtype | Na | AL (10), TTR (6) | Na |
| NYHA class (0‐IV) | 0 | 1 (4), 2 (6), 3(6) | Na |
| Median body surface area (m2) | 2.00 (min: 1.61, max: 2.29) | 2.01 (min: 1.64, max: 2.23) | 0.79 |
| Systolic BP (mmHg) | 118 (min: 104, max: 142) | 118.7 (min: 82, max: 148) | 1 |
| Diastolic BP (mmHg) | 66 (min: 60, max: 73) | 66 (min: 54, max: 98) | 0.60 |
m/f: male/female; NYHA: New York Heart Association; BP: blood pressure.
MRE Exam Quality Factor
The group‐wise median OSS‐SNR for the “no motion” scans was 0.96 and an OSS‐SNR value of 1.17 (2 SD above the median) was used as a quantitative quality factor threshold to exclude MRE exams with poor image quality (Fig. 2). The mean OSS‐SNR of five volunteers and six patients fell below this threshold and thus these exams were excluded from the study.
Figure 2.
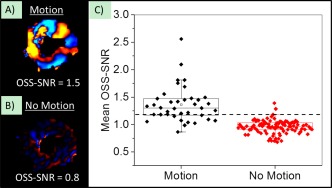
Wave quality factor metric. An example of a wave image from the same subject (A) with vibrational motion on (“Motion”), and (B) with vibrational motion turned off (“No‐Motion”). The mean OSS‐SNR over the entire myocardial volume for each scan is reported at the bottom of each wave image. (C) Mean OSS‐SNR across the myocardium for “Motion” and “No‐Motion” scans across all subjects. The dotted line is two standard deviations above the mean OSS‐SNR from “No‐Motion” scans, and only scans with values above this threshold were included in the study.
Cardiac MRE Stiffness Measurements
The LV myocardial stiffness of the 16 cardiac amyloid patients (median: 11.4 kPa, min: 9.2, max: 15.7) measured with cardiac MRE was significantly higher (P < 0.01) than the LV myocardium of 11 normal healthy volunteers (median: 8.2 kPa, min: 7.2, max: 11.8) (Fig. 3). Typical short‐axis bSSFP images and elastograms from the mid‐section of the left ventricle in a healthy volunteer and an age‐ and sex‐matched amyloidosis patient are shown in Fig. 4. The MRE stiffness values for each group are listed at the top of Table 2.
Figure 3.
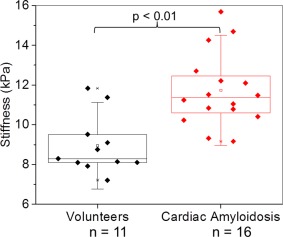
Box‐and‐whisker plot of median myocardial stiffness (kPa) in patients diagnosed with amyloidosis and normal healthy controls. The bottom and top of the box represent the 1st and 3rd quartiles, the line within the box represents the median value, the square in the box represents the mean, and the whiskers represent 1.5 SD from the mean. Patients in the amyloidosis group had significantly stiffer myocardial tissue (P < 0.01) than age‐ and sex‐matched controls.
Figure 4.
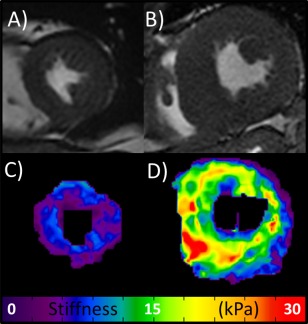
bSSFP Images and MRE elastograms. (A,B) Central slice short‐axis early systole bSSFP images of the heart in a healthy volunteer (mean stiffness = 7.2 kPa) and an age‐ and sex‐matched patient with amyloidosis (mean stiffness = 15.7 kPa), respectively. (C,D) The respective stiffness maps (elastograms).
Table 2.
Diagnostic Parameters
| Normal | Amyloid | P value | |
|---|---|---|---|
| MRE stiffness | |||
| Median myocardial stiffness (kPa) | 8.29 (min: 7.21, max: 11.83) | 11.36 (min: 9.15, max: 15.68) | P < 0.01 |
| Echocardiography | |||
| Longitudinal strain (%) | −21 (min: ‐24, max: ‐20) | −9 (min: ‐17, max: ‐4) | P < 0.01 |
| Basal average strain (%) | −20 (min: ‐21, max: ‐17) | −5 (min: ‐17, max: ‐2) | P < 0.01 |
| Left atrial volume index (mL/m2) | 29.5 (min: 20, max: 40) | 43 (min: 30, max: 73) | P < 0.01 |
| E velocity | 0.75 (min: 0.6, max: 0.9) | 0.8 (min: 0.6, max: 1.1) | P = 0.42 |
| A velocity | 0.65 (min: 0.4, max: 1) | 0.5 (min: 0.2, max: 1.1) | P = 0.20 |
| E/A | 1.07 (min: 0.875, max: 2) | 2 (min: 0.6, max: 3.67) | P = 0.10 |
| e' medial | 0.085 (min:0.06, max: 0.12) | 0.04 (min:0.02, max: 0.06) | P < 0.01 |
| E/e' | 8.4 (min: 5.8, max: 15) | 20 (min: 12, max: 45) | P < 0.01 |
| MRI volumes/mass | |||
| Diastolic wall thickness (mm) | 9 (min: 8, max: 14) | 18.5 (min: 14, max: 33) | P < 0.01 |
| Systolic wall thickness (mm) | 16 (min: 13, max: 19) | 23 (min: 19, max: 32) | P < 0.01 |
| LVEDVi (mL/ m2) | 66 (min: 39, max: 83) | 65.5 (min: 46, max: 104) | P = 0.60 |
| LVESVi (mL/ m2) | 21 (min: 13, max: 28) | 32 (min: 18, max: 62) | P < 0.01 |
| LVSVi (mL/ m2) | 42 (min: 25, max: 62) | 31 (min: 17, max: 69) | P = 0.13 |
| LVEF (%) | 65 (min: 59, max: 75) | 46 (min: 32, max: 74) | P < 0.01 |
| LV mass (g) | 70 (min: 38, max: 86) | 121 (min: 73, max: 190) | P < 0.01 |
A‐velocity: late filling velocity; E‐velocity: early filling velocity; e' medial: the diastolic peak velocities of the medial mitral annulus; kPa: kilopascal; LV: left ventricle; MRE: magnetic resonance elastography; RV: right ventricle; NYHA: New York Heart Association; LVEDVi: left ventricle end‐diastolic volume index; LVESVi: left ventricle end‐systolic volume index; LVSVi: left ventricle systolic volume index; LVEF: left ventricle ejection fraction.
Cardiac MRI and Echocardiography
The bSSFP imaging demonstrated that patients with amyloidosis had significantly thicker diastolic and systolic LV wall thickness, a greater LVEDVi and LV mass, and lower LVEF than normal healthy volunteers. Echocardiography showed that the amyloidosis group had significantly lower e', increased E/e' ratio, lower longitudinal and basal strain, and greater left atrial volume index than the healthy volunteer group. All bSSFP and echocardiography parameters are listed in Table 2.
Discussion
This study demonstrates the feasibility of 3D high‐frequency cardiac MRE as a contrast‐agent‐free diagnostic imaging technique for quantitatively measuring myocardial stiffness in vivo. Elgeti et al. used a shear wave amplitude measurement MRE technique31 to distinguish patients with diastolic abnormalities at echocardiography from normal subjects.10, 11, 32 However, their technique did not acquire 3D displacement fields and there was no attempt to quantitate myocardial stiffness. Instead, they reported the mean amplitudes of the shear wave displacement as a surrogate for myocardial stiffness.11, 32, 33 Wassenaar et al.34 described a quantitative cardiac MRE technique, using 80 Hz vibration frequency and a 2D MRE approach, but to date they have only reported results on normal volunteers and have not demonstrated the ability to distinguish normal subjects from patient populations. Likewise, the cardiac ultrasound elastography literature has primarily focused on demonstrating feasibility in healthy adult and pediatric volunteers and has not been tested in patient populations.35, 36
The cardiac amyloid patients in this study had numerous findings traditionally associated with increased myocardial stiffness and served as an excellent group for preliminary validation for cardiac MRE. The cardiac amyloid patients had increased E/e' ratio and left atrial volume index, which are associated with increased LV filling pressures.37, 38 E/A was not different between cardiac amyloid patients and normal subjects; however, E/A may be lowered in older normal subjects and is considered to be a less reliable indicator of LV stiffness than other diastolic parameters.38 Echocardiographic systolic strain is a measure of myocardial contraction39 and is not usually considered a marker of myocardial stiffness unless measured during passive deformation, as in infarcted myocardium.40 However, abnormal systolic strain is prognostic in cardiac amyloidosis and considered to be a marker of myocardial infiltration.7 Thus, abnormal strain in this study confirms the presence of cardiac amyloidosis and indirectly supports the presence of abnormal stiffness in our patient population.
This study also demonstrated a quantitative threshold that can be used to detect unsuccessful MRE exams in a patient population. In cardiac MRE, the generated stiffness maps can be biased by respiratory motion, poor cardiac gating, inadequate wave penetration, and poor SNR. Prior cardiac MRE studies have used visual inspection to identify low‐quality examinations,34 which is not reliable given that the wave fields are complex, or alternatively, included all studies without any quality measures.11 To help overcome these challenges we implemented an OSS‐SNR metric to systematically eliminate poorly acquired datasets from our analysis. McGarry et al.29 validated OSS‐SNR for accurate inversions for a finite element based algorithm; however, an appropriate OSS‐SNR threshold has not been established for a 3D local frequency estimation algorithm and the imaging parameters used in this study. Both factors play an important role in establishing a threshold of the OSS‐SNR. As a result, “no‐motion” data needed to be acquired in order to establish an OSS‐SNR threshold of 1.17 for the specific cardiac MRE acquisition and postprocessing technique described in this article. With this threshold in place, successful MRE exams could be identified without any need for an MRE expertise to visually inspect exams. This is imperative for the adoption of cardiac MRE in future clinical investigations.
This study had limitations, as it was an early attempt at performing 3D high‐frequency cardiac MRE in a patient population. First, the wave inversion used to generate stiffness maps in this study assumed tissue isotropy and local homogeneity, which are not true in the heart and may introduce errors in the stiffness accuracy. In future studies it may be beneficial to account for anisotropy13 in order to improve both inversion algorithms and curl operators for stiffness calculation.41, 42 Second, in this study we relied on 25‐second breath‐holds (for a heartrate of 60 bpm), which was challenging for some patients. Third, a 5‐mm isotropic acquisition resolution was used, which provided suboptimal spatial resolution and limited interrogation of tissue waves across the myocardium, but was necessary to ensure high SNR and good shear wave detectability. Fourth, only an early systolic phase was investigated with MRE in this study, as this was the most reproducible phase. Measuring multiple phases in the cardiac cycle, particularly end‐diastole, will be desirable in the future for evaluation of restrictive myocardial diseases, which are thought to predominantly affect diastole. Finally, as this was a preliminary study, it had a small population sample. However, the outcomes of this study motivate the investigation of cardiac MRE in larger sample sizes and in different disease populations. Further technological advances such as the implementation of cine EPI MRE imaging, simultaneous multislice imaging,43 and more advanced under‐sampling techniques44, 45 would help increase the number of cardiac phases being measured with MRE and would significantly reduce breath‐hold times and reduce any off‐resonance effects by shortening readout train lengths.
This study demonstrates the feasibility of 3D high‐frequency cardiac MRE as a contrast‐agent‐free diagnostic imaging technique for quantitatively measuring myocardial stiffness, validated in a cardiac amyloidosis patient cohort. The myocardial stiffness of cardiac amyloid patients was found to be significantly stiffer than healthy controls. Furthermore, an OSS‐SNR metric to systematically and objectively exclude unsuccessful MRE exams was successfully implemented in this study. Studies are currently underway to evaluate 3D high‐frequency cardiac MRE in the assessment of myocardial infarcts,46 hypertrophic cardiomyopathy, heart failure with preserved ejection fraction, as well as the prognostic value of MRE in patients with cardiac amyloidosis. In addition, this study motivates future investigation of 3D high‐frequency cardiac MRE in different patient cohorts, in therapy monitoring studies, and future prognostic evaluation studies where myocardial stiffness measurements could play a potential role in disease progression.
Conflict of Interest
Kevin Glaser, Kiaran McGee, Armando Manduca, Richard L. Ehman, and the Mayo Clinic have intellectual property rights and potential financial interest in some of the technology used in this study.
Acknowledgments
Contract grant sponsor: National Institutes of Health (NIH); contract grant numbers: 5R01HL115144 and EB001981; Contract grant sponsor: Mayo Clinic Center for Individualized Medicine, Imaging Biomarker Discovery Program; Contract grant sponsor: American Heart Association (AHA); contract grant number: 16POST29900011
References
- 1. Zile MR, Baicu CF, Gaasch WH. Diastolic heart failure—abnormalities in active relaxation and passive stiffness of the left ventricle. N Engl J Med 2004;350:1953–1959. [DOI] [PubMed] [Google Scholar]
- 2. Holmes JW, Borg TK, Covell JW. Structure and mechanics of healing myocardial infarcts. Annu Rev Biomed Eng 2005;7:223–253. [DOI] [PubMed] [Google Scholar]
- 3. Burkhoff D, Mirsky I, Suga H. Assessment of systolic and diastolic ventricular properties via pressure‐volume analysis: a guide for clinical, translational, and basic researchers. Am J Physiol Heart Circ Physiol 2005;289:H501–512. [DOI] [PubMed] [Google Scholar]
- 4. Mor‐Avi V, Lang RM, Badano LP, et al. Current and evolving echocardiographic techniques for the quantitative evaluation of cardiac mechanics: ASE/EAE consensus statement on methodology and indications endorsed by the Japanese Society of Echocardiography. J Am Soc Echocardiogr 2011;24:277–313. [DOI] [PubMed] [Google Scholar]
- 5. Simpson RM, Keegan J, Firmin DN. MR assessment of regional myocardial mechanics. J Magn Reson Imaging 2013;37:576–599. [DOI] [PubMed] [Google Scholar]
- 6. Madry W, Karolczak MA. Physiological basis in the assessment of myocardial mechanics using speckle‐tracking echocardiography 2D. Part I. J Ultrasound 2016;16:135–144. [DOI] [PMC free article] [PubMed] [Google Scholar]
- 7. Koyama J, Falk RH. Prognostic significance of strain Doppler imaging in light‐chain amyloidosis. JACC Cardiovasc Imaging 2010;3:333–342. [DOI] [PubMed] [Google Scholar]
- 8. Kolipaka A, Aggarwal SR, McGee KP, et al. Magnetic resonance elastography as a method to estimate myocardial contractility. J Magn Reson Imaging 2012;36:120–127. [DOI] [PMC free article] [PubMed] [Google Scholar]
- 9. Kolipaka A, Mcgee KP, Araoz PA, et al. MR elastography as a method for the assessment of myocardial stiffness: comparison with an established pressure‐volume model in a left ventricular model of the heart. Magn Reson Med 2009;62:135–140. [DOI] [PMC free article] [PubMed] [Google Scholar]
- 10. Elgeti T, Beling M, Hamm B, Braun J, Sack I. Cardiac magnetic resonance elastography: toward the diagnosis of abnormal myocardial relaxation. Invest Radiol 2010;45:782–787. [DOI] [PubMed] [Google Scholar]
- 11. Elgeti T, Knebel F, Hattasch R, Hamm B, Braun J, Sack I. Shear‐wave amplitudes measured with cardiac MR elastography for diagnosis of diastolic dysfunction. Radiology 2014;271:681–687. [DOI] [PubMed] [Google Scholar]
- 12. Elgeti T, Laule M, Kaufels N, et al. Cardiac MR elastography: comparison with left ventricular pressure measurement. J Cardiovasc Magn Reson 2009;11:44. [DOI] [PMC free article] [PubMed] [Google Scholar]
- 13. Couade M, Pernot M, Messas E, et al. In vivo quantitative mapping of myocardial stiffening and transmural anisotropy during the cardiac cycle. IEEE Trans Med Imaging 2011;30:295–305. [DOI] [PubMed] [Google Scholar]
- 14. Song P, Zhao H, Urban M, et al. Improved shear wave motion detection using pulse‐inversion harmonic imaging with a phased array transducer. IEEE Trans Med Imaging 2013;32:2299–2310. [DOI] [PMC free article] [PubMed] [Google Scholar]
- 15. Hollender PJ, Wolf PD, Goswami R, Trahey GE. Intracardiac echocardiography measurement of dynamic myocardial stiffness with shear wave velocimetry. Ultrasound Med Biol 2012;38:1271–1283. [DOI] [PMC free article] [PubMed] [Google Scholar]
- 16. Manduca A, Oliphant TE, Dresner MA, et al. Magnetic resonance elastography: non‐invasive mapping of tissue elasticity. Med Image Anal 2001;5:237–254. [DOI] [PubMed] [Google Scholar]
- 17. Arunachalam SP, Rossman PJ, Arani A, et al. Quantitative 3D magnetic resonance elastography: Comparison with dynamic mechanical analysis. Magn Reson Med 2016. [Epub ahead of print]. [DOI] [PMC free article] [PubMed] [Google Scholar]
- 18. Arani A, Glaser KL, Arunachalam SP, et al. In vivo, high‐frequency three‐dimensional cardiac MR elastography: Feasibility in normal volunteers. Magn Reson Med 2016. [Epub ahead of print]. [DOI] [PMC free article] [PubMed] [Google Scholar]
- 19. Fitzpatrick AW, Park ST, Zewail AH. Exceptional rigidity and biomechanics of amyloid revealed by 4D electron microscopy. Proc Natl Acad Sci U S A 2013;110:10976–10981. [DOI] [PMC free article] [PubMed] [Google Scholar]
- 20. Yamakado T, Fukui A, Kato N, et al. Analysis of left ventricular diastolic function by the pressure‐volume relation in cases with idiopathic restrictive cardiomyopathy and amyloid restrictive cardiomyopathy. Heart Vessels Suppl 1990;5:80–83. [PubMed] [Google Scholar]
- 21. Swanton RH, Brooksby IA, Davies MJ, Coltart DJ, Jenkins BS, Webb‐Peploe MM. Systolic and diastolic ventricular function in cardiac amyloidosis. Studies in six cases diagnosed with endomyocardial biopsy. Am J Cardiol 1977;39:658–664. [DOI] [PubMed] [Google Scholar]
- 22. Bhupathi SS, Chalasani S, Rokey R. Stiff heart syndrome. Clin Med Res 2011;9:92–99. [DOI] [PMC free article] [PubMed] [Google Scholar]
- 23. Chew C, Ziady GM, Raphael MJ, Oakley CM. The functional defect in amyloid heart disease. The “stiff heart” syndrome. Am J Cardiol 1975;36:438–444. [DOI] [PubMed] [Google Scholar]
- 24. Petre RE, Quaile MP, Wendt K, et al. Regionally heterogeneous tissue mechanics in cardiac amyloidosis. Amyloid 2005;12:246–250. [DOI] [PubMed] [Google Scholar]
- 25. Maleszewski JJ. Cardiac amyloidosis: pathology, nomenclature, and typing. Cardiovasc Pathol 2015;24:343–350. [DOI] [PubMed] [Google Scholar]
- 26. Koyama J, Ray‐Sequin PA, Falk RH. Longitudinal myocardial function assessed by tissue velocity, strain, and strain rate tissue Doppler echocardiography in patients with AL (primary) cardiac amyloidosis. Circulation 2003;107:2446–2452. [DOI] [PubMed] [Google Scholar]
- 27. Knutsson H, Westin C‐F, Granlund G. Local multiscale frequency and bandwidth estimation. Image Processing, 1994 Proceedings ICIP‐94, IEEE International Conference. Volume 1: IEEE; 1994. p 36–40.
- 28. Grady L. Random walks for image segmentation. IEEE Trans Pattern Anal Mach Intell 2006;28:1768–1783. [DOI] [PubMed] [Google Scholar]
- 29. McGarry MD, Van Houten EE, Perrinez PR, Pattison AJ, Weaver JB, Paulsen KD. An octahedral shear strain‐based measure of SNR for 3D MR elastography. Phys Med Biol 2011;56:N153–164. [DOI] [PMC free article] [PubMed] [Google Scholar]
- 30. Siegel S. Nonparametric statistics for the behavioral sciences. New York, McGraw Hill Book Co., Inc., 1956.
- 31. Sack I, Rump J, Elgeti T, Samani A, Braun J. MR elastography of the human heart: noninvasive assessment of myocardial elasticity changes by shear wave amplitude variations. Magn Reson Med 2009;61:668–677. [DOI] [PubMed] [Google Scholar]
- 32. Elgeti T, Steffen IG, Knebel F, et al. Time‐resolved analysis of left ventricular shear wave amplitudes in cardiac elastography for the diagnosis of diastolic dysfunction. Invest Radiol 2016;51:1–6. [DOI] [PubMed] [Google Scholar]
- 33. Elgeti T, Beling M, Hamm B, Braun J, Sack I. Elasticity‐based determination of isovolumetric phases in the human heart. J Cardiovasc Magn Reson 2010;12:60. [DOI] [PMC free article] [PubMed] [Google Scholar]
- 34. Wassenaar PA, Eleswarpu CN, Schroeder SA, et al. Measuring age‐dependent myocardial stiffness across the cardiac cycle using MR elastography: A reproducibility study. Magn Reson Med 2016;75:1586–1593. [DOI] [PMC free article] [PubMed] [Google Scholar]
- 35. Song P, Bi X, Mellema DC, et al. Quantitative assessment of left ventricular diastolic stiffness using cardiac shear wave elastography: a pilot study. J Ultrasound Med 2016;35:1419–1427. [DOI] [PubMed] [Google Scholar]
- 36. Song P, Bi X, Mellema DC, et al. Pediatric cardiac shear wave elastography for quantitative assessment of myocardial stiffness: a pilot study in healthy controls. Ultrasound Med Biol 2016;42:1719–1729. [DOI] [PubMed] [Google Scholar]
- 37. Park JH, Marwick TH. Use and limitations of E/e' to assess left ventricular filling pressure by echocardiography. J Cardiovasc Ultrasound 2011;19:169–173. [DOI] [PMC free article] [PubMed] [Google Scholar]
- 38. Nagueh SF, Smiseth OA, Appleton CP, et al. Recommendations for the evaluation of left ventricular diastolic function by echocardiography: an update from the American Society of Echocardiography and the European Association of Cardiovascular Imaging. J Am Soc Echocardiogr 2016;29:277–314. [DOI] [PubMed] [Google Scholar]
- 39. Gorcsan J, 3rd , Tanaka H. Echocardiographic assessment of myocardial strain. J Am Coll Cardiol 2011;58:1401–1413. [DOI] [PubMed] [Google Scholar]
- 40. Pislaru C, Bruce CJ, Anagnostopoulos PC, et al. Ultrasound strain imaging of altered myocardial stiffness: stunned versus infarcted reperfused myocardium. Circulation 2004;109:2905–2910. [DOI] [PubMed] [Google Scholar]
- 41. Qin EC, Sinkus R, Geng GQ, et al. Combining MR elastography and diffusion tensor imaging for the assessment of anisotropic mechanical properties: A phantom study. J Magn Reson Imaging 2013;37:217–226. [DOI] [PubMed] [Google Scholar]
- 42. Sinkus R, Tanter M, Catheline S, et al. Imaging anisotropic and viscous properties of breast tissue by magnetic resonance‐elastography. Magn Reson Med 2005;53:372–387. [DOI] [PubMed] [Google Scholar]
- 43. Feinberg DA, Setsompop K. Ultra‐fast MRI of the human brain with simultaneous multi‐slice imaging. J Magn Reson 2013;229:90–100. [DOI] [PMC free article] [PubMed] [Google Scholar]
- 44. Donoho DL. Compressed sensing. IEEE Trans Inform Theory 2006;52:1289–1306. [Google Scholar]
- 45. Lustig M, Donoho D, Pauly JM. Sparse MRI: The application of compressed sensing for rapid MR imaging. Magn Reson Med 2007;58:1182–1195. [DOI] [PubMed] [Google Scholar]
- 46. Arunachalam SP, Arani A, Baffour F, et al. Regional in vivo assessment of myocardial stiffness using 3D magnetic resonance elastography in a pig model with induced myocardial infarction. Am Heart Assoc 2016. [Google Scholar]