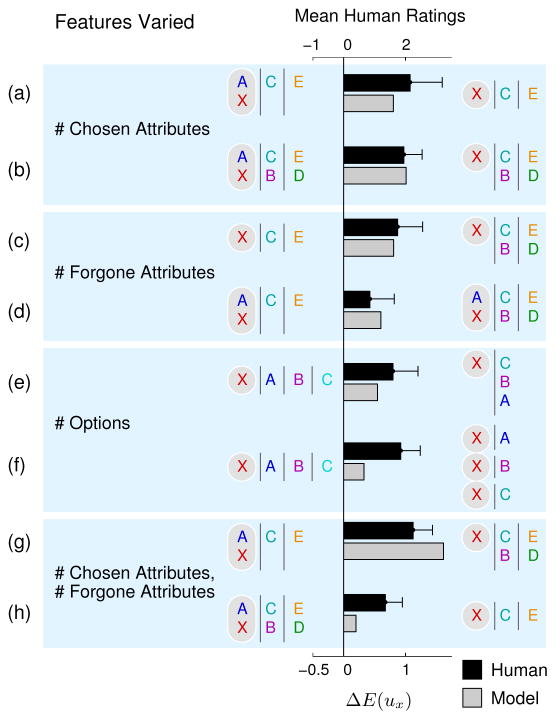
Figure 6.
Experiment 2 results. The bars show mean human ratings and inverse decision-making model predictions for the pairs of observed choices in each row. The bars point toward the choice that provides stronger evidence of a preference for X. Error bars indicate 95% confidence intervals. The first six pairs of choices differ with respect to one feature, identified by the labels in the “Features Varied” column. The last two pairs differ with respect to two features.

