

Abstract
Accumulating evidence suggests that O3 exposure may contribute to CNS dysfunction. Here, we posit that inflammatory and acute-phase proteins in the circulation increase after O3 exposure and systemically convey signals of O3 exposure to the CNS. To model acute O3 exposure, female Balb/c mice were exposed to 3 ppm O3 or forced air for 2 h and were studied after 6 or 24 h. Of 23 cytokines and chemokines, only KC/CXCL1 was increased in blood 6 h after O3 exposure. The acute-phase protein serum amyloid A (A-SAA) was significantly increased by 24 h, whereas C-reactive protein was unchanged. A-SAA in blood correlated with total leukocytes, macrophages, and neutrophils in bronchoalveolar lavage from O3-exposed mice. A-SAA mRNA and protein were increased in the liver. We found that both isoforms of A-SAA completely crossed the intact blood-brain barrier, although the rate of SAA2.1 influx was approximately 5 times faster than that of SAA1.1. Finally, A-SAA protein, but not mRNA, was increased in the CNS 24 h post-O3 exposure. Our findings suggest that A-SAA is functionally linked to pulmonary inflammation in our O3 exposure model and that A-SAA could be an important systemic signal of O3 exposure to the CNS.—Erickson, M. A., Jude, J., Zhao, H., Rhea, E. M., Salameh, T. S., Jester, W., Pu, S., Harrowitz, J., Nguyen, N., Banks, W. A., Panettieri, R. A., Jr., Jordan-Sciutto, K. L. Serum amyloid A: an ozone-induced circulating factor with potentially important functions in the lung-brain axis.
Keywords: air pollution, cytokines, acute-phase proteins, blood-brain barrier, microglia
Air pollution—a serious threat to human health—induces more than 3 million premature deaths per year worldwide (1). Among the most prevalent toxicants in polluted air, O3 has been associated with respiratory and cardiovascular-related health issues and, more recently, has been implicated in CNS dysfunction. Such dysfunctions include cognitive decline and dementia (2–4), increased stroke risk (5–7), neuroinflammation and oxidative stress (8–12), and accumulation of amyloid-β and α-synuclein that are pathologic proteins in Alzheimer’s disease and Parkinson’s disease, respectively (11–15); however, the mechanisms by which O3 exposure could adversely affect CNS function remain unknown. We posit that O3 inhalation elevates circulating proinflammatory mediators that can access the CNS by crossing the blood-brain barrier (BBB).
O3 does not affect the CNS directly, as the majority of it is consumed by antioxidants and lipids in airway surfactant (16). O3 induces inflammation within and outside the airway primarily via local generation of secondary mediators, such as lipid ozonation products, hydrogen peroxide, and phospholipases (17–24). Subsequently, extrapulmonary inflammatory responses may occur, as rodents and humans show evidence of an acute-phase response after ozone exposure (19, 25). Circulating proinflammatory cytokines and acute-phase proteins that are induced during an acute phase response could affect normal CNS function via their interactions with the BBB. The BBB protects the CNS from the entry of potentially harmful circulating molecules and precisely controls the transport of macromolecules that maintain normal CNS functions (26); however, the BBB also has important functions in neuroimmune communication. One such function is facilitating the entry of circulating proinflammatory factors into the CNS (27). Therefore, the major objectives of our study were: 1) to screen for cytokines, chemokines, and acute-phase proteins that are up-regulated in the blood after O3 exposure, 2) to determine whether inflammatory mediators in the blood are associated with pulmonary inflammation, and 3) to determine whether these proinflammatory mediators could reach the CNS by crossing the BBB.
One proinflammatory mediator that we identified in our screen was the acute-phase protein serum amyloid A (A-SAA). In the context of O3 exposure, A-SAA has been understudied. A-SAAs comprise 2 isoforms, SAA1 and SAA2, which are major acute-phase proteins in most vertebrates, including mice and humans, but not rats (28), and are predominantly generated in the liver and secreted into the bloodstream in response to proinflammatory cytokines (29). Both SAA1 and SAA2 associate with HDL in the circulation (30). Mice express a third acute-phase SAA isoform, SAA3, which is extrahepatically expressed during acute-phase response. In humans, SAA3 is a pseudogene and has no protein product (31). In mice, SAA3 is not detectable in the circulation (32). A-SAA increases up to 1000-fold in the blood after infection and plays important roles in host defense (31). Conversely, A-SAA fragments form fibrils in amyloid A amyloidosis (33). A-SAA is elevated in the blood and lungs of patients with chronic obstructive pulmonary disease (COPD) (34–36), which is associated with and exacerbated by O3 exposure (37, 38). Furthermore, A-SAA induces glucocorticoid-resistant airway neutrophilia that is dependent on IL-6 and IL-17A (36). In mice, O3 exposure up-regulates pulmonary expression of SAA3 (39). Of importance, SAA3 exacerbates airway neutrophilia in mice by the same IL-6/IL-17A–dependent mechanism as human A-SAA in COPD (39), which supports the overlapping functions for these isoforms.
A-SAA may also participate in CNS disease pathology. In vitro, recombinant human A-SAA up-regulates proinflammatory cytokines and iNOS in astrocytes and microglia (40). Conversely, endogenous mouse SAA3 and recombinant human A-SAA limit LPS-induced microglia activation via an IL-10–dependent mechanism (41). In the same study, SAA also reduced LPS-induced tau hyperphosphorylation, which is a pathologic event in Alzheimer’s disease (42). SAA deposits in myelin sheaths of patients with Alzheimer’s disease (43), and elevated SAA protein and mRNA levels were found in homogenates of the frontal cortex in patients with Alzheimer’s disease (44). A-SAA deposits occur in neurovasculature and brain microinfarcts of hypertensive primates (45), in the brain parenchyma and neurovasculature of SAA1-overexpressing transgenic mice after LPS treatment (46), in circumventricular organs and the choroid plexus in systemic amyloid A amyloidosis (47), and in myelin sheaths of patients with multiple sclerosis (43). It has recently been found that hepatic overexpression of A-SAA induced detectable levels of liver-derived A-SAA in the CNS, neurovascular pathologies, and depression-like symptoms in aged mice (48); however, it remains unknown how liver-derived SAA can enter the CNS or whether liver-derived SAA can enter the CNS after O3 exposure.
In the present study, we identify SAA as a mediator that is significantly elevated in the blood after O3 exposure in mice and that positively correlates with macrophage (Mϕ) and neutrophil recruitment in the pulmonary compartment. Furthermore, we demonstrate that both acute-phase isoforms of SAA cross the intact BBB and accumulate in the CNS in response to O3 exposure. These findings suggest that A-SAA may be an important mediator in the lung–brain axis after O3 exposure.
MATERIALS AND METHODS
Animal use
O3 exposures were performed on female BALB/c mice age 12–13 wk (Charles River Laboratories, Malvern, PA, USA). BALB/c mice were chosen because they develop robust airway neutrophilia in response to O3 compared with other strains (49). A total of 48 Balb/c mice were used: 24 for cytokine quantification, quantitative PCR, and Western blotting (n = 6 mice per group; 4 groups), and the same 24 mice plus 8 additional mice were used for pulmonary inflammation assessment, SAA and C-reactive protein (CRP) quantification, and correlation with pulmonary inflammation. Sixteen mice (n = 4 per group; 4 groups) were used to assess gliosis. SAA transport studies were conducted by using 8-wk-old male CD-1 mice (Charles River Laboratories), because they are an established model for in vivo BBB transport studies (50–52). Thirty mice were used to assess BBB influx of A-SAA, 6 mice were used for capillary depletion studies, and 8 mice were used for quantification of high-MW A-SAA species. Mice had access to food and water ad libitum and were kept on a 12-h light/dark cycle. Protocols were approved by the institutional animal care and use committees of the University of Pennsylvania and the Seattle Veteran’s Affairs Medical Center (Seattle, WA, USA).
Ozone exposure
Mice were exposed to 3 ppm O3 for 2 h, as previously described (53). Control mice were concurrently exposed to room air under identical housing conditions. The O3 concentration used was verified by preliminary dose–response studies that showed that exposure of female BALB/c mice to 3 ppm O3 for 2 h was optimal to achieve a significant inflammatory and airway obstructive response without eliciting immediate respiratory distress. Although the O3 concentration that is considered hazardous to human health by the U.S. Environmental Protection Agency is 0.25–0.4 ppm (averaged over an 8-h period), no airway response or inflammation was observed when mice received ≤ 0.4 ppm levels. Differences in pulmonary response in mice vs. humans are attributed to pulmonary O3 deposition, which in resting rodents is approximately 4 times lower that in exercising humans (54); higher levels of antioxidants in the mouse airway (55), which would have a neutralizing effect on O3; and limited exposure time of 2 h to minimize the confounding effects of food and water deprivation (53).
Sources of A-SAA
Recombinant murine SAA1.1 (Uniprot P05367) and SAA2.1 (Uniprot P05366) (http://www.uniprot.org) were purchased from R&D Systems (Minneapolis, MN, USA). Naming of SAA1 and SAA2 isoforms throughout this manuscript follows revised guidelines set forth by the Amyloid Nomenclature Committee (56).
Tissue harvesting post-O3 exposure
At 6 or 24 h after the end of O3 exposure, mice were deeply anesthetized with intraperitoneal ketamine/xylazine. Blood was collected from the orbital sinus and coagulated at room temperature for 30 min. Blood samples were then centrifuged at 1500 g for 10 min at room temperature, and serum was collected, portioned into aliquots, and stored at −80°C until assay. After serum collection, brains were harvested by first severing only the spinal cord, leaving the trachea intact for bronchoalveolar lavage (BAL), then removing from the skull. Brains were cut in half sagittally, and one hemibrain was immediately placed in RNA later (Thermo Fisher Scientific, Waltham, MA, USA) and later dissected for RNA extraction. The second hemicortex was dissected immediately and frozen on dry ice for protein extraction. BAL was conducted after removal of the brain. The medial lobe of the liver was also harvested, and one half was preserved in RNA later and the other half frozen on dry ice for protein analysis. For immunofluorescent analysis, mouse brains were perfusion-fixed by 4% paraformaldehyde and postfixed by immersion in 4% paraformaldehyde for 24 h. Fixed brains were washed in PBS, then submitted for paraffin embedding and sectioning by the pathology core at the Children’s Hospital of Philadelphia (Philadelphia, PA, USA).
Assessment of pulmonary inflammation
BAL was performed on mice by perfusing and aspirating lungs 3 times with 1 ml PBS. Approximately 2.5–2.75 ml was retrieved from each mouse. BAL fluid was centrifuged at 400 g (8 min, 4°C), and the pellet was resuspended in PBS and recentrifuged. Total cell counts were determined from 1 aliquot of the cell suspension by using a cell counter (Beckman Coulter, Brea, CA, USA), and differential cell counts were performed on cytocentrifuge preparations (Cytospin 3; Thermo Fisher Scientific) that were stained with Kwick Diff (Thermo Fisher Scientific), counting 200 cells from each individual. Images of stained BAL cells were acquired at ×40 magnification.
Protein extraction
Frozen cortices or livers were homogenized in ice-cold buffer [10 mM HEPES, 1.5 mM MgCl2, 10 mM KCl, 0.5 mM DTT, protease inhibitor cocktail (Sigma-Aldrich, St. Louis, MO, USA), and 1 mM sodium orthovanadate]. Homogenates were centrifuged at 1000 g for 5 min at 4°C. Supernatants were removed and saved as soluble fractions. Pellets were resuspended in cytoplasmic extraction buffer (10 mM HEPES, 10 mM KCl, 10 mM EDTA, 0.5% IGEPAL, 1 mM DTT, protease inhibitor cocktail, and 1 mM sodium orthovanadate), and centrifuged at 16,000 g for 20 min at 4°C. Supernatants were removed and saved as cytoplasmic fractions. Pellets were washed once with cytoplasmic extraction buffer, respun, and the supernatant discarded. Both fractions were aliquoted and stored at −80°C until analysis. Protein concentrations were quantified by using Bradford protein assays (Bio-Rad, Hercules, CA, USA).
Immunoblotting
For A-SAA detection in brains and liver, 10 μg of protein was run on NuPAGE 4–12% Bis-tris gels with MOPS buffer (Thermo Fisher Scientific ) and transferred at 25 V onto PVDF membranes in NuPAGE transfer buffer (Thermo Fisher Scientific) with 20% methanol for 2.5 h. Membranes were blocked for 1 h with 5% bovine serum albumin (BSA)/Tris-buffered saline–Tween 20 and probed with a 1/1000 dilution of goat anti-SAA, which detects mouse SAA1.1 and SAA2.1 but not SAA3 (R&D Systems) overnight. Membranes were then washed, incubated with horseradish peroxidase–conjugated donkey anti-goat secondary Ab (Thermo Fisher Scientific) for 30 min, washed again, incubated with Luminata Classico reagent (EMD Millipore, Billerica, MA, USA), and imaged by using autoradiography film. After Ab incubations, blots were either probed with actin or stained with Fast Green Stain (Sigma-Aldrich) to confirm even loading. Densitometric analysis of protein bands was performed by using ImageJ (National Institutes of Health, Bethesda, MD, USA), and all bands were normalized to the signal intensity of the actin or fast green loading control.
RNA extraction and quantitative RT-PCR
Hemicortices and livers that were preserved in RNA later were homogenized in Qiazol, and RNA was extracted by using RNeasy Plus Universal Kits (Qiagen, Valencia, CA, USA). Superscript III first strand kit (Thermo Fisher Scientific) was used to convert 2 μg of RNA template to cDNA in a 20-μl reaction volume. RNase H was added after cDNA synthesis to degrade the mRNA template. For quantitative PCR, 10 ng of cDNA template was amplified in a total volume of 10 μl using Fast SYBR green master mix (Applied Biosystems, Foster City, CA, USA) using Applied Biosystems 7500 Fast Real-Time PCR System and the following cycling conditions: 95°C for 20 min, followed by 40 cycles of 95°C for 3 s and 60°C for 30 s, followed by a melt curve to confirm that a single amplicon was generated. Data were analyzed by using the comparative CT method. All primers used are listed in Table 1.
TABLE 1.
List of primers used for quantitative PCR
| Primer, 5′–3′ |
|||
|---|---|---|---|
| Target | IDT product code | Forward | Reverse |
| SAA2.1 | Mm.PT.58.21905888 | ||
| SAA1.1 | Mm.PT.58.43376774 | ||
| IL-1β | Mm.PT.58.41859985 | ||
| IL-6 | Mm.PT.58.41863062 | ||
| TNF-α | Mm.PT.58.29509614 | ||
| TBP | CGGTCGCGTCATTTTCTC | GGGTTATCTTCACACACCATGA | |
| Actin | CTAAGGCCAACCGTGAAAAG | ACCAGAGGCATACAGGGACA | |
Assessment of microgliosis
Five millimolar sagittal brain sections were deparaffinized with histoclear and rehydrated with graded ethanols. Endogenous peroxidase activity was blocked with 3% H2O2 in methanol and antigen unmasking was achieved with target retrieval solution (Dako, Carpinteria, CA, USA) at 95°C for 1 h. Sections were blocked with 10% normal goat serum in PBS and incubated overnight at 4°C with a 1/1000 dilution of rabbit anti-ionized calcium-binding adaptor molecule-1 (Iba-1;Wako, Richmond, VA, USA). Sections were washed, incubated with a 1/200 dilution of anti-rabbit Cy3 (Jackson ImmunoResearch, West Grove, PA, UAS) for 30 min at room temperature, stained with DAPI, and mounted with Citifluor AF1 (Citifluor, Hatfield, PA, USA). Whole-brain sections were imaged by using a ×20 objective and stitched by using a Keyence BZ-X700 and associated software (Keyence, Itasca, IL, USA). Identically processed brain sections from mice that were infected with a neurotropic strain of mouse hepatitis virus were used as positive controls for gliosis (a gift from the lab of Susan Weiss, University of Pennsylvania) (57).
Quantification of SAA, CRP, and cytokines
A-SAA and CRP in serum were quantified by using ELISA kits from Life Diagnostics (West Chester, PA, USA) according to instructions of the kit. The A-SAA kit that was used detects mouse SAA1.1 and SAA2.1 in serum, with a limit of detection of 7.8 ng/ml. Samples were diluted 1/100 before measurement as recommended by the manufacturer. Serum and soluble protein fractions from cortex were assayed for a panel of 23 cytokines: IL-1α, IL-1β, IL-2, IL-3, IL-4, IL-5, IL-6, IL-9, IL-10, IL-12(p40), IL-12(p70), IL-13, IL-17, Eotaxin/CCL11, granulocyte colony-stimulating factor, granulocyte-Mϕ colony-stimulating factor, IFN-γ, keratinocyte chemoattractant (KC/CXCL1), monocyte chemoattractant protein-1 (MCP-1/CCL2), Mϕ inflammatory proteins-1α (MIP-1a/CCL3) and -1β (MIP-1b/CCL4), RANTES/CCL5, and TNF-α using a murine Bioplex assay kit from Bio-Rad. All samples were diluted 1:3 in sample diluent provided in the kit and were processed according to assay directions. Plates were read on a Bioplex 200 (Bio-Rad). Cytokine values from brain extracts were normalized to total protein levels and expressed as picograms cytokine per milligram of total protein.
Radioactive labeling of proteins
Ten or 5 µg of SAA1.1 or SAA2.1, respectively, was labeled with 0.5 mCi Na [125I] (PerkinElmer, Waltham, MA, USA) per 5 µg protein by using the chloramine-T method (Sigma-Aldrich). Ten micrograms of chloramine-T was added to protein in 0.25 M chloride-free sodium phosphate buffer (pH 7.5) for 1 min followed by the addition of 100 µg of sodium metabisulfite to terminate the reaction. BSA (Sigma-Aldrich) was radioactively labeled with [99mTc] (GE Healthcare, Seattle, WA, USA). In brief, 1 mg BSA was combined with 120 µg of stannous tartrate and 20 µl 1 M HCl in 500 ml of deionized water. One millicurie of [99mTc] was then added for 20 min. Radioactively labeled SAA1.1 and SAA2.1 (I-SAA1.1/I-SAA2.1) and BSA (Tc-BSA) were purified on a column of Sephadex G-10 (Sigma-Aldrich). Iodine labeling of A-SAA proteins was characterized by precipitation in 30% trichloroacetic acid that was saturated with sodium chloride (acidified brine). Technetium was precipitated with 30% trichloroacetic acid. All proteins were spiked in 1% BSA in lactated Ringer’s (LR) solution before precipitation to visualize the pellet. Precipitated proteins were then centrifuged at 5000 g for 10 min, and pellets and supernatants were counted to estimate precipitable activity. I-SAA1.1 and I-SAA2.1 precipitated at approximately 90 and 80%, respectively. Specific activities for I-SAA1.1 and I-SAA2.1 were 40.6 and 72.5 µCi/µg, respectively, and Tc-BSA precipitated at >90%. I-SAA1.1 and SAA2.1 were further analyzed by size exclusion chromatography using a Superose 6 Increase 10/300 CL column with room temperature PBS (0.01 M phosphate buffer, 0.0027 M potassium chloride, and 0.137 M sodium chloride, pH 7.4) as the elution buffer. The flow rate was 0.5 ml/min and fractions were collected every minute for 60 min and counted in a γ-counter.
In vivo stability of I-SAA1.1 or I-SAA2.1 in brain and blood
Mice were anesthetized with an intraperitoneal injection of 0.15 ml of 40% urethane. The jugular vein and right carotid artery were exposed. Arterial serum and whole brain were obtained 5, 15, or 30 min after i.v. injection of 1 × 10⁶ counts per minute (CPM) of I-SAA1.1 or I-SAA2.1 in 0.2 ml LR plus 1% BSA (LR-BSA). Blood was allowed to clot, was centrifuged at 3500 g for 10 min, and 50 μl of the resulting serum was added to 250 μl of LR-BSA. This mixture was mixed, 300 μl of acidified brine was added and mixed, and this mixture was centrifuged for 10 min at 5000 g. The resulting supernatant and precipitate were counted separately and the percent of counts in the precipitate was calculated. Brains were homogenized in 0.8 ml of LR-BSA with a bead beater for 30 s at 4800 rpm × 2 on ice. Samples were transferred to a 1.7-ml microfuge tube and centrifuged at 15,000 g for 15 min. A portion of the resulting supernatant was added to an equal volume of acidified brine, mixed, and centrifuged at 5000 g for 10 min. Resulting supernatant (S) and precipitate (P) were counted separately and the percent of radioactivity that could be precipitated with acid (% Precip) was calculated:
To correct for processing-associated degradation, I-SAA1.1 or I-SAA2.1 were added to nonradioactive arterial whole blood or to whole brain and processed as above. Biologic samples were corrected for degradation during processing by dividing their values by the processing control values. Values for %Precip from biologic samples was corrected by dividing them by the %Precip values for the processing controls and multiplying by 100.
Brain influx measurement of SAA1.1 and SAA2.1
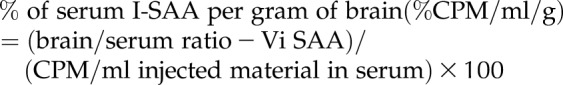
Multiple-time regression analysis was used as detailed previously (58–60) to calculate the blood-to-brain unidirectional influx rate (Ki). Mice were anesthetized with an i.p. injection of 0.15 ml of 40% urethane and were injected in the jugular vein with 0.2 ml of LR-BSA and 1 × 10⁶ CPM of I-SAA1.1 or I-SAA2.1 and 5 × 10⁵ CPM of Tc-BSA. Blood from the carotid artery was collected at 1, 2, 5, 7, 10, 15, 20, and 30 min after i.v. injection, then mice were immediately decapitated and the whole brain was removed and weighed. One mouse was used for each data point studied. Arterial blood was centrifuged at 5400 g for 10 min at 4°C, and the serum was collected. Levels of radioactivity in serum (50 μl) and brain were counted in a γ-counter for 3 min. Each CPM reading for brain and blood was corrected to include only the proportion of precipitable activity, thereby excluding free iodine or degraded protein from our calculations. Brain/serum ratios (microliter per gram) of I-SAA1.1 or I-SAA2.1 were calculated separately as follows:
Brain/serum ratios were plotted against their respective exposure times (Texp). Texp was calculated from the following formula:
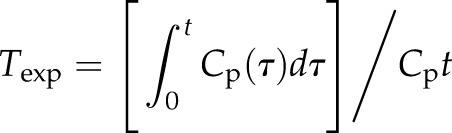 |
where t is time in minutes between intravenous injection and blood sampling, Cp is the CPM/µl of arterial serum, Cpt is CPM/µl of arterial serum at time t, and τ is a dummy variable for time. The slope of the linear portion of the relation between brain/serum ratios and Texp equals Ki, the blood-to-brain unidirectional influx constant in microliters per gram-minute. The y-intercept of the curve measures Vi, the distribution volume, in brain at t = 0. For comparison of SAA1.1 and SAA2.1 influx curves, tissue/serum ratios of albumin were subtracted from the tissue/serum ratios of SAA1 and SAA2 to exclude vascular space, and these values are represented as δ brain/serum ratios. The percentage of I-SAA in 1 ml of serum per gram of brain tissue was calculated from the following equation:
 |
The y-intercepts (Vi) were calculated from plots of brain/serum ratios of I-SAA1.1 and I-SAA2.1 vs. exposure time over the first 15 min of study, which was the linear portion of the curve. Subtraction of Vi from the brain/serum ratio excludes the contribution of I-SAA1.1 or I-SAA2.1 that is present in the vascular space or that rapidly binds to the brain vasculature before crossing the BBB.
Capillary depletion without vascular washout
Mice were anesthetized and injected in the jugular vein with I-SAA1.1 or I-SAA2.1 and Tc-BSA as previously described. Blood was collected from the carotid artery 15 min later and brains were removed. Whole brain was homogenized in glass with physiologic buffer (10 mM HEPES, 141 mM NaCl, 4 mM KCl, 2.8 mM CaCl2, 1 mM MgSO4, 1 mM NaH2PO4, and 10 mM d-glucose adjusted to pH 7.4) and mixed with 26% dextran. The homogenate was centrifuged at 5400 g for 15 min at 4°C. The pellet, which contained the capillaries, and the supernatant, which represented the brain parenchymal/interstitial fluid space, were separated. The ratio of I-SAA1.1 or I-SAA2.1 in the supernatant (parenchyma) was corrected for vascular space by subtracting the ratio of Tc-BSA in the supernatant.
The parenchyma/serum and capillary/serum ratios (μl/g) were calculated as follows:
Determination of I-SAA retention on MW cutoff filters
Mice were intravenously injected with I-SAA1.1 or I-SAA2.1 as previously described, and blood was collected from the carotid artery of 4 mice after 15 min of circulation time and allowed to clot for 20 min at room temperature. Serum was then centrifuged at 2500 g for 10 min, and 50 µl was added to 100-kDa MW cutoff filters (EMD Millipore) that contained room temperature 0.1% BSA in Zlokovic’s buffer (7.19 g/L NaCl, 0.3 g/L KCl, 0.28 g/L CaCl2, 2.1 g/L NaHCO3, 0.16 g/L KH2PO4, 0.17 g/L anhydrous MgCl2, and 0.99 g/L d-glucose, pH 7.4). Twenty microliters of the injectate was added to a filter with 0.1% BSA as a baseline control. Filters were spun at 14,000 g for 10 min, then washed with additional 0.1% BSA solution and respun. CPM that was retained on the filter and in the flow-through was measured, and the CPM that was retained on the filter was recovered by two 0.4-ml washes with 1% BSA in Zlokovic’s buffer, followed by centrifugation of the inverted filters to collect any residual liquid. CPM from filter-recovered material and washed filters was counted to assess sticking, then flow-through and filter-recovered material were acid precipitated to exclude free iodine from calculations. Data from 4 mice were averaged for comparison with a single baseline control.
Statistics
Statistical analyses were performed by using Prism 6.0 (GraphPad Software, La Jolla, CA, USA). Means are reported ± se and compared by 2-way ANOVA followed by Sidak’s multiple comparisons test. Regression lines were computed by using the least-squares method and compared with each other by using Prism 6. Pearson coefficients were calculated in all correlation analyses.
RESULTS
Characterization of pulmonary inflammation
Pulmonary inflammation at 6 or 24 h after O3 exposure was assessed by quantifying total cells, Mϕs, and neutrophils in BAL. No eosinophils or lymphocytes were detected at the time points studied. Representative images of lavage preparations from mice at 24 h postexposure show that neutrophil trafficking to the lungs occurs in O3-exposed mice (Fig. 1A, B). Significant increases in total cells (Fig. 1C) and Mϕs (Fig. 1D) were observed 24 h after O3 exposure, with mean increases of 1.9- and 2.8-fold, respectively, compared with forced air (FA). Neutrophils were never or rarely detected in BAL from FA-exposed mice at 6 and 24 h, respectively. Significant increases in total neutrophils occurred at both 6 and 24 h post-O3 exposure (Fig. 1E).
Figure 1.

Pulmonary inflammation after O3 exposure. A, B) Representative images of cells in BAL 24 h after FA (FA; A) or O3 (B) exposure are shown in the upper panel. Images were captured with a ×40 objective. The arrow in panel B indicates a neutrophil. C–E) Measurements of total cells (C), macrophages (D), and neutrophils (E) in BAL are shown in the lower panel (n = 6–10 animals per group). **P < 0.01, ***P < 0.001.
Measurement of cytokines, chemokines, and acute-phase proteins in blood
To identify which circulating factors could potentially mediate O3-induced CNS effects, we conducted a screen of 23 cytokines in the blood. Cytokines that were included in the screen encompass a variety of functions (pro- and anti-inflammatory cytokines, T-cell cytokines, chemokines, and growth factors) that we reasoned would provide a broad view of O3-indued changes that could contribute to the neuroinflammatory response. Furthermore, we screened for 2 acute-phase proteins that are common to mice and humans: A-SAA and CRP. Of 23 cytokines that were measured in the blood, IL-4, IL-9, and eotaxin/CCL11 levels were below the reliable range of detection and were excluded from analysis. Of cytokines that were detected in-range, significant O3-induced changes were only observed for KC/CXCL1, a neutrophil chemokine in rodents that is functionally similar to human IL-8 (61), and IL-12(p40), a subunit of full-length IL-12(p70) that is a proinflammatory cytokine that stimulates differentiation of CD4+ T cells to the T helper 1 phenotype (62). CXCL1 levels were increased at 6 h post-O3 treatment, but returned to baseline by 24 h (Fig. 2A). IL-12p40 levels were decreased compared with FA at 6 h post-O3 treatment, and this effect was also diminished by 24 h postexposure (Fig. 2B). A-SAA levels were undetectable in all but one serum sample from forced air–treated mice, even when samples were tested at a dilution as low as 1/5, which indicates concentrations <40 ng/ml in most control mice. O3 exposure increased A-SAA serum levels to an average concentration of 4.2 and 9.7 µg/ml in serum by 6 and 24 h, respectively (Fig. 2C). Significant differences in A-SAA levels in blood were found at 24 but not 6 h. CRP levels in the blood were not significantly changed at either time point (Fig. 2D). Because A-SAA increased after O3 exposure, we further analyzed the 6- and 24-h O3-exposed groups to determine whether A-SAA levels in the blood correlated with cell counts in BAL. Figure 3 shows strong, positive correlations for A-SAA and total cell counts (Fig. 3A), Mϕs (Fig. 3B), and neutrophils (Fig. 3C) in the lung 24 h after O3 exposure. There were no significant correlations between A-SAA blood levels and cell counts in BAL at 6 h post-O3 exposure.
Figure 2.

O3-induced changes in inflammatory and acute-phase proteins in serum. A, B) Analytes on a multiplex panel that were found to be significantly changed with O3 treatment include the chemokine CXCL1 (A) and the p40 subunit of IL-12 (B; n = 6/group). C, D) Measurements of A-SAA (C) and CRP (D) in serum were performed by using ELISA (n = 6–10/group). ***P < 0.001.
Figure 3.

Correlation of SAA levels in serum with cellular components of BAL. Serum SAA concentrations were correlated with BAL total cells (A), macrophages (B), and neutrophils (C) in mice 24 h post-O3 exposure (n = 10/group).
Production of SAA in the liver
The liver is the major site of A-SAA production during an acute-phase response (63); therefore, we confirmed that O3 up-regulated A-SAA in the liver. Figure 4A, B shows that mRNA levels of SAA1.1 and 2.1 in liver are increased after O3 exposure. Analysis by immunoblot demonstrated that A-SAA protein was not detectable in FA-treated liver samples, but O3 induced the expression of A-SAA protein (Fig. 4C). A-SAA protein signal in livers from O3-exposed mice was significantly greater than background signal in FA-exposed mice, and A-SAA protein levels were significantly higher 24 h after exposure vs. 6 h (Fig. 4D). Because the proinflammatory cytokines IL-1β, IL-6, and TNF-α are known to induce A-SAA expression, we attempted to detect changes in their mRNA levels in liver; however, IL-6 and TNF-α were undetectable and IL-1β was not significantly increased after O3 exposure (data not shown).
Figure 4.

O3-induced changes in SAA in the liver. A, B) Relative changes in mRNA expression of A-SAA isoforms, SAA1.1 (A) and SAA2.1 (B) were measured by quantitative PCR (n = 6/group). C, D) Western blot of A-SAA in liver homogenates (10 µg protein/well; C) and quantification of relative changes in protein expression (D) are shown (n = 5–6/group). *P < 0.05, **P < 0.01, ***P < 0.001 vs. FA control; ###P < 0.001 vs. group indicated (D).
Assessment of neuroinflammation in vivo
We next sought to determine whether neuroinflammation occurred in our model of O3 exposure by measuring changes in cytokine and chemokine levels and reactive microgliosis in the cerebral cortex. Figure 5A shows Iba-1 staining in the frontal cortex of mice that were infected with a neurovirulent strain of MHV, our positive control for reactive microgliosis (57). In Fig. 5B, little to no Iba-1 signal was detected after 6 or 24 h after FA or O3 exposure, which indicates that reactive microgliosis does not occur in our O3 exposure model, although we did detect expected concentrations of A-SAA in the blood of O3-exposed mice that were used for staining. The same 23-cytokine panel that was used to analyze blood was also used to analyze cytokine and chemokine expression in soluble extracts from the cerebral cortex. Of 23 cytokines measured, IL-1α, IL-6, IL-10, IL-12(p40), IL-12(p70), IL-13, IL-17, IFN-γ, KC, MCP-1, MIP-1β, and TNF-α were detected within the reliable range and included in analysis. Of these cytokines, significant O3-induced decreases were observed for IL-1α at 6 and 24 h post-O3 exposure vs. FA, and for IL-13 at 24 h post-O3 exposure (Fig. 6). Taken together, our inability to observe microgliosis or elevations in proinflammatory cytokines in the brain indicates that a classic neuroinflammatory response did not occur in our acute model of O3 exposure.
Figure 5.

Absence of gliosis after O3 exposure. A) Iba-1–positive microglia (red) and DAPI (blue) observed in the frontal cortex of an MHV-infected mouse, a positive control for microgliosis. B) Representative images of Iba-1–stained frontal cortex of mice 6 or 24 h after FA or O3 exposure. A total of 4 mouse brains were assessed for each group. Images were captured with a ×20 objective.
Figure 6.

Significant changes in cytokines in the cortex. Changes in IL-1α (A) and IL-13 (B) were detected by using a bead-based multiplex assay (n = 6/group). *P < 0.05, **P < 0.01.
BBB transport of SAA
Despite some evidence of local production of A-SAA isoforms in the CNS upon injury and the entry of SAA into the regions of the CNS with a leaky BBB (44, 47, 63), the ability of SAA to cross the BBB has not been assessed. Therefore, we determined whether the individual mouse isoforms of A-SAA, SAA1.1 and 2.1, could cross the intact BBB of unexposed mice. Iodinated SAA1.1 and SAA2.1 (I-SAA1.1 and I-SAA2.1) in solution were first analyzed by size-exclusion chromatography and were both found to elute as a single peak, with retention times indicating that both proteins were monomers. The presence of albumin in solution did not alter the retention time of either I-SAA species, which indicated that no albumin binding occurred. Acid precipitation of brain and serum proteins was conducted to determine the in vivo stability of iodinated SAA1.1 and SAA2.1. Results are shown in Table 2. The proportion of intact I-SAA1.1 and I-SAA2.1 in serum gradually decreased over time, with more intact label observed across time points for I-SAA1.1. In the brain, acid-precipitable I-SAA2.1 accounted for slightly greater than one half of the total radioactivity after 5 min, and no further release of free iodine occurred up to 30 min. Acid-precipitable I-SAA1.1 in the brain showed a much higher proportion of total activity that slowly decreased over 30 min. To account for loss of label, only precipitable activity was included in analysis. Figure 7 shows the clearance of I-SAA1.1 and I-SAA2.1 from serum over time, and data from these curves were used to calculate exposure time for multiple-time regression analysis. SAA1.1 uptake curve was linear for the duration of the study (Fig. 8A), whereas SAA2.1 influx into the CNS plateaued after approximately 15 min of circulation time (Fig. 8B). Ki values were calculated from the first 15 min of circulation time to exclude later time points where deviation from linearity occurred. The albumin Ki for both SAA1.1 and SAA2.1 did not significantly deviate from 0, and y-intercepts, which reflect the vascular space, were within a physiologic range (8–12 µl/g), which indicated that BBB disruption did not occur over the duration of study. Ki for SAA1.1 and SAA2.1 were 0.1003 ± 0.01677 μl/g/min (r2 = 0.7817; df = 10) and 0.5308 ± 0.1004 μl/g/min (r2 = 0.7773; df = 8), respectively (Fig. 8C). There was a significant difference in the Ki of I-SAA1.1 vs. I-SAA2.1 (P < 0.001), and both slopes were significantly nonzero (P < 0.001), which indicated influx. The average percent of CPM per milliliter of serum in 1 g of brain tissue was then calculated at 15-min postinjection time points (0.22% and 1.1% for SAA1.1 and SAA2.1, respectively). To confirm that SAA completely crosses the endothelium into the brain parenchyma, we conducted capillary depletion studies (Fig. 9). After 15 min of circulation time, the percentage of I-SAA1.1 and I-SAA2.1 in the parenchymal fractions was 70.2 and 93.4%, respectively. I- SAA2.1 levels in the parenchyma were significantly greater than I-SAA1.1; therefore, both SAA isoforms traverse the endothelial barrier and enter the brain parenchyma.
TABLE 2.
Percentage of precipitable I-SAA1.1 and I-SAA2.1 in serum and brain relative to processing control
| Time (min) | Serum |
Brain |
||
|---|---|---|---|---|
| I-SAA2.1 | I-SAA1.1 | I-SAA2.1 | I-SAA1.1 | |
| 5 | 74.4 | 101.6 | 54.4 | 106.6 |
| 15 | 66.0 | 97.1 | 60.0 | 94.3 |
| 30 | 57.6 | 89.1 | 56.9 | 75.1 |
Figure 7.

Serum clearance of SAA1.1 and SAA2.1. Data from these plots were used to calculate exposure time.
Figure 8.

Brain uptake of A-SAA isoforms. Thirty-minute uptake curves are plotted for SAA1.1 (open circles; A) and SAA2.1 (filled circles; B). Open and filled squares in panels A and B, respectively, represent data points from albumin uptake curves, which indicate vascular space. Uptake within the first 15 min is plotted in panel C, where the SAA1.1 and SAA2.1 data points were corrected for vascular space by subtracting the albumin brain/serum ratio (δ). Unidirectional influx constants that were calculated from these curves were as follows: 0.1003 ± 0.01677 μl/g/min (r2 = 0.7817; df = 10) and 0.5308 ± 0.1004 μl/g/min (r2 = 0.7773; df = 8) for SAA1.1 and SAA2.1, respectively. Both slopes were significantly nonzero and significantly different from each other. P < 0.001.
Figure 9.

SAA partitioning into capillary and parenchyma. Tissue/serum (T/S) ratios of SAA1.1 and SAA2.1 in the capillary and parenchymal brain fractions after 15 min of circulation time are shown. T/S ratios were corrected for vascular space by subtracting albumin T/S ratios. Percentage of SAA in the capillary fractions were 29.8 and 6.6% for SAA1.1 and SAA2.1, respectively. Percentage of SAA in the parenchymal fractions were 70.2 and 93.4% for SAA1.1 and SAA2.1, respectively. Statistical differences in SAA1.1 and SAA2.1 partitioning were determined. ###P < 0.001 vs. group indicated (n = 3/group).
Association of circulating SAA with high-MW species
HDL binds the vast majority of endogenous circulating SAA1.1 and SAA2.1; therefore, we sought to determine whether recombinant I-SAA1.1 or -SAA2.1 i.v. injected circulates freely or whether it associates with higher-MW species, suggestive of HDL-bound forms. To test this, we harvested serum from I-SAA–injected mice after 15 min of circulation time and separated the serum on centrifugal filters with 100-kDa MW cutoffs. The MW of HDL ranges from 170 to 360 kDa, whereas those for SAA1.1 and SAA2.1 are approximately 12 kDa. Therefore, HDL-bound SAA is expected to be retained on the filter, whereas free SAA should be present in the flow-through. All fractions were acid precipitated to exclude the contribution of free iodine. Our results (Fig. 10) show that 84.61% of I-SAA1.1 input CPM was retained on the filter in the absence of blood. Of input CPM, 36.34% was I-SAA1.1 that stuck to the filter, whereas 48.27% I-SAA1.1 CPM was a recoverable high-MW species. The remaining 15.39% was detected in the flow-though. I-SAA1.1 that was recovered from the blood after i.v. injection partitioned differently from control. The proportion of high-MW I-SAA1.1 increased to 64.43 ± 0.6022%, whereas only 14.87 ± 0.5574% stuck to the filter. The proportion of I-SAA1.1 in the flow-through increased slightly to 20.70 ± 0.8776%. I-SAA2.1 partitioning differed from I-SAA1.1 in both the control and blood-recovered groups. In the blood-free control group, 72.15% of I-SAA2.1 was detected in the flow-through, whereas 12.93% stuck to the filter and 14.92% was recovered as high-MW I-SAA2.1. Conversely, 77.01 ± 0.4604% of blood-recovered I-SAA2.1 partitioned as recovered high-MW species, whereas 5.96 ± 0.1158% stuck to the filter and 17.03 ± 0.4027% was in the flow-through.
Figure 10.

Detection of high-MW (HMW) species of SAA1.1 and SAA2.1. The proportions of I-SAA1.1 (A, B) and I-SAA2.1 (C, D) that are >100 kDa (high MW), <100 kDa (flow-through), or that remained stuck to the filter (filter bound) before (A, C; n = 1/group) or 15 min after (B, D; n = 4/group) intravenous injection in CD1 mice. For the postinjection group, data are the average of 4 biologic replicates.
SAA measurements in brains of O3-exposed mice
Finally, we determined whether O3 increased brain cortical levels of SAA at the mRNA or protein level. Figure 11A shows that cortical levels of SAA2.1 mRNA were not significantly changed by O3 at either time point vs. FA. SAA1.1 mRNA was undetectable in the CNS for all treatments and time points (data not shown). A-SAA protein in the CNS was detectable by Western blot after O3 treatment at both time points, but not in the FA groups (Fig. 11B). A-SAA protein in the cerebral cortices of O3-exposed mice was significantly greater than the background signal in FA-exposed mice in the 24-h group. Furthermore, A-SAA protein levels were significantly higher 24 h after exposure vs. 6 h (Fig. 11C), which is consistent with A-SAA changes in the blood. Because vascular washout was not conducted, we determined whether cortical A-SAA levels in O3-exposed mice were higher than what would be expected from the contribution of the vascular space. We have previously determined that serum components account for approximately 0.02% or 0.2 nl/μg of total protein (64); therefore, we compared SAA levels by Western blot in 2 nl serum vs. 10 µg brain homogenate from 2 O3-exposed mice in the 24-h group. In addition, we loaded 5 and 1 nl of serum to visualize a range of SAA protein levels that are greater or less than the predicted serum contribution to brain SAA. Figure 11D shows that SAA band intensity was either low or undetectable for serum amounts ≤2 nl, and band intensities for SAA in the brain were all higher than the 2 nl serum threshold. These findings, together with data on the BBB transport of SAA in unexposed mice, indicate that A-SAA enters the brain after O3 exposure.
Figure 11.

O3-induced changes in SAA in the brain. A) Relative changes in mRNA expression of acute phase SAA2.1 isoform were determined by quantitative PCR (n = 6/group). SAA1.1 mRNA was undetectable in the brain (data not shown). B, C) Protein levels of A-SAA in protein extracts from the cerebral cortex were determined by Western blot (B), and protein expression was quantified (C; n = 5–6 samples per group). ***P < 0.001 vs. FA; ###P < 0.001 vs. group indicated. D) Verification that A-SAA levels in brain exceed that which would be predicted by vascular space (threshold, 2 nl; shown in red) were determined by Western blot.
DISCUSSION
In this study, we found that A-SAA isoforms 1 and 2 are systemically elevated after acute exposure to O3. Conversely, we did not observe systemic up-regulation of proinflammatory cytokines, nor did we observe evidence of microglia activation in this model. We confirmed that SAA1.1 and SAA2.1 overproduction occurs in the liver, that both isoforms cross the BBB, and that brain cortical pools of A-SAA derive from the blood rather than from local production in the CNS. Furthermore, our findings that blood levels of A-SAA strongly correlate with the number of total cells, neutrophils, and Mϕs in BAL suggest that SAA could be an important mediator at the lung–brain axis after O3 exposure.
Increases in IL-1β, IL-8, and CRP in the blood have been observed in a human study of controlled acute O3 exposure (19), which suggests a potential role for systemic inflammation in the extrapulmonary effects of O3; however, other controlled human exposure studies failed to observe increases in proinflammatory cytokines (65, 66). Inconsistencies in these studies may be attributed to heterogeneity in the human participants studied, their inflammatory responses, and relatively small sample sizes. In addition, O3 exposure in humans results in elevated levels of circulating glucocorticoids (67), which is indicative of the hypothalamic–pituitary–adrenal axis-mediated stress response. Studies in rodents corroborate this latter finding in humans (68–71). In O3-exposed rats, cytokine elevations in the blood were not observed (69). Furthermore, O3-exposed rats do have elevations in CXCL1, CCL2, and IL-10 when glucocorticoid production is pharmacologically suppressed (69); therefore, the immunosuppressive effects of glucocorticoids may limit production of proinflammatory cytokines by O3 and account for some of the variability that has been observed in human participants. Our observation of O3-induced decreases in IL-12p40 may also be a consequence of a stress response, as reduced IL-12 has been observed in a variety of chronic stress paradigms in rodents (72, 73). KC elevations in blood in our model are consistent with neutrophil chemotaxis observed in the lungs. Of note, IL-8, the predominant human neutrophil chemokine and functional homolog of KC, was also elevated in the blood at early time points after controlled human O3 exposure (19). Although our model uses a relatively high concentration of 3 ppm of O3, prior work has shown that there was little effect on total cell count and KC levels in BAL immediately after exposure to 6 ppm of O3 (20), which suggests that the pulmonary phenotype is unlikely to result from nonspecific lung injury.
Our most striking observation regarding O3-induced serum changes was the increase of A-SAA, whose production is largely derived from the liver. Although our assay was not sensitive enough to detect baseline A-SAA levels in the blood from most of our control samples, we can infer from our assay cutoff that our average SAA concentrations in control mice are <40 ng/ml; therefore, A-SAA protein levels increase at least 300-fold after O3 exposure, reaching an average concentration of approximately 10 µg/ml in blood after 24 h. In comparison, A-SAA concentrations measured with the same ELISA as was used in this study can be as high as 1 mg/ml following treatment with a high dose of bacterial lipopolysaccharide. Therefore, O3 induces moderate increases in circulating SAA (unpublished results). Furthermore, we observed strong, positive correlations between total leukocytes, Mϕs, and neutrophils in BAL and A-SAA levels in serum in the O3-exposed group 24 h after exposure. These findings suggest that A-SAA induction could be integral in the response to O3, but also raise the question of whether pulmonary inflammation drives liver production of A-SAA or vice versa. Our findings of no relations of A-SAA in blood and total cells or Mϕs in BAL at 6 h after O3 exposure could be indicative of a temporal lag in sufficient amounts of SAA entering the lungs to induce functional effects. A lack of correlation between A-SAA and neutrophils at 6 h could be further explained by other chemotactic factors that are known to be induced in lungs at earlier time points, preferentially driving initial neutrophil recruitment. One example of such a factor is CXCL1/KC (49). In vitro and in vivo studies using recombinant forms of A-SAA suggest that SAA could contribute to leukocyte trafficking to the airway and other tissues via interactions with scavenger receptors, such as FPR2 (39, 74, 75). Subchronic O3 exposure in mice induces the expression of SAA3 in the lungs, which is associated with IL-6– and IL-17A–dependent neutrophil recruitment (39). Although SAA3 is not expressed in humans, it shares 63 and 65% homology with murine SAA1.1 and SAA2.1, respectively (31). Furthermore, recombinant human A-SAA was found to induce neutrophil recruitment in mouse lungs by an IL-17A–dependent mechanism (74), which suggests that there might be functional overlap of mouse SAA3 and human A-SAA. Conversely, recent work has indicated that the proinflammatory effects of A-SAA are diminished when bound to HDL (76, 77); therefore, the functional relevance of increased circulating HDL-bound A-SAA on neutrophil recruitment remains to be determined. Further characterization of A-SAA functions in the lungs may have clinical relevance, as A-SAA is increased in both the lungs and serum of patients with COPD (34–36).
Another novel finding in this study is that A-SAA crosses the intact BBB. We observed a modest transport rate for both SAA1.1 and SAA2.1 into the CNS in unexposed mice, although SAA2.1 transport was approximately 5 times faster than SAA1.1 within the linear phase. This difference was unexpected, as murine SAA1.1 shares 93% identity with SAA2.1. Specific activities were somewhat higher for I-SAA1.1 vs. I-SAA2.1, and it is possible that differences in iodination of SAA1.1 vs. SAA2.1 could cause differences in their structure or function; however, the number and location of tyrosine residues is identical between proteins, which indicates that structural differences of the unlabeled proteins influence the incorporation of iodine. Despite their sequence similarity, SAA1.1, but not SAA2.1, is found in amyloid A deposits (78); however, endogenous SAA1.1 and SAA2.1 were found to be cleared from the blood at the same rate when measured over a 24-h time course (79). These data suggest that structural differences in SAA1.1 vs. SAA2.1 may influence their BBB transport. Furthermore, after 30 min of circulation time, SAA2.1 transport plateaued, whereas SAA1.1 levels continually increased. This plateau phenomenon can be a sign of concomitant transport in the brain-to-blood direction or transporter inhibition. Both proteins fully crossed the endothelium, which demonstrates that increased CNS accumulation was a result of entry into the CNS, rather than binding to the capillary surface. O3 increased A-SAA protein, but not mRNA, in the CNS, and the levels measured in the brain were greater than that which could be explained by SAA residing in the neurovascular space. Taken together, these findings indicate that SAA from the bloodstream can enter the CNS, and that elevated levels of SAA in the blood contribute to elevated protein levels in the brain after acute O3 exposure. One caveat of our study is that different mouse sexes and strains were used for studies that involved O3 exposure vs. studies that involved BBB transport, as differences in O3-induced pulmonary inflammation have been observed on the basis of mouse gender and strain (80). Therefore, an important future direction is to determine whether A-SAA transport kinetics differ with O3 exposure in female Balb/c mice.
Endogenous A-SAA in the circulation predominantly binds HDL. As monomeric A-SAA is only 12 kDa and HDL is ≥170 kDa, we reasoned that we could distinguish between I-SAA that associates with HDL and I-SAA that does not associate with HDL in the circulation by using MW cutoff filters. Surprisingly, our assay revealed that I-SAA1.1 has distinct properties compared with I-SAA2.1. First, I-SAA1.1 in blood-free solution exists predominantly as a species that seems to be greater than 100 kDa, whereas I-SAA2.1 is predominantly detected below the 100-kDa MW cutoff. We found that both I-SAA1.1 and I-SAA2.1 are exclusively monomeric in the presence and absence of albumin, and all filter studies were conducted within a few hours of labeling at the same temperature and pH used for size-exclusion chromatography. Therefore, it is unlikely that A-SAA multimerization, aggregation, or association with albumin explains the filter retention in our controls. Instead, the apparent retention of I-SAA1.1 was most likely a result of interactions with the filter. I-SAA1.1 that was recovered from the blood showed a greater association with the high-MW fraction that was accompanied by reduced sticking to the filter; therefore, factors in the blood likely inhibit I-SAA1.1 sticking to the filter, but future studies are necessary to determine whether this difference is attributable to HDL binding. A more striking redistribution of I-SAA2.1 from low- to high-MW species was evident after recovery from blood, which suggests that intravenously-injected I-SAA2.1 in the circulation is predominantly bound to HDL. Of importance, the different binding and partitioning properties of I-SAA1.1 vs. I-SAA2.1 indicate that there are biophysical differences between these proteins that could cause differences in their transport rates across the BBB.
This observation raises an important question regarding the role of HDL in modulating SAA transport across the BBB. Whole lipoprotein particles in the circulation are not thought to cross the BBB, as early tracer studies were not able to detect cholesterol from peripherally derived sources in the CNS (81). Instead, HDL-like particles are produced locally in the CNS by glia, and these particles predominantly mediate cholesterol transport in the CNS compartment (82); however, ApoAI—the major lipoprotein of HDL under physiologic conditions—is derived from the circulation via transport across brain barriers (83). The mechanism of ApoAI transport across the BBB has not been clearly identified in vivo, but in vitro studies indicate that scavenger receptor class B type I could mediate the transport of HDL lipoproteins (84). Both ApoAI and A-SAA are substrates for SR-BI (85), which further suggests that SR-BI could mediate the transport of both proteins across the BBB. Another mechanism of A-SAA transport could involve its binding to vascular proteoglycans (86). Of importance, this mechanism of CNS uptake would be distinct from that of ApoAI, which lacks proteoglycan binding moieties (86). Further work is necessary to elucidate the mechanism of A-SAA transport across the BBB and whether differences in transporter affinities could explain the differences that have been observed in kinetics of SAA1 vs. SAA2 transport.
In our O3 exposure paradigm, we did not observe the hallmarks of neuroinflammation, such as reactive gliosis or up-regulation of proinflammatory cytokines in the brain. This is seemingly in contrast to the findings of other groups, who have reported that reactive microgliosis or the induction of proinflammatory cytokines in the brain occurs in O3-exposed rats (9, 87). It is possible that species differences could account for different neuroinflammatory responses, and a potentially important difference in rats vs. mice is that SAA is not a major acute-phase protein in rats (31); however, a recent study by Mumaw et al. (8) reported an observation of microgliosis in O3-exposed mice. Differences in exposure paradigm or mouse strain may account for this discrepancy. Our exposure paradigm used a higher concentration of O3 (3 ppm vs. 1 ppm) for a shorter period of time (2 vs. 4 h); however, we used this paradigm because it was previously found to be optimal by our group to elicit robust pulmonary neutrophilia (49). C57BL/6 mice have distinct pulmonary responses to O3 compared with the Balb/c strain used in our study. One important difference is that Balb/c mice have increased O3-induced leukocyte recruitment to the lungs (49), which suggests that they might also have higher levels of circulating A-SAA on the basis of our correlation analysis. Of note, Mumaw et al. found that CD36−/− mice had exacerbated neuroinflammation, and CD36 is a receptor for recombinant SAA (77). Although HDL binding inhibited SAA-induced IL-8 secretion in CD36-overexpressing cells (77), it is unclear whether CNS-derived, HDL-like particles can bind SAA and/or inhibit the proinflammatory functions of A-SAA. Mouse SAA3, which is thought to have some functional overlap with extrahepatically expressed human SAA1/SAA2, is up-regulated in the CNS after an acute inflammatory insult. Recently, it has been found that mice that lack SAA3 express lower CNS levels of the anti-inflammatory cytokine, IL-10, after LPS treatment (41), which indicates that endogenous mouse SAA3 has immunomodulatory functions. Additional studies are necessary to determine whether endogenous SAA1 or SAA2 also have immunomodulatory functions in the CNS.
An important future direction of our work is to determine the functional consequences of A-SAA up-regulation in the brain after O3 exposure. A-SAA can deposit in the brain during pathologic conditions, such as dementia and stroke, and these conditions have also been associated with O3 exposure (3, 5–7). A-SAA is found in the frontal cortices and white matter of patients with Alzheimer’s disease (43, 44) and may contribute to decreased amyloid-β clearance by displacing ApoE binding to HDL (88). A-SAA deposits in the CNS neurovasculature are also observed in systemic amyloidosis and hypertension (45–47), the latter being a risk factor for Alzheimer’s disease. Recently, it was found that hepatic overexpression of A-SAA caused neurovascular pathologies and depressive-like symptoms in 9-mo-old transgenic mice. Of importance, liver-derived A-SAA was detectable in brains in the absence of any severe BBB disruption, which was measured by Evan’s blue dye extravasation (48); therefore, an important future direction is to determine whether A-SAA contributes to CNS pathologies, such as cognitive impairment and neurovascular damage, after O3 exposure. In summary, our findings indicate that A-SAA could be an important mediator of the effects of O3 in both the lungs and the brain and that future studies are warranted to investigate the mechanistic roles by which A-SAA contributes to both pulmonary and CNS dysfunction.
ACKNOWLEDGMENTS
This work was supported by the U. S. National Institutes of Health (NIH) National Institute of Environmental Health Sciences (Grants T32ES019851 to M.A.E. and J.J., and F32ES025076 to M.A.E.), NIH National Institute of Neurological Disorders and Stroke (Grant R21NS093368 to W.A.B. and T.S.S.), NIH National Institute on Aging (Grant T32AG000057 to E.M.R.); and NIH National Institute of Mental Health (Grants R01MH106967 to K.L.J.-S. and P30ES013508 to R.A.P.).
Glossary
- A-SAA
acute-phase serum amyloid A
- BAL
bronchoalveolar lavage
- BBB
blood-brain barrier
- BSA
bovine serum albumin
- COPD
chronic obstructive pulmonary disease
- CPM, counts per minute; CRP
C-reactive protein
- Iba-1
ionized calcium-binding adaptor molecule-1
- LR
lactated Ringer’s
- Mϕ
macrophage
- MIP
macrophage inflammatory protein
AUTHOR CONTRIBUTIONS
M. A. Erickson designed research, performed research, analyzed data, wrote the paper; J. Jude designed research, performed research, analyzed data, and contributed to writing the paper; H. Zhao performed research and analyzed data; E. M. Rhea performed research, analyzed data, and contributed to writing the paper; T. S. Salameh performed research and analyzed data; W. Jester designed research; S. Pu performed research and analyzed data; J. Harowitz performed research and analyzed data; N. Nguynen performed research; W. A. Banks designed research, supervised research and data analysis, and contributed to writing the paper; R. A. Panettieri Jr. designed research, supervised research and data analysis, and contributed to writing the paper; and K. J. Jordan-Sciutto designed research, supervised research and data analysis, and contributed to writing the paper.
REFERENCES
- 1.Lelieveld J., Evans J. S., Fnais M., Giannadaki D., and Pozzer A. (2015) The contribution of outdoor air pollution sources to premature mortality on a global scale. Nature 525, 367–371 [DOI] [PubMed] [Google Scholar]
- 2.Chen J. C., and Schwartz J. (2009) Neurobehavioral effects of ambient air pollution on cognitive performance in US adults. Neurotoxicology 30, 231–239 [DOI] [PubMed] [Google Scholar]
- 3.Jung C. R., Lin Y. T., and Hwang B. F. (2015) Ozone, particulate matter, and newly diagnosed Alzheimer’s disease: a population-based cohort study in Taiwan. J. Alzheimers Dis. 44, 573–584 [DOI] [PubMed] [Google Scholar]
- 4.Wu Y. C., Lin Y. C., Yu H. L., Chen J. H., Chen T. F., Sun Y., Wen L. L., Yip P. K., Chu Y. M., and Chen Y. C. (2015) Association between air pollutants and dementia risk in the elderly. Alzheimers Dement. (Amst.) 1, 220–228 [DOI] [PMC free article] [PubMed] [Google Scholar]
- 5.Montresor-López J. A., Yanosky J. D., Mittleman M. A., Sapkota A., He X., Hibbert J. D., Wirth M. D., and Puett R. C. (2016) Short-term exposure to ambient ozone and stroke hospital admission: a case-crossover analysis. J. Expo. Sci. Environ. Epidemiol. 26, 162–166 [DOI] [PubMed] [Google Scholar]
- 6.Suissa L., Fortier M., Lachaud S., Staccini P., and Mahagne M. H. (2013) Ozone air pollution and ischaemic stroke occurrence: a case-crossover study in Nice, France. BMJ Open 3, e004060. [DOI] [PMC free article] [PubMed] [Google Scholar]
- 7.Xu X., Sun Y., Ha S., Talbott E. O., and Lissaker C. T. (2013) Association between ozone exposure and onset of stroke in Allegheny County, Pennsylvania, USA, 1994-2000. Neuroepidemiology 41, 2–6 [DOI] [PubMed] [Google Scholar]
- 8.Mumaw C. L., Levesque S., McGraw C., Robertson S., Lucas S., Stafflinger J. E., Campen M. J., Hall P., Norenberg J. P., Anderson T., Lund A. K., McDonald J. D., Ottens A. K., and Block M. L. (2016) Microglial priming through the lung-brain axis: the role of air pollution-induced circulating factors. FASEB J. 30, 1880–1891 [DOI] [PMC free article] [PubMed] [Google Scholar]
- 9.González-Guevara E., Martínez-Lazcano J. C., Custodio V., Hernández-Cerón M., Rubio C., and Paz C. (2014) Exposure to ozone induces a systemic inflammatory response: possible source of the neurological alterations induced by this gas. Inhal. Toxicol. 26, 485–491 [DOI] [PubMed] [Google Scholar]
- 10.Akhter H., Ballinger C., Liu N., van Groen T., Postlethwait E. M., and Liu R. M. (2015) Cyclic ozone exposure induces gender-dependent neuropathology and memory decline in an animal model of Alzheimer’s disease. Toxicol. Sci. 147, 222–234 [DOI] [PMC free article] [PubMed] [Google Scholar]
- 11.Rivas-Arancibia S., Guevara-Guzmán R., López-Vidal Y., Rodríguez-Martínez E., Zanardo-Gomes M., Angoa-Pérez M., and Raisman-Vozari R. (2010) Oxidative stress caused by ozone exposure induces loss of brain repair in the hippocampus of adult rats. Toxicol. Sci. 113, 187–197 [DOI] [PubMed] [Google Scholar]
- 12.Calderón-Garcidueñas L., Solt A. C., Henríquez-Roldán C., Torres-Jardón R., Nuse B., Herritt L., Villarreal-Calderón R., Osnaya N., Stone I., García R., Brooks D. M., González-Maciel A., Reynoso-Robles R., Delgado-Chávez R., and Reed W. (2008) Long-term air pollution exposure is associated with neuroinflammation, an altered innate immune response, disruption of the blood-brain barrier, ultrafine particulate deposition, and accumulation of amyloid beta-42 and alpha-synuclein in children and young adults. Toxicol. Pathol. 36, 289–310 [DOI] [PubMed] [Google Scholar]
- 13.Hernández-Zimbrón L. F., and Rivas-Arancibia S. (2016) Syntaxin 5 overexpression and β-amyloid 1-42 accumulation in endoplasmic reticulum of hippocampal cells in rat brain induced by ozone exposure. BioMed Res. Int. 2016, 2125643. [DOI] [PMC free article] [PubMed] [Google Scholar]
- 14.Hernández-Zimbrón L. F., and Rivas-Arancibia S. (2015) Oxidative stress caused by ozone exposure induces β-amyloid 1-42 overproduction and mitochondrial accumulation by activating the amyloidogenic pathway. Neuroscience 304, 340–348 [DOI] [PubMed] [Google Scholar]
- 15.Rivas-Arancibia S., Zimbrón L. F., Rodríguez-Martínez E., Maldonado P. D., Borgonio Pérez G., and Sepúlveda-Parada M. (2015) Oxidative stress-dependent changes in immune responses and cell death in the substantia nigra after ozone exposure in rat. Front. Aging Neurosci. 7, 65. [DOI] [PMC free article] [PubMed] [Google Scholar]
- 16.Pryor W. A. (1992) How far does ozone penetrate into the pulmonary air/tissue boundary before it reacts? Free Radic. Biol. Med. 12, 83–88 [DOI] [PubMed] [Google Scholar]
- 17.Cueto R., Squadrito G. L., Bermudez E., and Pryor W. A. (1992) Identification of heptanal and nonanal in bronchoalveolar lavage from rats exposed to low levels of ozone. Biochem. Biophys. Res. Commun. 188, 129–134 [DOI] [PubMed] [Google Scholar]
- 18.Pryor W. A., Squadrito G. L., and Friedman M. (1995) The cascade mechanism to explain ozone toxicity: the role of lipid ozonation products. Free Radic. Biol. Med. 19, 935–941 [DOI] [PubMed] [Google Scholar]
- 19.Devlin R. B., Duncan K. E., Jardim M., Schmitt M. T., Rappold A. G., and Diaz-Sanchez D. (2012) Controlled exposure of healthy young volunteers to ozone causes cardiovascular effects. Circulation 126, 104–111 [DOI] [PubMed] [Google Scholar]
- 20.Cooper P. R., Mesaros A. C., Zhang J., Christmas P., Stark C. M., Douaidy K., Mittelman M. A., Soberman R. J., Blair I. A., and Panettieri R. A. (2010) 20-HETE mediates ozone-induced, neutrophil-independent airway hyper-responsiveness in mice. PLoS One 5, e10235. [DOI] [PMC free article] [PubMed] [Google Scholar]
- 21.Uhlson C., Harrison K., Allen C. B., Ahmad S., White C. W., and Murphy R. C. (2002) Oxidized phospholipids derived from ozone-treated lung surfactant extract reduce macrophage and epithelial cell viability. Chem. Res. Toxicol. 15, 896–906 [DOI] [PubMed] [Google Scholar]
- 22.Bhalla D. K. (1999) Ozone-induced lung inflammation and mucosal barrier disruption: toxicology, mechanisms, and implications. J. Toxicol. Environ. Health B Crit. Rev. 2, 31–86 [DOI] [PubMed] [Google Scholar]
- 23.Block M. L., and Calderón-Garcidueñas L. (2009) Air pollution: mechanisms of neuroinflammation and CNS disease. Trends Neurosci. 32, 506–516 [DOI] [PMC free article] [PubMed] [Google Scholar]
- 24.Ying Z., Allen K., Zhong J., Chen M., Williams K. M., Wagner J. G., Lewandowski R., Sun Q., Rajagopalan S., and Harkema J. R. (2016) Subacute inhalation exposure to ozone induces systemic inflammation but not insulin resistance in a diabetic mouse model. Inhal. Toxicol. 28, 155–163 [DOI] [PMC free article] [PubMed] [Google Scholar]
- 25.Laskin D. L., Pendino K. J., Punjabi C. J., Rodriguez del Valle M., and Laskin J. D. (1994) Pulmonary and hepatic effects of inhaled ozone in rats. Environ. Health Perspect. 102(Suppl. 10), 61–64 [DOI] [PMC free article] [PubMed] [Google Scholar]
- 26.Abbott N. J., Patabendige A. A., Dolman D. E., Yusof S. R., and Begley D. J. (2010) Structure and function of the blood-brain barrier. Neurobiol. Dis. 37, 13–25 [DOI] [PubMed] [Google Scholar]
- 27.Banks W. A. (2015) The blood-brain barrier in neuroimmunology: tales of separation and assimilation. Brain Behav. Immun. 44, 1–8 [DOI] [PMC free article] [PubMed] [Google Scholar]
- 28.Cray C., Zaias J., and Altman N. H. (2009) Acute phase response in animals: a review. Comp. Med. 59, 517–526 [PMC free article] [PubMed] [Google Scholar]
- 29.De Buck M., Gouwy M., Wang J. M., Van Snick J., Opdenakker G., Struyf S., and Van Damme J. (2016) Structure and expression of different serum amyloid A (SAA) variants and their concentration-dependent functions during host insults. Curr. Med. Chem. 23, 1725–1755 [DOI] [PMC free article] [PubMed] [Google Scholar]
- 30.Benditt E. P., Eriksen N., and Hanson R. H. (1979) Amyloid protein SAA is an apoprotein of mouse plasma high density lipoprotein. Proc. Natl. Acad. Sci. USA 76, 4092–4096 [DOI] [PMC free article] [PubMed] [Google Scholar]
- 31.Uhlar C. M., and Whitehead A. S. (1999) Serum amyloid A, the major vertebrate acute-phase reactant. Eur. J. Biochem. 265, 501–523 [DOI] [PubMed] [Google Scholar]
- 32.Chiba T., Han C. Y., Vaisar T., Shimokado K., Kargi A., Chen M. H., Wang S., McDonald T. O., O’Brien K. D., Heinecke J. W., and Chait A. (2009) Serum amyloid A3 does not contribute to circulating SAA levels. J. Lipid Res. 50, 1353–1362 [DOI] [PMC free article] [PubMed] [Google Scholar]
- 33.Gillmore J. D., Lovat L. B., Persey M. R., Pepys M. B., and Hawkins P. N. (2001) Amyloid load and clinical outcome in AA amyloidosis in relation to circulating concentration of serum amyloid A protein. Lancet 358, 24–29 [DOI] [PubMed] [Google Scholar]
- 34.Bozinovski S., Hutchinson A., Thompson M., Macgregor L., Black J., Giannakis E., Karlsson A. S., Silvestrini R., Smallwood D., Vlahos R., Irving L. B., and Anderson G. P. (2008) Serum amyloid a is a biomarker of acute exacerbations of chronic obstructive pulmonary disease. Am. J. Respir. Crit. Care Med. 177, 269–278 [DOI] [PubMed] [Google Scholar]
- 35.López-Campos J. L., Calero C., Rojano B., López-Porras M., Sáenz-Coronilla J., Blanco A. I., Sánchez-López V., Tobar D., Montes-Worboys A., and Arellano E. (2013) C-reactive protein and serum amyloid a overexpression in lung tissues of chronic obstructive pulmonary disease patients: a case-control study. Int. J. Med. Sci. 10, 938–947 [DOI] [PMC free article] [PubMed] [Google Scholar]
- 36.Bozinovski S., Uddin M., Vlahos R., Thompson M., McQualter J. L., Merritt A. S., Wark P. A., Hutchinson A., Irving L. B., Levy B. D., and Anderson G. P. (2012) Serum amyloid A opposes lipoxin A4 to mediate glucocorticoid refractory lung inflammation in chronic obstructive pulmonary disease. Proc. Natl. Acad. Sci. USA 109, 935–940 [DOI] [PMC free article] [PubMed] [Google Scholar]
- 37.Pirozzi C., Sturrock A., Weng H. Y., Greene T., Scholand M. B., Kanner R., and Paine R., III (2015) Effect of naturally occurring ozone air pollution episodes on pulmonary oxidative stress and inflammation. Int. J. Environ. Res. Public Health 12, 5061–5075 [DOI] [PMC free article] [PubMed] [Google Scholar]
- 38.Li F., Wiegman C., Seiffert J. M., Zhu J., Clarke C., Chang Y., Bhavsar P., Adcock I., Zhang J., Zhou X., and Chung K. F. (2013) Effects of N-acetylcysteine in ozone-induced chronic obstructive pulmonary disease model. PLoS One 8, e80782. [DOI] [PMC free article] [PubMed] [Google Scholar]
- 39.Kasahara D. I., Kim H. Y., Mathews J. A., Verbout N. G., Williams A. S., Wurmbrand A. P., Ninin F. M., Neto F. L., Benedito L. A., Hug C., Umetsu D. T., and Shore S. A. (2014) Pivotal role of IL-6 in the hyperinflammatory responses to subacute ozone in adiponectin-deficient mice. Am. J. Physiol. Lung Cell. Mol. Physiol. 306, L508–L520 [DOI] [PMC free article] [PubMed] [Google Scholar]
- 40.Yu Y., Liu J., Li S. Q., Peng L., and Ye R. D. (2014) Serum amyloid a differentially activates microglia and astrocytes via the PI3K pathway. J. Alzheimers Dis. 38, 133–144 [DOI] [PubMed] [Google Scholar]
- 41.Liu J., Wang D., Li S. Q., Yu Y., and Ye R. D. (2016) Suppression of LPS-induced tau hyperphosphorylation by serum amyloid A. J. Neuroinflammation 13, 28. [DOI] [PMC free article] [PubMed] [Google Scholar]
- 42.Iqbal K., Liu F., Gong C. X., and Grundke-Iqbal I. (2010) Tau in Alzheimer disease and related tauopathies. Curr. Alzheimer Res. 7, 656–664 [DOI] [PMC free article] [PubMed] [Google Scholar]
- 43.Chung T. F., Sipe J. D., McKee A., Fine R. E., Schreiber B. M., Liang J. S., and Johnson R. J. (2000) Serum amyloid A in Alzheimer’s disease brain is predominantly localized to myelin sheaths and axonal membrane. Amyloid 7, 105–110 [DOI] [PubMed] [Google Scholar]
- 44.Liang J. S., Sloane J. A., Wells J. M., Abraham C. R., Fine R. E., and Sipe J. D. (1997) Evidence for local production of acute phase response apolipoprotein serum amyloid A in Alzheimer’s disease brain. Neurosci. Lett. 225, 73–76 [DOI] [PubMed] [Google Scholar]
- 45.Bartolák-Suki E., Sipe J. D., Fine R. E., Rosene D. L., and Moss M. B. (2000) Serum amyloid A is present in the capillaries and microinfarcts of hypertensive monkey brain: an immunohistochemical study. Amyloid 7, 111–117 [DOI] [PubMed] [Google Scholar]
- 46.Guo J. T., Yu J., Grass D., de Beer F. C., and Kindy M. S. (2002) Inflammation-dependent cerebral deposition of serum amyloid a protein in a mouse model of amyloidosis. J. Neurosci. 22, 5900–5909 [DOI] [PMC free article] [PubMed] [Google Scholar]
- 47.Schröder R., and Linke R. P. (1999) Cerebrovascular involvement in systemic AA and AL amyloidosis: a clear haematogenic pattern. Virchows Arch. 434, 551–560 [DOI] [PubMed] [Google Scholar]
- 48.Jang W. Y., Lee B. R., Jeong J., Sung Y., Choi M., Song P., Kim H., Jang S., Kim H., Joo K. I., Lee J. W., Choo Y. S., Kim E., and Ryoo Z. Y. (2017) Overexpression of serum amyloid a 1 induces depressive-like behavior in mice. Brain Res. 1654, 55–65 [DOI] [PubMed] [Google Scholar]
- 49.Kierstein S., Poulain F. R., Cao Y., Grous M., Mathias R., Kierstein G., Beers M. F., Salmon M., Panettieri R. A., Jr., and Haczku A. (2006) Susceptibility to ozone-induced airway inflammation is associated with decreased levels of surfactant protein D. Respir. Res. 7, 85. [DOI] [PMC free article] [PubMed] [Google Scholar]
- 50.Banks W. A., Kastin A. J., Fasold M. B., Barrera C. M., and Augereau G. (1988) Studies of the slow bidirectional transport of iron and transferrin across the blood-brain barrier. Brain Res. Bull. 21, 881–885 [DOI] [PubMed] [Google Scholar]
- 51.Banks W. A. (2011) Measurement of phosphorothioate oligodeoxynucleotide antisense transport across the blood-brain barrier. Methods Mol. Biol. 789, 337–342 [DOI] [PubMed] [Google Scholar]
- 52.Wynendaele E., Verbeke F., Stalmans S., Gevaert B., Janssens Y., Van De Wiele C., Peremans K., Burvenich C., and De Spiegeleer B. (2015) Quorum sensing peptides selectively penetrate the blood-brain barrier. PLoS One 10, e0142071. [DOI] [PMC free article] [PubMed] [Google Scholar]
- 53.Kierstein S., Krytska K., Sharma S., Amrani Y., Salmon M., Panettieri R. A., Jr., Zangrilli J., and Haczku A. (2008) Ozone inhalation induces exacerbation of eosinophilic airway inflammation and hyperresponsiveness in allergen-sensitized mice. Allergy 63, 438–446 [DOI] [PubMed] [Google Scholar]
- 54.Hatch G. E., Slade R., Harris L. P., McDonnell W. F., Devlin R. B., Koren H. S., Costa D. L., and McKee J. (1994) Ozone dose and effect in humans and rats. A comparison using oxygen-18 labeling and bronchoalveolar lavage. Am. J. Respir. Crit. Care Med. 150, 676–683 [DOI] [PubMed] [Google Scholar]
- 55.Slade R., Stead A. G., Graham J. A., and Hatch G. E. (1985) Comparison of lung antioxidant levels in humans and laboratory animals. Am. Rev. Respir. Dis. 131, 742–746 [DOI] [PubMed] [Google Scholar]
- 56.Sipe J. (1999) Revised nomenclature for serum amyloid A (SAA). Nomenclature Committee of the International Society of Amyloidosis. Part 2. Amyloid 6, 67–70 [DOI] [PubMed] [Google Scholar]
- 57.Bender S. J., Phillips J. M., Scott E. P., and Weiss S. R. (2010) Murine coronavirus receptors are differentially expressed in the central nervous system and play virus strain-dependent roles in neuronal spread. J. Virol. 84, 11030–11044 [DOI] [PMC free article] [PubMed] [Google Scholar]
- 58.Blasberg R. G., Fenstermacher J. D., and Patlak C. S. (1983) Transport of alpha-aminoisobutyric acid across brain capillary and cellular membranes. J. Cereb. Blood Flow Metab. 3, 8–32 [DOI] [PubMed] [Google Scholar]
- 59.Kastin A. J., Akerstrom V., and Pan W. (2001) Validity of multiple-time regression analysis in measurement of tritiated and iodinated leptin crossing the blood-brain barrier: meaningful controls. Peptides 22, 2127–2136 [DOI] [PubMed] [Google Scholar]
- 60.Patlak C. S., Blasberg R. G., and Fenstermacher J. D. (1983) Graphical evaluation of blood-to-brain transfer constants from multiple-time uptake data. J. Cereb. Blood Flow Metab. 3, 1–7 [DOI] [PubMed] [Google Scholar]
- 61.Bozic C. R., Gerard N. P., von Uexkull-Guldenband C., Kolakowski L. F., Jr., Conklyn M. J., Breslow R., Showell H. J., and Gerard C. (1994) The murine interleukin 8 type B receptor homologue and its ligands. Expression and biological characterization. J. Biol. Chem. 269, 29355–29358 [PubMed] [Google Scholar]
- 62.Vignali D. A., and Kuchroo V. K. (2012) IL-12 family cytokines: immunological playmakers. Nat. Immunol. 13, 722–728 [DOI] [PMC free article] [PubMed] [Google Scholar]
- 63.Zhang N., Ahsan M. H., Purchio A. F., and West D. B. (2005) Serum amyloid A-luciferase transgenic mice: response to sepsis, acute arthritis, and contact hypersensitivity and the effects of proteasome inhibition. J. Immunol. 174, 8125–8134 [DOI] [PubMed] [Google Scholar]
- 64.Erickson M. A., and Banks W. A. (2011) Cytokine and chemokine responses in serum and brain after single and repeated injections of lipopolysaccharide: multiplex quantification with path analysis. Brain Behav. Immun. 25, 1637–1648 [DOI] [PMC free article] [PubMed] [Google Scholar]
- 65.Kahle J. J., Neas L. M., Devlin R. B., Case M. W., Schmitt M. T., Madden M. C., and Diaz-Sanchez D. (2015) Interaction effects of temperature and ozone on lung function and markers of systemic inflammation, coagulation, and fibrinolysis: a crossover study of healthy young volunteers. Environ. Health Perspect. 123, 310–316 [DOI] [PMC free article] [PubMed] [Google Scholar]
- 66.Goodman J. E., Prueitt R. L., Sax S. N., Pizzurro D. M., Lynch H. N., Zu K., and Venditti F. J. (2015) Ozone exposure and systemic biomarkers: evaluation of evidence for adverse cardiovascular health impacts. Crit. Rev. Toxicol. 45, 412–452 [DOI] [PubMed] [Google Scholar]
- 67.Miller D. B., Ghio A. J., Karoly E. D., Bell L. N., Snow S. J., Madden M. C., Soukup J., Cascio W. E., Gilmour M. I., and Kodavanti U. P. (2016) Ozone exposure increases circulating stress hormones and lipid metabolites in humans. Am. J. Respir. Crit. Care Med. 193, 1382–1391 [DOI] [PMC free article] [PubMed] [Google Scholar]
- 68.Thomson E. M., Vladisavljevic D., Mohottalage S., Kumarathasan P., and Vincent R. (2013) Mapping acute systemic effects of inhaled particulate matter and ozone: multiorgan gene expression and glucocorticoid activity. Toxicol. Sci. 135, 169–181 [DOI] [PMC free article] [PubMed] [Google Scholar]
- 69.Thomson E. M., Pal S., Guénette J., Wade M. G., Atlas E., Holloway A. C., Williams A., and Vincent R. (2016) Ozone inhalation provokes glucocorticoid-dependent and -independent effects on inflammatory and metabolic pathways. Toxicol. Sci. 152, 17–28 [DOI] [PubMed] [Google Scholar]
- 70.Miller D. B., Karoly E. D., Jones J. C., Ward W. O., Vallanat B. D., Andrews D. L., Schladweiler M. C., Snow S. J., Bass V. L., Richards J. E., Ghio A. J., Cascio W. E., Ledbetter A. D., and Kodavanti U. P. (2015) Inhaled ozone (O3)-induces changes in serum metabolomic and liver transcriptomic profiles in rats. Toxicol. Appl. Pharmacol. 286, 65–79 [DOI] [PMC free article] [PubMed] [Google Scholar]
- 71.Gackière F., Saliba L., Baude A., Bosler O., and Strube C. (2011) Ozone inhalation activates stress-responsive regions of the CNS. J. Neurochem. 117, 961–972 [DOI] [PubMed] [Google Scholar]
- 72.Shaashua L., Sominsky L., Levi B., Sorski L., Reznick M., Page G. G., and Ben-Eliyahu S. (2012) In vivo suppression of plasma IL-12 levels by acute and chronic stress paradigms: potential mediating mechanisms and sex differences. Brain Behav. Immun. 26, 996–1005 [DOI] [PMC free article] [PubMed] [Google Scholar]
- 73.Shaashua L., Rosenne E., Neeman E., Sorski L., Sominsky L., Matzner P., Page G. G., and Ben-Eliyahu S. (2014) Plasma IL-12 levels are suppressed in vivo by stress and surgery through endogenous release of glucocorticoids and prostaglandins but not catecholamines or opioids. Psychoneuroendocrinology 42, 11–23 [DOI] [PMC free article] [PubMed] [Google Scholar]
- 74.Anthony D., Seow H. J., Uddin M., Thompson M., Dousha L., Vlahos R., Irving L. B., Levy B. D., Anderson G. P., and Bozinovski S. (2013) Serum amyloid A promotes lung neutrophilia by increasing IL-17A levels in the mucosa and γδ T cells. Am. J. Respir. Crit. Care Med. 188, 179–186 [DOI] [PMC free article] [PubMed] [Google Scholar]
- 75.De Buck M., Berghmans N., Pörtner N., Vanbrabant L., Cockx M., Struyf S., Opdenakker G., Proost P., Van Damme J., and Gouwy M. (2015) Serum amyloid A1α induces paracrine IL-8/CXCL8 via TLR2 and directly synergizes with this chemokine via CXCR2 and formyl peptide receptor 2 to recruit neutrophils. J. Leukoc. Biol. 98, 1049–1060 [DOI] [PubMed] [Google Scholar]
- 76.Kim M. H., de Beer M. C., Wroblewski J. M., Webb N. R., and de Beer F. C. (2013) SAA does not induce cytokine production in physiological conditions. Cytokine 61, 506–512 [DOI] [PMC free article] [PubMed] [Google Scholar]
- 77.Baranova I. N., Bocharov A. V., Vishnyakova T. G., Kurlander R., Chen Z., Fu D., Arias I. M., Csako G., Patterson A. P., and Eggerman T. L. (2010) CD36 is a novel serum amyloid A (SAA) receptor mediating SAA binding and SAA-induced signaling in human and rodent cells. J. Biol. Chem. 285, 8492–8506 [DOI] [PMC free article] [PubMed] [Google Scholar]
- 78.Yu J., Zhu H., Guo J. T., de Beer F. C., and Kindy M. S. (2000) Expression of mouse apolipoprotein SAA1.1 in CE/J mice: isoform-specific effects on amyloidogenesis. Lab. Invest. 80, 1797–1806 [DOI] [PubMed] [Google Scholar]
- 79.Kim M. H., de Beer M. C., Wroblewski J. M., Charnigo R. J., Ji A., Webb N. R., de Beer F. C., and van der Westhuyzen D. R. (2016) Impact of individual acute phase serum amyloid A isoforms on HDL metabolism in mice. J. Lipid Res. 57, 969–979 [DOI] [PMC free article] [PubMed] [Google Scholar]
- 80.Vancza E. M., Galdanes K., Gunnison A., Hatch G., and Gordon T. (2009) Age, strain, and gender as factors for increased sensitivity of the mouse lung to inhaled ozone. Toxicol. Sci. 107, 535–543 [DOI] [PMC free article] [PubMed] [Google Scholar]
- 81.Björkhem I., and Meaney S. (2004) Brain cholesterol: long secret life behind a barrier. Arterioscler. Thromb. Vasc. Biol. 24, 806–815 [DOI] [PubMed] [Google Scholar]
- 82.Mahley R. W. (2016) Central nervous system lipoproteins: apoE and regulation of cholesterol metabolism. Arterioscler. Thromb. Vasc. Biol. 36, 1305–1315 [DOI] [PMC free article] [PubMed] [Google Scholar]
- 83.Stukas S., Robert J., Lee M., Kulic I., Carr M., Tourigny K., Fan J., Namjoshi D., Lemke K., DeValle N., Chan J., Wilson T., Wilkinson A., Chapanian R., Kizhakkedathu J. N., Cirrito J. R., Oda M. N., and Wellington C. L. (2014) Intravenously injected human apolipoprotein A-I rapidly enters the central nervous system via the choroid plexus. J. Am. Heart Assoc. 3, e001156. [DOI] [PMC free article] [PubMed] [Google Scholar]
- 84.Balazs Z., Panzenboeck U., Hammer A., Sovic A., Quehenberger O., Malle E., and Sattler W. (2004) Uptake and transport of high-density lipoprotein (HDL) and HDL-associated alpha-tocopherol by an in vitro blood-brain barrier model. J. Neurochem. 89, 939–950 [DOI] [PubMed] [Google Scholar]
- 85.Cai L., de Beer M. C., de Beer F. C., and van der Westhuyzen D. R. (2005) Serum amyloid A is a ligand for scavenger receptor class B type I and inhibits high density lipoprotein binding and selective lipid uptake. J. Biol. Chem. 280, 2954–2961 [DOI] [PubMed] [Google Scholar]
- 86.Chiba T., Chang M. Y., Wang S., Wight T. N., McMillen T. S., Oram J. F., Vaisar T., Heinecke J. W., De Beer F. C., De Beer M. C., and Chait A. (2011) Serum amyloid A facilitates the binding of high-density lipoprotein from mice injected with lipopolysaccharide to vascular proteoglycans. Arterioscler. Thromb. Vasc. Biol. 31, 1326–1332 [DOI] [PMC free article] [PubMed] [Google Scholar]
- 87.Thomson E. M., Kumarathasan P., Calderón-Garcidueñas L., and Vincent R. (2007) Air pollution alters brain and pituitary endothelin-1 and inducible nitric oxide synthase gene expression. Environ. Res. 105, 224–233 [DOI] [PubMed] [Google Scholar]
- 88.Miida T., Yamada T., Seino U., Ito M., Fueki Y., Takahashi A., Kosuge K., Soda S., Hanyu O., Obayashi K., Miyazaki O., and Okada M. (2006) Serum amyloid A (SAA)-induced remodeling of CSF-HDL. Biochim. Biophys. Acta 1761, 424–433 [DOI] [PubMed] [Google Scholar]