

Summary
The hippocampal CA3 region is classically viewed as a homogeneous autoassociative network critical for associative memory and pattern completion. However, recent evidence has demonstrated a striking heterogeneity along the transverse, or proximodistal, axis of CA3 in spatial encoding and memory. Here we report the presence of striking proximodistal gradients in intrinsic membrane properties and synaptic connectivity for dorsal CA3. A decreasing gradient of mossy fiber synaptic strength along the proximodistal axis is mirrored by an increasing gradient of direct synaptic excitation from entorhinal cortex. Furthermore, we uncovered a nonuniform pattern of reactivation of fear memory traces, with the most robust reactivation during memory retrieval occurring in mid-CA3 (CA3b), the region showing the strongest net recurrent excitation. Our results suggest that heterogeneity in both intrinsic properties and synaptic connectivity may contribute to the distinct spatial encoding and behavioral role of CA3 subregions along the proximodistal axis.
Keywords: Hippocampus, CA3, CA2, recurrent collateral, mossy fiber, intrinsic excitability, input resistance, perforant path, pattern completion, contextual fear conditioning
eTOC Blurb
Sun et al. report marked proximodistal gradients in dorsal CA3 neuron intrinsic excitability and synaptic connectivity, with a reduced recurrent I/E ratio in mid-CA3 (CA3b) leading to its stronger net excitation and memory reactivation. This study complements recent findings on CA3 heterogeneity in spatial encoding and behaviors.
Introduction
The hippocampal CA3 region is essential for encoding, storage, and recall of declarative memory (Rolls, 2007, 2013b; Treves and Rolls, 1994). CA3 is distinct within the hippocampus as it is the only region with strong recurrent excitatory collateral connections capable of forming an autoassociative network. Such connectivity has provided the foundation for numerous theoretical studies of hippocampal-based associative memory storage and pattern completion, the process by which an entire memory is retrieved from partial cues (McNaughton and Morris, 1987; Rolls, 2007, 2013a), dating back to the work of Marr (1971) (Marr, 1971). This contrasts with the proposed role of dentate gyrus (DG) in pattern separation, in which the large number of granule cells provide for sparse representations that enable similar inputs to be transformed into distinct outputs to prevent interference (Kesner and Rolls, 2015; Rolls, 2007, 2013a).
Despite the extensive theoretical and experimental support for a role of CA3 recurrent connectivity in pattern completion (Guzman et al., 2016; Kesner, 2007; Lee et al., 2004; Leutgeb et al., 2004; McHugh and Tonegawa, 2009; Nakashiba et al., 2008; Nakazawa et al., 2002; Nakazawa et al., 2003; Neunuebel and Knierim, 2014), relatively little is known about the strength of recurrent inhibitory drive relative to excitation (I/E balance). Because pyramidal neuron activity is powerfully regulated by feedforward and feedback inhibition (Isaacson and Scanziani, 2011; Lawrence and McBain, 2003; Miles and Wong, 1984, 1987), knowledge of the I/E balance is critical for determining whether the recurrent collaterals can provide sufficient net excitation to support an autoassociative network (Guzman et al., 2016). Indeed, one of the first in vivo intracellular recording studies found that stimulation of the recurrent collaterals produced a net inhibitory response in CA3 PNs (Spencer and Kandel, 1961). Surprisingly, there have been few studies to date that assess I/E balance in the CA3 recurrent network.
A second important question about the role of CA3 in memory storage and recall arises from its known heterogeneity along the transverse (or proximodistal) axis. To date, the majority of experimental studies and computational models have treated CA3 as a single homogeneous entity (Denny et al., 2014; Nakashiba et al., 2008; Nakazawa et al., 2002; Nakazawa et al., 2003; Rolls, 2013b). However, Lorente de Nò (1934) divided CA3 into three approximately equal-sized subregions along the proximodistal axis over 80 years ago. Proximal CA3 or CA3c lies closest to DG whereas distal CA3 or CA3a lies closest to CA2, with mid-CA3 or CA3b interposed. More recent studies demonstrate marked proximodistal heterogeneity in CA3 PN dendritic morphology, axonal projections, and gene expression patterns (Ishizuka et al., 1995; Ishizuka et al., 1990; Li et al., 1994; Thompson et al., 2008; Turner et al., 1995). For example, many genes highly enriched in proximal CA3 are nearly absent in distal CA3, and vice versa, a phenomenon that is less pronounced in CA1 (Cembrowski et al., 2016; Thompson et al., 2008).
Important differences have also been reported for the behavioral role of the CA3 subregions. Animals with lesions restricted to proximal CA3 show greater deficits in processing spatial information than those with lesions in distal CA3 (Hunsaker et al., 2008). Additionally, proximal CA3 is more strongly activated during a nonspatial delayed nonmatch-to-sample recognition memory task than distal CA3 (Nakamura et al., 2013). Imaging of immediate early gene Arc expression revealed a proximodistal gradient of activation during pattern separation, with proximal CA3 showing the greatest sensitivity to different environments and distal CA3 the least (Marrone et al., 2014). In addition, a proximodistal gradient of increasing reactivation of CA3 during retrieval of fear memory has recently been reported based on c-fos driven transgene expression (Nakazawa et al., 2016). These data are consistent with a functional gradient of place cell properties along the proximodistal axis, with distal CA3 more strongly involved in pattern completion and proximal CA3 more strongly involved in pattern separation (Lee et al., 2015; Lu et al., 2015).
What cellular and circuit mechanisms may contribute to the proximodistal heterogeneity in CA3 function during spatial encoding, memory storage and recall? How is proximal CA3 tuned to perform pattern separation whereas distal CA3 is tuned for pattern completion? Here we systematically characterize the intrinsic membrane excitability properties, synaptic connectivity, and I/E balance of recurrent connectivity along the CA3 proximodistal axis in mouse dorsal hippocampus. We then relate these properties to proximodistal heterogeneity in neuronal reactivation during fear memory recall using a genetic Arc-based imaging approach (Denny et al., 2014; Josselyn et al., 2015).
Results
To investigate potential physiological mechanisms that may contribute to the role of the different CA3 subregions in learning and memory and spatial encoding, we examined the intrinsic electrophysiological properties, dendritic morphology and synaptic connectivity of pyramidal neurons (PNs) in the three CA3 subregions in dorsal hippocampus (Figure 1A, D–F). For a subset of recorded PNs, we performed biocytin-based staining, which enabled us to determine the relative location of the recorded neurons along the transverse axis, with 0 assigned to the most proximal region of CA3 and 1 assigned to the end of mossy fibers (MF) near the CA2/CA3 border (Figure 1A, D–F). We also examined the properties of CA2 PNs to determine their relationship to CA3. Because CA2 and CA3a PNs are intermingled at the border region we only included CA3a and CA2 PNs that were visualized using biocytin morphological reconstruction to determine the presence or absence, respectively, of thorny excrescences, a hallmark of CA3 PNs (e.g. Figure 1D, Figure 4B,C).
Figure 1. A proximodistal gradient of intrinsic excitability and input resistance of CA2/CA3 PNs.
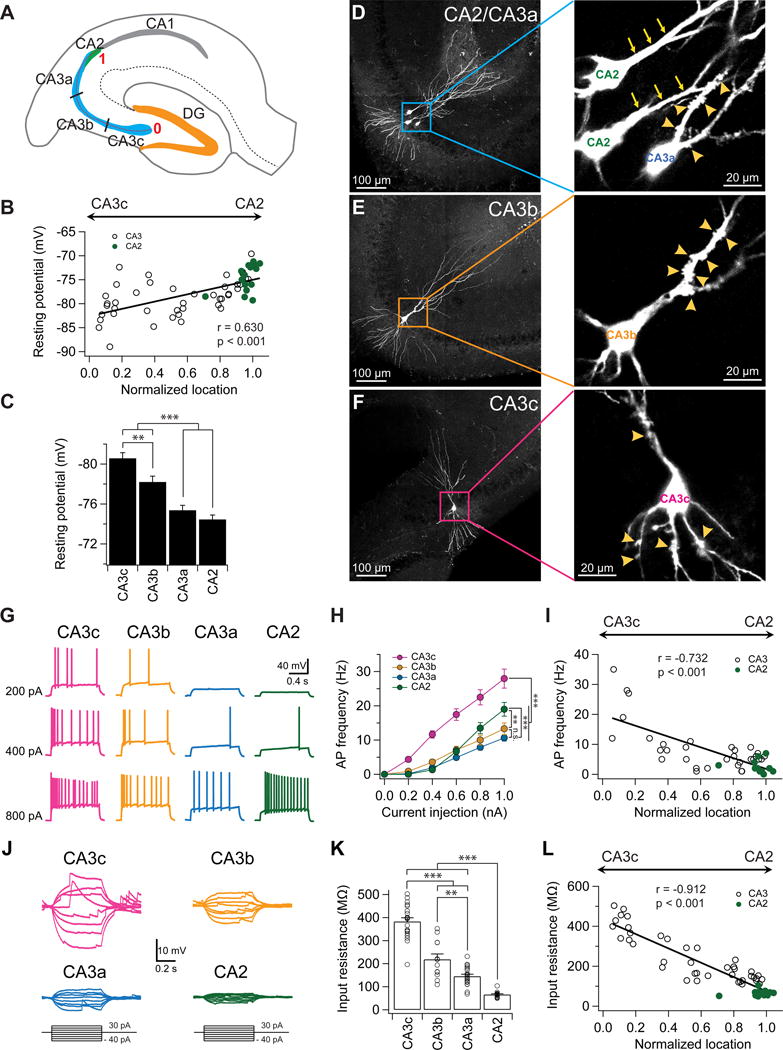
(A) Schematic diagram of a transverse hippocampal slice. CA3 is divided into three equal-sized regions along the transverse axis (CA3c, CA3b, and CA3a). The location of each recorded neuron was normalized from 0 to 1 based on their transverse location. PNs located at the beginning of the mossy fibers near DG were assigned a location of “0”, whereas neurons located at the end of the mossy fibers near CA2 were assigned a location of “1”.
(B) Resting membrane potential plotted against normalized cell location.
(C) Mean resting membrane potential in indicated subregions. Error bars show SE. **p < 0.01, ***p < 0.001. n = 16–32 neurons per group.
(D) Sample images of CA2 and CA3a PNs filled with biocytin. Note the absence (CA2, arrows) and presence (CA3a, arrowheads) of thorny excrescences in the expanded view (right).
(E) Sample images of a CA3b PN filled with biocytin. Note the presence of thorny excrescences (arrowheads) in the expanded view (right).
(F) Sample images of a CA3c PN filled with biocytin. Note the presence of thorny excrescences (arrowheads) in both basal and apical dendrites in the expanded view (right).
(G) Sample traces of firing patterns in response to indicated constant current injection.
(H) Mean firing frequency during the current step as function of current injection. Error bars show SE. **p < 0.01, ***p < 0.001. n = 15–24 neurons per group.
(I) AP frequency in response to a 1 s, 600 pA current injection plotted against normalized cell location.
(J) Sample traces of subthreshold membrane voltage responses to indicated current injections.
(K) Mean input resistance in indicated subregions. Error bars show SE. **p < 0.01, ***p < 0.001. n = 12–20 neurons per group.
(L) Input resistance plotted against the normalized cell location.
Figure 4. Proximodistal gradient of mossy fiber synaptic responses in CA3/CA2 PNs.
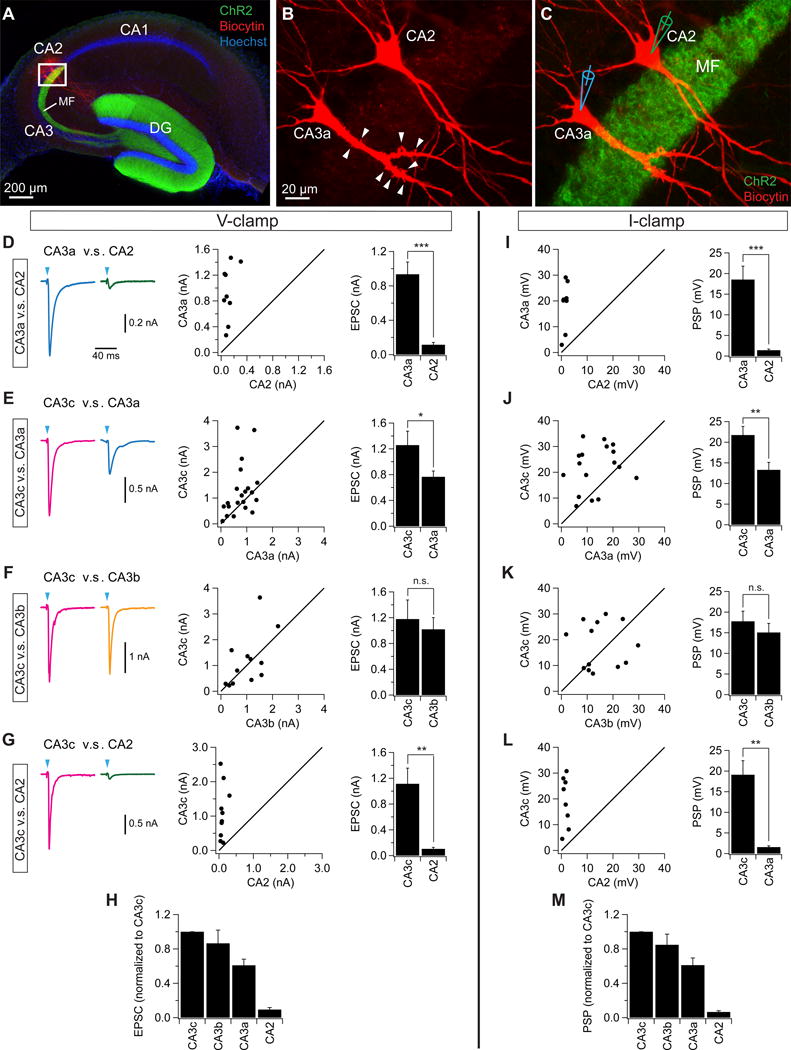
(A–C) Sample images of a pair of ChR2-expressing CA2/CA3a PNs filled with biocytin from whole cell recording pipette. Note the absence (CA2) and presence (CA3a) of thorny excrescences (arrowheads) in the expanded views in (B) and (C).
(D–G) (left) sample light-evoked EPSCs from pairs of CA3a/CA2 (D, n = 9 pairs), CA3c/CA3a (E, n = 21 pairs), CA3c/CA3b (F, n = 12 pairs), and CA3c/CA2 (G, n = 10 pairs) in response to 2-ms light stimuli. (middle) scatter plots of EPSCs from individual pairs of neurons. (right) mean EPSC amplitude. Error bars show SE. ***p < 0.001, **p < 0.01, *p < 0.05. n.s., not significant. (H) Light-evoked EPSC summary data. MF EPSCs in CA3b, CA3a, and CA2 were normalized to mean EPSC in CA3c. Error bars show SE.
(I–L) (left) scatter plots of PSPs obtained under current clamp from pairs of CA3a/CA2 (I, n = 8 pairs), CA3c/CA3a (J, n = 17 pairs), CA3c/CA3b (K, n = 13 pairs), and CA3c/CA2 (L, n = 8 pairs) neurons in response to 2-ms light stimuli. (right) mean PSP amplitude. Initial holding potential was −72 mV. Error bars show SE. ***p < 0.001, **p < 0.01, n.s., not significant. (M) Light-evoked PSP summary data. MF PSPs in CA3b, CA3a, and CA2 were normalized to mean PSP in CA3c. Error bars show SE.
Heterogeneity in dendritic morphology of hippocampal PNs along the proximodistal axis
Dendritic structures of CA3/CA2 PNs across the transverse axis have been examined in detail in a previous study from rat hippocampus (Ishizuka et al., 1995). Here we reexamined the dendritic morphology of CA3/CA2 PNs along the transverse axis from mouse dorsal hippocampus. We filled the neurons with biocytin during whole-cell recordings, performed morphological reconstructions using Neurolucida, and conducted morphometric analyses. Some of the data from CA1 and CA2 PNs presented here have been reported in our previous paper (Sun et al., 2014). We found CA3c has the shortest total dendritic length across the subregions (Figure S1A,B). The difference is particularly evident for dendrites in stratum lacunosum moleculare (SLM), where the axonal projections from layer II entorhinal cortex (EC) stellate cells terminate. The dendritic length of CA2 PNs in SLM was the greatest, followed by CA3a and CA3b (Figure S1A,B).
A Sholl analysis revealed that CA3a, CA3b and CA2 PNs had more dendritic intersections in SLM (250–450 μm from the soma) than CA3c and CA1 (Figure S1C). Indeed, CA3c had very few dendritic branches that extend into SLM. At the basal dendrites, CA3a and CA3b had the greatest number of dendritic intersections (Figure S1C), consistent with their long basal dendrites. Together, our data revealed a pronounced proximodistal heterogeneity of dendritic structures from CA3c to CA2, consistent with previous results on rat hippocampus (Ishizuka et al., 1995).
A proximodistal gradient of intrinsic membrane excitability and input resistance of CA3/CA2 PNs
Next we examined the intrinsic membrane properties along the proximodistal axis. There was a small but statistically significant continuous proximodistal gradient in resting potential, with the most negative resting potential in CA3c, followed by CA3b, CA3a and CA2 (Figure 1B,C). Further, the resting potential of individual cells was linearly correlated with their proximodistal location, indicating a gradual change (Figure 1B).
Next we assessed intrinsic membrane excitability by injecting a series of 1-s long depolarizing current pulses, with the membrane potential held initially at −72 mV for all regions (Figure 1G,H). The spike frequency versus stimulating current (F–I) curve showed that CA3c was the most excitable subregion—firing the greatest number of APs in response to a given current pulse—followed by CA3b, with CA2 being the least excitable subregion (Figure 1G,H). However, the firing pattern of CA2 PNs in response to a strong current injection (>0.8 nA) was distinct, as CA2 PNs fired more APs than CA3a or CA3b (Figure 1G,H). Because of the proximodistal gradient of resting potential (Figure 1B,C), we also examined the F–I curve at the resting potential of each cell to provide a more physiologically realistic assessment. We found a similar gradient of excitability (Figure S2), indicating a likely difference in excitability in vivo (Kowalski et al., 2016; Turner et al., 1995). Thus, despite its more negative resting potential, CA3c is the most excitable subregion (Figure S2). We also plotted the AP frequency (600 pA current injection) against the normalized proximodistal cell location, and observed a linear relationship (Figure 1I, Figure S2C), suggesting a gradual, rather than abrupt, change of intrinsic membrane excitability across the transverse axis.
What is the mechanism for the differences in excitability? We found no significant difference in voltage threshold or action potential (AP) amplitude among the various subregions (Figure S3). Rather, we observed a profound gradient in input resistance across the subregions (Figure 1J–L). CA3c exhibited the highest input resistance, followed by CA3b, CA3a, and then CA2 (Figure 1J–L), with the input resistance of CA3c PNs being 5.8-fold greater than CA2 and 2.6-fold greater than CA3a (Figure 1K). Furthermore, there was a linear relationship of input resistance of individual cells with their proximodistal location (Figure 1L), indicating a gradual change with position.
To determine whether the gradient of input resistance can account for the heterogeneity of intrinsic excitability, we plotted AP frequency (in response to 600 pA current injection) of individual cells against input resistance, and observed a strong positive correlation (Figure S4A,B). Furthermore, by injecting increasing values of EPSC-like currents into cells we determined the current threshold required to evoke an AP was inversely and significantly correlated with input resistance (Figure S4C,D). Taken together, these results suggest that proximodistal gradient of decreasing intrinsic excitability can be largely accounted for by the decreasing gradient of input resistance.
A proxmodistal gradient of Ih in part accounts for the gradient of input resistance
What are the mechanisms underlying the gradient of input resistance, and is it related to the gradient of resting potential? As the hyperpolarization-activated cation current (Ih) is a key contributor to both resting membrane potential and input resistance (Robinson and Siegelbaum, 2003), we reasoned that a decreasing proximodistal gradient of Ih may contribute to the observed properties. To test this, we first compared sag amplitude in response to a hyperpolarizing current pulse, which provides an indirect measure of Ih, across the transverse axis. CA2 exhibited the greatest sag amplitude, followed by CA3a, with CA3c having the smallest sag (Figure 2A–C). Moreover, there was a strong linear relationship between sag amplitude and normalized cell position (Figure 2B), in agreement with the linear gradient in input resistance and intrinsic excitability (Figure 1I,L). Furthermore, the input resistance of individual cells was significantly and inversely correlated with sag (Figure 2D), supporting a major impact of Ih on intrinsic properties.
Figure 2. A proximodistal gradient of Ih contributes to the gradient of intrinsic membrane excitability.
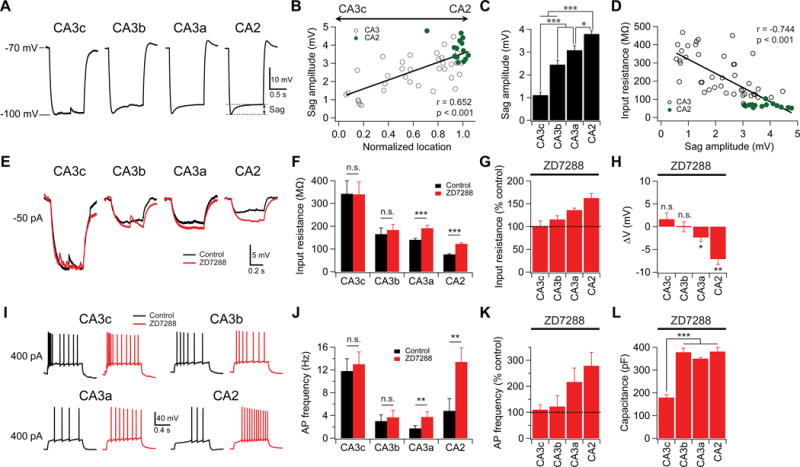
(A) Sag measurement. Sample membrane voltage traces in different subregions in response to a hyperpolarizing current injection.
(B) Sag amplitude plotted against normalized cell location.
(C) Mean sag amplitude in different subregions. Error bars show SE. *p < 0.05, ***p < 0.001. n = 11–19 neurons per group.
(D) Input resistance plotted against sag amplitude.
(E) Sample membrane voltage responses to −50 pA current injections in the absence (black) or presence (red) of ZD7288 (10 μM).
(F) Mean input resistance in absence or presence of ZD7288. Error bars show SE. ***p < 0.001. n.s., not significant. n = 5–7 neurons per group.
(G) Input resistance in the presence of ZD7288 as percentage of input resistance in the absence of ZD7288. Error bars show SE.
(H) Change of resting potential in response to application of ZD7288. Error bars show SE. **p < 0.01. *p < 0.05. n.s., not significant. n = 4–7 neurons per group.
(I) Sample traces of firing patterns in response to +400 pA constant current injection in the absence (black) or presence (red) of ZD7288.
(J) Mean AP frequency in response to a +400 pA constant current injection in the absence or the presence of ZD7288. Error bars show SE. **p < 0.01. n.s., not significant. n = 5–7 neurons per group.
(K) Percent change in AP frequency with ZD7288. Error bars show SE.
(L) Mean membrane capacitance in the presence of ZD7288. Error bars show SE. ***p < 0.001. n = 6–8 neurons per group.
To directly assess the influence of Ih on intrinsic excitability, we applied ZD7288 (10 μM), a blocker of Ih, to the bath solution. This caused a significant increase in input resistance in both CA2 and CA3a, but not CA3b/c PNs (Figure 2E–G). Consistently, AP frequency in response to constant current injection was also increased in CA2 and CA3a, but not, CA3b/c (Figure 2I–K). Furthermore, in the presence of ZD7288 the resting membrane potential of CA2 PNs was more hyperpolarized, with a weaker effect in CA3a and no significant change in CA3b or CA3c (Figure 2H). Finally, application of ZD7288 reduced, but did not abolish, the difference in input resistance across the subregions (Figure 2F). Thus, whereas the proximodistal gradient of Ih is important, it only partially accounts for the heterogeneity of intrinsic excitability.
Given the differences in dendritic length along the transverse axis, we asked whether differences in membrane area may contribute to the differences in input resistance. To estimate membrane area we measured membrane capacitance in the presence of ZD7288. We found that CA3c had a significantly smaller capacitance than the other subregions (Figure 2L), consistent with its more compact somatodendritic structure (Figure S1). These results show that the more compact size of CA3c PNs, in combination with their lower level of Ih, can largely account for their high input resistance, and thus greater intrinsic excitability to a given stimulating current.
MF synaptic excitation shows a decreasing gradient of synaptic strength across the proximodistal axis
Although there is prior anatomical evidence for heterogeneity of MF input to CA3 along the proximodistal axis (Claiborne et al., 1986), to our knowledge there have been no prior studies of potential functional differences in the strength of MF synaptic excitation. Here, we directly examined the functional heterogeneity of MF excitatory drive using an optogenetic approach. To specifically and uniformly activate the MF terminals across the transverse axis, we expressed ChR2 specifically in DG granule cells by crossing a POMC-Cre mouse line (which specifically targets DG granule cells in the hippocampus) with the Rosa26-CAG- STOP-floxed-ChR2(H134R)-EYFP mouse line (Figure 3) (Kheirbek et al., 2013; Madisen et al., 2012; McHugh et al., 2007). We verified the functional expression of ChR2 in granule cells by demonstrating that photostimulation evoked in granule cells a large excitatory current under voltage clamp that reliably fired APs under current clamp, even during 20 Hz trains of light pulses (Figure 3D–H, n = 4).
Figure 3. Optogenetic approach to investigate strength of mossy fiber input to CA3 and CA2.
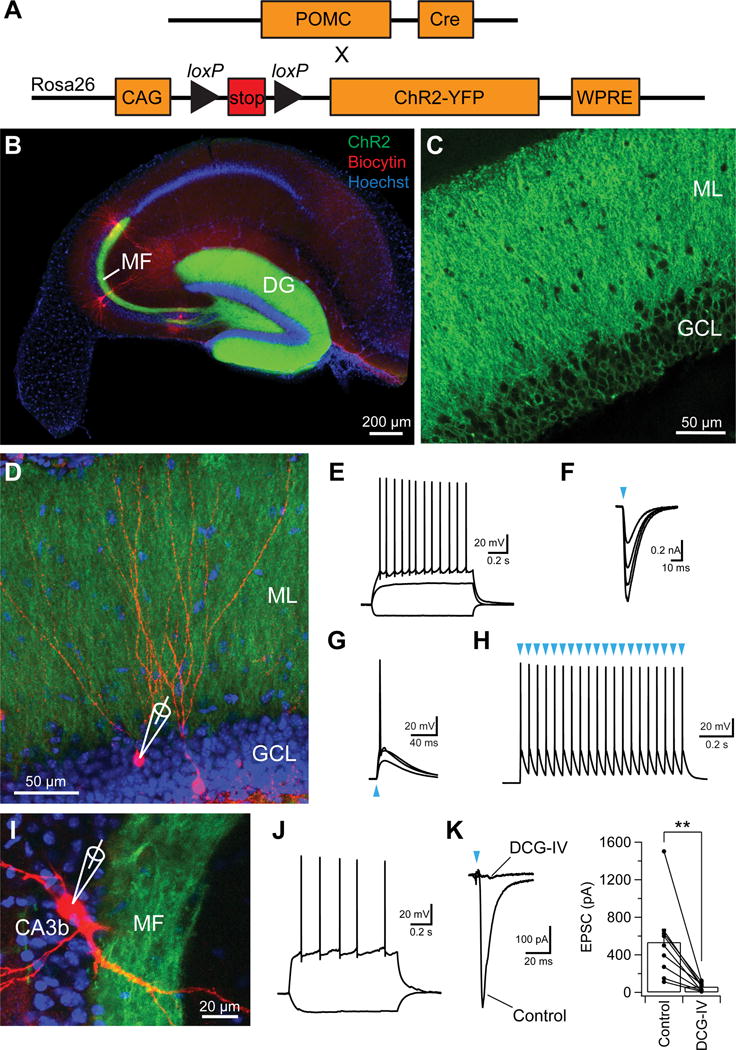
(A) Genetic strategy. A floxed ChR2-EYFP mouse line was crossed to a POMC-Cre mouse line to express ChR2 specifically in DG granule cells.
(B) Sample images of a hippocampal transverse slice expressing ChR2-EYFP specifically in DG granule cells. Note the robust expression of ChR2-EYFP (green) in MF path.
(C) Sample high-magnification image showing the expression of ChR2-EYFP in the soma and dendrites of DG gradual cells.
(D) Sample image of biocytin-filled DG gradual cells (magenta) expressing ChR2-EYFP.
(E) Sample traces of granule cell membrane voltage responses to constant current injections. (F and G) Voltage-clamp (F) and current-clamp (G) recordings from a granule cell expressing ChR2-EYFP in response to 2-ms light pulses of increasing intensity.
(H) Granule cell AP responses to repetitive 2-ms light stimulation (20 pulses at 20 Hz).
(I) Sample image of a CA3b PN filled with biocytin.
(J) Firing pattern of the CA3b PN shown in (I) to current injection.
(K) (left) Sample EPSC traces in the absence or presence of DCG-IV (1 μM), an mGluR2 agonist. (right) Quantification of EPSC amplitude in the absence or presence of DCG-IV. Error bars show SE. **p < 0.01. n = 9 neurons.
To examine synaptic responses in pyramidal neuron targets of granule cells, we photostimulated MF terminals with a light pulse centered on the region of stratum lucidum (the site of MF inputs) containing the dendrites of a PN from which EPSCs were recorded under voltage clamp conditions at −75 mV (near the reversal potential for the IPSC). The photostimulation reliably evoked an EPSC in both CA3 and CA2 PNs that was largely abolished by bath application of the mGluR2 agonist, DCG-IV (control: −535 ± 139 pA; DCG-IV: −60 ± 15 pA, n = 9, p = 0.006, paired t test, Figure 3I–K). This indicates that the light-evoked current was mediated by MF inputs, which are selectively inhibited by mGluR2 activation (Kamiya et al., 1996).
To compare the MF-mediated EPSCs across the subregions, we sequentially measured EPSCs under voltage-clamp from pairs of CA3a/CA2, CA3c/CA3a, CA3c/CA3b, or CA3c/CA2 PNs from each transverse slice (Figure 4). The EPSCs were greatest in CA3c and CA3b, and then progressively diminished across the transverse axis, with the MF EPSC in CA3a, but not CA3b, significantly smaller than the EPSC in CA3c (Figure 4E,F,H). Consistent with a previous report (Kohara et al., 2014), we found that CA2 PNs received functional MF innervation. However, the EPSC amplitude in CA2 was an order-of-magnitude smaller than that evoked in all CA3 subregions (Figure 4D,G,H). Consistent with voltage-clamp recordings, the net depolarizing postsynaptic potential (PSP) showed a similar proximodistal gradient (Figure 4I–M). Together, these results indicate that CA3c and CA3b are more strongly driven by their DG inputs compared to CA3a, with CA2 showing only a very weak excitatory response.
Synaptic excitation by perforant path synapses shows a gradient of increasing strength along the proximodistal axis
The heterogeneity in dendritic length in SLM across the CA3/CA2 transverse axis (Figure S1) raises the possibility that the direct excitatory perforant path (PP) input from EC may show a similar heterogeneity. We previously found that CA2 receives a much greater excitatory drive from PP inputs than does CA1 or CA3 (Chevaleyre and Siegelbaum, 2010; Srinivas et al., 2017; Sun et al., 2014). Here we examined the heterogeneity of direct cortical excitation of CA3 across the transverse axis. We first recorded the extracellular field EPSP (fEPSP) in response to PP stimulation using a stimulating electrode placed in SLM and two extracellular recording electrodes at approximately equal radial positions in SLM of CA1 and CA2/3, respectively (Figure 5A). A plot of the fEPSP in SLM of CA2/3 as a function of the amplitude of the fiber volley, a measure of presynaptic excitation, evoked by different strengths of stimulation revealed that the fEPSP in CA2/CA3 is roughly twice the size of the fEPSP in SLM of CA1. This suggests that there are more excitatory synaptic contacts in SLM of CA2/3 than of CA1 (Figure 5A,B).
Figure 5. A proximodistal gradient of direct entorhinal cortex excitation.
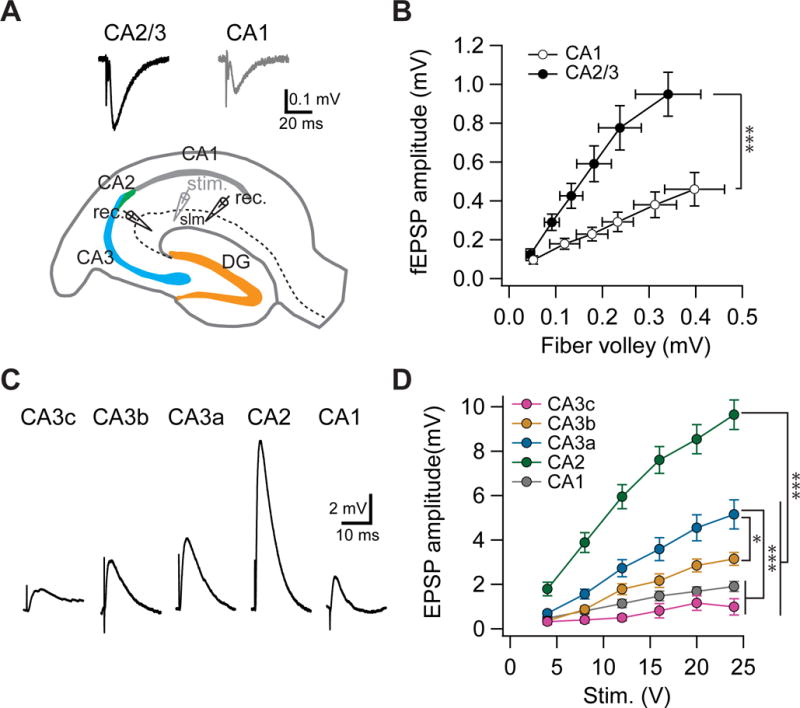
(A) Schematic diagram showing the setup for simultaneous extracellular field recordings from SLM of CA1 and CA2/CA3a regions in response to stimulation of distal inputs in SLM. Top, sample traces of extracellular field EPSPs in SLM of CA2/3a and CA1, respectively.
(B) fEPSP amplitude plotted against fiber volley in response to increasing electrical stimulus strengths. ***p < 0.001. Error bars show SE. n = 5 slices.
(C) Sample traces of intracellular EPSPs during whole cell current-clamp recordings from PNs in indicated subregions.
(D) Input-output of relation of EPSP amplitude as a function of stimulation intensity. ***p < 0.001. *p < 0.05. Error bars show SE. n = 9–25 neurons per group.
However, because the dendrites of CA2 and CA3 PNs comingle in SLM, extracellular field recordings cannot distinguish the synaptic responses generated by different CA2/CA3 subregions. We thus performed whole-cell recordings to measure the input-output relation of the evoked EPSP in response to an electrical stimulus delivered to the PP in SLM. The EPSP evoked by PP stimulation also exhibited a pronounced proximodistal gradient. However, the direction of the gradient in EPSP response was the opposite of the one found with MF inputs (Figure 5C,D). Thus, CA2 PNs generated the largest EPSP in response to PP stimulation, consistent with our previous reports (Chevaleyre and Siegelbaum, 2010; Sun et al., 2014), whereas they only weakly responded to MF stimulation (Figure 4). Within the CA3 region, CA3a PNs exhibited the greatest response, followed by CA3b, and then CA3c (Figure 5C,D). Notably, both CA3a and CA3b, but not CA3c, received significantly stronger excitatory drive from EC than did CA1 (Figure 5C,D). These data largely matched the gradient in dendritic structure observed in SLM (Figure S1). Interestingly, despite the similarity in the dendritic length in SLM between CA2 and CA3a (Figure S1), the PP-evoked EPSP amplitude in CA2 was significantly larger than in CA3a (Figure 5C,D), indicating that additional factors may contribute to the difference. Taken together, our data suggest that the direct excitatory input from EC has a differential influence in the different CA3 subregions along the transverse axis.
Heterogeneity of excitation by the recurrent pathway across the transverse axis
As CA3 is known to form an autoassociative network through its extensive recurrent collaterals (Le Duigou et al., 2014; Miles and Wong, 1986), we next addressed whether the recurrent network also exhibits proximodistal heterogeneity. We first measured under current clamp the net depolarizing PSP evoked by a stimulating electrode placed in stratum radiatum (SR), the site of the recurrent collaterals (Figure 6A). In all three CA3 subregions and in CA2, stimulation of the CA3 axons evoked a mixed EPSP/IPSP (Figure 6B). Surprisingly, CA3b PNs displayed a significantly larger net PSP compared to the other subregions (Figure 6B,C). To dissect the underlying synaptic mechanisms, we performed voltage-clamp recordings of the excitatory and inhibitory postsynaptic currents (EPSCs and IPSCs) across the subregions, with the membrane held, respectively, at −75 mV (near the reversal potential of the IPSC) or 0 mV (near the reversal potential of the EPSC). Whereas the EPSC was similar in CA2, CA3a, and CA3b, the CA3c subregion generated a substantially smaller EPSC (Figure 6D,E,H), consistent with previous anatomical reports of sparse CA3c recurrent collaterals (Ishizuka et al., 1990; Li et al., 1994).
Figure 6. Proximodistal heterogeneity of excitation and inhibition in the CA3 recurrent network.
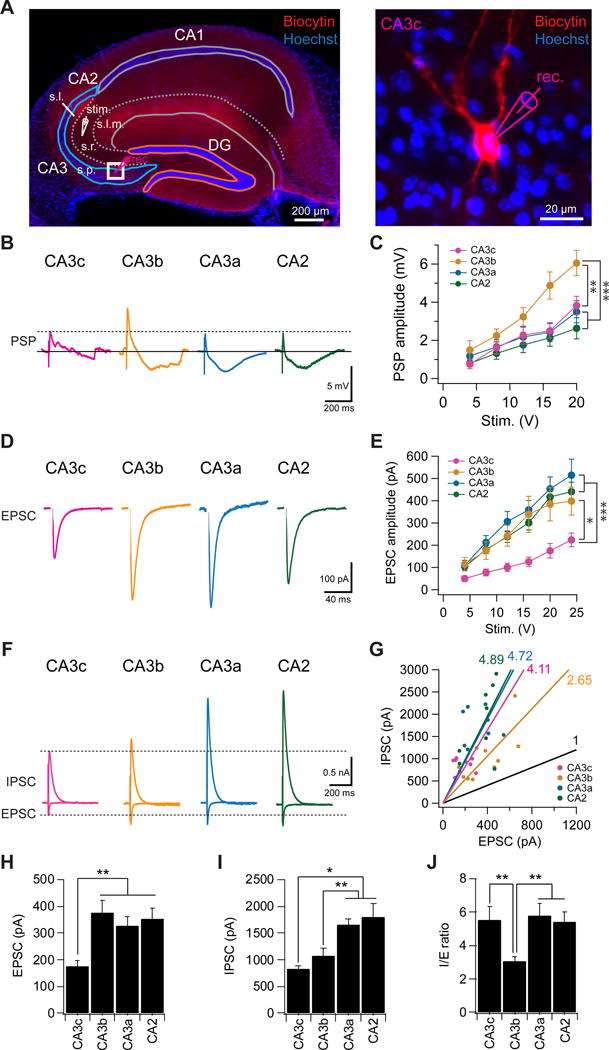
(A) (Left) A representative hippocampal slice showing a CA3c PN undergoing whole cell recording in response to stimulation of CA3 recurrent collaterals using a stimulating electrode placed in the middle of CA3 stratum radiatum. (Right) Expanded view of the CA3c neuron (left). Note we positioned the stimulating electrode based on the position of the recorded neuron across the transverse axis to keep the distance between neuron and stimulating electrode constant (about 400 μm). s.l.m., stratum lacunosum moleculare; s.r., stratum radiatum; s.l., stratum lucidum, s.p., stratum pyramdale.
(B) Sample traces of PSPs, from PNs in indicated regions, evoked by electrical stimulation of recurrent inputs with a stimulating electrode in SR. Inhibition was intact.
(C) Input-output relation of PSP amplitude plotted against stimulation intensity. ***p < 0.001. **p < 0.01. Error bars show SE. n = 9–11 neurons per group.
(D) Sample traces EPSCs evoked by electrical stimulation of recurrent inputs with membrane held at −75 mV.
(E) Input-output relation of EPSC amplitude plotted against stimulation intensity. ***p < 0.001. *p < 0.05. Error bars show SE. n = 9–12 neurons per group.
(F) Sample IPSC and EPSC traces recorded at a holding potential of 0 mV and −75 mV, respectively.
(G) IPSC plotted against EPSC for individual cells. Numbers show the slopes for each group. Black line indicates an I/E ratio of 1.
(H and I) Mean EPSC (H) and IPSC (I) amplitude in response to electrical stimulation (16 V). Error bars show SE. **p < 0.01. *p < 0.05. n = 9–13 neurons per group.
(J) Mean I/E ratio. Error bars show SE. **p < 0.01. n = 9–13 neurons per group.
In contrast to the relative constancy of the EPSC (apart from CA3c), the IPSC demonstrated a striking proximodistal gradient of increasing amplitude, such that CA3c displayed the weakest IPSC, with CA3b, CA3a and CA2 showing progressively stronger inhibition (Figure 6F,G,I). The majority of the inhibition we recorded was di-synaptic, rather than the result of direct activation of inhibitory axons, as the IPSC was largely abolished by blockers of glutamatergic transmission (83.6 ± 4.1% reduction, n = 7, Figure S5A–B).
A comparison of the EPSC and IPSC reveals a striking finding: inhibition evoked by recurrent collaterals is remarkably strong, being 3–5 fold larger than excitation. Moreover, the IPSC/EPSC ratio varies among the different subregions. Although inhibition dominates in all CA2/CA3 subregions, CA3b has a significantly smaller I/E ratio (3.05 ± 0.30, n = 13) compared with CA3c (5.51 ± 0.84, n = 10) or CA3a (5.76 ± 0.74, n = 12; ANOVA; p = 0.008) (Figure 6F,G,J). As a result the net peak depolarization evoked by collateral stimulation is around 2-fold larger in CA3b compared to the other regions (Figure 6B,C). This suggests that CA3b may play a particular important role in associative memory recall and pattern completion.
One caveat of measuring synaptic responses with electrical stimulation is that the results may be affected by the severing of recurrent collaterals during slice preparation. To minimize this problem and more accurately determine recurrent synaptic responses, we used an optogenetic approach (Figure 7, Figure S5C–G). We expressed ChR2 in CA3 PNs by injecting AAV-CaMKII-ChR2 virus into the CA3 region of wild-type mice. We then obtained whole cell recordings from ChR2-negative CA3 neurons and measured the EPSCs and IPSCs elicited by a light spot centered on the neuron from which recordings were obtained. Because the light spot is directly focused on and encompasses the CA3 PNs and its dendrites in SR and SO, and because ChR2 is able to evoke release even from terminals with relatively short lengths of axons attached, this method allows us to record synaptic responses from nearly all excitatory inputs.
Figure 7. Optogenetic investigation of the heterogeneity of excitation and inhibition in the CA3 recurrent network.
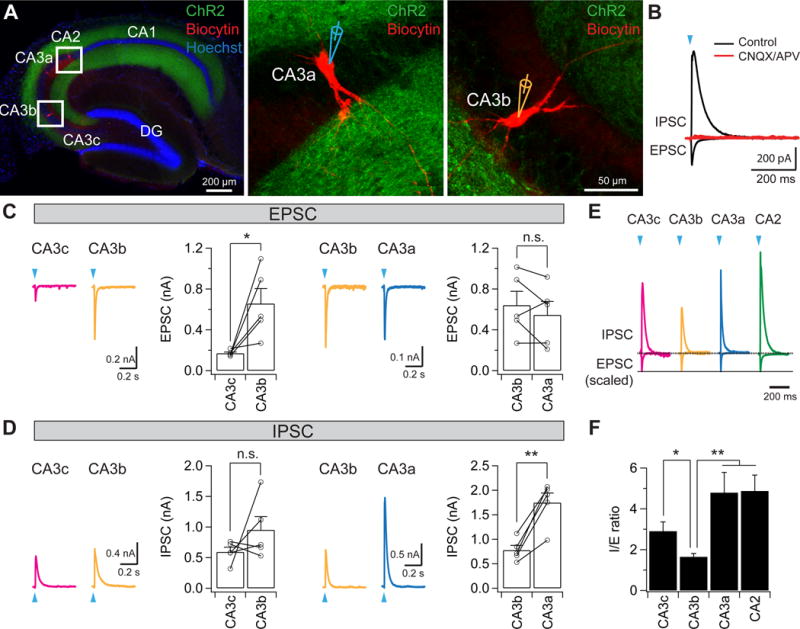
(A) Sample slice images showing the expression of ChR2 (green) and biocytin-filled CA3 neurons (red), with two sample biocytin-filled CA3a and CA3b neurons shown in the expanded views (right).
(B) Sample IPSC and EPSC traces in the absence (black) or presence (red) of CNQX/APV recorded at a holding potential of 0 mV and −75 mV, respectively.
(C) Light-evoked EPSCs from pairs of CA3c/CA3b (left, n = 5 pairs) and CA3b/CA3a (right, n = 5 pairs) neurons in response to 2-ms light stimuli. Error bars show SE. *p < 0.05. n.s., not significant.
(D) Light-evoked IPSCs from pairs of CA3c/CA3b (left, n = 5 pairs) and CA3b/CA3a (right, n = 5 pairs) neurons in response to 2-ms light stimuli. Error bars show SE. **p < 0.01. n.s., not significant.
(E) Sample light-evoked IPSC and EPSC traces recorded at a holding potential of 0 mV and −75 mV, respectively. Note all EPSC traces were scaled to the same level; IPSC traces were also scaled accordingly.
(F) Mean light-evoked I/E ratio. Error bars show SE. **p < 0.01. *p < 0.05. n = 6–9 neurons per group.
Similar to our results with electrical stimulation, photostimulation of ChR2 evoked large EPSCs and IPSCs in ChR2-negative CA3 PNs across the transverse axis (Figure 7). Bath application of CNQX and APV largely abolished the light-evoked EPSCs and IPSCs (EPSC: 98.6 ± 0.6% reduction; IPSC: 94.2 ± 1.2% reduction, n = 3, Figure 7B), indicating that light-evoked EPSCs are mediated by glutamatergic synaptic transmission and the IPSCs are mediated by di-synaptic inhibition. The light-evoked EPSCs in CA3c were significantly smaller than those in CA3b, whereas those in CA3b were comparable to those in CA3a (Figure 7C), in agreement with the results using electrical stimulation (Figure 6D,E). In addition, the light-evoked IPSCs in CA3a/CA2 were significantly larger than those in CA3b, whereas the IPSCs in CA3b were slightly, but not significantly, bigger than those in CA3c (Figure 7D). Importantly, CA3b had a significantly smaller I/E ratio (1.65 ± 0.16; n = 9), compared with CA3c (2.9 ± 0.46, n = 8), CA3a (4.79 ± 0.99, n = 7), or CA2 (4.87 ± 0.79, n = 6; ANOVA; p = 0.0019) (Figure 7E,F), validating the findings using electrical stimulation (Figure 6J). Taken together, we conclude that CA3b receives stronger net excitation from recurrent collaterals, and thus may play a more important role in associative memory recall.
A proximodistal gradient of inhibition is mediated by parvalbumin (PV)-expressing interneurons
What is the mechanism underlying the proximodistal gradient of recurrent inhibition (Figure 6I, Figure 7D)? As PV-expressing interneurons (PV+) represent one of the major types of interneurons in CA3, we tested the possibility of a proximodistal gradient of PV-mediated inhibition (Figure 8). We first used immunohistochemistry to examine the expression of perisomatic PV+ terminals along the CA3 transverse axis. There was a clear proximodistal gradient of increasing PV expression in the CA3 pyramidal cell layer, with PV intensity being highest in CA3a and lowest in CA3c (Figure 8A), consistent with a proximodistal gradient of IPSCs observed using electrophysiological recordings (Figures 6I, 7D). To functionally assess PV+ interneuron inhibition across the transverse axis, we selectively and uniformly expressed ChR2 in PV+ interneurons by crossing a PV-Cre mouse line (Hippenmeyer et al., 2005) with the Rosa26-CAG-STOP-floxed-ChR2(H134R)-EYFP mouse line (Figure 8B,C). The amplitude of the light-evoked IPSCs recorded in CA3 PNs exhibited a striking proximodistal gradient, with the greatest IPSCs observed in CA3a/CA2 and the smallest in CA3c (Figure 8C), in accord with the proximodistal gradient of perisomatic PV expression and the magnitude of recurrent disynaptic inhibition. These data suggest a proximodistal gradient of PV innervation can, in large part, account for the gradient of recurrent inhibition.
Figure 8. A proximodistal gradient of recurrent inhibition mediated by parvalbumin (PV)-expressing interneurons.
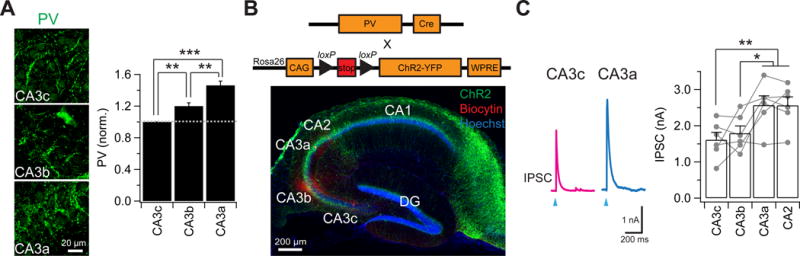
(A) (Left) Representative images of PV immunostaining. (Right) Mean fluorescence intensity of PV terminals (normalized to CA3c). ***p < 0.001. **p < 0.01. n = 6 mice.
(B) (Top) Genetic strategy. A floxed ChR2-EYFP mouse line was crossed to a PV-Cre mouse line to express ChR2 specifically in PV-expressing interneurons. (Bottom) Sample images of a hippocampal transverse slice expressing ChR2-EYFP specifically in PV-expressing interneurons. Note the robust expression of ChR2-EYFP (green) at perisomatic PV terminals.
(C) (Left) Sample light-evoked IPSC traces recorded at a holding potential of 0 mV from a CA3 PN. PV neurons expressing ChR2 were activated by a 2-ms light pulse. (Right) Mean and spread plot of light-evoked IPSCs. Error bars show SE. **p < 0.01. *p < 0.05. n = 6 pairs.
CA3b shows the most efficient reactivation during retrieval of fear memory
Might the heterogeneity in intrinsic excitability and synaptic connectivity of the CA3 subregions contribute to heterogeneity in encoding, storage, or retrieval of memory? Our electrophysiological data indicate that CA3b PNs receive the strongest net recurrent excitation within CA3, in addition to a powerful MF excitation and moderate direct excitation from EC. Because the CA3 autoassociative network has been suggested to play a key role in memory storage and recall, especially during pattern completion (Le Duigou et al., 2014; Papp et al., 2007; Rolls, 2013b), we reasoned that CA3b may be most robustly reactivated during recall of a memory trace compared to other CA3 subregions. To test this hypothesis, we used a genetic memory trace strategy to label separately neurons activated during memory encoding and during memory retrieval in the same animals (Cazzulino et al., 2016; Denny et al., 2014). To achieve this, we crossed an ArcCreERT2 mouse line with a Rosa26-CAG-STOP-floxed-ChR2(H134R)-EYFP line. We used a contextual fear conditioning (CFC) paradigm to first tag a strongly labeled memory (Cazzulino et al., 2016; Denny et al., 2014). Mice were injected with 4-Hydroxytamoxifen (4-OHT), which is required for CreER activity, 5 hours prior to administering the CFC paradigm. Neural activity during memory storage leads to CreER expression and activation, resulting in permanent labeling of Arc+ neurons with ChR2-EYFP (Figure 9A–H). Five days after CFC, we re-exposed the animals to the conditioned context to elicit memory retrieval, resulting in robust freezing (percent time freezing = 76.68 ± 3.99%, n = 6 mice). Animals were then sacrificed 1 hour later. We relied on transient expression of c-fos to mark neurons activated during memory retrieval, and compared their overlap with neurons activated during encoding (ChR2-EYFP+) (Figure 9A–H).
Figure 9. A larger proportion of CA3b neurons are reactivated during retrieval of contextual fear memory compared to CA3a and CA3c neurons.
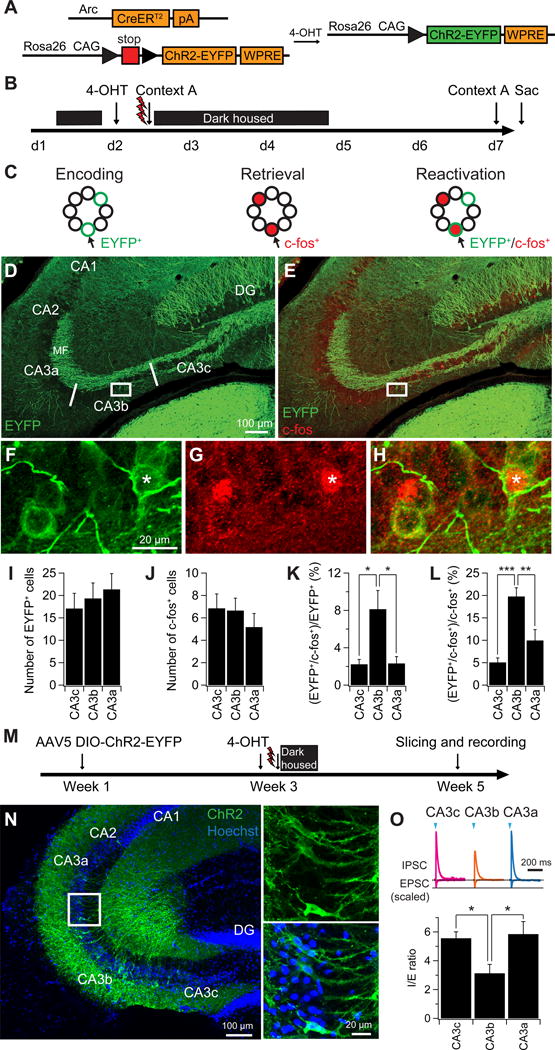
(A) Genetic strategy to permanently express EYFP-ChR2 in activated Arc+ cells during CFC memory encoding. An Arc-CreER line was crossed to a loxp-stop-loxp-ChR2-EYFP line. During activity the Arc promoter drives transient expression of CreER. In the presence of 4-hydroxy-tamoxifen (4-OHT), CreER-mediated recombination results in permanent activation of ChR2-EYFP expression.
(B) Experimental design. Mice were injected with 4-OHT. Five hours later they were exposed to context A for 5 min and received 3 shocks with each shock separated by 1 min. Mice were then re-exposed to context A five days later.
(C) Schematic diagram showing permanent ChR2-EYFP+ labeling (green) during memory encoding (left) and transient c-fos+ labeling (red) during memory retrieval (middle). EYFP+/c-fos+ co-labeled cells (arrows) represent the reactivated cells during memory retrieval (right).
(D–E) Representative images showing the expression of EYFP-ChR2+ cells (D, green) and co-labeling with c-fos (E, red).
(F–H) Expanded views shown in (D–E). Asterisks indicate an EYFP+/c-fos+ co-labeled cell.
(I–J) Average number of EYFP+ cells (I) and c-fos+ cells (J) from each CA3 subregion. Error bars show SE. n = 6 mice.
(K–L) Percentage of EYFP+/c-fos+ co-labeled cells. Error bars show SE. ***p < 0.001, **p < 0.01, *p < 0.05. n = 6 mice.
(M) Experimental design for examining synaptic response elicited by stimulation of neurons activated during CFC. AAV5 DIO-ChR2-EYFP was injected into CA3 regions in ArcCreERT2 mice. Two weeks later, the same animals were injected with 4-OHT, followed by a CFC protocol five hours later. Slices were then prepared two weeks after CFC for electrophysiological recordings.
(N) Representative images (expanded views in right) showing the sparse expression of EYFP-ChR2+ cells (green) in CA3 after viral injection and CFC.
(O) Sample IPSC and EPSC traces (top) and mean I/E ratio (bottom) in response to stimulation of ChR2 expressing CA3 neurons using 2-ms light pusles. Error bars show SE. *p < 0.05. n = 5–7 neurons per group.
We found that the number of EYFP+ (encoding) and c-fos+ (retrieval) cells was comparable across the CA3 subregions (Figure 9I,J). However, a distinctive pattern emerged when we analyzed the percentage of co-labeled EYFP+/c-fos+ neurons across the transverse axis. The CA3b region contained a strikingly higher percentage of co-labeled EYFP+/c-fos+ neurons compared with CA3c and CA3a, indicating that a much larger proportion of CA3b PNs activated during memory encoding were subsequently reactivated during memory retrieval (Figure 9K,L). These results are consistent with the hypothesis that memory retrieval depends on net recurrent excitation, which is largest in CA3b compared to the other CA3 subregions.
To provide a more direct link between CA3 neural ensembles involved in memory storage and heterogeneity in CA3 subfield I/E ratio, we selectively expressed ChR2-EYFP in CA3 neurons activated during CFC using ArcCreERT2 mice, and then measured the I/E ratio across the transverse axis (Figure 9M–O). This strategy allowed us to gauge the effect of specific stimulation of a CA3 neural ensemble activated during CFC, as opposed to the effects of activating a random population of CA3 recurrent collaterals with electrical stimulation or non-selective ChR2 expression employed above. Using this approach, we found that the CA3 memory ensemble I/E ratios were similar to those seen above, with the CA3b ratio (3.08 ± 0.61, n = 7) being significantly smaller than that in nearby CA3c (5.56 ± 0.45, n = 5) or CA3a (5.85 ± 0.87, n = 7; ANOVA; p = 0.023) (Figure 9O). These results support the view that more robust net recurrent excitation in CA3b may be relevant to its stronger memory reactivation.
Discussion
Since Lorente de Nò first classified in 1934 the CA3 region of the hippocampus into distinct subregions along the transverse axis (Lorente de Nò, 1934), there has been increasing interest in the diversity of CA3 neuron properties and the potential functional relevance of these differences to hippocampal-dependent spatial encoding and learning and memory. A number of studies support the view that hippocampal CA3 neurons have distinct anatomical (Ishizuka et al., 1990, 1995; Li et al., 1994; Turner et al., 1995) and molecular properties (Thompson et al., 2008) along the transverse axis. In addition the CA3 subregions may differentially participate in encoding spatial and contextual representations (Lee et al., 2015; Lu et al., 2015) and play different roles in learning and memory (Hunsaker et al., 2008; Nakamura et al., 2013) and memory recall (Nakazawa et al., 2016). However, there had been no systematic exploration of the circuit-based mechanisms that enable the distinct CA3 subregions to carry out their specific functions.
Our study provides evidence that the different functional roles of CA3 are associated with distinct proximodistal gradients in CA3 PN intrinsic membrane properties and synaptic connectivity. Using a genetic memory trace strategy (Cazzulino et al., 2016; Denny et al., 2014; Josselyn et al., 2015), we demonstrated variations in the engagement of CA3 neurons in memory recall along the CA3 transverse axis. Our findings support the results of a recent study in showing that CA3c has weaker reactivation compared to more distal regions of CA3 (Nakazawa et al., 2016). By distinguishing between CA3a and CA3b, we find that cellular reactivation efficiency peaks in CA3b. Our findings complement recent behavioral studies and place cell recordings (Hunsaker et al., 2008; Lee et al., 2015; Lu et al., 2015) by revealing the diverse cellular and network properties and functions of CA3 across the transverse axis. Importantly, our results further suggest that differences in local CA3 circuitry may contribute to the differences in the behavioral role and spatial encoding properties of CA3 subregions and the ability of these regions to differentially support memory recall.
Division of CA3/2 region along the proximodistal axis
The large CA3 region, which contains over 100,000 neurons in mice, is traditionally divided into three subregions (a, b, and c) along the transverse axis (Lorente De Nó, 1934). This approach was adopted in our study for convenience. However, we found little evidence for abrupt changes along the transverse axis in electrophysiological properties, consistent with graded proximodistal changes in gene expression (Thompson et al., 2008). The linear gradients of a number of parameters, including resting potential, intrinsic excitability, and sag amplitude, indicate the lack of abrupt boundaries across the CA3 transverse axis. Although a precise molecular, functional and morphological distinction between CA2 and CA3a has been well characterized (Hitti and Siegelbaum, 2014; Kohara et al., 2014; Lein et al., 2005), the anatomical boundary is not abrupt. Indeed, CA3a and CA2 neurons are highly intermingled at the bordering area, as seen from staining using CA2-specific molecular makers (Hitti and Siegelbaum, 2014; Kohara et al., 2014; Lein et al., 2005). Furthermore, despite the abrupt differences in molecularly defined CA2 and CA3 PNs, a number of the functional properties of CA2 PNs fall within a well-defined continual gradient of electrophysiological and synaptic heterogeneity along the CA3/CA2 transverse axis. This observation is also supported by earlier anatomical studies on the topography of CA3/CA2 axonal projections (Ishizuka et al., 1995; Ishizuka et al., 1990; Li et al., 1994; Turner et al., 1995). Indeed, it can be difficult to distinguish CA2 from CA3a based solely on their electrophysiological properties or location. Nonetheless, compared to all CA3 subregions, CA2 shows characteristically strong activation by its direct inputs from EC and weak excitatory drive from MF inputs from DG.
Heterogeneity of intrinsic membrane excitability
One of our more striking results was the marked proximodistal gradient in CA3 intrinsic excitability. Our findings suggest that the heterogeneity in excitability results from the large proximodistal gradient in input resistance (which was previously suggested by Turner et al., 1995), which largely results from a gradient of Ih and cell membrane area. Our findings are in agreement with the proximodistal gradient in CA3 input resistance reported using in vivo recordings from anesthetized rats (Kowalski et al., 2016).
Alterations in intrinsic excitability have been suggested to contribute to learning and memory (Zhang and Linden, 2003), age-related changes in neural function (Simkin et al., 2015), and a number of neuropsychiatric disorders, including autism (Cellot et al., 2016). Thus, the pronounced proximodistal gradient in intrinsic excitability in CA3 may contribute to the proximodistal gradient of CA3 place field properties (Lee et al., 2015; Lu et al., 2015) and memory encoding (Hunsaker et al., 2008) and should be incorporated into future computational models of the CA3 network.
Distinct mechanisms underlie proximodistal heterogeneity of input strength in CA1 versus CA3
A functional divergence along the proximodistal axis has also been observed in CA1 (Henriksen et al., 2010; Igarashi et al., 2014; Masurkar et al., 2017; Nakazawa et al., 2016). The distinctive behavioral roles and physiological properties of distal versus proximal CA1 are primarily attributed to differences in the sources of synaptic input. Presynaptic axons from medial entorhinal cortex (MEC) predominantly target dendrites in SLM of proximal CA1, whereas distal CA1 primarily receives axonal projections from lateral entorhinal cortex (LEC) (Igarashi et al., 2014; Masurkar et al., 2017). By contrast, all CA3 neurons across the proximodistal axis receive both MEC and LEC inputs approximately equally (Witter, 2007). Thus, CA1 and CA3 appear to use distinct mechanisms to achieve a functional segregation along the proximodistal axis, although a subtle proximodistal gradient in intrinsic membrane properties of CA1 PNs has also been observed in rat ventral hippocampus (Jarsky et al., 2008).
Heterogeneity of intrinsic and extrinsic synaptic connections of CA3 circuitry
CA3 neurons receive three major intrinsic and extrinsic excitatory synaptic inputs: the MFs from DG, recurrent collaterals, and direct perforant path input from EC (Witter, 2007). Proximodistal heterogeneity of these three major inputs in CA3 has previously been proposed based solely on anatomical evidence (Claiborne et al., 1986; Ishizuka et al., 1990; Li et al., 1994), but to our knowledge has never before been studied at the functional level. Here we observed heterogeneity in postsynaptic responses along the proximodistal axis of all three major synaptic inputs. There are opposing proximo-to-distal gradients of decreasing excitation from MF inputs and increasing excitation from the direct cortical inputs, consistent with the anatomical connectivity from both EC (Ishizuka et al., 1995) and MF (Claiborne et al., 1986) inputs. Previous anatomical studies have also indicated that CA3a and CA3b receive more abundant recurrent synaptic connections than does CA3c (Ishizuka et al., 1990; Li et al., 1994), consistent with our physiological results.
One of our most striking findings was the non-monotonic heterogeneity in the I/E ratio elicited by recurrent collateral stimulation, with CA3b showing a much lower ratio compared to CA3c or CA3a. This pattern of heterogeneity results from the combined effects of the increasing gradient in the magnitude of the recurrent collateral-evoked monosynaptic EPSC with a previously unknown proximodistal gradient of increasing disynaptic inhibition evoked by stimulation of the CA3 recurrent collaterals. Our anatomical and electrophysiological results show that the gradient of inhibition is caused by an increasing density of PV-expressing basket cell input to the CA3 soma.
Taken as a whole, our physiological results provide a potential circuit mechanism for recent in vivo findings that proximal CA3 (CA3c) is strongly involved in pattern separation, whereas distal CA3 and CA2 are more important for pattern completion (Lee et al., 2015; Lu et al., 2015; Marrone et al., 2014). The heavy influence of DG, which is critical for pattern separation, coupled with the weak excitation by EC and recurrent collaterals, likely accounts for the ability of proximal CA3 to participate strongly in separation. By contrast, the powerful direct cortical drive and recurrent excitation, combined with the relatively weak MF excitation, enable more distal CA3 to participate in pattern completion.
Nonuniform reactivation of CA3 neurons across the transverse axis during contextual fear learning
Classical models of memory storage and pattern completion view CA3 as a homogeneous circuit (Rolls, 2007, 2013b; Treves and Rolls, 1992, 1994). Our electrophysiological and memory trace findings challenge this view (see also Nakazawa et al., 2016). Using a genetic strategy to trace contextual fear memory (Cazzulino et al., 2016; Denny et al., 2014; Josselyn et al., 2015), we provide evidence that recall of the fear memory trace is not uniformly distributed across the CA3 transverse axis. Instead, CA3b plays a distinctively important role compared with adjacent CA3a and CA3c. This is consistent with our electrophysiological results showing that CA3b is more strongly excited by its recurrent collaterals compared with other subregions, as the recurrent collateral network is thought to play a critical role in memory storage and pattern completion (Guzman et al., 2016; Le Duigou et al., 2014; Rolls, 2007). We propose that the powerful recurrent collateral connections in CA3b, coupled with long-term plasticity of recurrent excitatory synapses (Debanne et al., 1998; Kim and Tsien, 2008; McNaughton et al., 1986; Mitra et al., 2012; Montgomery et al., 2001), such as its unique, symmetrical spike-timing dependent plasticity rule (Mishra et al., 2016), enhance the capacity of CA3b to be activated during memory recall. Importantly, because CA3b receives moderately strong inputs from both EC and MF pathway, our model is compatible with theories that both inputs are necessary to form autoassociative memories (Kaifosh and Losonczy, 2016; Rolls, 2007; Treves and Rolls, 1992).
Our results are of particular interest given recent findings of Guzman et al. (2016) on CA3 recurrent connectivity. Using simultaneous whole cell recordings from up to 8 CA3 PNs in ex vivo hippocampal slices and theoretical modeling, these authors demonstrated a non-random pattern of recurrent connectivity that was sufficient to enable the CA3 network to carry out efficient memory recall and pattern completion. Importantly, the performance of the network was critically dependent on the level of inhibition (Guzman et al., 2016). Thus a recurrent network with a lower I/E ratio enables more efficient memory recall, in agreement with our findings comparing memory reactivation and I/E ratio across the CA3 subfields. Further experimental and theoretical studies of the mechanisms by which the CA3 network contributes to learning and memory and spatial encoding will require close attention to the CA3 proximodistal heterogeneity that our study and others have revealed.
STAR METHODS
CONTACT FOR REAGENT AND RESOURCE SHARING
Further information and requests for resources and reagents should be directed to and will be fulfilled by the Lead Contact, Steven Siegelbaum (sas8@,cumc.columbia.edu).
EXPERIMENTAL MODEL AND SUBJECT DETAILS
Mice
The procedures described were conducted in accordance with National Institutes of Health regulations and approved by the Institutional Animal Care and Use Committees of Columbia University and the New York State Psychiatric Institute. The mice were group-housed and maintained in a temperature- and humidity-controlled room on a 12:12 h light/dark cycle. All animals were provided with food and water ad libitum.
Wild-type C57BL/6J male mice were obtained from the Jackson Laboratory. ArcCreERT2(+/−) female mice were generated as described previously (Denny et al., 2014). ArcCreERT2(+/−) female mice were bred with Rosa26-CAG-STOP-floxed-ChR2(H 134R)-EYFP (Ai32) male homozygous mice (Madisen et al., 2012). Recombination was induced using 4-hydroxytamoxifen (4-OHT) (Sigma, St Louis, MO, H7904). Drug was dissolved by sonication in 10% EtOH/90% corn oil at a concentration of 10 mg/ml and 200 μl (2 mg) was injected intraperitoneally (i.p.) into adult mice. All experimental mice were heterozygous for the reporter.
POMC-Cre(+/−) and PV-Cre (+/+) male mice were obtained from Jackson Laboratory and were bred with Rosa26-CAG-STOP-floxed-ChR2(H134R)-EYFP (Ai32) female homozygous mice (Madisen et al., 2012) to generate POMC-Cre/Rosa26-CAG-STOP-floxed-ChR2(H134R)-EYFP and PV-Cre/Rosa26-CAG-STOP-floxed-ChR2(H134R)-EYFP heterozygous mice, respectively. Both male and female heterozygous mice were used in the experiments.
Stereotaxic viral injections
Viral injections were performed as described previously (Hitti and Siegelbaum, 2014). Briefly, mice were anesthetized with isoflurane and placed in a stereotaxic apparatus. The glass micropipettes pulled from a P-2000 laser puller (Sutter Instrument) were used for viral injection. For optogenectics of CA3, 100 nl of AAV9-CaMKII-hChR2(H134R)-EYFP (Penn Vector Core) was injected into the right hemisphere of CA3 of 4–5 month old wild-type mice at +1.8 mm mediolateral, −1.8 mm anteroposterior and −2.2 mm dorsoventral relative to bregma. Mice were sacrificed 9–11 days after viral injection for electrophysiological recordings. For optogenetics of Arc-CreER mice, 200 nl of AAV5-EF1a-DIO-hChR2(E123T/T159C)-EYFP (UNC Vector Core) was injected into each hemisphere of CA3 of 4–5 month old Arc-CreER mice at ±1.8 mm mediolateral, −1.8 mm anteroposterior and −2.2 mm dorsoventral relative to bregma.
Hippocampal slice preparation
Transverse hippocampal slices were prepared from 5–8 week old C57BL/6J male mice from the Jackson Laboratory or 2–5 month old POMC-Cre/Rosa26-CAG-STOP-floxed-ChR2(H134R)-EYFP, PV-Cre/Rosa26-CAG-STOP-floxed-ChR2(H134R)-EYFP, and ArcCreER heterozygous mice as described previously (Sun et al., 2014). In brief, animals were anesthetized and killed by decapitation in accordance with institutional regulations. Hippocampi were dissected out, and transverse slices from the dorsal half of the hippocampaus (400 μm thickness) were cut on a vibratome (Leica VT1200S, Germany) in ice-cold dissection solution containing (in mM): 10 NaCl, 195 sucrose, 2.5 KCl, 10 glucose, 25 NaHCO3, 1.25 NaH2PO4, 2 Na-Pyruvate, 0.5 CaCl2 and 7 MgCl2. The slices were then incubated at 33°C in ACSF (in mM: 125 NaCl, 2.5 KCl, 20 glucose, 25 NaHCO3, 1.25 NaH2PO4, 2 Na-Pyruvate, 2 CaCl2 and 1 MgCl2) for 20–30 min and then kept at room temperature for at least 1.5 hr before transfer to the recording chamber. Cutting and recording solutions were both saturated with 95% O2 and 5% CO2 (pH 7.4). All electrophysiological recordings were performed at 31–32°C.
Whole-cell patch clamp recording
Whole-cell recordings were obtained from pyramidal neurons using the “blind” patch clamp technique. Synaptic potentials were recorded in current clamp mode with the membrane held at −70 to −73 mV with a patch pipette (4–6 MΩ) containing (in mM): 135 K-Gluconate, 5 KCl, 0.1 EGTA-Na, 10 HEPES, 2 NaCl, 5 ATP, 0.4 GTP, 10 phosphocreatine (pH 7.2; 280–290 mOsm). For IPSC measurements, a Cs+ based intracellular solution was used: 135 Cs-Methanesulfonate, 5 KCl, 0.1 EGTA-Na, 10 HEPES, 2 NaCl, 5 ATP, 0.4 GTP, 10 phosphocreatine (pH 7.2; 280–290 mOsm). 0.2–0.5% biocytin was routinely included in the intracellular solution. EPSCs and IPSCs were measured in voltage-clamp mode with a holding potential of −75 mV or 0 mV, respectively. Series resistance was monitored throughout each experiment; neurons with a series resistance >25 MΩ were excluded from analysis. Extracellular field potentials were recorded with a patch pipette containing 1 M NaCl. Synaptic potentials were evoked by monopolar stimulation with a patch pipette filled with 1 M NaCl and located in stratum lacunosum moleculare of the CA1 region (Figure 5) or in stratum radiatum of the CA3 region (Figure 6).
Neurons were held at around −72 mV for input-output curves during current clamp recording. Resting membrane potential was measured immediately upon break-in. The liquid junction potential was not corrected. To measure input resistance, we injected constant current pulses with a duration of 500 ms and amplitude ranging from −40 pA to 30 pA in 10 pA steps. Input resistance was quantified by linearly fitting the voltage change against injected current. Membrane capacitance was calculated as the membrane time constant divided by input resistance.
fEPSPs and EPSPs were recorded in the presence of GABAA and GABAB receptor antagonists (1 μM SR 95531 and 2 μM CGP 55845, Tocris) (Figure 5). Field recordings of EPSPs were performed in stratum lacunosum moleculare in different hippocampal areas.
Optogenetics
Channelrhodopsin-2 was activated using 470-nm blue light pulses lasting 2 ms were delivered via a 40xobjective placed above the slices through an LED light source (Thorlabs) driven by Axograph software. The light intensity was adjusted for each slice. Within each slice, the same light intensity was used for comparing the responses from pairs of neurons sequentially recorded in the same slice (Figures 4 and 7). During voltage-clamp recording, neurons were held at −75 mV for EPSC measurements, whereas PSPs were measured at −72 mV in current-clamp mode.
Biocytin staining
3,3′-diaminobenzidine tetrahydrochloride (DAB) staining was performed as described previously (Sun et al., 2014). Briefly, after each recording, slices were fixed at 4°C for at least 24 hours in 4% paraformaldehyde in phosphate buffer (PBS), pH 7.3. After fixation, slices were incubated in 0.3% hydrogen peroxide and a 10% methanol mix for 40 min. Subsequently, the slices were treated with PBS containing 2% avidin-biotinylated horseradish peroxidase complex (ABC, Vector Laboratories) and 0.5% Triton for 2 days at 4°C. ABC was removed by several rinses with PBS before development with DAB and 0.005% hydrogen peroxide. Subsequently, slices were rinsed in PBS several times and processed through increasing concentrations of glycerol, and then embedded in mounting media (Fluorogel, Electron Microscopy Sciences). Hippocampal pyramidal neurons were then manually reconstructed and analyzed using Neurolucida.
For streptavidin staining, slices were treated with PBS containing normal goat serum (10%) and 0.5% Triton for 2 hours at room temperature. Slices were subsequently incubated in PBS containing Streptavidin, Alexa Fluor 594 conjugate (1:500) and 0.1% Triton for 2 days at 4°C. Subsequently, slices were rinsed in PBS several times and processed through increasing concentrations of glycerol, and then embedded in mounting media (Fluorogel, Electron Microscopy Sciences).
Contextual fear conditioning
The three-shock Contextual fear conditioning (CFC) procedures were performed as described previously (Cazzulino et al., 2016; Denny et al., 2014). Briefly, mice were placed in the conditioning chamber, received three shocks 180, 240, and 300 s later (2 s, 0.75 mA), and were removed 15 s following the last shock. For context A exposures, CFC training and context exposure were conducted with the conditioning chambers configured exactly as during the CFC training in context A.
Immunohistochemistry
Mice were deeply anesthetized, and brains were processed as previously described (Denny et al., 2014). Briefly, floating sections were first rinsed three times in 1x PBS and then blocked in 1x PBS with 0.5% Triton X-100 and 10% normal donkey serum for 2 hr at room temperature (RT). Incubation with primary antibodies was performed at 4°C overnight (chicken anti-GFP 1:500, Abcam, Cambridge, MA, ab13970; rabbit anti-c-fos, 1:2000 or 1:5000, Calbiochem, Darmstadt, Germany; rabbit anti-Parvalbumin, 1:1000, Abcam, Cambridge, MA, ab11427) in 1 x PBS with 0.5% Triton X-100. Sections were then washed three times in 1x PBS and incubated with secondary antibodies (donkey anti-rabbit Cy3; biotinylated donkey anti-chicken; 1:500, Jackson ImmunoResearch, West Grove, PA) for 2 hr at RT. Sections were then washed three times in 1x PBS and incubated with a tertiary antibody (avidin-Cy2, 1:250, Jackson ImmunoResearch, West Grove, PA) for 1 hr at RT. Sections were washed three times in 1X PBS, mounted on slides, and coverslipped with ProLong Gold (Invitrogen).
Confocal microscopy
Images were acquired with a Zeiss LSM 700 confocal microscope using a 20 X objective. Individual tiled images including the CA3 pyramidal layer of the entire transverse axis were acquired at a z-stack with a 1.5–2 μm interval. The CA3 transverse pyramidal layer from each section was equally divided into a, b, and c subregions for cell quantification. EYFP+ and c-fos+ cells were counted bilaterally for 5–8 sections per animal from the dorsal hippocampus using ImageJ. To calculate the percent of reactivated cells, we counted the total number of EYFP+ or c-fos+ cells, and the number of c-fos+ cells that were colabeled with EYFP+ from each animal. The percent of reactivated cells is calculated as ((EYFP+/c-fos+)/c-fos+) × 100% or ((EYFP+/c-fos+)/EYFP+) × 100%.
QUANTIFICATION AND STATISTICAL ANALYSIS
Graphpad Prism 7 was used for all statistical analyses. Results were expressed as mean ± SEM. P < 0.05 is considered statistically significant. Statistical tests were performed using paired Student’s t test on data shown in Figure 2F,J,H, Figure 3K, Figure 4, Figure 7C,D, and Figure S5B,D. Statistical tests were performed using one-way or two-way ANOVA followed by Tukey’s multiple comparisons on data shown in Figure 1, Figure 2C,L, Figure 5, Figure 6, Figure 7F, Figure 8, Figure 9, Figure S1, Figure S3, and Figure S5G. The numbers (n) of animals or neurons in figures have been listed in the Figure Legends. Specifically, “n” refers to the number of mice that underwent CFC and behavioral testing in Figure 9I–L; “n” refers to the number of slices from which data were obtained in Figure 5B; in all other figures, “n” refers to the number of neurons from which whole-cell recordings or morphological reconstructions were performed.
Supplementary Material
Highlights.
CA3 shows a marked proximodistal gradient in intrinsic and synaptic properties
Mossy fiber and direct cortical inputs show opposing gradients of synaptic strength
CA3b has the strongest recurrent excitation because of reduced inhibition
This connectivity can explain robust CA3b reactivation during fear memory retrieval
Acknowledgments
We thank C. Anacker and R. Hen for generously providing us POMC-Cre mouse line; K. Martyniuk, C. LaGamma, and J. McGowan for assistance in behavioral experiments; D. Cooper for assistance in immunohistochemistry experiments; and S. Hassan, E. Buss, T. Bock, F. Leroy, and A. Losonczy for helpful discussions and comments on the previous version of the manuscript. This work was supported by NIMH R01MH104602 and NIMH R01MH106629 (S.A.S.).
Footnotes
Publisher's Disclaimer: This is a PDF file of an unedited manuscript that has been accepted for publication. As a service to our customers we are providing this early version of the manuscript. The manuscript will undergo copyediting, typesetting, and review of the resulting proof before it is published in its final citable form. Please note that during the production process errors may be discovered which could affect the content, and all legal disclaimers that apply to the journal pertain.
Author Contributions
Q.S. and S.A.S. designed the study; Q.S. performed the experiments and analyzed the data; A.S. performed neuron morphological reconstruction; Q.S., A.S.C. and C.A.D. performed CFC and immunohistochemistry; A.M.S. contributed to PV immunohistochemistry; and Q.S. and S.A.S. wrote the paper with help from the other authors.
References
- Cazzulino AS, Martinez R, Tomm NK, Denny CA. Improved specificity of hippocampal memory trace labeling. Hippocampus. 2016;26:752–762. doi: 10.1002/hipo.22556. [DOI] [PMC free article] [PubMed] [Google Scholar]
- Cellot G, Maggi L, Di Castro MA, Catalano M, Migliore R, Migliore M, Scattoni ML, Calamandrei G, Cherubini E. Premature changes in neuronal excitability account for hippocampal network impairment and autistic-like behavior in neonatal BTBR T+tf/J mice. Sci Rep. 2016;6:31696. doi: 10.1038/srep31696. [DOI] [PMC free article] [PubMed] [Google Scholar]
- Cembrowski MS, Bachman JL, Wang L, Sugino K, Shields BC, Spruston N. Spatial Gene-Expression Gradients Underlie Prominent Heterogeneity of CA1 Pyramidal Neurons. Neuron. 2016;89:351–368. doi: 10.1016/j.neuron.2015.12.013. [DOI] [PubMed] [Google Scholar]
- Chevaleyre V, Siegelbaum SA. Strong CA2 pyramidal neuron synapses define a powerful disynaptic cortico-hippocampal loop. Neuron. 2010;66:560–572. doi: 10.1016/j.neuron.2010.04.013. [DOI] [PMC free article] [PubMed] [Google Scholar]
- Claiborne BJ, Amaral DG, Cowan WM. A light and electron microscopic analysis of the mossy fibers of the rat dentate gyrus. J Comp Neurol. 1986;246:435–458. doi: 10.1002/cne.902460403. [DOI] [PubMed] [Google Scholar]
- Debanne D, Gahwiler BH, Thompson SM. Long-term synaptic plasticity between pairs of individual CA3 pyramidal cells in rat hippocampal slice cultures. J Physiol. 1998;507(Pt 1):237–247. doi: 10.1111/j.1469-7793.1998.237bu.x. [DOI] [PMC free article] [PubMed] [Google Scholar]
- Denny CA, Kheirbek MA, Alba EL, Tanaka KF, Brachman RA, Laughman KB, Tomm NK, Turi GF, Losonczy A, Hen R. Hippocampal memory traces are differentially modulated by experience, time, and adult neurogenesis. Neuron. 2014;83:189–201. doi: 10.1016/j.neuron.2014.05.018. [DOI] [PMC free article] [PubMed] [Google Scholar]
- Guzman SJ, Schlogl A, Frotscher M, Jonas P. Synaptic mechanisms of pattern completion in the hippocampal CA3 network. Science. 2016;353:1117–1123. doi: 10.1126/science.aaf1836. [DOI] [PubMed] [Google Scholar]
- Henriksen EJ, Colgin LL, Barnes CA, Witter MP, Moser MB, Moser EI. Spatial representation along the proximodistal axis of CA1. Neuron. 2010;68:127–137. doi: 10.1016/j.neuron.2010.08.042. [DOI] [PMC free article] [PubMed] [Google Scholar]
- Hippenmeyer S, Vrieseling E, Sigrist M, Portmann T, Laengle C, Ladle DR, Arber S. A developmental switch in the response of DRG neurons to ETS transcription factor signaling. Plos Biol. 2005;3:878–890. doi: 10.1371/journal.pbio.0030159. [DOI] [PMC free article] [PubMed] [Google Scholar]
- Hitti FL, Siegelbaum SA. The hippocampal CA2 region is essential for social memory. Nature. 2014;508:88–92. doi: 10.1038/nature13028. [DOI] [PMC free article] [PubMed] [Google Scholar]
- Hunsaker MR, Rosenberg JS, Kesner RP. The role of the dentate gyrus, CA3a,b, and CA3c for detecting spatial and environmental novelty. Hippocampus. 2008;18:1064–1073. doi: 10.1002/hipo.20464. [DOI] [PubMed] [Google Scholar]
- Igarashi KM, Ito HT, Moser EI, Moser MB. Functional diversity along the transverse axis of hippocampal area CA1. FEBS Lett. 2014;588:2470–2476. doi: 10.1016/j.febslet.2014.06.004. [DOI] [PubMed] [Google Scholar]
- Isaacson JS, Scanziani M. How inhibition shapes cortical activity. Neuron. 2011;72:231–243. doi: 10.1016/j.neuron.2011.09.027. [DOI] [PMC free article] [PubMed] [Google Scholar]
- Ishizuka N, Cowan WM, Amaral DG. A quantitative analysis of the dendritic organization of pyramidal cells in the rat hippocampus. J Comp Neurol. 1995;362:17–45. doi: 10.1002/cne.903620103. [DOI] [PubMed] [Google Scholar]
- Ishizuka N, Weber J, Amaral DG. Organization of intrahippocampal projections originating from CA3 pyramidal cells in the rat. J Comp Neurol. 1990;295:580–623. doi: 10.1002/cne.902950407. [DOI] [PubMed] [Google Scholar]
- Jarsky T, Mady R, Kennedy B, Spruston N. Distribution of bursting neurons in the CA1 region and the subiculum of the rat hippocampus. J Comp Neurol. 2008;506:535–547. doi: 10.1002/cne.21564. [DOI] [PubMed] [Google Scholar]
- Josselyn SA, Kohler S, Frankland PW. Finding the engram. Nat Rev Neurosci. 2015;16:521–534. doi: 10.1038/nrn4000. [DOI] [PubMed] [Google Scholar]
- Kaifosh P, Losonczy A. Mnemonic Functions for Nonlinear Dendritic Integration in Hippocampal Pyramidal Circuits. Neuron. 2016;90:622–634. doi: 10.1016/j.neuron.2016.03.019. [DOI] [PMC free article] [PubMed] [Google Scholar]
- Kamiya H, Shinozaki H, Yamamoto C. Activation of metabotropic glutamate receptor type 2/3 suppresses transmission at rat hippocampal mossy fibre synapses. J Physiol. 1996;493(Pt 2):447–455. doi: 10.1113/jphysiol.1996.sp021395. [DOI] [PMC free article] [PubMed] [Google Scholar]
- Kesner RP. Behavioral functions of the CA3 subregion of the hippocampus. Learn Mem. 2007;14:771–781. doi: 10.1101/lm.688207. [DOI] [PubMed] [Google Scholar]
- Kesner RP, Rolls ET. A computational theory of hippocampal function, and tests of the theory: new developments. Neurosci Biobehav Rev. 2015;48:92–147. doi: 10.1016/j.neubiorev.2014.11.009. [DOI] [PubMed] [Google Scholar]
- Kheirbek MA, Drew LJ, Burghardt NS, Costantini DO, Tannenholz L, Ahmari SE, Zeng H, Fenton AA, Hen R. Differential control of learning and anxiety along the dorsoventral axis of the dentate gyrus. Neuron. 2013;77:955–968. doi: 10.1016/j.neuron.2012.12.038. [DOI] [PMC free article] [PubMed] [Google Scholar]
- Kim J, Tsien RW. Synapse-specific adaptations to inactivity in hippocampal circuits achieve homeostatic gain control while dampening network reverberation. Neuron. 2008;58:925–937. doi: 10.1016/j.neuron.2008.05.009. [DOI] [PMC free article] [PubMed] [Google Scholar]
- Kohara K, Pignatelli M, Rivest AJ, Jung HY, Kitamura T, Suh J, Frank D, Kajikawa K, Mise N, Obata Y, et al. Cell type-specific genetic and optogenetic tools reveal hippocampal CA2 circuits. Nat Neurosci. 2014;17:269–279. doi: 10.1038/nn.3614. [DOI] [PMC free article] [PubMed] [Google Scholar]
- Kowalski J, Gan J, Jonas P, Pernia-Andrade AJ. Intrinsic membrane properties determine hippocampal differential firing pattern in vivo in anesthetized rats. Hippocampus. 2016;26:668–682. doi: 10.1002/hipo.22550. [DOI] [PMC free article] [PubMed] [Google Scholar]
- Lawrence JJ, McBain CJ. Interneuron Diversity series: Containing the detonation - Feedforward inhibition in the CA3 hippocampus. Trends in Neurosciences. 2003;26:631–640. doi: 10.1016/j.tins.2003.09.007. [DOI] [PubMed] [Google Scholar]
- Le Duigou C, Simonnet J, Telenczuk MT, Fricker D, Miles R. Recurrent synapses and circuits in the CA3 region of the hippocampus: an associative network. Front Cell Neurosci. 2014;7:262. doi: 10.3389/fncel.2013.00262. [DOI] [PMC free article] [PubMed] [Google Scholar]
- Lee H, Wang C, Deshmukh SS, Knierim JJ. Neural Population Evidence of Functional Heterogeneity along the CA3 Transverse Axis: Pattern Completion versus Pattern Separation. Neuron. 2015;87:1093–1105. doi: 10.1016/j.neuron.2015.07.012. [DOI] [PMC free article] [PubMed] [Google Scholar]
- Lee I, Yoganarasimha D, Rao G, Knierim JJ. Comparison of population coherence of place cells in hippocampal subfields CA1 and CA3. Nature. 2004;430:456–459. doi: 10.1038/nature02739. [DOI] [PubMed] [Google Scholar]
- Lein ES, Callaway EM, Albright TD, Gage FH. Redefining the boundaries of the hippocampal CA2 subfield in the mouse using gene expression and 3-dimensional reconstruction. J Comp Neurol. 2005;485:1–10. doi: 10.1002/cne.20426. [DOI] [PubMed] [Google Scholar]
- Leutgeb S, Leutgeb JK, Treves A, Moser MB, Moser EI. Distinct ensemble codes in hippocampal areas CA3 and CA1. Science. 2004;305:1295–1298. doi: 10.1126/science.1100265. [DOI] [PubMed] [Google Scholar]
- Li XG, Somogyi P, Ylinen A, Buzsaki G. The hippocampal CA3 network: an in vivo intracellular labeling study. J Comp Neurol. 1994;339:181–208. doi: 10.1002/cne.903390204. [DOI] [PubMed] [Google Scholar]
- Lorente De Nó R. Studies on the structure of the cerebral cortex. II. Continuation of the study of the ammonic system. J Psychol Neurol (Leipzig) 1934;46:113–117. [Google Scholar]
- Lu L, Igarashi KM, Witter MP, Moser EI, Moser MB. Topography of Place Maps along the CA3-to-CA2 Axis of the Hippocampus. Neuron. 2015;87:1078–1092. doi: 10.1016/j.neuron.2015.07.007. [DOI] [PubMed] [Google Scholar]
- Madisen L, Mao T, Koch H, Zhuo JM, Berenyi A, Fujisawa S, Hsu YW, Garcia AJ, 3rd, Gu X, Zanella S, et al. A toolbox of Cre-dependent optogenetic transgenic mice for light-induced activation and silencing. Nat Neurosci. 2012;15:793–802. doi: 10.1038/nn.3078. [DOI] [PMC free article] [PubMed] [Google Scholar]
- Marr D. Simple memory: a theory for archicortex. Philos Trans R Soc Lond B Biol Sci. 1971;262:23–81. doi: 10.1098/rstb.1971.0078. [DOI] [PubMed] [Google Scholar]
- Marrone DF, Satvat E, Odintsova IV, Gheidi A. Dissociation of spatial representations within hippocampal region CA3. Hippocampus. 2014;24:1417–1420. doi: 10.1002/hipo.22367. [DOI] [PubMed] [Google Scholar]
- Masurkar AV, Srinivas KV, Brann DH, Warren R, Lowes DC, Siegelbaum SA. Medial and Lateral Entorhinal Cortex Differentially Excite Deep versus Superficial CA1 Pyramidal Neurons. Cell Rep. 2017;18:148–160. doi: 10.1016/j.celrep.2016.12.012. [DOI] [PMC free article] [PubMed] [Google Scholar]
- McHugh TJ, Jones MW, Quinn JJ, Balthasar N, Coppari R, Elmquist JK, Lowell BB, Fanselow MS, Wilson MA, Tonegawa S. Dentate gyrus NMDA receptors mediate rapid pattern separation in the hippocampal network. Science. 2007;317:94–99. doi: 10.1126/science.1140263. [DOI] [PubMed] [Google Scholar]
- McHugh TJ, Tonegawa S. CA3 NMDA receptors are required for the rapid formation of a salient contextual representation. Hippocampus. 2009;19:1153–1158. doi: 10.1002/hipo.20684. [DOI] [PMC free article] [PubMed] [Google Scholar]
- McNaughton BL, Barnes CA, Rao G, Baldwin J, Rasmussen M. Long-term enhancement of hippocampal synaptic transmission and the acquisition of spatial information. J Neurosci. 1986;6:563–571. doi: 10.1523/JNEUROSCI.06-02-00563.1986. [DOI] [PMC free article] [PubMed] [Google Scholar]
- McNaughton BL, Morris RGM. Hippocampal synaptic enhancement and information storage within a distributed memory system. Trends Neurosci. 1987;10:408–415. [Google Scholar]
- Miles R, Wong RK. Unitary inhibitory synaptic potentials in the guinea-pig hippocampus in vitro. J Physiol. 1984;356:97–113. doi: 10.1113/jphysiol.1984.sp015455. [DOI] [PMC free article] [PubMed] [Google Scholar]
- Miles R, Wong RK. Excitatory synaptic interactions between CA3 neurones in the guinea-pig hippocampus. J Physiol. 1986;373:397–418. doi: 10.1113/jphysiol.1986.sp016055. [DOI] [PMC free article] [PubMed] [Google Scholar]
- Miles R, Wong RK. Inhibitory control of local excitatory circuits in the guinea-pig hippocampus. J Physiol. 1987;388:611–629. doi: 10.1113/jphysiol.1987.sp016634. [DOI] [PMC free article] [PubMed] [Google Scholar]
- Mishra RK, Kim S, Guzman SJ, Jonas P. Symmetric spike timing-dependent plasticity at CA3-CA3 synapses optimizes storage and recall in autoassociative networks. Nat Commun. 2016;7:11552. doi: 10.1038/ncomms11552. [DOI] [PMC free article] [PubMed] [Google Scholar]
- Mitra A, Mitra SS, Tsien RW. Heterogeneous reallocation of presynaptic efficacy in recurrent excitatory circuits adapting to inactivity. Nat Neurosci. 2012;15:250–257. doi: 10.1038/nn.3004. [DOI] [PMC free article] [PubMed] [Google Scholar]
- Montgomery JM, Pavlidis P, Madison DV. Pair recordings reveal all-silent synaptic connections and the postsynaptic expression of long-term potentiation. Neuron. 2001;29:691–701. doi: 10.1016/s0896-6273(01)00244-6. [DOI] [PubMed] [Google Scholar]
- Nakamura NH, Flasbeck V, Maingret N, Kitsukawa T, Sauvage MM. Proximodistal segregation of nonspatial information in CA3: preferential recruitment of a proximal CA3-distal CA1 network in nonspatial recognition memory. J Neurosci. 2013;33:11506–11514. doi: 10.1523/JNEUROSCI.4480-12.2013. [DOI] [PMC free article] [PubMed] [Google Scholar]
- Nakashiba T, Young JZ, McHugh TJ, Buhl DL, Tonegawa S. Transgenic inhibition of synaptic transmission reveals role of CA3 output in hippocampal learning. Science. 2008;319:1260–1264. doi: 10.1126/science.1151120. [DOI] [PubMed] [Google Scholar]
- Nakazawa K, Quirk MC, Chitwood RA, Watanabe M, Yeckel MF, Sun LD, Kato A, Carr CA, Johnston D, Wilson MA, Tonegawa S. Requirement for hippocampal CA3 NMDA receptors in associative memory recall. Science. 2002;297:211–218. doi: 10.1126/science.1071795. [DOI] [PMC free article] [PubMed] [Google Scholar]
- Nakazawa K, Sun LD, Quirk MC, Rondi-Reig L, Wilson MA, Tonegawa S. Hippocampal CA3 NMDA receptors are crucial for memory acquisition of one-time experience. Neuron. 2003;38:305–315. doi: 10.1016/s0896-6273(03)00165-x. [DOI] [PubMed] [Google Scholar]
- Nakazawa Y, Pevzner A, Tanaka KZ, Wiltgen BJ. Memory retrieval along the proximodistal axis of CA1. Hippocampus. 2016;26:1140–1148. doi: 10.1002/hipo.22596. [DOI] [PMC free article] [PubMed] [Google Scholar]
- Neunuebel JP, Knierim JJ. CA3 Retrieves Coherent Representations from Degraded Input: Direct Evidence for CA3 Pattern Completion and Dentate Gyrus Pattern Separation. Neuron. 2014;81:416–427. doi: 10.1016/j.neuron.2013.11.017. [DOI] [PMC free article] [PubMed] [Google Scholar]
- Papp G, Witter MP, Treves A. The CA3 network as a memory store for spatial representations. Learn Mem. 2007;14:732–744. doi: 10.1101/lm.687407. [DOI] [PubMed] [Google Scholar]
- Robinson RB, Siegelbaum SA. Hyperpolarization-activated cation currents: from molecules to physiological function. Annu Rev Physiol. 2003;65:453–480. doi: 10.1146/annurev.physiol.65.092101.142734. [DOI] [PubMed] [Google Scholar]
- Rolls ET. An attractor network in the hippocampus: theory and neurophysiology. Learn Mem. 2007;14:714–731. doi: 10.1101/lm.631207. [DOI] [PubMed] [Google Scholar]
- Rolls ET. The mechanisms for pattern completion and pattern separation in the hippocampus. Front Syst Neurosci. 2013a;7:74. doi: 10.3389/fnsys.2013.00074. [DOI] [PMC free article] [PubMed] [Google Scholar]
- Rolls ET. A quantitative theory of the functions of the hippocampal CA3 network in memory. Front Cell Neurosci. 2013b;7:98. doi: 10.3389/fncel.2013.00098. [DOI] [PMC free article] [PubMed] [Google Scholar]
- Simkin D, Hattori S, Ybarra N, Musial TF, Buss EW, Richter H, Oh MM, Nicholson DA, Disterhoft JF. Aging-Related Hyperexcitability in CA3 Pyramidal Neurons Is Mediated by Enhanced A-Type K+ Channel Function and Expression. J Neurosci. 2015;35:13206–13218. doi: 10.1523/JNEUROSCI.0193-15.2015. [DOI] [PMC free article] [PubMed] [Google Scholar]
- Spencer WA, Kandel ER. Hippocampal neuron responses to selective activation of recurrent collaterals of hippocampofugal axons. Exp Neurol. 1961;4:149–161. [Google Scholar]
- Srinivas KV, Buss EW, Sun Q, Santoro B, Takahashi H, Nicholson DA, Siegelbaum SA. The Dendrites of CA2 and CA1 Pyramidal Neurons Differentially Regulate Information Flow in the Cortico-Hippocampal Circuit. Journal of Neuroscience. 2017;37:3276–3293. doi: 10.1523/JNEUROSCI.2219-16.2017. [DOI] [PMC free article] [PubMed] [Google Scholar]
- Sun Q, Srinivas KV, Sotayo A, Siegelbaum SA. Dendritic Na+ spikes enable cortical input to drive action potential output from hippocampal CA2 pyramidal neurons. Elife. 2014;3 doi: 10.7554/eLife.04551. [DOI] [PMC free article] [PubMed] [Google Scholar]
- Thompson CL, Pathak SD, Jeromin A, Ng LL, MacPherson CR, Mortrud MT, Cusick A, Riley ZL, Sunkin SM, Bernard A, et al. Genomic anatomy of the hippocampus. Neuron. 2008;60:1010–1021. doi: 10.1016/j.neuron.2008.12.008. [DOI] [PubMed] [Google Scholar]
- Treves A, Rolls ET. Computational constraints suggest the need for two distinct input systems to the hippocampal CA3 network. Hippocampus. 1992;2:189–199. doi: 10.1002/hipo.450020209. [DOI] [PubMed] [Google Scholar]
- Treves A, Rolls ET. Computational analysis of the role of the hippocampus in memory. Hippocampus. 1994;4:374–391. doi: 10.1002/hipo.450040319. [DOI] [PubMed] [Google Scholar]
- Turner DA, Li XG, Pyapali GK, Ylinen A, Buzsaki G. Morphometric and electrical properties of reconstructed hippocampal CA3 neurons recorded in vivo. J Comp Neurol. 1995;356:580–594. doi: 10.1002/cne.903560408. [DOI] [PubMed] [Google Scholar]
- Witter MP. Intrinsic and extrinsic wiring of CA3: indications for connectional heterogeneity. Learn Mem. 2007;14:705–713. doi: 10.1101/lm.725207. [DOI] [PubMed] [Google Scholar]
- Zhang W, Linden DJ. The other side of the engram: experience-driven changes in neuronal intrinsic excitability. Nat Rev Neurosci. 2003;4:885–900. doi: 10.1038/nrn1248. [DOI] [PubMed] [Google Scholar]
Associated Data
This section collects any data citations, data availability statements, or supplementary materials included in this article.