Abstract
Introduction
Increased focus has been placed on perioperative and long-term outcomes in the treatment of peripheral artery disease (PAD), both for purposes of quality improvement and for assessment of performance at a surgeon and institutional level. This study evaluates regional variation in outcomes following treatment for PAD within the Vascular Quality Initiative (VQI). By describing the variation in practice patterns and outcomes across regions we hope that each regionally-based quality group can select which areas are most important for them to focus on as they will have access to their regional data to compare.
Methods
We identified all patients in the VQI who had infrainguinal bypass or endovascular intervention from 2009 to 2014. We compared variation in perioperative and one-year outcomes stratified by symptom status and revascularization type among the 16 regional groups of the VQI. We analyzed variation in perioperative endpoints using χ2 analysis and one-year endpoints were analyzed using Kaplan Meier and Life Table analysis.
Results
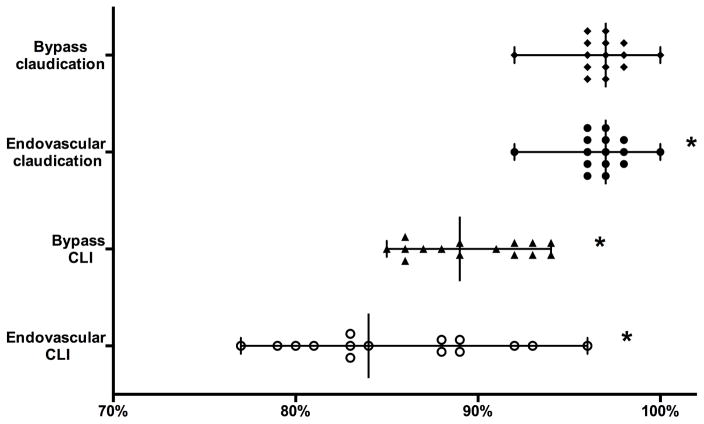
We identified 15,338 bypass procedures for symptomatic PAD; 27% for claudication, 59% for chronic limb-threatening ischemia (CLI)(61% of these for tissue loss), and 14% for acute limb ischemia. We identified 33,925 endovascular procedures for symptomatic PAD; 42% for claudication, 48% for CLI (73% of these for tissue loss), and 10% for acute limb ischemia. Thirty-day mortality varied significantly after endovascular intervention for CLI (0.5 – 3%, P <.001) but not for claudication (0.0 – 0.5%, P = .77) or for bypass for claudication (0.0 – 2.6%, P = .37) or CLI (0.0 – 5.0%, P = .08). After bypass, rates of >2units transfused (claudication: 0.0 – 13%, P<.001; CLI: 6.9 – 27%, P<.001) varied significantly. In-hospital major amputation was variable after bypass for CLI (0.0 – 4.3%, P=.004) but not for claudication (0.0 – 0.6%, P=.98) as was post-operative MI (claudication: 0.0 – 4%, P=.36; CLI: 0.8 – 6%, P=.001). One-year survival varied significantly for endovascular interventions for claudication (92 – 100%, P<.001), bypass for CLI (85 – 94%, P<.001), and endovascular interventions for CLI (77 – 96%, P<.001) but not after bypass for claudication (95 – 100%, P=.57).
Conclusion
In this real-world comparison among VQI regions we found significant variationin perioperative and one-year endpoints for patients with PAD undergoing bypass or endovascular intervention. This study highlights opportunities for quality improvement efforts to reduce variation and improve outcomes.
Introduction
Variation in outcomes after surgery has been a focus of much debate in healthcare. In 2013, according to the Centers for Disease Control and Prevention (CDC), the rate of death from complications of medical and surgical care ranged from 1.2 to 8.1 per 100,000 among patients 55 and older.[1] But this figure may be misleading, as complications following surgical care are poorly defined. Early studies on regional variation in mortality rates suggested variation was not due to case mix alone but included numerous other patient and provider factors.[2–4] Since these early studies highlighting the variation that exists there have been multiple efforts to reduce variation in outcomes. Such efforts include selective referral initiatives, pay-for-performance programs, and pay-for-participation clinical registries. Despite the good intentions of such programs a full understanding of the variation in surgical practice and its causes remains unknown. Birkmeyer et al. has suggested that variation in surgical mortality is not synonymous with quality of care but also comes from chance and case mix.[5] Compounding the difficulty of identifying the cause of variation in outcomes are the methods used for calculation of an adverse outcome rate. Prior to this Iezonni et al. introduced the “Algebra of Effectiveness” which stated that patient outcomes resulted from patient factors, effectiveness of care delivered, and random effects.[6] The Centers for Medicare and Medicaid Services established a list of Physician Quality Reporting System (PQRS) measures to judge quality, which (for now) focus on one-year adverse limb and patient events in those with claudication where event rates should be quite low.[7] For CLI, disease severity and variability of clinical status at presentation have made it difficult to define benchmark rates of adverse events but in creating endpoint targets for the comparison of catheter based treatments to bypass, the Society for Vascular Surgery (SVS) has provided meaningful targets for comparison in CLI as well.[8] Both these measures analyze outcomes in an unadjusted but stratified manner. A threatened limb classification to stratify risk of amputation based on the status of the limb at presentation has been published by the SVS and wound, ischemia, and foot infection variables are being incorporated into the VQI, but VQI outcomes data using this classication system are not yet available.[9]
In this study, we examine the variation in outcomes following lower extremity revascularization, across the regions of the Society for Vascular Surgery- Vascular Quality Initiative (VQI), a national clinical vascular registry. This is a follow-up to our initial study evaluating variation in patient selection, treatment type, and process measures for lower extremity vascular disease across the same population.[10] In this mansucript we will focus on perioperative and select long-term outcomes following lower extremity intervention, including those in Table I. This report is meant to serve as a description of current outcomes related to the treatment of peripheral artery disease and we hope will serve as a tool for future quality improvement projects.
Table I.
Proposed Metrics for Endpoints
| Existing Recommendations | YearA |
|---|---|
| Antiplatelet and Statin at time of Discharge for all Symptomatic PAD [7,13,17,18] | 2007 |
| Surveillance of Patency at 1-year after Intervention for Patients with Claudication [7] | 2015 |
| Zero 30-day Major Amputation Rate after Intervention for Claudication [13] | 2015 |
|
| |
| Existing Recommendations without Clear Threshold | |
|
| |
| Low to Zero 30-day Mortality Rate after Intervention for Claudication [7,13,17] | 2007 |
| High Amputation Free Survival and Survival at 1-year after Intervention for Patients with Claudication [7,13] | 2013 |
|
| |
| Potential Endpoints | |
|
| |
| 30-day Major Amputation and MACE Rates after Intervention for CLI [8] | 2009 |
| Amputation Free Survival and Survival at 1-year after Intervention for Patients with CLI [8] | 2009 |
| Surgical Site Infection Rates Stratified by Symptom Status | |
|
| |
| Endpoints of Unknown Significance | |
|
| |
| Threshold for Blood Transfusion | |
Year represents earliest year of publication for a guideline or supporting evidence
Methods
Dataset
The VQI database was used to identify all infrainguinal open and endovascular operations from participating hospitals across the United States, from 2009–2014. The VQI is a national clinical registry, set up as collaboration between regional quality groups, as described previously.[11] More information about the VQI can be found at www.vascularqualityinitiative.org/. The Institutional Review Board at Beth Israel Deaconess Medical Center approved this study and informed consent was waived.
Cohorts and variables
All 16 regions were included in the analysis and each region had more than 100 surgical bypasses and 100 lower extremity endovascular interventions. Outcomes were stratified by symptom status and procedure type. All endovascular procedures consisting of isolated suprainguinal interventions were excluded (n = 13560). Patients presenting with acute limb ischemia were analyzed separately (n = 5400). Outcomes were evaluated at perioperative (inhospital and 30-day) and one-year time points. Patients were defined as eligible for one-year follow-up if their operative date occurred 9 or more months prior to the date of our data extraction (August 1, 2014). All procedures were used to determine perioperative outcomes but only a patient’s initial endovascular and bypass procedures were used to evaluate one-year events. This excluded 23% of endovascular cases and 10% of bypasses, which were secondary.
Renal deterioration was defined as serum creatinine increase > 0.5mg/dl or new dialysis. A technically unsuccessful endovascular intervention was defined as residual stenosis > 30% or failure to cross a lesion in any treated lesion. Hematoma was defined as either minor, needing transfusion, or re-operation. Intra-procedural endovascular complication included dissection, perforation, or embolization. Definitions above are defined by the VQI registry and many cannot be modified. Primary patency was defined as a patent treated vessel at time of discharge without the need for additional interventions. The Society for Vascular Surgery Objective Performance Goals (OPG) define clinical high-risk patients as age > 80 with tissue loss for stratification purposes, which we employ for this analysis.[8]
Statistical Analysis
All perioperative outcomes reported were in-hospital events with the exception of 30-day mortality and perioperative death, defined as in-hospital or 30-day mortality, and were compared using χ2 analysis, with P-value <0.05 considered as significant, which highlights that there was a significant difference across the range of regional values. One-year analysis was performed only for variables with reliable dates of event, using Kaplan-Meier time to event analysis, with significance determined by the log-rank test. Regions with inadequate 1-year follow-up data, defined as a standard error > 0.10, were excluded from 1-year analysis, which excluded one region for survival and amputation free survival analysis. All perioperative endpoints discussed had less than 5% missing data. There were minimal regional differences for proportion of missing data for perioperative endpoints with all regions having less than 5% missing data for all endpoints with the exception of two regions having 10 and 15% missing data on rates of dissection, perforation, or embolization after endovascular intervention. Survival data in the VQI is supplemented by the Social Security Death Index and is therefore considered complete, however additional secondary endpoints are limited by incomplete follow-up data and therefore we only evaluated amputation free survival in addition to survival. Furthermore, we performed a subanalysis for AFS using only data from medical centers reporting > 50% 1-year follow-up within the VQI. Forest Plots and bar charts were used for variables of interest. Each Forest Plot line illustrates the range among the regions for each variable listed with the repeating symbols along each line representing an individual region and the perpendicular vertical line representing the regional-level median. Pearson’s correlation was used to compare the linear relationship between perioperative outcomes of interest. Risk-adjusted perioperative mortality was calculated using previously published risk factors for mortality after lower extremity revascularization to calculate expected mortality for each patient; included in our logistic regression for expected mortality were Age > 79yr, insulin dependent diabetes, coronary artery disease, congestive heart failure, chronic obstructive pulmonary disease, emergent procedure, dialysis dependence, non-independent ambulatory status, and chronic limb-threatening ischemia.[12, 13] An observed to expected ratio for mortality was then standardized to the overall perioperative mortality in the VQI for the same population. All analysis was performed using SPSS Version 22.0 (IBM Inc., Chicago, IL).
Results
Perioperative outcomes
Patient demographics among those included in this analysis was reported in Part 1.[10] In brief, 16,145 bypasses were included, 5% for asymptomatic PAD (54% of these for aneurysmal disease), 26% for claudication, 56% for chronic limb-threatening ischemia (61% of these for tissue loss), and 13% for acute limb ischemia. For endovascular procedures, 35,338 interventions were included, 4% were asymptomatic (19% aneurysmal disease), 40% for claudication, 46% for CLI (73% tissue loss), and 12% for acute limb ischemia. After exclusion of asymptomatic patients there were a total of 15,338 bypasses and 33,925 endovascular interventions for symptomatic PAD.
Claudication
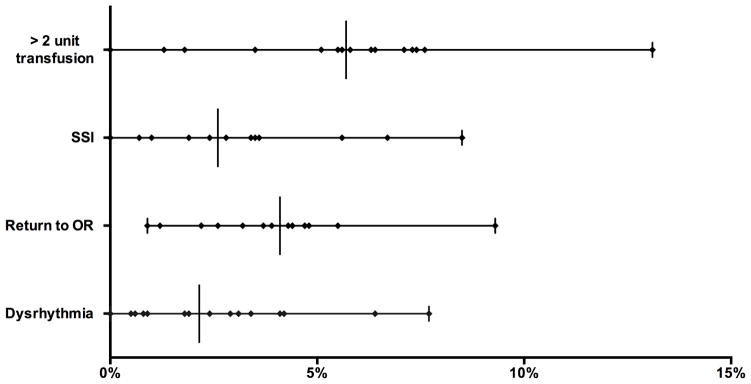
Procedure volume within each of the 16 regions ranged from 39 to 1649 infrainguinal bypasses for claudication. Thirty-day mortality ranged from 0.0 to 2.6% (P = .37). Significant variation between regions was seen in proportion of patients receiving more than 2 units of transfused RBCs (0.0 – 13%, P < .001), surgical site infections (SSI, 0.0 – 9%, P = .001), any return to the operating room (0.9 – 9.3%, P = .02), and dysrhythmia (0.0 – 7.7%, P = .01)(Figure 1). Notably, there was not significant variation between regions in the rate of ipsilateral inhospital major amputation (0.0 – 0.6%, P = .98), primary patency at discharge (94 – 100%, P = .10), renal deterioration (0.0 – 5%, P = .30), or post-operative myocardial infarction (0.0 – 4%, P = .40).
Figure 1.
Perioperative outcomes after Bypass for Claudication. All variation significantly different (P < .05). Each symbol on a line represents a region with a vertical line for median value.
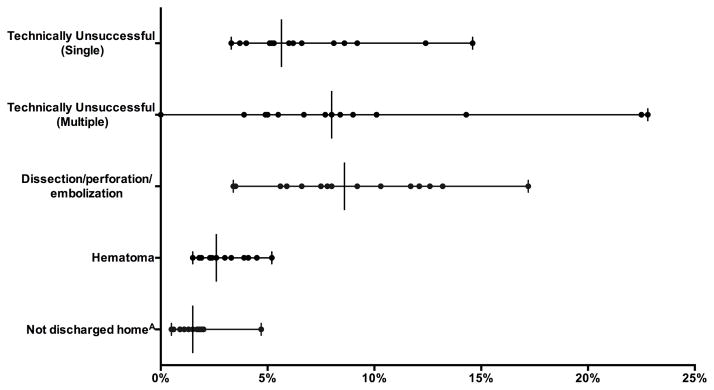
Lower extremity endovascular intervention procedure volume ranged from 76 to 3219 across regions. Thirty-day mortality was low across all regions and ranged from 0.0 to 0.5% (P = .77). Among patients living at home pre-operatively, there was significant variation between regions in the proportion who were not discharged to home (0.5 – 5%, P <.001), unplanned admissions (0.7 – 3%, p=.045), technically unsuccessful interventions for both multivessel (0.0 – 23%, P < .001) and single-vessel interventions (3.3 – 15%, P < .001), hematoma rates (1.5 – 5%, P < .001), and intra-procedural complications (3.5 – 17%, P < .001)(Figure 2).
Figure 2.
Perioperative outcomes after Endovascular intervention for Claudication. All variation significantly different (P < .05). Each symbol on a line represents a region with a vertical line for median value. AOut of those admitted from home.
Chronic Limb-threatening Ischemia
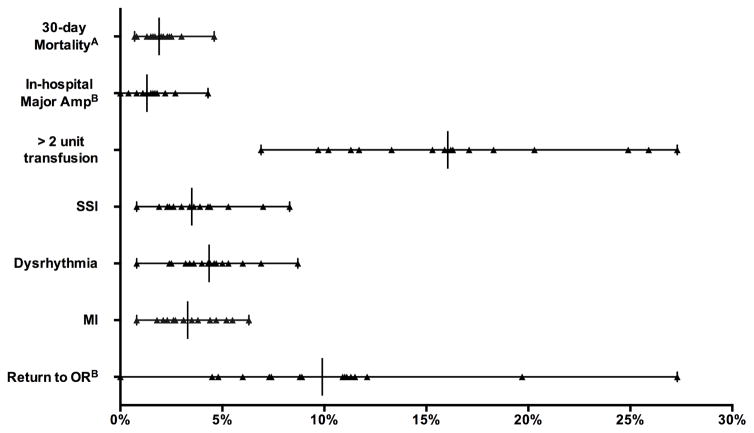
Bypass procedure volume ranged from 58 to 3165 across regions for patients with CLI. Thirty-day mortality ranged from 0.0 to 5.0% (P = .08). There was significant variation between regions in proportion of patients receiving > 2 units of RBC transfused (6.9 – 27%, P <.001), SSIs (0.8 – 8%, P < .001), dysrhythmia (0.8 – 9%, P < .001), and myocardial infarction (0.8 – 6%, P = .001)(Figure 3). In addition, for elective cases only (73% of those with CLI) there was significant variation between regions in return to the operating room (0.0 – 27%, P < .001), inhospital ipsilateral major amputation (0.0 – 4.3%, P = .004), and primary patency at discharge (84 – 98%, P < .001).
Figure 3.
Perioperative outcomes after Bypass for CLI. All variation significantly different (P < .05) exceptA. BOut of Elective cases only.
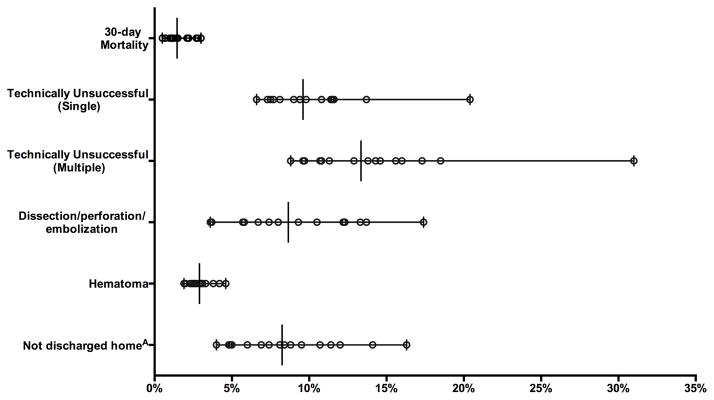
Lower extremity endovascular procedure volume for CLI ranged from 136 to 3522 across regions. There was significant variation between regions in 30-day mortality (0.5 – 3%, P <.001) and subgroup analysis showed significant variation between regions in patients with tissue loss (0.0 – 3%, P < .001) but not rest pain (0.0 – 3%, P = .27). There was significant variation between regions in technically unsuccessful interventions for multivessel (8.8 – 31%, P < .001) and single-vessel procedures (6.6 – 20%, P < .001), and hematoma rates (2.0 – 5%, P < .001)(Figure 4). Among elective cases (76% of those with CLI) there was significant variation between regions in proportion of patients not discharged to home (4.0 – 16%, P <.001), complication leading to admission (0.9 – 4%, P < .001), and intra-procedural complications (3.7 – 17%, P < .001). There was no relationship between intra-procedural complication and technically unsuccessful interventions (r = .18, P = .50).
Figure 4.
Perioperative outcomes after Endovascular intervention for CLI. All variation significantly different (P < .05). AOut of those admitted from home.
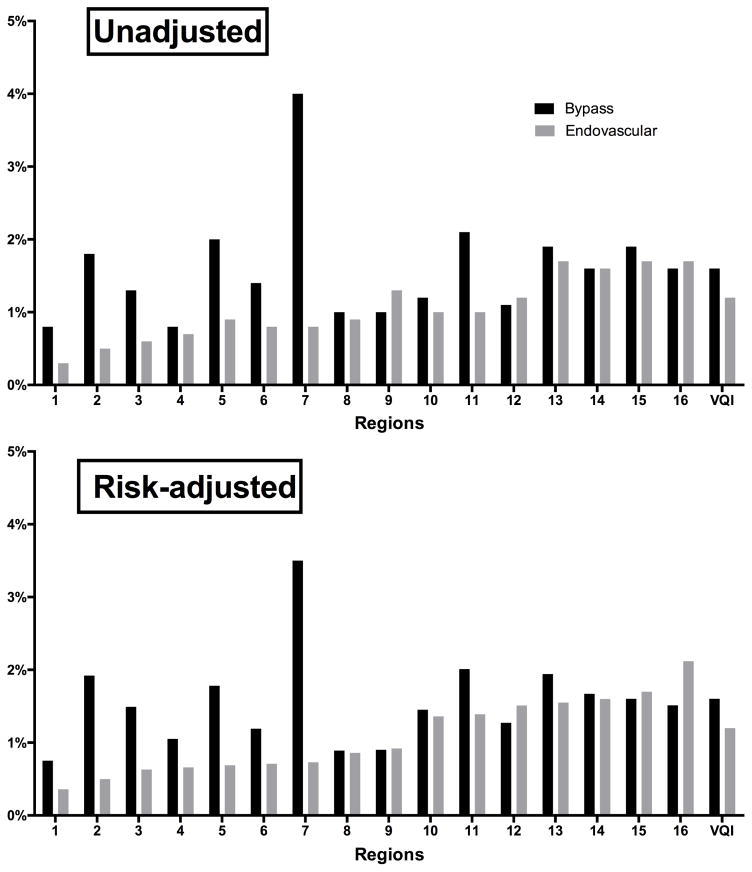
Unadjusted and risk-adjusted perioperative mortality for both endovascular and bypass revascularizations were low across the VQI (Figure 5). There was no clear association between regions’ adjusted perioperative mortality for bypass and endovascular interventions.
Figure 5.
Perioperative death (in-hospital or 30-day) for patients with Claudication and CLI. Region numbers are de-identified.
Acute Limb Ischemia
Procedure volume ranged from 9 to 658 for bypasses being performed for ALI. In hospital and 30-day mortality rates did not significantly differ between regions (0.0 – 7%, P = .45; 0.0 – 8%, P = .40, respectively). Rates of myocardial infarction (0.0 – 11%, P = .004) varied significantly, but ipsilateral major amputation (0.0 – 8%, P = .24) did not.
The procedure volume ranged from 7 to 695 for endovascular interventions being performed for ALI. In-hospital mortality did not significantly differ (0.0 – 7%, P = .06) but 30-day did (0.0 – 7%, P = .01). Technically unsuccessful revascularizations ranged from 0.0% to 29% (P = .001).
One-year Outcomes
We excluded 1660 (10%) secondary bypasses and 8288 (23%) subsequent endovascular interventions from one-year analysis and then selected only patients whose procedures were performed 9 or more months prior to date of data extraction (leaving: bypass- 9158 or 77%; endovascular- 17,123 or 73%). Of this group 751 (7.7%, regional range 3 – 12%, P < .001) patients undergoing bypass and 1845 (9.6%, regional range 6 – 13%, P < .001) undergoing endovascular intervention were clinically high-risk. One region had no eligible long-term follow-up data and was excluded from the analysis. Procedure volume in the remaining 15 regions ranged from 63 to 3679 patients for bypass and 207 to 4925 for endovascular interventions. Survival data was complete but of those eligible for 1-year follow-up 51% had follow-up amputation data in the bypass cohort and 42% in the endovascular cohort at one year. On subanalysis, including only centers with > 50% 1-year follow-up reporting, 57 centers out of a total 134 were included for bypass operations and 38 out of 134 total for endovascular intervention.
Claudication
After bypass for claudication there was no significant difference in one-year survival (95 – 100%, P = .57)(Figure 6) or amputation free survival (AFS) (91 – 100%, P = .16). For patients undergoing lower extremity endovascular interventions for claudication there was significant variation between regions in one-year survival (92 – 100%, P < .001) and AFS (89 – 100%, P <.001). On subanalysis, only including centers with > 50% 1-year follow-up, there was no significant variation between regions for AFS after bypass (89% – 100%, P = .12), however there still was after endovascular intervention (93 – 100%, P = .002) for claudication.
Figure 6.
One-year survival by symptom and intervention type. * Significant variation (P < .05).
Chronic Limb-threatening Ischemia
For patients undergoing infrainguinal bypass for CLI there was significant variation between regions in one-year survival (85 – 94%, P < .001) and AFS (73 – 91%, P = .01). After excluding clinically high-risk patients variation in one-year survival (87 – 94%, P = .001) and AFS (79 – 93%, P = .04) remained significant. Clinically high-risk patients one-year survival and AFS did not vary significantly (73 – 86%, P = .12; 68 – 86%, P = .23), although sample size limited this analysis (region range 31 to 2447 patients).
Patients undergoing lower extremity endovascular interventions for CLI had significant variation between regions in one-year survival (77 – 96%, P < .001) and AFS (68 – 86%, P = .001). One-year survival and AFS continued to vary significantly in patients who were not clinically high-risk (81 – 97%, P < .001; 61 – 84%, P = .001) but did not in clinically high-risk patients (63 – 95%, P < .001; 57 – 92%, P = .29).
The 30-day and one-year mortality rates for clinically high-risk patients were high (bypass: 5.4% and 20%; Endovascular: 4% and 22%), with relatively low one-year major amputation rates (bypass: 6.7%; Endovascular: 3.3%).
On subanalysis for patients with CLI, for centers with > 50% 1-year follow-up, AFS after bypass was not significantly different between regions (73% – 92%, P = .06) but was after endovascular intervention (59% – 81%, P = .046).
Discussion
This analysis highlights the degree of variation in both perioperative and one-year outcomes among the 16 regions of the VQI for the treatment of lower extremity vascular disease. Accepted benchmarks for outcomes after PAD revascularization are less well defined than are the guidelines for patient selection, given the broad spectrum of disease severity and patient factors. However there are several one-year outcomes after treatment for claudication that have been proposed for measuring effective clinical care, which include amputation free survival and documented assessment of patency (Table I).[7, 14] For CLI, objective performance goals have been proposed to evaluate catheter based intervention efficacy and offer potential benchmarks for outcomes after both bypass and endovascular procedures, and include both 30-day and one-year endpoints.[8, 15–17]
The PQRS measures, which are in use currently for performance reporting and financial incentives, focus on treatment of intermittent claudication and measure one-year amputation free survival, surveillance for patency, and medications at discharge. We previously reported on the significant variation in prescribing antiplatelet and statin medications at discharge across the VQI.[11] In this analysis we found significant variation between regions in one-year survival and AFS after endovascular intervention but not bypass for claudication, although this lack of significance may well be due to differences in sample size. Furthermore, prior work has established that few patients with claudication go on to develop CLI and therefore the decision to operate on claudication should be predicated on a very low probability of mortality.[14, 18, 19] We found low 30-day mortality rates after both bypass and endovascular intervention across all regions. Any variation across regions in this low risk group warrants further research.
The SVS OPGs have a suggested target rate of 80% for one-year survival in patients with CLI who are not clinically high-risk. In our analysis all regions met this goal after bypass and endovascular interventions for CLI, after risk stratification for age and tissue loss.[8] There was still significant variation across regions, however, and it remains unclear what proportion of these patients underwent endovascular intervention because they were too high-risk for bypass or due to physician/patient preference but this warrants further analysis. The proposed OPG for one-year AFS in CLI of 71% was met by all regions after bypass but not endovascular intervention, even in the non-high risk patients; although age and tissue loss are important determinants of survival, multiple other patient factors likely contribute. Given the percentage of missing amputation data we refrain from making further conclusions but think that variation in both survival and AFS warrant further investigation, with attempts to completely adjust for patient differences. Further, for high risk patients with limited life expectancy the potential benefit of a minimally invasive procedure to provide limb salvage for the remainder of their life should be weighed against setting a threshold for appropriate outcomes in this population. In our analysis there was a relatively low major amputation rate in clinically high-risk patients with the majority surviving 30 days after their intervention, which may mean the intervention was worthwhile and potentially made the difference to prevent a major amputation before death.
Our study reports significant variation between regions in in-hospital ipsilateral major amputation after elective bypass for CLI, highlighting a potential area for quality improvement. Although not directly comparable to the SVS OPG of 3% for 30-day major amputation, we did find rates of in-hospital major amputation after elective bypass for CLI as high as 4.3%. The SVS OPGs do not set a target for 30-day mortality but do use a rate of 2.7% for the calculation of MACE targets, and we found all regions near or below this rate after endovascular intervention but found a 30-day mortality rates as high as 6% after bypass.
There has been growing data to support the association of blood transfusions with adverse outcomes, including surgical site infections.[20, 21] We found significant variation between regions in transfusion rates after bypass for claudication and CLI. Given the strong randomized controlled trial data regarding transfusion thresholds in general and the high cardiovascular-risk of the vascular population an argument can be made to attempt to standardize transfusion thresholds in the postoperative care of these patients.[18, 22, 23]
Surgical site infections after bypass are a major indication for perioperative readmission.[24] The VQI has identified chlorhexadine prep as an important quality metric for reduction of SSI’s, which we previously reported to significantly vary but there are likely additional factors contributing to SSI and the VQI offers a unique opportunity to identify high-performing regions/centers to further study what best practice should be in the bypass patient and to reduce the variation currently reported.[11, 20, 25, 26]
Additionally, thirty-day major adverse cardiovascular events have been stressed by major professional societies as an important endpoint in the vascular population.[8] The VQI reports inhospital stroke and myocardial infarction events after bypass and so could not be directly compared to the SVS OPGs, but we report significant variation between regions in postoperative MIs among patients with CLI undergoing bypass. Patient selection, medications, intra-operative complications, and post-operative care are likely all contributing to MIs postoperatively and efforts should be focused on quantifying the risk associated with each of these factors.
Limitations of this study include an inability to analyze all 30-day and one-year objective performance goals since most data in VQI are collected at the time of discharge and only limited post-discharge outcomes are collected, with survival being the most reliable. For this reason we limited the post-discharge endpoints focused on in this analysis to survival and AFS. It is not possible in this registry to distinguish between reporting of death from the Social Security Death Index and from the actual hospital site, and so reporting rates from each hospital on survival could not be factored in to this analysis. In addition, it should be noted that amputation data were missing in approximately half of the eligible patients and so these results should be further verified within each region as long-term follow-up data reporting improves. We also ran a subanalysis for AFS only including centers with > 50% long-term follow-up reporting to account for this limitation. Furthermore, it should also be mentioned that the authors for the SVS objective performance goals recommend caution in using their benchmarks to compare non-randomized populations given the inability to control for all patient selection factors with such study designs, and also state the target rates are meant for assessment of candidacy for an entry-level device. This study focuses on variation for these endpoints among VQI regions and uses the OPG as a reference point but one should not make conclusions about quality of care being delivered from this analysis, as such a judgement would require appropriate risk-adjustment. However, we do think this analysis can serve as a step towards risk-adjusted benchmarks agreed upon by the professional societies who primarily treat peripheral artery disease. We do not have enough data on volume to factor this in to analysis of regional outcomes, particularly because this is a growing registry and therefore we can not tell the true volume of each hospital and surgeon. Also, this analysis reports unadjusted outcomes because it is meant to serve as a description of current practice across the country and as a starting point for identifying projects for quality improvement.
Conclusion
Significant variation between regions exists in outcomes after revascularization for peripheral artery disease and should prompt further research into appropriate patient and treatment selection. This unadjusted analysis represents a real-world assessment of variation in performance between VQI regions and will hopefully act as a catalyst for future quality improvement projects.
Acknowledgments
Supported by the NIH T32 Harvard- Longwood Research Training in Vascular Surgery grant HL007734.
Footnotes
Publisher's Disclaimer: This is a PDF file of an unedited manuscript that has been accepted for publication. As a service to our customers we are providing this early version of the manuscript. The manuscript will undergo copyediting, typesetting, and review of the resulting proof before it is published in its final citable form. Please note that during the production process errors may be discovered which could affect the content, and all legal disclaimers that apply to the journal pertain.
References
- 1.Prevention CfDCa. Deaths: Final Data for 2013. 2013. [PubMed] [Google Scholar]
- 2.Hannan EL, Kilburn H, Jr, O’Donnell JF, Lukacik G, Shields EP. Adult open heart surgery in New York State. An analysis of risk factors and hospital mortality rates. JAMA. 1990;264(21):2768–74. [PubMed] [Google Scholar]
- 3.O’Connor GT, Plume SK, Olmstead EM, Coffin LH, Morton JR, Maloney CT, et al. A regional prospective study of in-hospital mortality associated with coronary artery bypass grafting. The Northern New England Cardiovascular Disease Study Group. JAMA. 1991;266(6):803–9. [PubMed] [Google Scholar]
- 4.Khuri SF, Daley J, Henderson W, Hur K, Gibbs JO, Barbour G, et al. Risk adjustment of the postoperative mortality rate for the comparative assessment of the quality of surgical care: results of the National Veterans Affairs Surgical Risk Study. J Am Coll Surg. 1997;185(4):315–27. [PubMed] [Google Scholar]
- 5.Birkmeyer JD, Dimick JB. Understanding and reducing variation in surgical mortality. Annu Rev Med. 2009;60:405–15. doi: 10.1146/annurev.med.60.062107.101214. [DOI] [PubMed] [Google Scholar]
- 6.Iezzoni L. Risk Adjustment for Measuring Healthcare Outcomes. Health Administration Press; Chicago, IL: 2003. [Google Scholar]
- 7.Physician Quality Reporting System: Appendix A: Individual Measures List. M2S; Feb 22, 2016. Available from: http://www.m2s.com/wp-content/uploads/2015-M2S-PQRS-Service.pdf. [Google Scholar]
- 8.Conte MS, Geraghty PJ, Bradbury AW, Hevelone ND, Lipsitz SR, Moneta GL, et al. Suggested objective performance goals and clinical trial design for evaluating catheter- based treatment of critical limb ischemia. J Vasc Surg. 2009;50(6):1462–73. e1–3. doi: 10.1016/j.jvs.2009.09.044. [DOI] [PubMed] [Google Scholar]
- 9.Mills JL, Sr, Conte MS, Armstrong DG, Pomposelli FB, Schanzer A, Sidawy AN, et al. The Society for Vascular Surgery Lower Extremity Threatened Limb Classification System: risk stratification based on wound, ischemia, and foot infection (WIfI) J Vasc Surg. 2014;59(1):220–34. e1–2. doi: 10.1016/j.jvs.2013.08.003. [DOI] [PubMed] [Google Scholar]
- 10.Soden PA, Zettervall SL, Curran T, Vouyouka AG, Goodney PP, Mills JL, et al. Regional variation in patient selection and treatment for lower extremity vascular disease in the Vascular Quality Initiative. J Vasc Surg. 2017;65(1):108–118. doi: 10.1016/j.jvs.2016.06.105. [DOI] [PMC free article] [PubMed] [Google Scholar]
- 11.Soden PA, Zettervall SL, Curran T, Vouyouka AG, Goodney PP, Mills JL, et al. Regional Variation in Patient Selection and Treatment for Lower Extremity Vascular Disease in the Vascular Quality Initiative (VQI) J Vasc Surg. 2016 doi: 10.1016/j.jvs.2016.06.105. In Press. [DOI] [PMC free article] [PubMed] [Google Scholar]
- 12.Meltzer AJ, Graham A, Connolly PH, Meltzer EC, Karwowski JK, Bush HL, et al. The Comprehensive Risk Assessment for Bypass (CRAB) facilitates efficient perioperative risk assessment for patients with critical limb ischemia. J Vasc Surg. 2013;57(5):1186–95. doi: 10.1016/j.jvs.2012.09.083. [DOI] [PubMed] [Google Scholar]
- 13.Bertges DJ, Goodney PP, Zhao Y, Schanzer A, Nolan BW, Likosky DS, et al. The Vascular Study Group of New England Cardiac Risk Index (VSG-CRI) predicts cardiac complications more accurately than the Revised Cardiac Risk Index in vascular surgery patients. J Vasc Surg. 2010;52(3):674–83. 683 e1–683 e3. doi: 10.1016/j.jvs.2010.03.031. [DOI] [PubMed] [Google Scholar]
- 14.Society for Vascular Surgery Lower Extremity Guidelines Writing G. Conte MS, Pomposelli FB, Clair DG, Geraghty PJ, McKinsey JF, et al. Society for Vascular Surgery practice guidelines for atherosclerotic occlusive disease of the lower extremities: management of asymptomatic disease and claudication. J Vasc Surg. 2015;61(3 Suppl):2S–41S. doi: 10.1016/j.jvs.2014.12.009. [DOI] [PubMed] [Google Scholar]
- 15.Goodney PP, Schanzer A, Demartino RR, Nolan BW, Hevelone ND, Conte MS, et al. Validation of the Society for Vascular Surgery’s objective performance goals for critical limb ischemia in everyday vascular surgery practice. J Vasc Surg. 2011;54(1):100–108 e4. doi: 10.1016/j.jvs.2010.11.107. [DOI] [PMC free article] [PubMed] [Google Scholar]
- 16.Geraghty PJ, Matsumura JS, Conte MS. Premarket assessment of devices for treatment of critical limb ischemia: the role of Objective Performance Criteria and Goals. J Vasc Surg. 2009;50(6):1459–61. doi: 10.1016/j.jvs.2009.10.041. [DOI] [PubMed] [Google Scholar]
- 17.Conte MS. Understanding objective performance goals for critical limb ischemia trials. Semin Vasc Surg. 2010;23(3):129–37. doi: 10.1053/j.semvascsurg.2010.06.001. [DOI] [PubMed] [Google Scholar]
- 18.Norgren L, Hiatt WR, Dormandy JA, Nehler MR, Harris KA, Fowkes FG, et al. Inter-Society Consensus for the Management of Peripheral Arterial Disease (TASC II) J Vasc Surg. 2007;45(Suppl S):S5–67. doi: 10.1016/j.jvs.2006.12.037. [DOI] [PubMed] [Google Scholar]
- 19.Anderson JL, Halperin JL, Albert NM, Bozkurt B, Brindis RG, Curtis LH, et al. Management of patients with peripheral artery disease (compilation of 2005 and 2011 ACCF/AHA guideline recommendations): a report of the American College of Cardiology Foundation/American Heart Association Task Force on Practice Guidelines. Circulation. 2013;127(13):1425–43. doi: 10.1161/CIR.0b013e31828b82aa. [DOI] [PubMed] [Google Scholar]
- 20.Kalish JA, Farber A, Homa K, Trinidad M, Beck A, Davies MG, et al. Factors associated with surgical site infection after lower extremity bypass in the Society for Vascular Surgery (SVS) Vascular Quality Initiative (VQI) J Vasc Surg. 2014;60(5):1238–46. doi: 10.1016/j.jvs.2014.05.012. [DOI] [PubMed] [Google Scholar]
- 21.Tan TW, Farber A, Hamburg NM, Eberhardt RT, Rybin D, Doros G, et al. Blood transfusion for lower extremity bypass is associated with increased wound infection and graft thrombosis. J Am Coll Surg. 2013;216(5):1005–1014 e2. doi: 10.1016/j.jamcollsurg.2013.01.006. quiz 1031–3. [DOI] [PMC free article] [PubMed] [Google Scholar]
- 22.Steg PG, Bhatt DL, Wilson PW, D’Agostino R, Sr, Ohman EM, Rother J, et al. One-year cardiovascular event rates in outpatients with atherothrombosis. JAMA. 2007;297(11):1197–206. doi: 10.1001/jama.297.11.1197. [DOI] [PubMed] [Google Scholar]
- 23.Hebert PC, Wells G, Blajchman MA, Marshall J, Martin C, Pagliarello G, et al. A multicenter, randomized, controlled clinical trial of transfusion requirements in critical care. Transfusion Requirements in Critical Care Investigators, Canadian Critical Care Trials Group. N Engl J Med. 1999;340(6):409–17. doi: 10.1056/NEJM199902113400601. [DOI] [PubMed] [Google Scholar]
- 24.Merkow RP, Ju MH, Chung JW, Hall BL, Cohen ME, Williams MV, et al. Underlying reasons associated with hospital readmission following surgery in the United States. JAMA. 2015;313(5):483–95. doi: 10.1001/jama.2014.18614. [DOI] [PubMed] [Google Scholar]
- 25.Greenblatt DY, Rajamanickam V, Mell MW. Predictors of surgical site infection after open lower extremity revascularization. J Vasc Surg. 2011;54(2):433–9. doi: 10.1016/j.jvs.2011.01.034. [DOI] [PubMed] [Google Scholar]
- 26.Giles KA, Hamdan AD, Pomposelli FB, Wyers MC, Siracuse JJ, Schermerhorn ML. Body mass index: surgical site infections and mortality after lower extremity bypass from the National Surgical Quality Improvement Program 2005–2007. Ann Vasc Surg. 2010;24(1):48–56. doi: 10.1016/j.avsg.2009.05.003. [DOI] [PMC free article] [PubMed] [Google Scholar]


