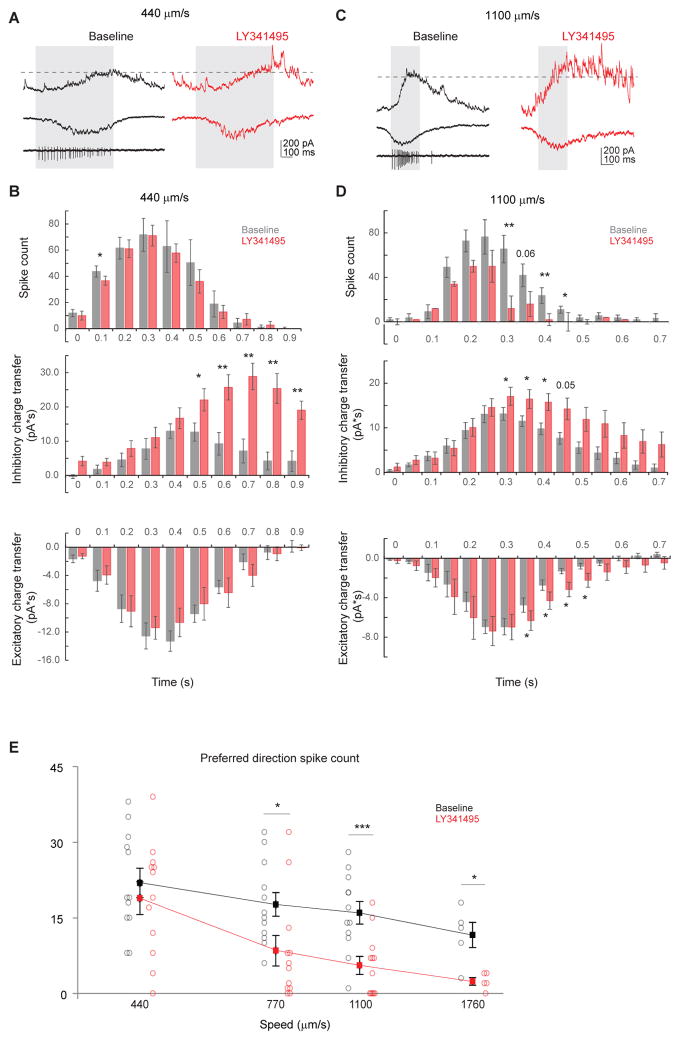
Figure 6. mGluR2 blockade decreases preferred-direction spiking of DSGCs at higher bar speed.
A. Example loose cell-attached and whole-cell recordings of a DSGC showing IPSC (upper), EPSC (middle) and spiking (lower left) in the baseline condition (left) and the IPSC and EPSC from the same cell after adding LY341495 (right) evoked by a bar moving in the preferred direction at the bar speed of 440 μm/s. Shaded area represents the temporal window of spiking activity at the baseline condition. Dashed line indicates the peak IPSC level at baseline condition. The LY341495-enhanced IPSC component lags behind spiking activity.
B. Summary histograms of DSGC spike count (upper), inhibitory charge transfer (middle) and excitatory charge transfer (lower) before and after adding LY341495 at the speed of 440 μm/s. Spiking: n = 9 cells; inhibition: n = 6 cells; excitation: n = 6 cells. Spiking: 0.1 – 0.2 s: *p = 0.02. Inhibition: 0.5 – 0.6 s: *p = 0.035; 0.6 – 0.7 s: **p = 0.004; 0.7 – 0.8 s: **p = 0.003; 0.8 – 0.9 s: **p = 0.005; 0.9 – 1.0 s: **p= 0.003.
C. As in A, example loose cell-attached and whole-cell recordings of a DSGC showing IPSC (upper), EPSC (middle) and spiking (lower left) in the baseline condition (left) and the IPSC and EPSC from the same cell after adding LY341495 (right) evoked by a bar moving in the preferred direction at the bar speed of 1100 μm/s. A portion of he LY341495-enhanced IPSC component coincides with spiking activity.
D. As in B, summary histograms of DSGC spike count (upper), inhibitory charge transfer (middle) and excitatory charge transfer (lower) before and after adding LY341495 at the speed of 440 μm/s. Spiking: n = 11 cells; inhibition: n = 8 cells; excitation: n = 8 cells. Spiking: 0.30–0.35 s: **p = 0.001; 0.40 – 0.45 s: *p = 0.008; 0.45 – 0.50 s: *p = 0.015. Inhibition: 0.30 – 0.35 s: *p = 0.029; 0.35 – 0.40 s: *p = 0.023; 0.40 – 0.45 s: *p = 0.019. Excitation: 0.35 – 0.40 s: * p = 0.037; 0.40 – 0.45 s: *p = 0.042; 0.45 – 0.50 s: *p = 0.015; 0.50 – 0.55 s: *p = 0.049.
E. Summary plot of preferred direction spike count before and after adding LY341495 at different speeds. Horizontal (speed) axis is in log scale. Mean ± SEM: 440 μm/s: baseline, 21.9 ± 2.9; LY341495, 18.9 ± 3.2; p = 0.42, n = 12 cells; 770 μm/s: baseline, 17.7 ± 2.9; LY341495, 8.5 ± 3.0; *p = 0.035, n = 12 cells; 1100 μm/s: baseline, 16.0 ± 2.2; LY341495, 5.6 ± 1.8; *** p = 0.0001, n = 12 cells; 1760 μm/s: baseline, 11.6 ± 2.5; LY341495, 2.4 ± 0.7; *p = 0.01, n = 5 cells

