

Summary
Decreasing glucagon action lowers the blood glucose and may be useful therapeutically for diabetes. However, interrupted glucagon signaling leads to α-cell proliferation. To identify postulated hepatic-derived, circulating factor(s) responsible for α-cell proliferation, we used transcriptomics/proteomics/metabolomics in three models of interrupted glucagon signaling and found that proliferation of mouse, zebrafish, and human α-cells was mTOR- and FoxP transcription factor-dependent. Changes in hepatic amino acid (AA) catabolism gene expression predicted the observed increase in circulating AA. Mimicking these AA levels stimulated α-cell proliferation in a newly developed in vitro assay with L-glutamine being a critical AA. α-cell expression of the AA transporter Slc38a5 was markedly increased in mice with interrupted glucagon signaling and played a role in α-cell proliferation. These results indicate a hepatic-α-islet cell axis where glucagon regulates serum AA availability and AA, especially L-glutamine, regulates α-cell proliferation and mass via mTOR-dependent nutrient sensing.
Keywords: pancreatic islet, glucagon, glucagon receptor, alpha cell, amino acid, glutamine, proliferation, Slc38a5, amino acid transport
Graphical abstract
Blocking glucagon action lowers blood glucose, but also results in hyperplasia of glucagon secreting α-cells in pancreatic islets. Dean et al., demonstrate that loss of hepatic glucagon signaling elevates circulating amino acids and leads to α-cell proliferation, thus revealing a hepatic-α-cell axis.
Introduction
Blood glucose homeostasis is primarily the result of coordinated action of two pancreatic islet-derived hormones, insulin and glucagon. Nutrient ingestion stimulates insulin secretion from islet β-cells, which promotes glucose uptake and suppresses liver glucose production, while hypoglycemia stimulates glucagon secretion from islet α-cells to promote liver glucose production via gluconeogenesis and glycogenolysis. While traditionally thought to result from absolute or relative deficiency of insulin action, more recently the contribution of hyperglucagonemia to diabetes has been emphasized (Unger and Cherrington, 2012). Consequently, efforts to reduce glucagon action using small molecule antagonists, siRNA, aptamers, or antibodies that target the glucagon receptor (GCGR) have successfully improved glycemic control, especially in models of diabetes and in humans; however, interrupting glucagon signaling by multiple approaches (proglucagon gene knockout, interruption of Gcgr expression or downstream signaling, GCGR small molecule inhibitors, GCGR antibodies, or Gcgr antisense oligonucleotides) results in hyperglucagonemia and α-cell hyperplasia (Campbell and Drucker, 2015). In fact, efforts over 35 years ago to develop antibodies against glucagon offered the first clue that neutralizing circulating glucagon leads to α-cell hyperplasia (von Dorsche and Ziegler, 1981).
α-cells from Gcgr-/- and liver-specific Gcgr-/- (GcgrHep-/-) mice proliferate at rates 3-7 fold higher than control mice independently of the pancreatic environment or islet innervation (Longuet et al., 2013). To test the hypothesis that interrupted glucagon signaling in the liver leads to the production of a hepatic factor that promotes α-cell proliferation, we used an integrated strategy of proteomics/metabolomics/transcriptomics in three models with altered glucagon signaling, and a new in vitro islet culture α-cell proliferation assay to discover that high concentrations of the gluconeogenic AA L-glutamine (Q) in glucagon signaling-interrupted mice, together with other AA, stimulates α-cell proliferation.
Results
α-Cells Proliferate in Response to a Factor in Mouse Serum
Gcgr-/- mice have pronounced α-cell hyperplasia (Longuet, et al, 2013; Figure S1A-B). To investigate whether the serum of these mice contain a factor that stimulates α-cell proliferation, we developed an in vitro assay to assess α-cell proliferation. We first cultured intact mouse islets in media supplemented with Gcgr-/- or Gcgr+/+ mouse serum, dispersed the islets into single cells, and then created a focused monolayer of cells using a cytospin centrifuge to assess the number of proliferating α-cells (Figure 1A). Culturing wildtype islets in media with 10% Gcgr-/- mouse serum increased proliferating α-cells compared to 10% Gcgr+/+ mouse serum or control media (Figures 1B-E; S1D).
Figure 1. Mouse α-cells proliferate in vitro when cultured in Gcgr-/- mouse serum.
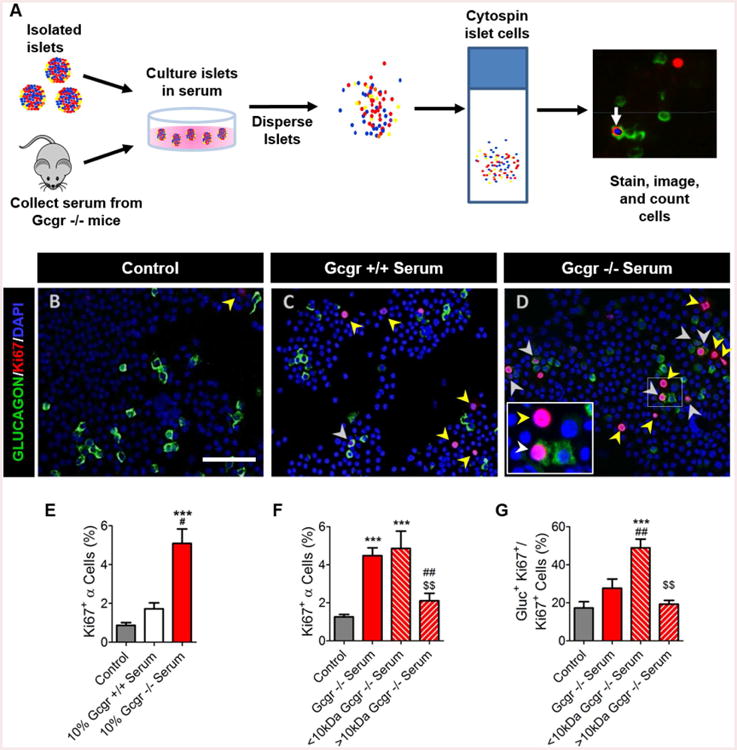
(A) Schematic for in vitro α-cell proliferation assay to quantify proliferation rates. Representative images of dispersed islet cells cultured in (B) control media, (C) Gcgr+/+ mouse serum- or (D) Gcgr-/- mouse serum-treated media. Glucagon (green), Ki67 (red), and DAPI (blue) are shown. Proliferating α-cells (Ki67+ glucagon+) and non α-cells (Ki67+ glucagon-) are indicated by white or yellow arrows, respectively. White bar indicates 75μm. (E) Quantification of α-cell proliferation following culture in mouse serum-treated media. Control media with no mouse serum added (grey), 10% Gcgr+/+ mouse serum-(white), and 10% Gcgr-/- mouse serum-(red) treated are shown. ***p<0.001 vs control, #p<0.05 vs. Gcgr+/+ mouse serum; n=3-12. Quantification of Gcgr-/- size fractionated mouse serum induced (F) α-cell proliferation and (G) percentage of cells proliferating in each fractionated mouse serum-treated media condition that are α-cells. Control media with no mouse serum added (grey), 10% Gcgr-/- whole mouse serum-(red), 10% Gcgr-/- <10kDa mouse serum-(red left hashed), and 10% Gcgr-/- <10kDa mouse serum-(red right hashed) treated media islets are shown. ***p<0.001 vs control, ##p<0.01 vs. Gcgr-/-, and $$p<0.01 vs. <10kDa Gcgr-/-; n=3-13. Data are mean ± SEM.
To characterize serum factors, we size-fractionated Gcgr-/- mouse serum and found that a <10kDa fraction stimulated α-cell proliferation 4-fold, similar to unfractionated Gcgr-/- mouse serum (Figure 1F). Fractionation of Gcgr-/- mouse serum partially purified α-cell selective mitogens, increasing the proportion of proliferating α-cells over the total number of proliferating islet cells from 20% to about 50% (Figure 1G). Together, these data indicate that α-cell proliferation in response to interrupted glucagon signaling was likely due to a small serum protein/peptide or small molecule (e.g. lipid, AA, or metabolite).
Integrated “omics” Analyses Reveal Alterations in Serum Proteins, Lipids, and AAs
To generate a candidate list of factors to test in the in vitro proliferation assay, we leveraged and compared the hepatic transcriptional profile from fasted mice of both a “chronic” model of interrupted glucagon signaling (Gcgr-/-) and an “acute” model of interrupted glucagon signaling (GCGR mAb-treated) since both models have mild hypoglycemia, increased pancreas mass, and increased α-cell proliferation (Figure S2A and data not shown). We found 658 shared genes that were either upregulated or downregulated (Figures S2B-D; Table S1). Pathway analyses revealed alterations in gene expression related to canonical pathways involved in both lipid/cholesterol and AA metabolism (Table S2).
We initially focused on genes encoding predicted secreted factors. Some (Inhba-Activin A, Defb1- Defensin b1, and Hamp1-Hepcidin) are less than 10 kDa in size (Figure S2E; Table S1). One secreted factor, Kisspeptin (Kiss1) was strongly downregulated in both “acute” and “chronic” models of interrupted of glucagon secretion. Conversely, enhanced glucagon signaling was previously shown to strongly upregulated Kiss1 expression (Song et al, 2014). However, we predicted that the factor(s) present in Gcgr-/- serum stimulating α-cell proliferation would be higher than in Gcgr+/+ serum and eliminated Kiss1 as a candidate factor. Since glucagon signaling reciprocally regulated Kiss1 gene expression, we cross-referenced our gene expression changes with expression data generated by Song et al. and found that the most significantly altered in both models of interrupted glucagon signaling were significantly altered in the opposite way by enhanced glucagon signaling (e.g. small peptide forming Inhba; Defb1; data not shown) demonstrating that glucagon signaling reciprocally regulates expression of many genes.
Analysis of over 1200 serum proteins by aptamer-based screening identified proteins that were upregulated in both Gcgr-/- and GCGR mAb mice (Table S3). Only activin A (Inhba) was upregulated transcriptionally in the liver of both models. Of the secreted proteins, the top candidate Activin A was the only factor upregulated in both models and in both transcriptomics and proteomic analyses. Neither it, nor the hepatic factors hepcidin or defensin b1, stimulated α-cell proliferation in vitro (Table S1 and data not shown). We also found that both models of mice with interrupted glucagon signaling had increased expression of genes involved in lipid and cholesterol biosynthesis. However, Gcgr-/- and GCGR mAb-treated mice did not upregulate expression of genes regulating bile acid synthesis and transport (Cyp7a1; Cyp7b1; Cyp8b1; Slc10a1) (Figure S2F; Tables S1-S2). Bile acid levels were increased in Gcgr-/- mouse serum, but not in GCGR mAb-treated mouse serum (Figure S2G), excluding bile acids as the factor(s). In testing whether lipids in Gcgr-/- mouse serum could stimulate α-cell proliferation, we found that serum activity was retained after the removal of >99% of triglycerides, cholesterols, and phospholipids (Figure S2H and data not shown).
In addition to alterations in secreted factors and lipid metabolism, we identified changes in gene expression that encode proteins involved in hepatic AA metabolism (Figures 2A). Because the changes in gene expression predicted impaired catabolism of most AA in the liver, we analyzed serum AA levels in mice with both “acute” and “chronic” interruption of glucagon signaling and found that all major serum AA except phenylalanine and tryptophan were significantly elevated 2-10 fold (Figures 2B and S3A). Together, our strategy of hepatic transcriptional profiling coupled with serum fractionation and proteomic/metabolomic analyses identified candidate factors for the increased α-cell proliferation when glucagon signaling is interrupted.
Figure 2. L-glutamine and other AA promote selective α-cell proliferation.
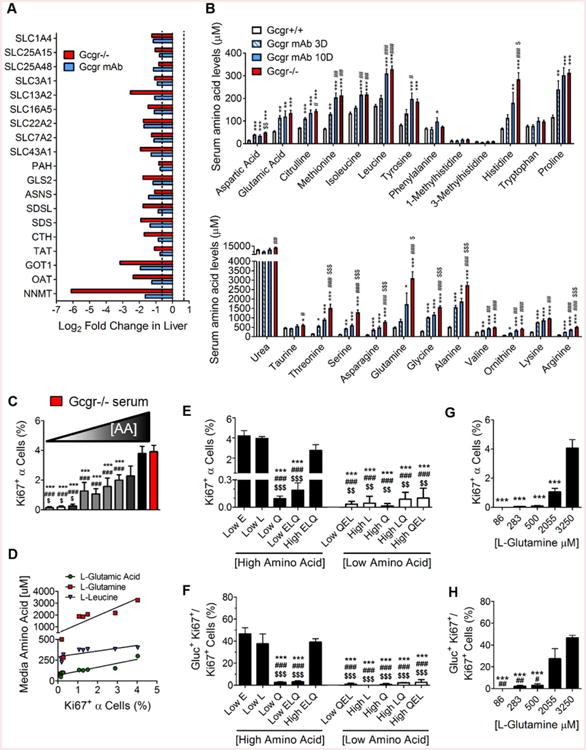
(A) Log2 fold changes in expression of liver AA catabolism genes in Gcgr-/- (red) and GCGR mAb (blue)-treated mice relative to PBS-treated Gcgr+/+ mice; n=3. (B) Mouse serum AA levels measured by HPLC in Gcgr-/- (red), GCGR mAb-treated for 10 days (blue), GCGR mAb-treated for 3 days (blue/white hatched), and PBS-treated (white) *p<0.05, **p<0.01, ***p<0.001 vs PBS-treated Gcgr+/+. #p<0.05, ##p<0.01 vs. GCGR mAb-treated 3 day; $p<0.05, $$p<0.01, $$$p<0.001 vs. GCGR mAb-treated 10 day; n=5-10. (C) Quantification of α-cell proliferation in response to media with increasing AA concentration media. White (low) to gray (intermediate) to black (high) color indicates combined concentration of all AA in each media condition (see Table S4 for combined and individual AA media concentrations. Each bar corresponds to one of the conditions in labeled Media #1-9 in order from left to right); n=3-8. The red bar indicates 10% Gcgr-/- mouse serum-supplemented media similar to Figure 1E. ***p<0.001 vs Gcgr-/- mouse serum-supplemented media (red), ###p<0.01 vs. highest AA media-treated islets (black), and $p<0.05 vs. highest AA media-treated islets (dark gray). (D) Linear regression analyses of AA concentration in each media condition versus the α-cell proliferation rate with each media. Significant correlation related to L-glutamate (blue triangles), Q (red squares) and L-leucine (green triangles) concentrations are noted. Quantification of (F) α-cell proliferation and (G) percentage of cells proliferating that are α-cells in response to altering individual AA levels in cultured mouse islets. Combined high AA media and combined low AA media are represented with black and white bars, respectively. n=3-12, ***p<0.001 vs low L-glutamate (Low E)-treated islets, ###p<0.001 vs. low L-leucine (Low L)-treated islets, and $$p<0.01; $$$p<0.001 vs. high L-glutamate, L-leucine, and Q media (High ELQ)-treated islets. (H) Quantification of Q dose response stimulated α-cell proliferation and (I) percentage of cells proliferating that are α-cells in cultured mouse islets. n=3, ***p<0.001 vs 3250 μM Q, ##p<0.01 vs 2055 μM Q. Data are mean ± SEM.
Candidate Testing Reveals that AA Potently Stimulate α-Cell Proliferation
Since some AA (e.g. arginine) stimulate glucagon release and a recent report suggested that AA could stimulate α-cell proliferation (Solloway et al., 2015), we tested 23 different AA in combination or alone at doses spanning concentrations found in both Gcgr +/+ and Gcgr-/-mouse serum. First, we tested AA that were elevated in Gcgr -/- mouse serum but not present in RPMI media used for islet culture, reasoning that by adding Gcgr-/- mouse serum to culture media, we could be adding a factor not found in culture media. Citrulline, ornithine, and alanine alone or in combination failed to stimulate α-cell proliferation at concentrations observed in Gcgr-/- mouse serum (Figure S3B). Using media recapitulating the AA concentrations in mouse serum (Table S4), we found media with the high levels of AA found in Gcgr-/- mouse serum (high AA), but not the levels found in Gcgr+/+ mouse serum (low AA), potently stimulated α-cell proliferation (Figure 2C). Interestingly, AA at all concentrations tested had no effect on non α-cell proliferation rates resulting in the majority of proliferating cells in the islet cultures being α-cells under high AA conditions (Figures S3D). These data suggest that AA at levels found in Gcgr-/- mouse serum are sufficient to selectively stimulate α-cell proliferation.
L-glutamine Is Required for AA-Selective Stimulation of α-Cell Proliferation
To determine which AA stimulated α-cell proliferation, we prepared media having different combined levels of AA (Figure 2C; Table S4). Islets cultured in media with the highest combined AA concentrations had the highest percentage of proliferating α-cells while islets cultured in media with the lowest combined AA concentrations had the lowest percentage of proliferating α-cells (Figure 2C). We observed that as the combined AA concentration increased in the culture media the α-cell proliferation rate also increased. After incrementally reducing the concentration of only a few AA in high AA, we performed linear regression analyses on each AA concentration versus the α-cell proliferation and identified 3 AA [L-leucine, L-glutamate, and Q] whose concentrations were positively correlated with increased α-cell proliferation (Figure 2D; Table S5). We tested whether high levels of each of these three AA were required for the increased α-cell proliferation observed in high AA treatment by only reducing the concentration of each to levels in low-AA (Figure 2E). Reduction of all three of these AA together resulted in a complete loss of α-cell proliferation (Figure 2F). Individually, lowering L-leucine or L-glutamate alone to levels in low AA had no effect on α-cell proliferation. However, lowering Q alone to levels in low AA abolished the selective stimulation of α-cell proliferation (Figures 2E; S3G). Restoring Q concentrations in the modified high AA had no effect on non-α islet cell proliferation (Figure S3G), but dose-dependently increased α-cell proliferation (Figures 2G; S3I). Together, these data indicate that the ability of high levels of AA to stimulate α-cell are dependent on Q, but high levels of some other AA are also required.
The mTOR signaling is a critical mediator of AA-driven α-cell proliferation
Since mTOR kinase pathway plays a predominant role in AA-stimulated proliferation, we assessed its role in AA-stimulated α-cell proliferation in the GCGR mAb-treated mice. GCGR mAb treatment resulted in lower blood glucose, but also robustly increased serum glucagon levels, α-cell proliferation, and α-cell hyperplasia (Gu et al., 2009; Figures 3A-D; S4A-D). We observed activation of a downstream target of mTOR kinase, S6 protein, (p235/236) in the peri-islet region of the pancreas and within α-cells and δ-cells of GCGR mAb-treated mice whereas pS6 staining in α-cells of PBS-treated mice was very rare (Figures 3F; S4F; data not shown). To directly test the role of mTOR signaling in α-cell proliferation, we co-treated mice with GCGR mAb and rapamycin (rapa), a potent inhibitor of mTOR kinase. Rapa treatment partially suppressed the hyperglucagonemia and α-cell proliferation induced by GCGR mAb administration similar to the reduction observed in Gcgr-/- mice (Solloway et al., 2015; Figure 3B-E). Rapa also largely attenuated the α-cell expression of pS6 (p235/236) in GCGR mAb co-treated mice (Figures 3F-G; S4F-G). We also used a zebrafish model of interrupted glucagon signaling (Li et al., 2015) and found that treatment with rapa reduced the number of α-cells induced by interrupted glucagon signaling (Figure 3H).
Figure 3. mTOR signaling and FoxP transcription factor are essential for α-cell proliferation in response to interrupted glucagon signaling.
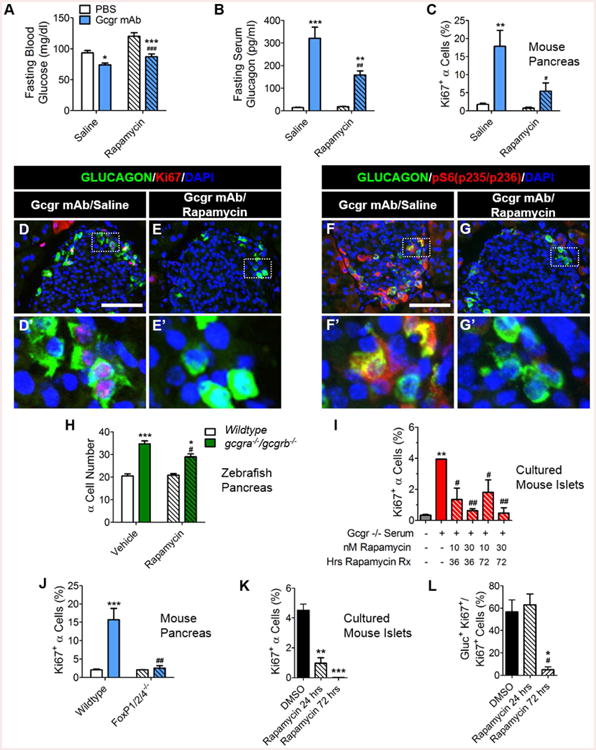
(A) Fasting blood glucose (mg/dl) n=5, (B) serum glucagon (pg/ml) n=5, and (C) α-cell proliferation (n=3) in mice after cotreatment with GCGR mAb and rapa. Saline/PBS treated (white bars), Saline/GCGR mAb treated (blue bars), rapa/PBS treated (white left hashed bars) and rapa/GCGR mAb treated (blue left hashed bars) are shown. *p<0.05, **p<0.01, and ***p<0.001 vs PBS treated and #p<0.05, ##p<0.01, and ###p<0.001 vs. Saline treated. (D-E) Representative images of pancreatic islet α-cell proliferation in Saline/GCGR mAb- and rapa/GCGR mAb-treated mice. Glucagon (green), Ki67 (red), and DAPI (blue) are shown. White scale bars indicate 100μm. White dashed boxes indicate region selected for insets. (F-G) Representative images of pancreatic islet α-cell expression of pS6 protein in Saline/GCGR mAb- and rapa/GCGR mAb-treated mice. Glucagon (green), pS6(pS235/S236) (red), and DAPI (blue) are shown. (H) α-cell number in 7dpf wildtype and gcgra-/-gcgrb-/- zebrafish larvae primary islet after treatment with rapa for 3 days. Wildtype/vehicle treated (white), gcgra-/-gcgrb-/-/vehicle treated (green), Wildtype/rapa treated (white left hashed) and gcgra-/-gcgrb-/-/rapa treated (green left hashed) are shown. *p<0.05 and ***p<0.001 vs Wildtype and #p<0.05 vs. vehicle treated; n=8-11. (I) α-cell proliferation in rapa and 10% Gcgr-/- mouse serum co-supplemented media cultured mouse islets. Control RPMI media (#7 Table S4) with no mouse serum added (grey), Gcgr-/- whole mouse serum (with medium combined AA levels plus vehicle)-supplemented media (red) and Gcgr-/- mouse serum and rapa co-supplemented media cultured mouse islets (red left hashed) are shown. **p<0.01 vs control media and #p<0.05 and ##p<0.01 vs. Gcgr-/- mouse serum (with medium combined AA levels plus vehicle)-supplemented media; n=2-3. (J) α-cell proliferation in GCGR mAb-treated FoxP1/2/4-/- mice is shown. Wildtype/PBS-treated (white), Wildtype/GCGR mAb-treated (blue), FoxP1/2/4-/-/PBS-treated (white left hashed) and FoxP1/2/4-/-/GCGR mAb-treated (blue left hashed) are shown. ***p<0.001 vs PBS-treated and ##p<0.01 vs. Saline-treated; n=3. (J) Quantification of rapa effects on AA-stimulated α-cell proliferation and (K) percentage of cells proliferating that are α-cells in cultured mouse islets treated for 3 days. Highest AA media with DMSO added (black), highest AA media with 30nM rapa added for the last 24 hours of culture (black left hashed), highest AA media with 30nM rapa added for 3 days culture (black right hashed); *p<0.05, **p<0.01 and **p<0.001 vs DMSO-treated, and #p<0.05 vs rapa 24 hrs-treated; n=2-3. Data are mean ± SEM.
Since systemic treatment with rapa could potentially block production, release, or action of the α-cell mitogen, we asked if activation of islet cell mTOR signaling was required and found that rapa blocked the proliferative effects of both Gcgr-/- mouse serum and high AA media in the in vitro assay (Figure 3I-L). These data indicate that islet mTOR signaling is required for AA to stimulate α-cell proliferation.
FoxP transcription factors are critical for α-cell mass expansion during early postnatal development (Spaeth et al., 2015). We found that FoxP1/2/4 islet null mice (FoxP1/2/4-/-) treated with GCGR mAb had reduced α-cell proliferation (Figures 3J; S4H-L). Surprisingly, α-cells in these mice have robust pS6 expression (Figures S4M-P). Thus, FoxP activity in α-cells is required for this α-cell proliferation, but it acts downstream or independent of mTOR signaling.
SLC38A5 expression is upregulated in α-cells and required for α-cell expansion
Since it was previously suggested that isolated islets from Gcgr-/- mice have an increase in gene expression of the Q transporter Slc38a5 (Graham et al, 2008), we investigated the role of this AA transporter in α-cell proliferation. Mice with interrupted glucagon signaling (GcgrHep-/-) had an 82-fold increase in the number of α-cells expressing SLC38A5 over control mice (GcgrHep+/+) that rarely had detectable expression in α-cells and weak expression in the exocrine tissue (Figures 4A-C). Similarly, α-cells in wildtype mice treated with GCGR mAb had upregulated expression of SLC38A5 and this increase was mitigated by co-treatment with rapa (Figure S5A-D). Kim and colleagues also report that SLC38A5 is upregulated in α-cells of mice with interrupted glucagon signaling and that this upregulation is sensitive to rapa treatment (Kim et al., 2017). We observed that SLC38A5 expression was occasionally expressed in α-cells of FoxP1/2/4 islet null mice treated with GCGR mAb (Figures S5E-H). α-cells of Gcgr+/+ or -/-islets transplanted into Gcgr-/- mice for either one or eight weeks had increased proliferation and robust SLC38A5 expression (Longuet et al., 2013; Figures 4E, 4G, 4I) while those transplanted into Gcgr+/+ mice had undetectable SLC38A5 expression (Figures 4D, 4F, 4H). SLC38A5 expression was undetectable in α-cells after 3 days of culture in High AA media (data not shown) when α-cell proliferation rates were greater than 4% (Figure 2E,G). However, at 4 days of culture 1.5% of α-cells cultured in high AA media (High AA) expressed SLC38A5 (Figure 4L-M) while α-cell proliferation rates were 5% (Figure 4N). Similar to proliferating α-cells, SLC38A5 expression in α-cells was extremely rare in media containing either low AAs (Low AA) or high AAs with low levels of Q (High AA Low Q) (Figure 4J-K, 4M-N). Together, these data demonstrate that SLC38A5 expression in α-cells is regulated by AA in an mTOR-dependent fashion.
Figure 4. SLC38A5 is upregulated in α-cells and required for expansion of α-cells in response to interrupted glucagon signaling.
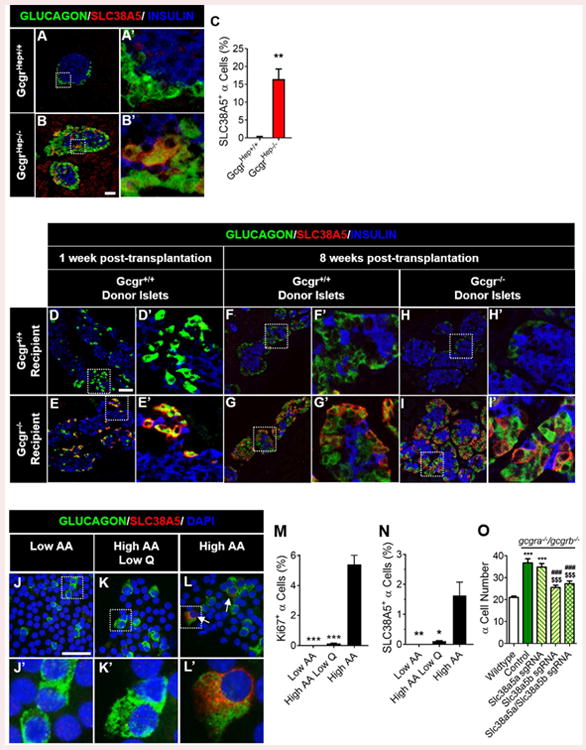
Representative images of pancreatic islet α-cell SLC38A5 expression are shown in (A) control GcgrHep+/+ and (B) GcgrHep-/- mouse pancreas. Glucagon (green), SLC38A5 (red), and insulin (blue) are shown. White scale bars indicate 50μm. White dashed boxes indicate region selected for insets. (C) Quantification of SLC38A5+ α-cells in GcgrHep+/+ (white) and GcgrHep-/- (red) mouse pancreas; **p<0.01; n=3. (D-I) Representative images of pancreatic islet α-cell SLC38A5 expression in Gcgr+/+ and Gcgr-/-islets from subcapsular renal transplantation into Gcgr+/+ and Gcgr-/- mice (n=3). SLC38A5 expression is shown at (D-E) one week and (F-I) eight weeks post-transplantation. Representative images of pancreatic islet α-cell SLC38A5 expression are shown in dispersed islets cultured in in (J) Low AA, (K) High AA Low Q, or (L) High AA media for four days. Glucagon (green), SLC38A5 (red), and dapi (blue) are shown. White arrows indicate SLC38A5+ α-cells. Quantification of (M) α-cell proliferation and (N) SLC38A5+ α-cells in isolated islets cultured in Low AA, High AA Low Q, or High AA media for four days. *p<0.05, **p<0.01 and **p<0.001 vs High-AA treated; n=3. (O) α-cell number after knockdown of slc38a5 genes in 6dpf wildtype (white) and gcgra-/-gcgrb-/- (green-control) zebrafish larvae primary islet. α-cell number in slc38a5a sgRNA-treated gcgra-/-gcgrb-/- (yellow with green left-hashed), slc38a5b sgRNA-treated gcgra-/-gcgrb-/- (yellow with green right-hashed) or slc38a5a/slc38a5b sgRNA-treated gcgra-/-gcgrb-/- (yellow with green double-hatched) are also shown. ***p<0.001 vs Wildtype, ###p<0.001 vs. control gcgra-/-gcgrb-/-, and $$$p<0.001 vs. slc38a5a sgRNA-treated gcgra-/-gcgrb-/-; n=7-23. Data are mean ± SEM.
Slc38a5-/- mice have reduced proliferation of α-cells in response to interrupted glucagon signaling (Kim et al., 2017). To further test the role of SLC38A5 in α-cell expansion, we used CRISPR-mediated knockdown of slc38a5 genes in gcgra-/-/gcgrb-/- zebrafish and found that ablation of slc38a5b, but not slc38a5a partially prevented α-cell expansion (Figure 4O). These data support the hypothesis that Q uptake into α-cells plays a critical role in α-cells' ability to proliferate in response to high AA levels.
Human islet α-cells proliferate in response to interrupted glucagon signaling
Since mouse endocrine mitogens rarely stimulate proliferation of adult human endocrine cells (Bernal-Mizrachi et al., 2014) and mouse and human islets have other substantial differences (Dai et al, 2012), we investigated whether human α-cells proliferate following interrupted glucagon signaling. This is a relevant question since GCGR inhibitors are in clinical phases of development for the treatment of both type 1 and type 2 diabetes (Campbell and Drucker, 2015). To investigate this question, we transplanted human islets into immunodeficient mice (Dai et al., 2016) and treated these mice with GCGR mAb (Figure 5A; S6A-B). As expected, GCGR mAb-treated mice had lower glycemia, elevated GLP-1, and hyperglucagonemia (Figures 5B-D; S6D-G). GCGR mAb treatment increased glucagon content and α-cell proliferation in both the endogenous mouse pancreas and the transplanted human islets (Figures 5E-H; S6I-N). While the majority of human islet preparations showed a 5-27 fold increase in α-cell proliferation, islets from 2 donors did not (Figure 5I). Interestingly, the baseline proliferation rates of α-cells for these two donors were 16-fold higher than the baseline proliferation rates in the islets of the other 5 human donors that responded to GCGR mAb treatment. Thus, human adult α-cells proliferate in vivo in response to interrupted glucagon signaling.
Figure 5. Human pancreatic islet α-cells proliferate when glucagon signaling is interrupted.
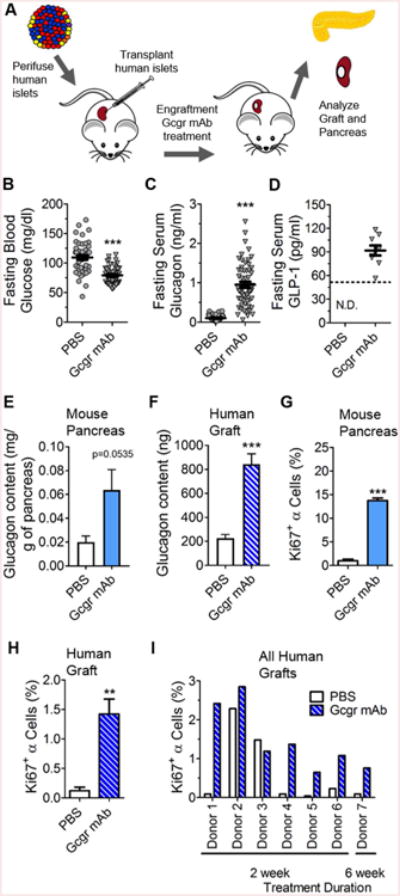
(A) Experimental design of human islet subcapsular renal transplantation and GCGR mAb treatment. (B) Fasting blood glucose (n=49-50), (C) serum glucagon levels (n=42-55), and (D) serum GLP-1 levels (n=10) on Day 10 in mice treated with either PBS (grey circles) or GCGR mAb (grey triangles). Quantification of (E) mouse pancreatic and (F) human islet donor (Donor 8) graft glucagon content (n=6-8) 4 weeks after GCGR mAb treatment. Quantification of (G) mouse (n=3) and (H) human islet donor (Donor 4) graft α-cell proliferation (n=5-6) 2 weeks after treatment with GCGR mAb. **p<0.01, ***p<0.001 vs PBS-treated; ND not detected. (I) Quantification of human islet α-cell proliferation in individual donor islets grafts from 7 different experiments of NSG mice treated with PBS or GCGR mAb for 2 to 6 weeks. Data are mean ± SEM.
Discussion
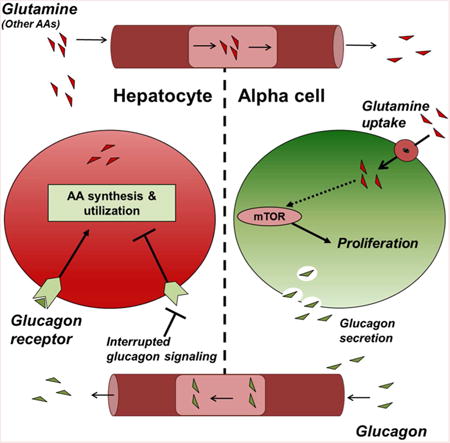
Interrupting GCGR signaling by various ways leads to α-cell proliferation, and a hepatic-derived circulating mitogen has been proposed (Longuet et al., 2013; Yu et al., 2015). Using a comprehensive multimodal approach and three models with altered glucagon signaling, we found the activity resides in <10kDa fraction of mouse serum, alterations in genes regulating hepatic AA catabolism, and increased serum AA levels. Increased AA, but not lipids and other soluble factors, selectively increased rapamycin-sensitive α-cell proliferation. Of these elevated AA, Q and the putative Q transporter SLC38A5, play a predominant role. We also found that FoxP transcription factors in islet α-cells were required to stimulate α-cell proliferation, but were not required for activation of mTOR signaling or SLC38A5 expression. Importantly, we showed that human α-cells proliferate in response to interrupted glucagon signaling. Based on these results, we propose a model where glucagon regulates AA catabolism and, via a feedback loop, Q regulates glucagon via mTOR/FoxP-dependent control of α-cell proliferation (Figure 6; described below).
Figure 6. Model for liver-pancreatic islet α-cell axis where L-glutamine and glucagon reciprocally regulate each other.
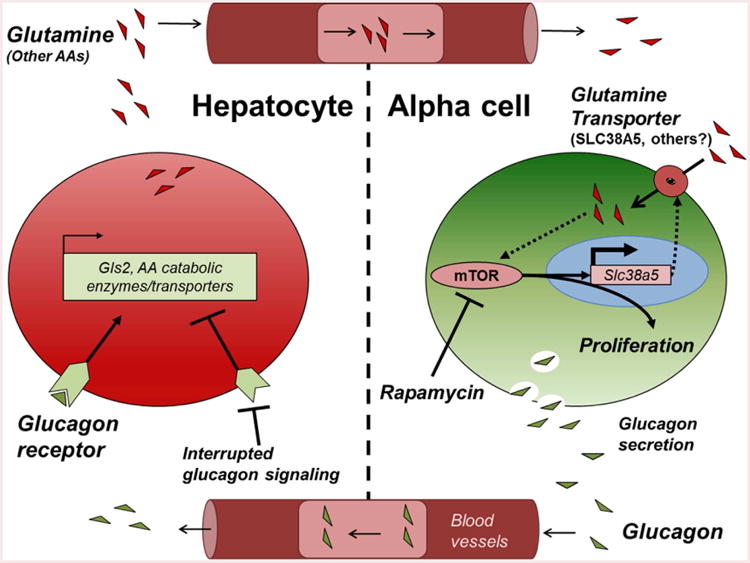
Glucagon is released from pancreatic islet α-cells where it acts on hepatocyte GCGRs to stimulate gluconeogenesis and hepatic glucose output, raising blood glucose. Interrupted glucagon signaling in hepatocytes leads to decreased AA catabolism and increased circulating AA. Of these AA, Q selectively activates α-cell proliferation through both FoxP- and mTOR-dependent mechanisms. mTOR activation in the α-cell leads to upregulation of Slc38a5 expression that further potentiates Q-dependent α-cell proliferation completing an endocrine feedback loop between liver and pancreatic islet α-cells. Glutaminase 2-GLS2, mechanistic target of rapamycin-mTOR, amino acids-AAs.
We observed alterations in bile and lipid/cholesterol metabolism, consistent with previous observations (Yang et al., 2011). However, these small molecules are not the drivers of α-cell proliferation because: 1) bile acids were not increased in GCGR mAb-treated mice (Figures F-G); 2) increasing serum bile acid levels with a cholic acid-rich diet did not increase α-cell mass (Longuet, et al., 2013); and 3) removal of triglycerides, cholesterol, and phospholipids from Gcgr-/- mouse serum did not alter its ability to stimulate α-cell proliferation (Figure S2H). Recently, angiopoietin-like 4, a regulator of triglyceride metabolism, was found to be upregulated in adipose tissue of mice with interrupted glucagon signaling and angiopoietin-like-4 null mice have reduced α-cell proliferation when treated with GCGR antagonist compared to wild-type controls (Ben-Zvi et al., 2015). However, only palmitate, but not angptl-4 directly stimulated α-cell proliferation in vitro (Ben-Zvi et al., 2015). We did not find changes in Angptl-4 expression in liver, nor did Angptl-4 or palmitate directly stimulate α-cell proliferation in isolated islets (Figure S2I). Recently, Okamoto and colleagues also demonstrated that Angptl-4 has no influence on α-cell proliferation (Okamoto et al., 2017; Dean et al, 2017).
We also compared data from a previously published gene expression study in liver of mice with overactivation of the GCGR-cAMP-PKA-CREB signaling pathways (Song et al., 2014) and identified genes that were downregulated by glucagon signaling (e.g. Defb1, Inhba, and genes involved in AA catabolism; data not shown). Conversely, DEFB1 and INHBA were both upregulated in response to glucagon treatment of human hepatocytes (Solloway et al., 2015). Regardless, Defensin b1 or Activin A proteins did not stimulate α-cell proliferation in our in vitro assay.
Serum is a complex mixture of macromolecules. While it is possible that other factors in Gcgr-/-serum also contribute to α-cell proliferation in mice with interrupted glucagon signaling, AA were the only factors that met all our criteria and acted as an α-cell mitogen in vitro. Glucagon potently regulates liver gluconeogenesis via GCGR-Gsα-cAMP-PKA-CREB signaling. Our analyses of models of interrupted and excessive glucagon action showed that glucagon broadly regulated expression of genes involved in AA catabolism/transport and specifically the downregulation of GLS2, the major degradation enzyme of Q, and SLC1A4 (ASCT1) transporter expression (Figure 2A). We predict that the reduction of GLS2 and SLC1A4 expression when glucagon signal is interrupted results in impaired Q transport and gluconeogenesis/Q catabolism, causing Q accumulation in the blood (Figure 6). Given the frequent flux of AA in the blood from meal ingestion, we were surprised that an abundant AA could act as a selective potent mitogen for α-cells. We propose that the α-cell mitogenic signal is Q-dependent and suggest a model where glucagon regulates serum AA levels and Q with other AA regulates α-cell proliferation and mass via mTOR-dependent nutrient sensing (Figure 6; Holst et al., 2017). Solloway et al. recently showed that AA levels are higher in Gcgr-/- mouse serum, and our data support and extend their observations. Q, the most abundant AA in blood (∼0.5mM), is an important energy source. Normally, Q released by skeletal muscle and lungs maintains normal Q concentrations in the blood with liver considered to have little influence on serum Q levels (Hensley, et al., 2013). Our results underscore liver's importance in regulating serum Q/AA levels. It remains unclear what effects higher serum AA levels have on other tissues important for Q metabolism (e.g. muscle).
It is also unclear how Q selectively stimulates α-cell proliferation and whether Q promotes neogenesis of α-cells or transdifferentiation of other endocrine cells to glucagon-positive cells. Malignant cells have upregulated Q uptake (Slc1a5; Hassanein et al., 2013) and metabolism (GLS1) to drive proliferation under conditions where Q levels are growth-limiting. Similarly, Q and its metabolites (e.g. L-glutamate, α-ketoglutarate) could participate in stimulating α-cell proliferation under high AA/Q conditions via inactivating downstream pathways such as AMPK (Sayers et al, 2016), but we found that high L-glutamate levels were not necessary for AA to stimulate α-cell proliferation (Figure 2E). Q/AA transporters Slc38a5/SNAT5 and Slc38a2/SNAT2 are selectively expressed in mouse α-cells in the islet, and the latter possibly plays a role in Q stimulation of glucagon secretion (Benner et al., 2014; Gammelsaeter et al., 2009). Mouse α-cells express SLC38A5 during development, but not during adulthood (Stanescu et al, 2016). Here, we also showed that adult mouse α-cells rarely express SLC38A5 protein under normal conditions, but upregulate SLC38A5 under conditions of interrupted glucagon signaling, and that SLC38A5 facilitates expansion of α-cells in a model of interrupted glucagon secretion. Kim and colleagues report similar findings in mice (Kim et al., 2017). However, cell type-specific ablation will be needed to confirm a role for α-cell expression of SLC38A5. Neither we, nor Kim and colleagues, detected Slc38a5 transcript or SLC38A5 protein in adult human α-cells even after treatment with GCGR antibodies in islet transplantation models (Figure S6N-O; Kim et al., 2017). Therefore, it is unclear which AA transporters are playing a role in human α-cell proliferation. Two Q/AA transporters (Slc7a14 and Slc38a4/SNAT4) are preferentially expressed in human α-cells when compared to other islet and exocrine cells (Dorrell et al., 2011; Bramswig et al., 2013; Xin et al., 2016) and may play a role. Interestingly, we saw a four-fold increase in wildtype mouse α-cell proliferation at 3 days of treatment with high AA/Q media, while SLC38A5 expression was undetectable until 4 days of culture (data not shown and Figures 2E, 4M). This suggests that other transporters/signals promote α-cell proliferation in response to high AAs/Q under basal conditions, but that SLC38A5 is induced over time by mTOR to potentiate high AAs' signal to proliferate. This redundancy may explain why we see a partial attenuation of α-cell expansion when Slc38a5 genes are knocked down (Figure 4O and Kim et al., 2017).
AA, especially L-leucine, are known to activate mTOR, an important intracellular integrator of growth signals and nutrient availability (Sheen et al., 2011). Q/AA antiporters drive cell proliferation in response to AA by exchanging mTOR-activating essential AA like L-leucine (Pochini et al., 2014). Interestingly, reducing L-leucine levels to Gcgr+/+ serum-like levels had no effect on α-cell proliferation in vitro while high Gcgr-/-serum-like Q levels were indispensable, but insufficient alone. High AA (e.g. L-arginine and Q) stimulate hormone secretion from both pancreatic islet α-cells and β-cells. Surprisingly, high Q levels specifically stimulated α-cell proliferation, but not β- and δ-cells suggesting that islet cells have different mechanisms for sensing and integrating AA signals (Figure 2G, S3I, and data not shown).
Two studies in humans identified missense GCGR mutations that are linked to a rare form of glucagonoma syndrome (Zhou et al., 2009; Miller et al, 2015). A recent study showed that a patient with a GCGR splice mutation had hyperaminoacidemia (Larger et al, 2016) while glucagonoma patients without known GCGR mutations present with hypoaminoacidemia from excess glucagon action. It is possible that elevated Q plays a role in patients with GCGR inactivating mutations as Gcgr-/- mice and other mouse models of interrupted glucagon signaling develop α-cell tumors as they age (Yu et al., 2011; Yang et al., 2011; Watanabe et al 2012; Takano et al, 2015). In animal studies where GCGR antibodies are withdrawn or where glucagon is administered, α-cell mass reduces over time suggesting tight responsiveness to AA signaling (Gu et al, 2009; Okamoto et al., 2015; Petersson and Hellman, 1963).
Hyperaminoacidemia occurs also under a variety of normal physiological conditions and metabolic disorders. Elevated serum BCAAs, tyrosine, phenylanlanine, and tryptophan levels are found in patients with T2D (Newgard 2012; Chen et al., 2016; Yoon 2016; Guasch-Ferre et al., 2016) and cardiovascular disease (Li et al, 2017), while lower serum Q and glycine levels are associated with increased risk of T2D (Guasch-Ferre et al., 2016). In our study, most AAs (both gluconeogenic and ketogenic) are elevated in mice with interrupted glucagon signaling, including BCAAs. While the influence of AAs on glucagon secretion has been known for some time (Ohneda et al., 1968), the current study links AAs to regulation of α-cell mass. Furthermore, this feedback loop may be an important determinant of α-cell mass during development. We and others (Reusens et al., 2007) hypothesize that islet cell mass at birth may influence future risk of diabetes. During gestation, fetal AA levels are predicted to be higher than maternal levels because placental AA transporter expression is high (Economides et al., 1989; Cetin et al., 1996). It is possible that fetal hyperaminoacidemia promotes rapid expansion of α-cell mass during development.
These studies demonstrate interorgan communication where hepatic glucagon signaling regulates AA metabolism and serum Q levels, and thus influences α-cell mass. We postulate that α-cells have a unique or high capacity transport mechanism for Q, allowing them to preferentially respond to increasing serum levels. Future studies should address how α-cells utilize Q and whether increased demand for glucagon secretion influences α-cell proliferation. Another avenue of interest is if pathophysiological conditions with increased AA, like diabetes and muscle catabolism, influence α-cell proliferation. Understanding how Q signals in the α-cell to promote proliferation may help us to develop therapeutics to mitigate undesired α-cell hyperplasia of glucagon suppression or conversely to expand α-cells that could be transdifferentiated to new β-cells.
Star Methods
Contact fror Reagent and Resource Sharing
Further information and requests for resources and reagents should be directed to and will be fulfilled by the Lead Contact, Alvin C. Powers (al.powers@vanderbilt.edu) except for the Gcgr mAb. Requests for Gcgr mAb should be directed to Wei Gu (wgu@amgen.com) and Hai Yan (haiyan@remdbio.com).
Experimental Model and Subject Details
Mouse models
Interruption of glucagon signaling by multiple approaches (proglucagon gene knockout, interruption of Gcgr or its signaling, GCGR small molecule inhibitors, GCGR antibodies, or Gcgr antisense oligonucleotides) results in hyperglucagonemia and α-cell hyperplasia. We utilized several of these animal models in this study to search for the hepatic factor stimulating α-cell proliferation including Gcgr-/- (global glucagon receptor), GcgrHep-/- (liver-specific glucagon receptor), and GCGR mAb treated mice and gcgra-/-gcgrb-/- zebrafish (Longuet et al., 2013; Gu et al, 2009; Li et al., 2015). Global Gcgr-/- and liver-specific GcgrHep-/- mice on C57Bl6/J background 5 months old males have been described previously (Gelling et al, 2003; Longuet et al., 2013). Islet-specific FoxP1/2/4-/- mice have been described previously (Spaeth et al, 2015). In these mice, which had the characteristic eye phenotype, we found that >80% of beta cells and >50% of alpha cells were Cre recombinase positive (Figures S4K-L). Male 12-20 weeks old NOD.Cg-Prkdc scidIl2rgtm1WjlSz (NSG™) immunodeficient (King et al., 2008) and male 8-14 weeks old C57Bl6/J mice were from Jackson Laboratory. All mice were maintained on standard rodent chow under 12-hour light/ 12-hour dark cycle. There were no differences between groups for body mass and all mice in these experiments were in good health. All experiments were conducted according to protocols and guidelines approved by the Vanderbilt University Institutional Animal Care and Use Committee.
Zebrafish models
Wildtype and gcgra-/-gcgrb-/- zebrafish larvae with Tg(gcga:EGFP) that marks all α-cells with GFP were used in these studies as described previously (Li et al., 2015). There are two isoforms of Slc38a5 (Slc38a5a and Slc38a5b) in zebrafish likely as the result of a genome duplication event in teleost evolution. To knockdown slc38a5a and slc38a5b by CRISPR/Cas, Tg(gcga:EGFP) wildtype and gcgra-/-gcgrb-/- zebrafish zygotes were injected with a mixture of cas9 protein (200pg/embryo) and gene-specific sgRNA (100pg/embryo) individually or in combination as previously described (Jao et al., 2013; Yin et al., 2015). The injected larvae and uninjected siblings were fixed at 6 dpf. The posterior half of the injected larvae was lysed for analysis of mutagenesis efficiency, while the anterior half was used for α-cell number determination as above. The sgRNAs target a sequence encoding a conserved transmembrane domain (TM) (TM2 for slc38a5a and TM1 for slc38a5b). The target sequences for slc38a5a and slc38a5b are CCATCGCTTTGCTCTCTTCTTcC and ggACCTCAGCAATGCCATCATGG, respectively, with the PAM sequence underlined and mismatches in lower case.
Human islet donors
Human islets quality from the Integrated Islet Distribution Program (www.iidp.coh.org) was validated by islet perifusion method as described previously (Dai et al., 2012). The perifusion data for some of the islet preparations were part of a previously published dataset where the method is described in detail (Kayton et al., 2015). Individual donor details can be found in Table S6.
Methods Details
Mouse Studies
For GCGR mAb treatments, mice were treated weekly with 10mg/kg of a humanized monoclonal anti-Gcgr antibody (Gcgr mAb Amgen, Inc) intraperitoneally for 3 days to 6 weeks. This resulted in decreased blood glucose, hyperglucagonemia, and increased pancreas mass within 10 days of treatment (and data not shown). For rapa treatment of mice, rapa was prepared from a suspension of 1 mg/ml RapaImmune (Pfizer) in saline and mice were injected with either saline or 0.2mg/kg rapa every 3 days for 2 weeks total.
Tissue Preparation and Sectioning
Immunohistochemistry was previously described (Longuet et al., 2013; Brissova et al., 2014). Briefly, pancreata and kidneys containing grafts were retrieved and fixed in 4% paraformaldehyde. The tissue was then embedded in OCT (Tissue Tek) and thin sections were prepared using a cryostat (8 μm thick for pancreas and 5μm thick for kidney grafts).
Immunohistochemistry
For α-cell proliferation in pancreas and kidney grafts, tissue sections were stained with Ki67 and glucagon. Stained sections were imaged on an epifluorescent microscope Leica DMI6000B or on a Zeiss LSM 710 confocal microscope. Manual scoring of images for colocalized Ki67, dapi, and glucagon was performed using Metamorph. For α-cell SLC38A5 expression in tissues, pancreas sections were imaged using the Scanscope FL System (Aperio Technologies), annotated, and analyzed using the Aperio eSlide Manager and ImageScope (v11.2.0.780) systems. Colocalization was determined using the CytoNuclear FL v1.2 algorithm macro (Indica Labs) as a base with adjustments made to optimize the correct identification of cells. DAPI staining was used as a nuclear marker while glucagon, insulin, and SLC38A5 were set as cytoplasmic stains. Once a final optimized algorithm was reached, the same algorithm was run on the previously annotated islets and the results of each sample were recorded. Algorithm performance was manually validated for each islet. mTOR activation was assessed by the presence of pS6 immunostaining.
Islet isolation and Cytospin assay
Challenges for in vitro α-cell proliferation assays include the low number of α-cells in an islet (<15% of islet cells), the low α-cell proliferation rate in islet cells (<2%), and baseline proliferation rates of α-cell lines are quite high making it difficult to assess potential mitogens. To overcome these limitations, we used a combination of intact islet culture with islet dispersion to form a monolayer of all islet cells to maximize the number of α-cells counted in each experiment (Figure 1A). This allowed thousands of α-cells in each sample to be counted, requiring far fewer islets compared to traditional islet embedding technique that capture only a few α-cells in each section. To further maximize the throughput of this assay, we developed a cytonuclear algorithm to automate quantification of α-cell proliferation in cytospin islet images (Figure S1C and see below).
To do this, pancreatic islets were isolated from male 8-14 week old C57Bl6/J mice (Jackson Laboratory, ME) as described previously (Brissova et al., 2014). Briefly, islets were isolated by collagenase digestion and histopaque gradient. The islets were then handpicked to >99% purity and in various media conditions for 3 days (or 4 days if stated). Unless otherwise stated, all media used for islet culture was Gibco RPMI 1640 with 2.055 mM L-glutamine (Life Technologies) with 10% Fetal Bovine Serum (Atlanta Biologicals), 1% Penicillin/Streptomycin (Gibco), and 5.6mM D-glucose. For experiments to determine if mouse serum affected proliferation, mouse serum replaced the indicated percent volume of RPMI 1640 base media while 10% Fetal Bovine Serum, 1% Penicillin/Streptomycin and 5.6mM glucose were maintained constant throughout all islet culture experiments. For experiments to determine how amino acids affect proliferation in Figure 3 and S3, media was made approximating the concentration of each amino acid measured in the serum of either Gcgr+/+ or Gcgr-/-. Then to determine which specific amino acids were responsible for proliferation, a spectrum of media were made with varying concentrations of individual amino acids in each media (e.g. Media 3 has high total amino acids as is measured in Gcgr-/- mouse serum, but low levels of L-glutamine as is measured in Gcgr+/+ mouse serum). For complete amino acid content in each media condition, see Table S4.
Mouse blood was collected into 1.5mL Eppendorf tubes and allowed to clot on ice for 30 minutes. Serum was separated by centrifugation for 15 minutes at 10000 × g at 4°C. For serum fractionation, serum was centrifuged for 1 hour at 2000 × g at room temperature in a 10 kDa molecular weight cutoff spin column (Millipore, Billerica, MA). The flowthrough is defined as <10kDa serum fraction and the remaining volume that did not pass though the column is defined as the >10kDa serum fraction. For lipid removal, whole mouse serum was treated with Cleanascite reagent (Biotech Support Group, Monmouth Junction, NJ) prior to islet culture at a 1:1 ratio according to the vendor's protocol. Lipid removal was validated by HPLC to remove 99% of all phopsholipids, cholesterols, and triglycerides (data not shown). For Angptl-4 experiments, islets were cultured in either BSA alone, BSA-Palmitic acid complex, hLDL, or hLDL-mAngptl-4 complex. High or low amino acid containing media were used as a positive or negative conditions to affect alpha cell proliferation, respectively. Palmitic acid was prepared as described briefly (Ben-Zvi et al, 2015) and in more detail in (Brelje et al, 2008). First palmitic acid was dissolved in 25% ethanol (150mM) by incubating at 60°C for ∼40 minutes while vortexing every 5-10 minutes. 150mM Palmitic acid was then complexed with fatty acid free BSA at 37°C for 1 hr to create 50mM palmitic acid. Final media concentration of 1%BSA and 0.5mM palmitate was used for islet cultures. For Angptl-4 treatment, islets were treated with freshly prepared hLDL 50ng/ml alone or cotreated with 250ng/ml recombinant mouse Angptl-4 peptide for 72 hours culture.
Recombinant mouse Activin A protein was purchased from R&D Biosystems and biological activity was confirmed by the vendor as the ability to stimulate hemoglobin expression in K562 human chronic myologenous leukemia cells. Recombinant human defensin b1 protein (AbD Serotec) was purchased and biological activity was confirmed by the vendor as the ability to stimulate CD34+ dendritic cell migration. These proteins were reconstituted per manufacturer's instructions and added to media for 72 hours.
To measure alpha cell proliferation, the cytospin assay was employed. After culture, islets were washed in 2mM EDTA and dispersed in 0.025% Trypsin-2 mM EDTA (Gibco Life Technologies or HyClone GE Healthcare) for 5-10 minutes by gentle pipetting to obtain single or very small cell clusters. Dispersed islet cells were recovered by centrifugation in RPMI media containing 5.6mM glucose, 10% FBS, and 1% Penicillin/Streptomycin. The resulting cell pellet was resuspended in 100 ul of media and centrifuged onto a glass slide using a cytospin (Thermo Scientific, Waltham, MA) centrifuge. Air-dried slides were stored at -80C until use, thawed, and immediately fixed in 4% paraformaldehyde before immunocytochemistry. Slides were mounted with Aqua-Poly/Mount (Warrington, PA).
Cytospin slides from islets were imaged using a Leica Microsystems Epifluorescent Microscope DM1 6000B. Algorithm building and counting were performed similarly as described previously (Aamodt et al., 2016). Tiled images were analyzed by a cytonuclear algorithm developed using the Imaris Software package (Indica Labs) (Figure S1A). A glucagon surface was created by mapping glucagon immunoreactivity. DAPI and Ki67 positive cells were identified using a spot mapping algorithm. α-cells were identified by masking the glucagon surface on the DAPI staining and then creating a pseudospot where each α-cell was identified. Colocalization was determined by coregistering glucagon pseudospots with Ki67 spots. Each image was then manually checked for accuracy.
Mouse and Human Islet Transplantation
Islets from Gcgr+/+ and Gcgr-/- mice were transplanted into the subcapsular renal space of syngeneic mice as previously described (Longuet et al., 2013). After overnight culture, isolated islets were transplanted into contralateral kidneys. After 8 weeks of engraftment, the kidneys were removed for tissue embedding.
For human islet transplants, islets were cultured overnight in CRML media. Human islets were then aliquoted for transplantation. NSG™ male mice were transplanted with 500 human islets into the subcapsular space of the left kidney (Brissova et al., 2014; Dai et al., 2016). Two weeks after engraftment, mice were injected intraperitoneally with either PBS or GCGR mAb 10mg/kg weekly for either 2 or 6 weeks.
Zebrafish studies
For rapamycin (rapa) experiments, Wildtype and gcgra-/-gcgrb-/- zebrafish larvae with Tg(gcga:EGFP) that marks all α-cells with GFP were exposed to 2.5μM rapa for 3 days starting at 4 days posterfertilization (dpf). Fish larvae were fixed and flat-mounted. The α-cell number in the principal islet was manually scored via fluorescence microscopy as previously described (Li et l., 2015).
RNA Sequencing
Ten days of GCGR mAb treatment increased the percentage of proliferating α-cell approximately 14-fold (data not shown) while Gcgr-/- mice also have increased α-cell proliferation (Longuet et al., 2013). Therefore, we used these two models for liver transcriptomics. Mice were fasted for 6 hours prior to tissue collection. For RNA isolation, approximately 100mg punches of liver tissue were stored in RNAlater (Ambion) according to the manufacturer's instructions until isolation using RNeasy Mini kit with DNase I (Qiagen Hilden, DE) digestion. RNA purity and quantity were determined by Bioanalyzer. Transcriptome expression was determined as described previously (Brissova et al., 2014) using the Illumina sequencing platform and paired end library layout.
Proteomics, Metabolomics and Hormone Analyses
To complement discovery efforts to identify altered hepatic expression of secreted factors, we performed liquid chromatography-tandem mass spectrometry (LC-MS/MS) on tryptic digests of fractionated serum and aptamer-based proteomic analysis on whole serum from mice with interrupted glucagon signaling. The LC-MS/MS analyses identified peptides from 66 proteins combined in either the <10kDa Gcgr-/- or Gcgr+/+ mouse serum fractions (data not shown), but indicated no significant differences in abundance of the identified proteins. However, there were no significant differences in abundance of any of the identified proteins. Gcgr-/- mouse serum with depleted of highly abundant proteins (HAP) with antibody-based depletion columns or fractionated mouse serum treated with proteases (e.g. trypsin and proteinase K), the <10kDa Gcgr-/- mouse serum fraction retained its ability to stimulate α-cell proliferation (data not shown). Therefore, we concluded that if the factor were proteinaceous it would be protease-resistant and too small to be a HAP. LC-MS/MS analyses on tryptic digests of <10 kDa serum fractions were performed as described previously (Zimmerman et al. 2012). Serum fractions of <10kDa size were analyzed by SDS-PAGE with Coomassie blue staining. Albumin was removed by albumin antibody-coupled magnetic beads (EMD Millipore) according to vendor instructions. Serum proteins were porcine trypsin digested and identified by LC-MS/MS ionization (Thermo Q-Exactive MS) and analysis using IDPicker 2.0. Whole mouse serum was also analyzed for protein expression by SOMAscan® assay (Somalogic, Inc. Boulder, CO) aptamer-based detection technique (www.somalogic.com). While over 1400 proteins can be detected in human serum/plasma, ∼400 proteins can be detected in mouse serum/plasma due to aptamer cross-reactivity.
For hormone measurements, mice were fasted for 6 hours and blood was collected prior to glucose arginine challenge and blood collection 15 minutes after challenge. Serum was used to measure glucagon by RIA (Millipore) and GLP-1 by Luminex Assay (Millipore) by the Vanderbilt University Hormone Assay Core (Longuet, et al., 2013; Brissova et al., 2014; Dai et al., 2016). For AA measurements, fed serum was measured by Tandem MS/MS using a Quattro Micro instrument (Waters Corporation, Milford, MA) as described previously or by ion exchange HPLC with lithium citrate buffer system and post column ninhydrin quantification (Biochrom US, Holliston, MA).
Quantification and Statistical Analysis
Cell Counting
For all experiments, a minimum of 500 α-cells were counted. For islet culture experiments, total experimental mean was ∼2740±160 n=128 counted per islet preparation per condition (i.e. n=1) was required to be included in an experiment. For human islet transplantation studies defining the total individual donor proliferation rate, the total number of α-cells counted in all mice per treatment group within a donor were included for analyses (i.e. a cohort of mice is n=1). α-cell proliferation (Ki67+ α cells %) was defined by the percentage of total number of glucagon+Ki67+ double-positive cells per total number glucagon+ cells. For the purposes of understanding the selectivity of each condition to promote α-cell proliferation, the percentage of cells proliferating that are α-cells is defined as the total number of glucagon+ Ki67+ double positive cells per the total number of Ki67+ cells (Gluc+Ki67+/Ki67+ %).
Statistics
All bar graphs present the mean with or without S.E.M. Statistical significance was assessed by one-way or two-way ANOVA with Tukey multiple comparison post-test or, where appropriate, unpaired Student's t-test using GraphPad Prism 6 (San Diego, CA). A p value <0.05 was considered significant. Linear regression was performed to determine correlations between AA concentrations and α-cell proliferation rates. GLP-1 levels of all PBS-treated mice were below the detection limit of the GLP-1 assay (41 pg/ml). The GLP-1 level in one fasting GCGR mAb mouse sample was below the assay's detection limit. Therefore, no statistical analyses were performed.
Data and Software Availability
RNA Sequencing datasets have been deposited in NCBI GEO under ID code GSE89035. Gene pathway analysis was performed using Ingenuity Pathway Analysis© (IPA) software (Qiagen). Predicted secreted proteins were identified by analysis for canonical and non-canonical secretory signals using SecretomeP 2.0 (www.cbs.dtu.dk/services/SecretomeP).
Supplementary Material
Highlights.
Interrupted glucagon signaling (IGS) stimulates mouse and human α-cell proliferation
IGS alters hepatic gene expression and increases serum amino acid levels
L-glutamine is required for high amino acid stimulation of α-cell proliferation
IGS leads to α-cell expression of SLC38A5 which enhances α-cell proliferation
Acknowledgments
We thank Dr. Daniel Drucker (Toronto, ON) for helpful discussion and generously providing GcgrHep-/- mice. We also thank Drs. David Jacobson, Lisa Zimmerman, Daniel Liebler, Pierre Massion, Carlos Arteaga, Graham Carpenter, Volker Haase, Brian Wadzinski, Robert Coffey, Owen McGuinness, Masa Shiota, Alan Cherrington (Vanderbilt), Donald McClain (Wake Forest), Doris Stoffers and Diana Stanescu (U. Pennsylvania), and Cindy Roy (Johns Hopkins) for helpful discussion. The Gcgr-/- mice were generously provided by Dr. Maureen Charron. Special thanks to Mr. Scott Wright (custom media preparation) and to Dr. Derek Yee, Ms. Kayla McCloud, Ms. Aysha Mushtaq, Ms. Ella Baum, and Mr. Gerald Wakefield for technical support. This work was supported by grants from JDRF, Department of Veterans Affairs (BX000666), National Institute of Health (DK66636, DK72473, DK89572, DK89538, DK97829, DK94199, DK104211, DK106755), and Vanderbilt Diabetes Research and Training Center, including its Islet Procurement and Analysis and Hormone and Analytical Services Cores (DK20593). E.D.D. was supported by a Vanderbilt Molecular Endocrinology Training Program grant (5T32 DK07563) and a JDRF Postdoctoral Fellowship Award. W.G. is an employee of Amgen, Inc. H.Y. is an employee of REMD Biotherapeutic, Inc. Other authors report no conflicts of interest.
Footnotes
Author Contributions: E.D.D. and A.C.P. designed experiments and wrote the manuscript. E.D.D., A.G.C., K.I.A. and N. Phillips performed islet culture studies. E.D.D. and J.C. performed mouse serum fractionation studies. E.D.D., S.N.W., A.C.V.D., G.P., A.S., and C.D. performed experiments related to islet transplantation studies. E.D.D., A.C.V.D. and A.S performed the rapa mouse experiments. M.L., L.M., A.B. and W.C. designed/performed zebrafish studies. E.D.D. and N. Prasad performed RNA-Seq studies. M.C.S. wrote secretome programming. E.D.D., A.C.V.D., and J.S. performed FoxP1/2/4 studies. E.D.D. and L.R. performed delipidation experiments. O.I measured serum AA levels. H.Y. and W.G generated GCGR mAb. All authors reviewed and edited the final manuscript except M.C.S (deceased).
Publisher's Disclaimer: This is a PDF file of an unedited manuscript that has been accepted for publication. As a service to our customers we are providing this early version of the manuscript. The manuscript will undergo copyediting, typesetting, and review of the resulting proof before it is published in its final citable form. Please note that during the production process errors may be discovered which could affect the content, and all legal disclaimers that apply to the journal pertain.
References
- Aamodt KI, Aramandla R, Brown JJ, Fiaschi-Taesch N, Wang P, Stewart AF, Brissova M, Powers AC. Development of a reliable automated screening system to identify small molecules and biologics that promote human betα-cell regeneration. Am J Physiol Endocrinol Metab. 2016;311(5):E859–E868. doi: 10.1152/ajpendo.00515.2015. [DOI] [PMC free article] [PubMed] [Google Scholar]
- An J, Muoio DM, Shiota M, Fujimoto Y, Cline GW, Shulman GI, Koves TR, Stevens R, Millington D, Newgard CB. Hepatic expression of malonyl-CoA decarboxylase reverses muscle, liver and whole-animal insulin resistance. Nat Med. 2004;10(3):268–274. doi: 10.1038/nm995. [DOI] [PubMed] [Google Scholar]
- Ben-Zvi D, Barrandon O, Hadley S, Blum B, Peterson QP, Melton DA. Angptl4 links alphα-cell proliferation following glucagon receptor inhibition with adipose tissue triglyceride metabolism. Proc Natl Acad Sci U S A. 2015;112:15498–15503. doi: 10.1073/pnas.1513872112. [DOI] [PMC free article] [PubMed] [Google Scholar]
- Benner C, van der Meulen T, Caceres E, Tigyi K, Donaldson CJ, Huising MO. The transcriptional landscape of mouse beta cells compared to human beta cells reveals notable species differences in long non-coding RNA and protein-coding gene expression. BMC Genomics. 2014;15:620. doi: 10.1186/1471-2164-15-620. [DOI] [PMC free article] [PubMed] [Google Scholar]
- Bernal-Mizrachi E, Kulkarni RN, Scott DK, Mauvais-Jarvis A, Stewart AF, Garcia-Ocana A. Human betα-cell proliferation and intracellular signaling part 2: still driving in the dark without a road map. Diabetes. 2014;63:819–831. doi: 10.2337/db13-1146. [DOI] [PMC free article] [PubMed] [Google Scholar]
- Bramswig NC, Everett LJ, Schug J, Dorrell C, Liu C, Luo Y, Streeter PR, Naji A, Grompe M, Kaestner KH. Epigenomic plasticity enables human pancreatic alpha to beta cell reprogramming. J Clin Invest. 2013;123:1275–1284. doi: 10.1172/JCI66514. [DOI] [PMC free article] [PubMed] [Google Scholar]
- Brissova M, Aamodt K, Brahmachary P, Prasad N, Hong JY, Dai C, Mellati M, Shostak A, Poffenberger G, Aramandla R, Levy SE, Powers AC. Islet microenvironment, modulated by vascular endothelial growth factor-A signaling, promotes beta cell regeneration. Cell Metab. 2014;19:498–511. doi: 10.1016/j.cmet.2014.02.001. [DOI] [PMC free article] [PubMed] [Google Scholar]
- Campbell JE, Drucker DJ. Islet alpha cells and glucagon--critical regulators of energy homeostasis. Nat Rev Endocrinol. 2015;11:329–338. doi: 10.1038/nrendo.2015.51. [DOI] [PubMed] [Google Scholar]
- Cetin I, Ronzoni S, Marconi AM, Perugino G, Corbetta C, Battaglia FC, Pardi G. Maternal concentrations and fetal-maternal concentration differences of plasma amino acids in normal and intrauterine growth-restricted pregnancies. Am J Obstet Gynecol. 1996;174:1575–1583. doi: 10.1016/s0002-9378(96)70609-9. [DOI] [PubMed] [Google Scholar]
- Chen T, Ni Y, Ma X, Bao Y, Liu J, Huang F, Hu C, Xie G, Zhao A, Jia W, Jia W. Branched-chain and aromatic amino acid profiles and diabetes risk in Chinese populations. Sci Rep. 2016;6:20594. doi: 10.1038/srep20594. [DOI] [PMC free article] [PubMed] [Google Scholar]
- Dai C, Brissova M, Hang Y, Thompson C, Poffenberger G, Shostak A, Chen Z, Stein R, Powers AC. Islet-enriched gene expression and glucose-induced insulin secretion in human and mouse islets. Diabetologia. 2012;55:707–718. doi: 10.1007/s00125-011-2369-0. [DOI] [PMC free article] [PubMed] [Google Scholar]
- Dai C, Kayton NS, Shostak A, Poffenberger G, Cyphert HA, Aramandla R, Thompson C, Papagiannis IG, Emfinger C, Shiota M, Stafford JM, Greiner DL, Herrera PL, Shultz LD, Stein R, Powers AC. Stress-impaired transcription factor expression and insulin secretion in transplanted human islets. J Clin Invest. 2016;126:1857–1870. doi: 10.1172/JCI83657. [DOI] [PMC free article] [PubMed] [Google Scholar]
- Dean ED, Unger RH, Holland WL. Glucagon antagonism in islet cell proliferation. Proc Natl Acad Sci U S A. 2017;114:3006–3008. doi: 10.1073/pnas.1700468114. [DOI] [PMC free article] [PubMed] [Google Scholar]
- Dorrell C, Schug J, Lin CF, Canaday PS, Fox AJ, Smirnova O, Bonnah R, Streeter PR, Stoeckert CJ, Jr, Kaestner KH, Grompe M. Transcriptomes of the major human pancreatic cell types. Diabetologia. 2011;54:2832–2844. doi: 10.1007/s00125-011-2283-5. [DOI] [PMC free article] [PubMed] [Google Scholar]
- Economides DL, Nicolaides KH, Gahl WA, Bernardini I, Evans MI. Plasma amino acids in appropriate- and small-for-gestational-age fetuses. Am J Obstet Gynecol. 1989;161:1219–1227. doi: 10.1016/0002-9378(89)90670-4. [DOI] [PubMed] [Google Scholar]
- Ferrara CT, Wang P, Neto EC, Stevens RD, Bain JR, Wenner BR, Ilkayeva OR, Keller MP, Blasiole DA, Kendziorski C, Yandell BS, Newgard CB, Attie AD. Genetic networks of liver metabolism revealed by integration of metabolic and transcriptional profiling. PLoS Genet. 2008;4:e1000034. doi: 10.1371/journal.pgen.1000034. [DOI] [PMC free article] [PubMed] [Google Scholar]
- Gammelsaeter R, Jenstad M, Bredahl MK, Gundersen V, Chaudhry FA. Complementary expression of SN1 and SAT2 in the islets of Langerhans suggests concerted action of glutamine transport in the regulation of insulin secretion. Biochem Biophys Res Commun. 2009;381:378–382. doi: 10.1016/j.bbrc.2009.02.062. [DOI] [PubMed] [Google Scholar]
- Gelling RW, Du XQ, Dichmann DS, Romer J, Huang H, Cui L, Obici S, Tang B, Holst JJ, Fledelius C, Johansen PB, Rossetti L, Jelicks LA, Serup P, Nishimura E, Charron MJ. Lower blood glucose, hyperglucagonemia, and pancreatic alpha cell hyperplasia in glucagon receptor knockout mice. Proc Natl Acad Sci U S A. 2003;100:1438–1443. doi: 10.1073/pnas.0237106100. [DOI] [PMC free article] [PubMed] [Google Scholar]
- Graham ML, Mc Cormick J, Verardo M, Demore MA, Anderson AA, Yan H, Charron MJ, Lindberg RA, Gu W, Ellison MM. Dysregulation of glucagon secretion in glucagon receptor null pancreatic islets. ADA 68th Scientific Sessions. 2008:1660. [Google Scholar]
- Gu W, Yan H, Winters KA, Komorowski R, Vonderfecht S, Atangan L, Sivits G, Hill D, Yang J, Bi V, Shen Y, Hu S, Boone T, Lindberg RA, Veniant MM. Long-term inhibition of the glucagon receptor with a monoclonal antibody in mice causes sustained improvement in glycemic control, with reversible alphα-cell hyperplasia and hyperglucagonemia. J Pharmacol Exp Ther. 2009;331:871–881. doi: 10.1124/jpet.109.157685. [DOI] [PubMed] [Google Scholar]
- Guasch-Ferre M, Hruby A, Toledo E, Clish CB, Martinez-Gonzalez MA, Salas-Salvado J, Hu FB. Metabolomics in Prediabetes and Diabetes: A Systematic Review and Meta-analysis. Diabetes Care. 2016;39:833–846. doi: 10.2337/dc15-2251. [DOI] [PMC free article] [PubMed] [Google Scholar]
- Hassanein M, Hoeksema MD, Shiota M, Qian J, Harris BK, Chen H, Clark JE, Alborn WE, Eisenberg R, Massion PP. SLC1A5 mediates glutamine transport required for lung cancer cell growth and survival. Clin Cancer Res. 2013;19:560–570. doi: 10.1158/1078-0432.CCR-12-2334. [DOI] [PMC free article] [PubMed] [Google Scholar]
- Hensley CT, Wasti AT, DeBerardinis RJ. Glutamine and cancer: cell biology, physiology, and clinical opportunities. J Clin Invest. 2013;123:3678–3684. doi: 10.1172/JCI69600. [DOI] [PMC free article] [PubMed] [Google Scholar]
- Holst JJ, Wewer Albrechtsen NJ, Pedersen J, Knop FK. Glucagon and Amino Acids Are Linked in a Mutual Feedback Cycle: The Liver-alphα-cell Axis. Diabetes. 2017;66:235–240. doi: 10.2337/db16-0994. [DOI] [PubMed] [Google Scholar]
- Kayton NS, Poffenberger G, Henske J, Dai C, Thompson C, Aramandla R, Shostak A, Nicholson W, Brissova M, Bush WS, Powers AC. Human islet preparations distributed for research exhibit a variety of insulin-secretory profiles. Am J Physiol Endocrinol Metab. 2015;308:E592–602. doi: 10.1152/ajpendo.00437.2014. [DOI] [PMC free article] [PubMed] [Google Scholar]
- Kim J, Okamoto H, Huang Z, Anguiano G, Chen S, Liu Q, Cavino K, Xin Y, Na E, Hamid R, Lee J, Zambrowicz B, Unger R, Murphy AJ, Xu Y, Yancopoulos GD, Li W, Gromada J. Amino acid transporter Slc38a5 contributes to glucagon receptor inhibtion-induced pancreatic α-cell hyperplasia in mice. Cell Metab. 2017 doi: 10.1016/j.cmet.2017.05.006. in press. [DOI] [PMC free article] [PubMed] [Google Scholar]
- King M, Pearson T, Shultz LD, Leif J, Bottino R, Trucco M, Atkinson MA, Wasserfall C, Herold KC, Woodland RT, Schmidt MR, Woda BA, Thompson MJ, Rossini AA, Greiner DL. A new Hu-PBL model for the study of human islet alloreactivity based on NOD-scid mice bearing a targeted mutation in the IL-2 receptor gamma chain gene. Clin Immunol. 2008;126(3):303–314. doi: 10.1016/j.clim.2007.11.001. [DOI] [PubMed] [Google Scholar]
- Larger E, Wewer Albrechtsen NJ, Hansen LH, Gelling RW, Capeau J, Deacon CF, Madsen OD, Yakushiji F, De Meyts P, Holst JJ, Nishimura E. Pancreatic alphα-cell hyperplasia and hyperglucagonemia due to a glucagon receptor splice mutation. Endocrinol Diabetes Metab Case Rep EDM. 2016;160081 doi: 10.1530/EDM-16-0081. [DOI] [PMC free article] [PubMed] [Google Scholar]
- Li M, Dean ED, Zhao L, Nicholson WE, Powers AC, Chen W. Glucagon receptor inactivation leads to alphα-cell hyperplasia in zebrafish. J Endocrinol. 2015;227(2):93–103. doi: 10.1530/JOE-15-0284. [DOI] [PMC free article] [PubMed] [Google Scholar]
- Li T, Zhang Z, Kolwicz SC, Jr, Abell L, Roe ND, Kim M, Zhou B, Cao Y, Ritterhoff J, Gu H, Raftery D, Sun H, Tian R. Defective Branched-Chain Amino Acid Catabolism Disrupts Glucose Metabolism and Sensitizes the Heart to Ischemia-Reperfusion Injury. Cell Metab. 2017;25:374–385. doi: 10.1016/j.cmet.2016.11.005. [DOI] [PMC free article] [PubMed] [Google Scholar]
- Longuet C, Robledo AM, Dean ED, Dai C, Ali S, McGuinness I, de Chavez V, Vuguin PM, Charron MJ, Powers AC, Drucker DJ. Liver-specific disruption of the murine glucagon receptor produces alphα-cell hyperplasia: evidence for a circulating alphα-cell growth factor. Diabetes. 2013;62:1196–1205. doi: 10.2337/db11-1605. [DOI] [PMC free article] [PubMed] [Google Scholar]
- Longuet C, Sinclair EM, Maida A, Baggio LL, Maziarz M, Charron MJ, Drucker DJ. The glucagon receptor is required for the adaptive metabolic response to fasting. Cell Metab. 2008;8:359–371. doi: 10.1016/j.cmet.2008.09.008. [DOI] [PMC free article] [PubMed] [Google Scholar]
- Miller HC, Kidd M, Modlin IM, Cohen P, Dina R, Drymousis P, Vlavianos P, Kloppel G, Frilling A. Glucagon receptor gene mutations with hyperglucagonemia but without the glucagonoma syndrome. World J Gastrointest Surg. 2015;7:60–66. doi: 10.4240/wjgs.v7.i4.60. [DOI] [PMC free article] [PubMed] [Google Scholar]
- Newgard CB. Interplay between lipids and branched-chain amino acids in development of insulin resistance. Cell Metab. 2012;15:606–614. doi: 10.1016/j.cmet.2012.01.024. [DOI] [PMC free article] [PubMed] [Google Scholar]
- Ohneda A, Aguilar-Parada E, Eisentraut AM, Unger RH. Characterization of response of circulating glucagon to intraduodenal and intravenous administration of amino acids. J Clin Invest. 1968;47:2305–2322. doi: 10.1172/JCI105916. [DOI] [PMC free article] [PubMed] [Google Scholar]
- Okamoto H, Cavino K, Na E, Krumm E, Kim S, Stevis PE, Harp J, Murphy AJ, Yancopoulos GD, Gromada J. Angptl4 does not control hyperglucagonemia or alphα-cell hyperplasia following glucagon receptor inhibition. Proc Natl Acad Sci U S A. 2017;114:2747–2752. doi: 10.1073/pnas.1620989114. [DOI] [PMC free article] [PubMed] [Google Scholar]
- Okamoto H, Kim J, Aglione J, Lee J, Cavino K, Na E, Rafique A, Kim JH, Harp J, Valenzuela DM, Yancopoulos GD, Murphy AJ, Gromada J. Glucagon Receptor Blockade With a Human Antibody Normalizes Blood Glucose in Diabetic Mice and Monkeys. Endocrinology. 2015;156:2781–2794. doi: 10.1210/en.2015-1011. [DOI] [PubMed] [Google Scholar]
- Parker JC, Andrews KM, Allen MR, Stock JL, McNeish JD. Glycemic control in mice with targeted disruption of the glucagon receptor gene. Biochem Biophys Res Commun. 2002;290:839–843. doi: 10.1006/bbrc.2001.6265. [DOI] [PubMed] [Google Scholar]
- Petersson B, Hellman B. Effects of Long Term Administration of Glucagon on the Pancreatic Islet Tissue of Rats and Guinea-Pigs. Acta Endocrinol (Copenh) 1963;44:139–149. doi: 10.1530/acta.0.0440139. [DOI] [PubMed] [Google Scholar]
- Pochini L, Scalise M, Galluccio M, Indiveri C. Membrane transporters for the special amino acid glutamine: structure/function relationships and relevance to human health. Front Chem. 2014;2:61. doi: 10.3389/fchem.2014.00061. [DOI] [PMC free article] [PubMed] [Google Scholar]
- Reusens B, Ozanne SE, Remacle C. Fetal determinants of type 2 diabetes. Curr Drug Targets. 2007;8:935–941. doi: 10.2174/138945007781386866. [DOI] [PubMed] [Google Scholar]
- Sayers SR, Reimann F, Gribble FM, Parker H, Zac-Varghese S, Bloom SR, Foretz M, Viollet B, Rutter GA. Proglucagon Promoter Cre-Mediated AMPK Deletion in Mice Increases Circulating GLP-1 Levels and Oral Glucose Tolerance. PLoS One. 2016;11:e0149549. doi: 10.1371/journal.pone.0149549. [DOI] [PMC free article] [PubMed] [Google Scholar]
- Sheen JH, Zoncu R, Kim D, Sabatini DM. Defective regulation of autophagy upon leucine deprivation reveals a targetable liability of human melanoma cells in vitro and in vivo. Cancer Cell. 2011;19:613–628. doi: 10.1016/j.ccr.2011.03.012. [DOI] [PMC free article] [PubMed] [Google Scholar]
- Solloway MJ, Madjidi A, Gu C, Eastham-Anderson J, Clarke HJ, Kljavin N, Zavala-Solorio J, Kates L, Friedman B, Brauer M, Wang J, Fiehn O, Kolumam G, Stern H, Lowe JB, Peterson AS, Allan BB. Glucagon Couples Hepatic Amino Acid Catabolism to mTOR-Dependent Regulation of alphα-cell Mass. Cell Rep. 2015;12:495–510. doi: 10.1016/j.celrep.2015.06.034. [DOI] [PubMed] [Google Scholar]
- Song WJ, Mondal P, Wolfe A, Alonso LC, Stamateris R, Ong OC, Lim BW, Yang KS, Radovick HJ, Novaira S, Farber EA, Farber SD, Turner CR, Hussain MA. Glucagon regulates hepatic kisspeptin to impair insulin secretion. Cell Metab. 2014;19:667–681. doi: 10.1016/j.cmet.2014.03.005. [DOI] [PMC free article] [PubMed] [Google Scholar]
- Spaeth JM, Hunter CS, Bonatakis L, Guo M, French CA, Slack I, Hara M, Fisher SE, Ferrer J, Morrisey EE, Stanger BZ, Stein R. The FOXP1, FOXP2 and FOXP4 transcription factors are required for islet alpha cell proliferation and function in mice. Diabetologia. 2015;58:1836–1844. doi: 10.1007/s00125-015-3635-3. [DOI] [PMC free article] [PubMed] [Google Scholar]
- Takano Y, Kasai K, Takagishi Y, Kikumori T, Imai T, Murata Y, Hayashi Y. Pancreatic Neuroendocrine Tumors in Mice Deficient in Proglucagon-Derived Peptides. PLoS One. 2015;10:e0133812. doi: 10.1371/journal.pone.0133812. [DOI] [PMC free article] [PubMed] [Google Scholar]
- von Dorsche HH, Ziegler M. α-cell-hyperplasia of islets of Langerhans on rabbits after immunisation with glucagon (author's transl) Acta Histochem. 1981;68:290–293. [PubMed] [Google Scholar]
- Watanabe C, Seino Y, Miyahira H, Yamamoto M, Fukami A, Ozaki N, Takagishi Y, Sato J, Fukuwatari T, Shibata K, Oiso Y, Murata Y, Hayashi Y. Remodeling of hepatic metabolism and hyperaminoacidemia in mice deficient in proglucagon-derived peptides. Diabetes. 2012;61:74–84. doi: 10.2337/db11-0739. [DOI] [PMC free article] [PubMed] [Google Scholar]
- Xin Y, Kim J, Okamoto H, Ni M, Wei Y, Adler C, Murphy AJ, Yancopoulos JD, Lin C, Gromada J. RNA Sequencing of Single Human Islet Cells Reveals Type 2 Diabetes Genes. Cell Metab. 2016;24:608–615. doi: 10.1016/j.cmet.2016.08.018. [DOI] [PubMed] [Google Scholar]
- Yang J, MacDougall ML, McDowell MT, Xi L, Wei R, Zavadoski WJ, Molloy MP, Baker JD, Kuhn M, Cabrera O, Treadway JL. Polyomic profiling reveals significant hepatic metabolic alterations in glucagon-receptor (GCGR) knockout mice: implications on anti-glucagon therapies for diabetes. BMC Genomics. 2011;12:281. doi: 10.1186/1471-2164-12-281. [DOI] [PMC free article] [PubMed] [Google Scholar]
- Yin L, Jao LE, Chen W. Generation of targeted mutations in zebrafish using CRISPR/Cas9. Methods in Cell Biology. 2015;1332:205–217. doi: 10.1007/978-1-4939-2917-7_16. [DOI] [PubMed] [Google Scholar]
- Yoon MS. The Emerging Role of Branched-Chain Amino Acids in Insulin Resistance and Metabolism. Nutrients. 2016;8:405. doi: 10.3390/nu8070405. [DOI] [PMC free article] [PubMed] [Google Scholar]
- Yu R, Zheng Y, Lucas MB, Tong YG. Elusive liver factor that causes pancreatic alpha cell hyperplasia: A review of literature. World J Gastrointest Pathophysiol. 2015;6:131–139. doi: 10.4291/wjgp.v6.i4.131. [DOI] [PMC free article] [PubMed] [Google Scholar]
- Zhou C, Dhall D, Nissen NN, Chen CR, Yu R. Homozygous P86S mutation of the human glucagon receptor is associated with hyperglucagonemia, alpha cell hyperplasia, and islet cell tumor. Pancreas. 2009;38:941–946. doi: 10.1097/MPA.0b013e3181b2bb03. [DOI] [PMC free article] [PubMed] [Google Scholar]
- Zimmerman LJ, Li M, Yarborough WG, Slebbos RJC, Liebler DC. Global Stability of Plasma Proteomes for Mass Spectometry-Based Analyses. Mol Cell Proteomics. 2012;11:1–12. doi: 10.1074/mcp.M111.014340. [DOI] [PMC free article] [PubMed] [Google Scholar]
Associated Data
This section collects any data citations, data availability statements, or supplementary materials included in this article.