

Abstract
Purpose
Identification of novel biomarkers and immunotherapy targets for prostate cancer (PCa) is crucial to better diagnosis and therapy. We sought to identify novel prostate cancer tumor-associated antigens (TAA) that are expressed in prostate cancer, absent in non-prostate human tissue, and immunogenic for immune responses restricted by human HLA.
Experimental design and Results
Using microarray analysis of normal and cancerous human prostate tissues, we identified 1063 genes over-expressed in PCa. After validating 195 transcripts in publicly available array datasets, we interrogated expression of these TAA in normal human tissues to identify genes that are not expressed at detectable levels in normal, non-prostate adult human tissue. We identified 23 PCa TAA candidates. RT-PCR confirmed that 15 of these genes were over-expressed in prostate cancer (P <0.05 for each). The most frequently over-expressed gene, SIM2 (single-minded homolog 2), was selected for further evaluation as a potential target for immunotherapy. ELISA assay revealed that a fraction of PCa patients exhibited immune responsiveness to SIM2 as evidenced by the presence of auto-antibodies to SIM2 in their sera. We next showed binding of putative HLA-A2.1-restricted SIM2 epitopes to human A2.1, and immunization of transgenic HLA2.1 mice showed induction of SIM2-specific CTL responses in vivo.
Conclusions
Our findings that SIM2 is selectively expressed in prostate cancer; that human HLA A2.1-restricted SIM2 epitopes induce specific T cells in vivo, and that anti-SIM2 antibodies are detectable in PCa patients’ sera, implicate SIM2 as a prostate cancer-associated antigen that is a suitable potential target for prostate cancer immunotherapy.
Keywords: Single-minded homolog 2, Prostate Cancer, Biomarkers, Immunotherapy
Introduction
Gene expression profiling of prostate cancer has proven effective in identifying genes and molecular pathways associated with prostate cancer. Profiling of RNA transcripts has been widely utilized to dissect molecular aspects of tumor cell biology, as well as to project disease outcome that can be of high prognostic value (1-5). For example, the determination by several such array studies that ERG is commonly overexpressed in prostate cancer, led to identification of novel gene arrangements between TMPRSS2 and ETS transcription factors in PCa (6). Identifying prostate cancer-associated genes (those with higher levels in prostate cancer than benign prostate) that are concurrently not expressed at abundant levels in normal human adult extra-prostatic tissues would potentially identify prostate cancer tumor-associated antigens (TAA) with greater specificity as therapy targets than that of cancer-associated genes identified without consideration of their extraprostatic expression patterns. However, prior genome-wide expression array studies to identify genes that are over-expressed in prostate cancer have usually focused on interrogating relative levels of gene expression in cancerous prostate tissue as compared to normal prostate tissue, and the relationship of prostatic gene expression to expression of such genes in adult tissues outside of the prostate has previously only been explored with genes expressed in normal prostate, and not prostate cancer (7).
One approach for translating newly discovered TAA’s to a new direction for cancer therapy is to interrogate newly discovered TAA sequences for immunogenic peptide sequences that are predicted to bind human class I MHC, and that are therefore putative targets for T cell-mediated immunotherapy (8). However, such a strategy for identifying putative targets for prostate cancer immunotherapy has not yet been linked directly to the interrogation of prostate TAA’s discovered through concurrent interrogation of cancer and normal human tissue expression arrays. Instead, recent clinical trials of prostate cancer immunotherapy have targeted prostate cancer TAA’s that had been identified before the era of genome-wide gene expression profiling. Limitations of this ‘first generation’ of prostate TAA targets for immunotherapy have included limited cancer specificity of the target (as in PSA) or limited tissue specificity (as with PSMA or PSCA), but despite these limitations, reduction of tumor activity has been observed in several prostate cancer immunotherapy studies, and modest survival benefit was noted in two such trials (9, 10). The targeting of immunogenic peptides in prostate cancer TAA identified from genome-wide expression profiling is an untested but promising direction for improving upon the early foundations of prostate cancer immunotherapy.
We sought to identify such immunogenic peptide targets (for immunotherapy) first by interrogating new prostate cancer and normal prostate expression arrays against existing human expression arrays to identify prostate cancer specific TAA, then by ascertaining the immunogenicity of the TAA target through detecting autoantibody responses in prostate cancer patients, next by evaluating binding to human HLA-A2.1 of potentially immunogenic peptide sequences from the lead TAA, and finally by ascertaining the ability of these epitopes to induce cellular immune responses in HLA-A2.1 transgenic mice.
Materials and Methods
Animals
The HHD mice were received from Dr Francois Lemonnier (Unite d’Immunite Cellulaire Antivirale, Institut Pasteur, Paris, France). These mice are β2m–/–, Db–/– double knockout and express an HLA-A*0201 monochain composed of a chimeric heavy chain (α1 and α2 domains of HLA-A*0201 allele and the α3 and intracellular domains of Db allele) linked by its N-terminus to the C-terminus of the human β2m by a 15-amino acid peptide arm (11). Mice were housed in pathogen-free conditions and all experimental procedures involving animals were approved by the institutional IACUC committee at Beth Israel Deaconess Medical Center.
Cell lines
The human TAP-deficient T2 cell line was purchased from the American Type Culture Collection (Manassas, VA) and cultured as per ATCC’s protocol.
Peptides
All peptides used in this study were purchased from the Biopolymers Laboratory at Harvard Medical School. Peptides were >90% pure and HPLC-tested. Peptides were dissolved in DMSO and stored in aliquots at −20°C until use.
Sample selection and RNA purification
Radical prostatectomy tissue samples were obtained from the Hershey Foundation Prostate Cancer Serum and Tumor Bank at our institution. Morphologic diagnosis was performed by a pathologist. OCT blocks containing more than 30% of prostate cancerous tissue (with Gleason Score of 6 or 7) were selected for RNA purification. A biopsy punch was used to select the prostate cancer tissues from the OCT sample blocks. Benign or prostate cancer tissues were homogenized using a TissueLyser (Qiagen, Valencia, CA) at 28 Hz for 5 min. Total RNA was isolated using TRIzol reagent. RNA was quantified by NanoDrop ND-1000 Spectrophotometer (NanoDrop, Wilmington, DE) and quality was evaluated with Agilent’s RNA 6000 NanoChip and the 2100 Bioanalyzer, with 28S/18S ratios and RIN determined by 2100 Expert Software.
Gene expression microarrays and analysis
250 ng total RNA was amplified using Ambion’s MessageAmp II mRNA Amplification kit. Biotin-UTP was incorporated during the overnight in vitro transcription step according to the manufacturer’s protocol. Gene expression was assessed using Affymetrix’s (Santa Clara, CA) GeneChip U133 array (Plus 2.0 chip) arrays consisting of >52,000 transcripts from whole human genome transcripts. 15 μg cRNA was fragmented and hybridized to arrays according to the manufacturer’s protocols. The quality of scanned arrays images were determined on the basis of background values, percent present calls, scaling factors, and 3′-5′ ratio of β-actin and GAPDH using the BioConductor R packages. The signal value for each transcript was summarized using perfect matched (PM)-only based signal modeling algorithm described in dchip. The PM only based modeling based algorithm yields less number of false positives as compared to the PM-MM (mismatched) model. In this way, the signal value corresponds to the absolute level of expression of a transcript (12). These normalized and modeled signal values for each transcript were used for further high level bioinformatics analysis. During the calculation of model based expression signal values, array and probe outliers are interrogated and images spike are treated as signal outliers. The outlier detection was carried out using dchip outlier detection algorithm. A chip is considered as an outlier if the probe, single or array outlier percentage exceeds a default threshold of 5%. When comparing two groups of samples to identify genes enriched in a given phenotype, if 90% lower confidence bound (LCB) of the fold change (FC) between the two groups was above 1.2, the corresponding gene was considered to be differentially expressed. LCB is a stringent estimate of FC and has been shown to be the better ranking statistic. It has been suggested that a criterion of selecting genes that have a LCB above 1.2 most likely corresponds to genes with an “actual” fold change of at least 2 in gene expression (13).
Analysis of the Stanford _Prostate data
The raw gene expression data from 62 prostate cancer and 41 normal prostate published by Lapointe et al. (3) were obtained from the BRB arrays archived datasets. The preprocessed data was normalized using the Z transformation (M1, ONCOMINE: a cancer microarray database and integrated data-mining platform). The differentially expressed genes were identified on the basis of fold Fold change (>0.5) and Q value <0.05. The analysis identified 510 genes that are differentially expressed.
Biomarker Analysis
To prioritize the biomarker and immunotherapy targets, we need to identify the genes that are not ubiquitously expressed in all normal tissues. The gene expression data for the various human normal tissues were obtained from Gene Expression Atlas of the Genomics Institute of the Novartis Research Foundation (http://symatlas.gnf.org). Using this database, MAS5 normalized expression data along with present (P), absent (A) and marginal (M) calls for each transcript were obtained. On the basis of present and absent calls for each transcript, a priority value is calculated (Eq. 1). The gene that is absent in all tissues was given highest priority (rank 1) and the gene that is present in all of tissues is given a least priority. In other words number of present and absent calls in different tissues was used to find out the genes having restrictive expression level. To further extend the list of genes, we have also obtained a list of prostate specific genes by analyzing the Novartis gene expression data (1). The genes that are annotated absent on the basis of MAS5 calls in all the normal tissues except prostate were considered as prostate specific genes.
| 1 |
where Pp is presnt calls in prostate tissues, i to j are rest of normal tissues except prostate
Quantitative Real-Time PCR (qRT-PCR)
Validation of overexpression of the selected prostate TAAs in 7 PCa tumor and 8 control tissue specimens was performed by qRT-PCR. 50 ng of high quality RNA samples (RIN> 6.0 by Agilent 2100 bioanalyzer ) were reverse transcribed to first strand cDNA and 1 μl cDNA was used for each well RT-PCR reactions. Samples were performed in triplicates. SYBR Green PCR Master Mix (Applied Biosystems, Foster City, CA) was used for two-step real-time RT-PCR analysis on Applied Biosystems 7900HT Prism instrument. PCR primers’ sequences for targeted genes are shown in table 1. The sequences for GAPDH: GAPDH-F (5′-TGCACCACCAACTGCTTAGC -3′) and GAPDH-R (5′-GGCATGGACTGTGGTCATGAG -3′). Expression value of the targeted gene in a given sample was normalized to the corresponding expression of GAPDH. The 2−ΔΔCt method was used to calculate relative expression of the targeted genes (14).
Table 1.
Validation of 15 novel prostate tumor-associated antigens by qRT-PCR.
| Gene Accession Number | Gene Name | Primer sequences (5′-->3′) |
P value (t test) |
|---|---|---|---|
| AMACR(NM_014324) | alpha-methylacyl-CoA racemase | F: ttatgtgtgcactgggcatt R: tggggttctattgctccaac |
0.0196 |
| BICD1 (NM_001714) | bicaudal D homolog 1 | F: aggcaaacttggaaagagca R: gtaggaagcccctgaagtcc |
0.035 |
| C10orf137 (NM_015608) | chromosome 10 open reading frame 137 | F: agacccagttgtgcatttcc R: ttttaacgggattggagtgc |
0.013 |
| CDC2L6 (NM_015076) |
cell division cycle 2-like 6 | F: agaacagcacccagaccaac R: acaggtccacctgagtttgc |
0.0065 |
| ICA1 (NM_022307) | islet cell autoantigen 1 | F: tctcctgcctacatcccatc R: tccagagctcactggaaggt |
0.0138 |
| KIAA1661 (AB051448) | KIAA1661 protein | F: cgctcagttagggcagtttc R: tgggaccaaaggcatagaag |
0.05 |
| MAP7 (NM_003980) | microtubule-associated protein 7 | F: gtgtttggcacacaggacac R: aaaacatgtgcaccctctcc |
0.03 |
| MYO6 (NM_004999) | myosin VI | F: aatcactggctcacatgcag R: agtgtgcccaccttaaccag |
0.01 |
| OR51E2 (NM_030774) | olfactory receptor, family 51, subfamily E, member 2 |
F: tacgaacggttctgcaactg R: aggcagcagcaggtagatgt |
0.005 |
| PAICS (NM_006452) | phosphoribosylaminoimidazole carboxylase | F: ctggggagttcaggatgtgt R: cagcctgcttcaaggaaatc |
0.003 |
| PCSK6 (NM_002570) | proprotein convertase subtilisin/kexin type 6 | F: gccaaacctgtgtaggcatt R: gggttctctccagctcacag |
0.0045 |
| PVT1 (NR_003367) | Pvt1 oncogene (non-protein coding) | F: ggaggctgaggagttcactg R: ggggcagagatgaaatcgta |
0.01 |
| RGS10 (NM_002925) | regulator of G-protein signaling 10 | F: tctcggctcaacgagaagat R: cagtttgagcatcaggcaaa |
0.02 |
| SGEF (NM_015595) | Src homology 3 domain-containing guanine nucleotide exchange factor | F: agagaatgggacgcttgcta R: tggcaagcttaaaggcaagt |
0.0082 |
| SIM2 (NM_005069) | single-minded homolog 2 | F: cttccctctggactctcacg R: aggctgtgcctagcagtgtt |
0.004 |
qRT-PCR validation of mRNA expression levels of individual genes (AMACR, BICD1, C10orf137, CDC2L6, ICA1, KIAA1661, MAP7, MYO6, OR51E2, PAICS, PCSK6, PVT1, RGS10, SGEF and SIM2) was performed using the TaqMan® gene expression assay. From a total of 23 genes tested, only the 15 genes that were significantly overexpressed (P<.05) in 7 PCa compared to 8 normal prostate specimens are shown here. Statistical analysis showed that these genes are overexpressed in PCa over Normal prostate tissue.
Detection of auto-antibodies to SIM2 in sera from PCa patients
Patients and sera
Serum samples were collected at Harvard University and University of Michigan patient accrual sites. All patients were over the age of 40 and were seen at the clinic because of PSA value exceeding 2.5 ng/ml, abnormal DRE, rising PSA, or lower PSA with risk factors such as family history. The study also includes men who have had previous biopsies that have not been positive for cancer. After enrollment and blood collection, all patients get a prostate biopsy to determine the presence or absence of cancer.
Cloning and in vitro cell-free expression of SIM2
Full length human SIM2 cDNA in a pCR-BLUNT2-topo plasmid was amplified using two rounds of PCR. The PCR product was cloned into pDONR plasmid to produce entry clones of each cDNA. Entry clones (130ng) were used to produce expression clones using pCITE-GST expression vector (130ng), LR clonase II enzyme mix (2μl), and TE with a total volume of 10μl. The SIM2 protein was produced as GST recombinant proteins with GST at the c-terminus. A GST control vector from which only GST is expressed served as a negative control for serum antibodies binding. The kozak sequence was introduced into the original pDEST15 5′ of GST so that it can be used in the mammalian cell free system.
Detection of serum autoanti-SIM2 antibodies by ELISA
GST pre-coated ELISA plates (GE Biosciences) were blocked overnight with 5% milk and 0.2% Tween20. The SIM2 protein was expressed using rabbit reticulocyte lysate cell free expression system (Promega) according to the manufacturer’s instructions. The expressed protein was transferred to the ELISA plate and bound overnight at 4°C. The plates were washed, incubated with serum diluted 1:300 in blocking buffer for 1hr, followed by incubation for 1hr with horseradish peroxidase linked antihuman antibodies. 100μl of the substrate (SuperSignal ELISA Femto Maximum Sensitivity Substrate; Pierce) were added to each well and the luminescence signal read using Victor3 ELISA reader. Each serum sample was screened in duplicates. The plate also included a secondary antibody negative control and a GST control.
Prediction of HLA-A2.1-restricted epitopes from SIM2
To predict potential nonamer epitopes that bind HLA-A*0201, the most frequent haplotype in Caucasians, SIM2 protein sequence (SIM2_HUMAN, Q14190) was processed using BIMAS(http://www-bimas.cit.nih.gov/molbio/hla_bind/) and SYFPEITHI (http://www.syfpeithi.de/), as well as MHCPred (http://www.jenner.ac.uk/MHCPred/), RankPep (http://bio.dfci.harvard.edu/Tools/rankpep.html), NetMHC (http://www.cbs.dtu.dk/services/NetMHC/), PREDEP (http://margalit.huji.ac.il/Teppred/mhc-bind/index.html), ProPred-I (http://www.imtech.res.in/raghava/propred1/), and MAPPP (http://www.mpiib-berlin.mpg.de/MAPPP/binding.html). Only epitopes that were predicted by most algorithms were selected for further testing.
Measurement of peptide/HLA-A*0201 binding and stability
MHC stabilization assay using T2 cells was used to assess binding of peptides to the HLA-A2.1 complex. Briefly, T2 cells were cultured for 6 hours in serum-free IMDM (ATCC) prior to the addition of candidate peptides at a concentration of 50μg/250×103 cells/ml and further overnight incubation at 37°C. Cells were washed and surface HLA-A2.1 molecules were stained with FITC mouse anti-Human HLA-A2 mAb (clone BB7.2, Mouse IgG2b κ, BD Pharmingen) for 1h at 4°C. Cells were then washed three times with PBS and analyzed by flow cytometry. A negative control (15) peptide (NEG) and the Flu matrix peptide M1 binder peptide (16) served as controls. The relative binding affinity of a given peptide was calculated as MFI(peptide)/MFI(negative peptide). Only relative binding affinities of 1.5 or higher were considered for further testing.
T2 cells were incubated overnight with 50 μg/ml of each candidate peptide at 37°C in serum free IMDM medium. Cells were then incubated with Brefeldin A (Sigma, St. Louis, MO) at 10 μg/ml for 1 h, washed, incubated at 37°C for 0, 2, 4 or 6 h in the presence of Brefeldin A (50 ng/ml). Cells were then stained with BB7.2 mAb. For each time point, peptide induced HLA-A*0201 expression was calculated as: mean fluorescence of peptide-loaded T2 cells–mean fluorescence of negative peptide-loaded T2 cells. The rate of dissociation is reflected by the loss of A2.1 expression over time.
Generation of SIM2-specific CTL in HHD mice
Ten to 12-week old male HHD mice were injected subcutaneously at the basis of the tail with 100μg of each candidate peptide emulsified in 50 μl of Incomplete Freund’s Adjuvant (IFA) and 50 μl PBSin the presence of 150 μg of the I-Ab restricted HBVcore128–140 T helper epitope (TPPAYRPPNAPIL) (17). Ten to 12 days post-immunization, spleens were harvested and splenocytes tested for peptide-induced specific release of IFN-γ by ELISPOT.
ELISPOT assay
96-well Millipore IP plates were coated with 100 μl/well mouse IFN-γ specific capture mAb (AN18, Mabtech Inc., Mariemont, OH) at concentration of 10μg/ml in PBS overnight at 4°C. Wells were washed with PBS and saturated with RPMI/10% FCS for 1 h at 37°C. A total of 2.5×10⁵ splenocytes were seeded in each well in four replicates and 5×10⁴ peptide-loaded (10μg peptide/ml, for 2h at 37C) splenocytes pretreated with 50μg/ml Mitomycin C for 1h were added to each well. Plates were incubated for 1-2 days at 37°C in 5% CO2, washed 5 times with PBS, and then incubated with 1μg/ml of biotinylated rat anti-mouse IFN-γ mAb (R4-6A2, Mabtech Inc.) for 24 hours at 4°C or at room temperature for 2 hours. The wells were washed and 100ul of diluted alkaline phosphatase-conjugated streptavidin were added for 1h at room temperature.
Spots were developed by adding peroxidase substrates (5-bromo-4,3-indolyl phosphate and nitroblue tetrazolium) and counted using the ELR04 AID EliSpot Reader System (Autoimmun Diagnostika GmbH , Straßberg, Germany).
Statistical analysis
Gene expression array data were analyzed as described under Materials and Methods. Group differences for gene expression (RT-PCR), autoantibody (ELISA), and IFN-γ (ELISPOT) data were analyzed using the Student’s t test. P values equal to or below .05 were considered significant.
Results
Identification of novel prostate tumor-associated antigens using gene expression profiling
In an effort to identify novel putative prostate cancer tumor-associated antigens with expression specificity for prostate cancer over normal prostate or normal non-prostate tissue,, we performed a genome-wide gene expression analysis of a prostate cancer and normal prostate microarray generated in our laboratory, validated the candidate TAA’s in an external, published prostate cancer tissue array data set, and then excluded those with detectable expression in non-prostatic adult tissues (Figure 1). First, we used the Affymetrix U133 array (Plus 2.0 chip) to evaluate gene expression in cancer and normal fresh-frozen prostate tissue specimens from our tissue repository. The class comparison analysis on the basis of LCB(1.2) and mean difference in absolute intensity >40 identified 1063 genes overexpressed in prostate cancer compared to normal prostate. The heat map of top 100 genes is shown in Figure 1A. Examples of the top 100 genes include AMACR, ERG, MMP26, THBS4 and FOXD1. (Table S1). Next, we validated the 1063 putative TAA and conducted a comprehensive analysis of microarray data from a previously published data set which included 41 normal and 62 neoplastic prostate tissues (3). We looked at the genes that are significantly overexpressed in PCa for their potential to be used as biomarkers or targets for immunotherapy. A list of 426 prostate cancer upregulated genes was obtained on the basis of the Fold change (>0.5) and FDR value <0.05 after preprocessing and normalizing data (Z transformation). Validation of genes that were overexpressed in prostate cancer in our data set by comparison to the Stanford prostate cancer array dataset implicated 195 transcripts with concordant over-expression between the array datasets. To identify prostate cancer TAA with the greatest specificity for prostate cancer, we then sought to exclude, by in silico analysis, those genes that are detectable in non-prostate normal human adult male tissues. For this purpose, gene expression data for various human tissues were obtained from the two studies conducted by Su et al (18) and Ge et al (19), and genes that were annotated absent on the basis of MAS5 calls in all the normal tissues except prostate were considered as prostate specific genes. The comprehensive analysis led the identification of 26 transcripts that are over expressed in the prostate cancer and are highly tissue restricted (Figure 1B). These transcripts correspond to 23 genes (listed in Table S2) that include SIM2. The analysis also identified 17 more genes that are present in the prostate and absent in the rest of the normal tissues (Table S3).
Figure 1. Identification of novel putative prostate tumor-associated antigens by gene expression profiling.
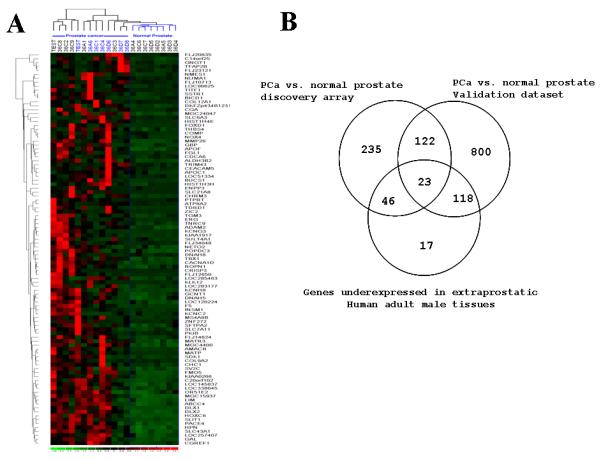
A. Hierarchical clustering analysis of 14 PCa tumor samples and 8 normal prostate samples. The top 100 genes that are overexpressed in PCa compared to normal are shown here. B. Venn Diagram highlighting the genes overexpressed in PCa in our data set and in the Stanford data set, and those underexpressed in extraprostatic Human adult male tissues as deduced from the Novartis Gene Expression Atlas.
We then performed quantitative qRT-PCR targeting each of the 23 candidate antigens, and confirmed that 15 (AMACR, BICD1, C10orf137, CDC2L6, ICA1, KIAA1661, MAP7, MYO6, OR51E2, PAICS, PCSK6, PVT1, RGS10, SGEF and SIM2) were overexpressed in prostate cancer (Table 1 and Supplementary Figure 1). Frequency of overexpression in prostate cancer for these antigens ranged from 57 % to 86%. From among these 15 prostate cancer-specific antigens that were validated by qRT-PCR, we selected the gene that was most consistently absent in normal prostate and had the highest frequency of expression in prostate cancer (Supplementary Figure 1), the single-minded homolog gene (SIM2), that we found overexpressed in 6 of 7 cancers we tested but not in benign prostate tissue, for further study as a potential prostate cancer-associated antigen and target for immunotherapy. This selection of SIM2 is also supported by a previous work that reported upregulation of SIM2 expression in PCa (20).
SIM2 induces spontaneous humoral responses in PCa patients
There is accumulating evidence suggesting that the immune system is able to mount aberrant immune responses against self antigens expressed by tumor cells in various cancers (21, 22). The presence of autoantibodies against specific self antigens has been found to correlate with clinical responses to immunotherapy in human cancer (23, 24). On this basis, antigens triggering autoantibodies may be suitable targets for active immunotherapy treatment strategies. Numerous tumor antigens that are currently targeted for therapy have been identified through detection of the patient’s own anti-TAA antibodies (25, 26) or T cells (22, 27). To test whether sera from healthy individuals and PCa patients harbor antibodies to SIM2, we used an ELISA system with in vitro expressed GST-tagged SIM2 for capture. This ELISA is single-antigen adaptation of the Nucleic Acid-Programmable Protein Array (NAPPA), which consists of cDNA vectors coupled with a capture antibody, and could be advantageous over traditional protein arrays in that proteins do not have to be purified. Significant levels of autoantibody from patient sera with specific binding to SIM2 (P <.01) was detected in 2 of 5 evaluated prostate cancer samples. In contrast, auto-antibodies to SIM2 were not detectable in any of the nine control patients’ sera (Figure 2).
Figure 2. SIM2 elicits spontaneous humoral responses in PCa patients.

Sera from 9 PCa patients and 5 healthy donors were subjected to an in vitro, cell-free protein expression-based ELISA to detect auto-antibodies to SIM2. SIM2 was expressed as a GST-tagged protein and an anti-GST-coated plate was used in the assay. Serum antibodies that bound to immobilized SIM2 were detected using a labeled anti-human antibody. In each assay, wells containing a GST-expressing vector were used as a negative control. Signals obtained from GST wells were substracted from those obtained from wells that contained GST-SIM2. Three experiments were performed, with triplicate wells for each serum sample per experiment. Statistics were performed on the triplicates’ mean and SD, and antibody amounts are plotted here as the difference of OD signals produced by GST-SIM2 and GST alone. ** P<.01.
Identification of SIM2-derived, HLA-A2.1–restricted CTL epitopes
Prompted by the stringent specific expression of SIM2 in healthy adult tissues, its overexpression in PCa, and its ability to induce humoral responses in PCa patients, we sought to identify potential HLA-A2.1-restricted, SIM2-derived epitopes that could be used as vaccines to generate SIM2-specific cytotoxic lymphocytes directed against prostate tumors.
To predict potential SIM2-derived, HLA-A*0201-binding epitopes, SIM2 full protein sequence was screened using the 8 algorithms. Out of all possible nonamer motifs, 15 epitopes which had the highest cumulative prediction scores were selected for further evaluation in vitro and in vivo (Table 2).
Table 2.
Identification of SIM2-derived HLA-A2.1-binding epitopes.
| Epitope | Sequence | SYFPEITHI score |
Binding (FI) |
|---|---|---|---|
| SIM2(25) | KLLPLPSAI | 25 | 3.22 |
| SIM2(84) | LLQTLDGFV | 23 | 1.88 |
| SIM2(87) | TLDGFVFVV | 27 | 5.43 |
| SIM2(167) | VLAKRNAGL | 26 | 0.82 |
| SIM2(174) | GLTCSGYKV | 23 | 1.1 |
| SIM2(199) | SLYDSCYQI | 23 | 4.39 |
| SIM2(205) | YQIVGLVAV | 23 | 3.82 |
| SIM2(237) | SLDLKLIFL | 27 | 1.7 |
| SIM2(241) | KLIFLDSRV | 23 | 2 |
| SIM2(244) | FLDSRVTEV | 27 | 4.75 |
| SIM2(339) | ELQLSLEQV | 21 | 1.28 |
| SIM2(430) | LLYTPSYSL | 27 | 2.61 |
| SIM2(527) | GSGLLVGKV | 18 | 0.82 |
| SIM2(530) | LLVGKVGGL | 30 | 0.97 |
| SIM2(558) | SRFGQTCPL | 17 | 0.88 |
| flu-M1 | GILGFVFTL | 30 | 3.17 |
| NEG | IAGNSAYEY | 9 | 1 |
Prediction algorithms were used to predict SIM2-derived, HLA-A2.1-binding epitopes. Also shown are peptides scores predicted by the algorithm SYFPEITHI. Binding of predicted peptides to HLA-A2.1 was assessed using the assembly assay on T2 cells in vitro. Out of the 15 peptides we tested, 9 showed binding ability, as compared to a non-binding peptide (NEG).
After predictions were performed, we ascertained epitope homology between mouse and human to ensure that we are testing tolerant motifs relevant in both hosts. A BLAST sequence analysis revealed that these 5 human immunogenic epitopes are 100% identical to their corresponding murine orthologs and are not present in any other known protein sequences in humans or mice, with the exception of SIM2(241) which is also present in SIM1.
Binding to HLA-A2.1 molecules was assessed using T2 assembly assay, which is based on the ability to stabilize MHC class I molecules from the T2 cell line by the addition of suitable peptides. This peptide-HLA binding screen revealed 9 SIM2 peptides that were able to stabilize HLA-A2.1 molecules, resulting in increased detection of surface A2.1 molecules with a specific monoclonal antibody (Figure 3A). Peptide-HLA dissociation rate correlated with time and showed weak stabilizing epitopes (epitopes 84, 199, 237 and 430) and strong stabilizing epitopes (epitopes 87, 205, 241 and 244). However, epitopes with a high dissociation rate (weak stabilizers) still showed a slight binding that was above the nonbinding control epitope even after 8h of incubation.
Figure 3. SIM2 harbors HLA-A2.1-restricted immunogenic epitopes.

A. The binding to and rate of dissociation of peptides from HLA-A2.1 was determined by monitoring the decrease in HLA-A2.1 expression over time after incubation with binder peptides. B. Immunization of A2.1 transgenic HHD mice with the 9 binding peptides revealed 5 immunogenic SIM2 peptides as demonstrated by an IFN-γ ELISPOT assay. ** P<.01; *** P<.001.
These 9 binding epitopes were then tested for their capacity to elicit in vivo CTL responses in transgenic HHD mice. Mice were immunized with a mixture of candidate epitopes and a helper MHC II-restricted peptide, splenocytes restimulated 12 days later in vitro with peptide-loaded APC and subjected to an IFN-γ ELISPOT assay (Figure 3B).
We found that in vitro restimulation with SIM2(87) (TLDGFVFVV), SIM2(205) (YQIVGLVAV), SIM2(237) (SLDLKLIFL), SIM2(241) (KLIFLDSRV) and SIM2 (244) (FLDSRVTEV) induced significantly (P<.01 for SIM2(87) and P<.001 for other epitopes) higher numbers of splenocytes to release IFN-γ in a peptide-specific manner in an ELISPOT assay (Figure 3B). This provides evidence that tolerance to SIM2 is circumvented through immunization of mice to these epitopes since SIM2 (and SIM1) is also expressed in other non-prostatic tissues in mice. Interestingly, SIM2(25) and SIM2(199) were not immunogenic despite their ability to strongly bind to A2.1.
Discussion
Previous genome-wide expression profiling studies for prostate cancer aimed at identifying genes that are over-expressed in prostate tumors regardless of their levels of gene expression in normal prostate and other adult tissues. The relationship of prostatic gene expression to expression of such genes in nonprostatic tissues has previously only been addressed in normal prostate, and not prostate cancer (7).
In the present study, we undertook a multi-step strategy that combined gene expression profiling of malignant and benign human prostate tissues and in silico analysis of microarray data sets to identify novel prostate TAA. Our analysis focused on antigens that are overexpressed in PCa but are not or are weakly expressed in non-prostatic healthy adult male tissues. This innovative approach is undertaken to minimize the possibility of unwanted collateral autoimmune responses against non-prostate normal tissues, and to optimize the possibility of attenuating auto-antigen tolerance by prostatic manipulation (e.g. hormonal or ablative). This strategy has led to the identification of 23 potential TAA, among which 15 were validated by qRT-PCR. While 4 of these TAA (AMACR (28), MYO6 (29), OR51E2 (PSGR) (30) and SIM2 (20)) have been previously reported to be associated with prostate cancer, the remaining 11 (BICD1, C10orf137, CDC2L6, ICA1, KIAA1661, MAP7, PAICS, PCSK6, PVT1, RGS10 and SGEF) have not. These 11 novel TAA represent a significant addition to the prostate TAA repertoire and warrant further investigation of their implication in PCa cancer biology.
Interestingly, our data revealed the presence of anti-SIM2 autoantibodies in sera from a fraction of PCa patients. It is well documented that PCa patients’ immune system can mount antibody responses to prostate TAA (26) as well as to ubiquitous antigens such as the androgen receptor (31) and cellular proteins p90 and p62 (32). The presence of antibodies to TAA in PCa patients’ sera is indicative of a humoral immune response against these TAA, and results from a well orchestrated response where an antigen-specific CD4 response is indispensable. This same CD4 response is a prerequisite for the immune system to mount a proper CTL response to a given antigen. In fact, previous studies have demonstrated a close correlation between serum antibodies to TAA , and both CD4 and CD8 T-cell responses in vivo (33, 34). Therefore, we assumed that a SIM2-derived, MHC-I-restricted peptide-based vaccine would lead to an optimal response in PCa patients.
Single-minded homolog 2 (SIM2) is a member of the basic helix-loop-helix per-Arnt-Sim (bHLH-PAS) family of transcription factors (35). It is mainly known as a contributing factor to Down’s syndrome (36). SIM2 expression persists through adulthood in muscle and kidney (37) where its function remains to be elucidated. A prior in silico approach using the Cancer Genome Anatomy Project (CGAP) database of the National Cancer Institute (NCI) identified SIM2 as associated with colon, pancreas and prostate carcinomas, while absent in the corresponding normal tissues (38). Both spliced isoforms of SIM2 transcript, SIM2-long (SIM2-l) and SIM2-short (SIM2-s), have been reported to be overexpressed in cancer (38). However, a biological role of SIM2 in cancer has not emerged yet, as it has been attributed suppressive and oncogenic properties that depend on the type of cancer (39, 40).
Vaccines designed to eradicate tumors by triggering immune responses against tumor-associated antigens represent a tempting therapeutic modality. However, developing successful vaccines is hampered by the lack of highly specific tumor-derived antigens, immune tolerance, and undesired autoimmune responses.
Peptide-based cancer vaccines were among the first defined vaccines demonstrating both protective and therapeutic efficacy in animal models and currently represent the majority of clinical trials of cancer immunotherapy (41, 42). This is attributed to the well recognized requirement of T-lymphocytes, especially Cytotoxic T-lymphocytes, for the eradication of solid tumors as they represent the primary effector cells involved in tumor-specific immunity. Peptide-based vaccines offer considerable advantages over other vaccine formulations, namely the absence of infectious material, the easy characterization and purification, the absence of risk of restored virulence or genetic integration, possibility of sequence modification, better storage and lower cost (reviewed in reference (41)). In PCa, several TAA-derived, HLA-restricted peptide-based vaccines have been tested clinically (Reviewed in Reference(43)). Hence, peptides derived from multiple TAA were administered to HRPC patients and induced increased numbers of specific CD8 T cells(44). Similarly, promising clinical trials were performed that tested a vaccine formulation based on dendritic cells loaded with peptides derived from PSMA (45, 46), hTERT (47), or from a combination of two or more TAA (PSA, PSMA, survivin, prostein, and trp-p8, PAP, PSCA) (48-50).
Because both SIM2-l and SIM2-s isoforms are expressed in PCa tumors, we processed both protein sequences using various algorithms to predict potential HLA-A2.1-binding nonamer epitopes. Interestingly, all epitopes that were predicted with high scores are common to both isoforms, suggesting that these epitopes could theoretically be used as targets on prostate tumors regardless of the type of isoform they express. We used a panel of 8 prediction algorithms that culminated in a selection of 15 candidate epitopes, among which 9 showed significant binding to A2.1 molecules in the T2 cell assay, and 5 out of these induced specific in vivo CD8 responses in A2.1 transgenic HHD mice as evidenced by their ability to trigger IFN-γ release by CD8 T cells upon restimulation. Although prior studies have shown that SIM2 expression can be detected by RT-PCR in some normal tissues such as normal adult kidney, the level of SIM2 expression in such non-cancer tissues is apparently low enough such that tolerance to SIM2 can be readily overcome via immunization with class I MHC-restricted SIM2 peptides as we have demonstrated here, and below the level of detection of microarray platforms that have been used to catalogue normal human tissue gene expression (18,19). Accordingly, human trials would need to carefully monitor subjects for possible nephritis or other autoimmune responses. Whether the other 14 putative prostatic TAA’s have lower levels of normal tissue expression than SIM2 will require validation assays other than the microarray platform results (18,19) that we interrogated to identify genes having low or absent expression in non-prostate adult tissue.
Collectively, our data showing overexpression of SIM2 in malignant prostate tissue, combined to the identification of humoral responses to SIM2 in PCa patients’ sera and the ability of SIM2-derived peptides to induce HLA-A2.1-restricted cellular immune responses in humanized A2.1 transgenic mice, implicate SIM2 as a potential novel TAA target for prostate cancer immunotherapy.
Supplementary Material
Supplementary Figure 1: Validation of 15 novel prostate TAA by qRT-PCR. qRT-PCR validation of mRNA expression levels of individual genes (AMACR, BICD1, C10orf137, CDC2L6, ICA1, KIAA1661, MAP7, MYO6, OR51E2, PAICS, PCSK6, PVT1, RGS10, SGEF and SIM2) was performed by two-step real-time RT-PCR analysis on Applied Biosystems 7900HT Prism instrument.. From a total of 23 genes tested, only the 15 genes that were significantly overexpressed (P<.05) in 7 PCa compared to 8 normal prostate specimens are shown here.
Translational Relevance.
We sought to identify novel targets for prostate cancer detection and therapy. Toward this objective, we used fresh-frozen prostatectomy specimens to generate new prostate cancer gene expression arrays, and interrogated the expressed gene profile against gene expression of normal human adult tissue in silico to identify genes expressed in prostate cancer but not in non-prostatic normal human tissues. This novel strategy identified 15 genes that are abundant in prostate cancer and not in other adult human male tissue. Proof of principle that these are rational targets for prostate cancer detection or therapy was shown for the transcription factor SIM2, for which we showed that some prostate cancer patients have intrinsic immune response as evidenced by autoantibodies to SIM2 in patient sera, and that human HLA-A2.1-restricted, cytotoxic T cell responses can be induced against SIM2 epitopes in vivo in HLA-A2.1 transgenic mice. Our findings identify peptide epitopes of SIM2 that may serve as prostate cancer immunotherapy targets in future clinical trials.
Acknowledgments
This work is supported by NIH-NCI Early Detection Research Network grant UO1-CA11391 (Sanda), NCI prostate SPORE career development award (Arredouani), a Prostate Cancer Foundation Young Investigator Award (Arredouani), and the Hershey family Foundation Prostate Cancer Tissue Bank.
References
- 1.Dhanasekaran SM, Barrette TR, Ghosh D, et al. Delineation of prognostic biomarkers in prostate cancer. Nature. 2001;412:822–6. doi: 10.1038/35090585. [DOI] [PubMed] [Google Scholar]
- 2.Yu YP, Landsittel D, Jing L, et al. Gene expression alterations in prostate cancer predicting tumor aggression and preceding development of malignancy. J Clin Oncol. 2004;22:2790–9. doi: 10.1200/JCO.2004.05.158. [DOI] [PubMed] [Google Scholar]
- 3.Lapointe J, Li C, Higgins JP, et al. Gene expression profiling identifies clinically relevant subtypes of prostate cancer. Proc Natl Acad Sci U S A. 2004;101:811–6. doi: 10.1073/pnas.0304146101. [DOI] [PMC free article] [PubMed] [Google Scholar]
- 4.Holzbeierlein J, Lal P, LaTulippe E, et al. Gene expression analysis of human prostate carcinoma during hormonal therapy identifies androgen-responsive genes and mechanisms of therapy resistance. Am J Pathol. 2004;164:217–27. doi: 10.1016/S0002-9440(10)63112-4. [DOI] [PMC free article] [PubMed] [Google Scholar]
- 5.Welsh JB, Sapinoso LM, Su AI, et al. Analysis of gene expression identifies candidate markers and pharmacological targets in prostate cancer. Cancer Res. 2001;61:5974–8. [PubMed] [Google Scholar]
- 6.Tomlins SA, Rhodes DR, Perner S, et al. Recurrent fusion of TMPRSS2 and ETS transcription factor genes in prostate cancer. Science. 2005;310:644–8. doi: 10.1126/science.1117679. [DOI] [PubMed] [Google Scholar]
- 7.Lin B, Ferguson C, White JT, et al. Prostate-localized and androgen-regulated expression of the membrane-bound serine protease TMPRSS2. Cancer Res. 1999;59:4180–4. [PubMed] [Google Scholar]
- 8.Stevanovic S. Identification of tumour-associated T-cell epitopes for vaccine development. Nat Rev Cancer. 2002;2:514–20. doi: 10.1038/nrc841. [DOI] [PubMed] [Google Scholar]
- 9.Kaufman HL, Wang W, Manola J, et al. Phase II randomized study of vaccine treatment of advanced prostate cancer (E7897): a trial of the Eastern Cooperative Oncology Group. J Clin Oncol. 2004;22:2122–32. doi: 10.1200/JCO.2004.08.083. [DOI] [PubMed] [Google Scholar]
- 10.Small EJ, Schellhammer PF, Higano CS, et al. Placebo-controlled phase III trial of immunologic therapy with sipuleucel-T (APC8015) in patients with metastatic, asymptomatic hormone refractory prostate cancer. J Clin Oncol. 2006;24:3089–94. doi: 10.1200/JCO.2005.04.5252. [DOI] [PubMed] [Google Scholar]
- 11.Pascolo S, Bervas N, Ure JM, Smith AG, Lemonnier FA, Perarnau B. HLA-A2.1-restricted education and cytolytic activity of CD8(+) T lymphocytes from beta2 microglobulin (beta2m) HLA-A2.1 monochain transgenic H-2Db beta2m double knockout mice. J Exp Med. 1997;185:2043–51. doi: 10.1084/jem.185.12.2043. [DOI] [PMC free article] [PubMed] [Google Scholar]
- 12.Li C, Wong WH. Model-based analysis of oligonucleotide arrays: expression index computation and outlier detection. Proc Natl Acad Sci U S A. 2001;98:31–6. doi: 10.1073/pnas.011404098. [DOI] [PMC free article] [PubMed] [Google Scholar]
- 13.Ramalho-Santos M, Yoon S, Matsuzaki Y, Mulligan RC, Melton DA. “Stemness”: transcriptional profiling of embryonic and adult stem cells. Science. 2002;298:597–600. doi: 10.1126/science.1072530. [DOI] [PubMed] [Google Scholar]
- 14.Haram KM, Peltier HJ, Lu B, et al. Gene expression profile of mouse prostate tumors reveals dysregulations in major biological processes and identifies potential murine targets for preclinical development of human prostate cancer therapy. Prostate. 2008;68:1517–30. doi: 10.1002/pros.20803. [DOI] [PubMed] [Google Scholar]
- 15.Bhasin M, Singh H, Raghava GP. MHCBN: a comprehensive database of MHC binding and non-binding peptides. Bioinformatics. 2003;19:665–6. doi: 10.1093/bioinformatics/btg055. [DOI] [PubMed] [Google Scholar]
- 16.Micheletti F, Monini P, Fortini C, et al. Identification of cytotoxic T lymphocyte epitopes of human herpesvirus 8. Immunology. 2002;106:395–403. doi: 10.1046/j.1365-2567.2002.01424.x. [DOI] [PMC free article] [PubMed] [Google Scholar]
- 17.Firat H, Garcia-Pons F, Tourdot S, et al. H-2 class I knockout, HLA-A2.1-transgenic mice: a versatile animal model for preclinical evaluation of antitumor immunotherapeutic strategies. Eur J Immunol. 1999;29:3112–21. doi: 10.1002/(SICI)1521-4141(199910)29:10<3112::AID-IMMU3112>3.0.CO;2-Q. [DOI] [PubMed] [Google Scholar]
- 18.Su AI, Wiltshire T, Batalov S, et al. A gene atlas of the mouse and human protein-encoding transcriptomes. Proc Natl Acad Sci U S A. 2004;101:6062–7. doi: 10.1073/pnas.0400782101. [DOI] [PMC free article] [PubMed] [Google Scholar]
- 19.Ge X, Yamamoto S, Tsutsumi S, et al. Interpreting expression profiles of cancers by genome-wide survey of breadth of expression in normal tissues. Genomics. 2005;86:127–41. doi: 10.1016/j.ygeno.2005.04.008. [DOI] [PubMed] [Google Scholar]
- 20.Halvorsen OJ, Rostad K, Oyan AM, et al. Increased expression of SIM2-s protein is a novel marker of aggressive prostate cancer. Clin Cancer Res. 2007;13:892–7. doi: 10.1158/1078-0432.CCR-06-1207. [DOI] [PubMed] [Google Scholar]
- 21.Koziol JA, Zhang JY, Casiano CA, et al. Recursive partitioning as an approach to selection of immune markers for tumor diagnosis. Clin Cancer Res. 2003;9:5120–6. [PubMed] [Google Scholar]
- 22.Tan EM. Autoantibodies as reporters identifying aberrant cellular mechanisms in tumorigenesis. J Clin Invest. 2001;108:1411–5. doi: 10.1172/JCI14451. [DOI] [PMC free article] [PubMed] [Google Scholar]
- 23.Sittler T, Zhou J, Park J, et al. Concerted potent humoral immune responses to autoantigens are associated with tumor destruction and favorable clinical outcomes without autoimmunity. Clin Cancer Res. 2008;14:3896–905. doi: 10.1158/1078-0432.CCR-07-4782. [DOI] [PubMed] [Google Scholar]
- 24.Homma S, Sagawa Y, Ito M, Ohno T, Toda G. Cancer immunotherapy using dendritic/tumour-fusion vaccine induces elevation of serum anti-nuclear antibody with better clinical responses. Clin Exp Immunol. 2006;144:41–7. doi: 10.1111/j.1365-2249.2006.03029.x. [DOI] [PMC free article] [PubMed] [Google Scholar]
- 25.Miller JC, Zhou H, Kwekel J, et al. Antibody microarray profiling of human prostate cancer sera: antibody screening and identification of potential biomarkers. Proteomics. 2003;3:56–63. doi: 10.1002/pmic.200390009. [DOI] [PubMed] [Google Scholar]
- 26.Wang X, Yu J, Sreekumar A, et al. Autoantibody signatures in prostate cancer. N Engl J Med. 2005;353:1224–35. doi: 10.1056/NEJMoa051931. [DOI] [PubMed] [Google Scholar]
- 27.Lee SY, Obata Y, Yoshida M, et al. Immunomic analysis of human sarcoma. Proc Natl Acad Sci U S A. 2003;100:2651–6. doi: 10.1073/pnas.0437972100. [DOI] [PMC free article] [PubMed] [Google Scholar]
- 28.Rhodes DR, Barrette TR, Rubin MA, Ghosh D, Chinnaiyan AM. Meta-analysis of microarrays: interstudy validation of gene expression profiles reveals pathway dysregulation in prostate cancer. Cancer Res. 2002;62:4427–33. [PubMed] [Google Scholar]
- 29.Wei S, Dunn TA, Isaacs WB, De Marzo AM, Luo J. GOLPH2 and MYO6: putative prostate cancer markers localized to the Golgi apparatus. Prostate. 2008;68:1387–95. doi: 10.1002/pros.20806. [DOI] [PMC free article] [PubMed] [Google Scholar]
- 30.Xu LL, Stackhouse BG, Florence K, et al. PSGR, a novel prostate-specific gene with homology to a G protein-coupled receptor, is overexpressed in prostate cancer. Cancer Res. 2000;60:6568–72. [PubMed] [Google Scholar]
- 31.Olson BM, McNeel DG. Antibody and T-cell responses specific for the androgen receptor in patients with prostate cancer. Prostate. 2007;67:1729–39. doi: 10.1002/pros.20652. [DOI] [PubMed] [Google Scholar]
- 32.Shi FD, Zhang JY, Liu D, et al. Preferential humoral immune response in prostate cancer to cellular proteins p90 and p62 in a panel of tumor-associated antigens. Prostate. 2005;63:252–8. doi: 10.1002/pros.20181. [DOI] [PubMed] [Google Scholar]
- 33.Jager E, Gnjatic S, Nagata Y, et al. Induction of primary NY-ESO-1 immunity: CD8+ T lymphocyte and antibody responses in peptide-vaccinated patients with NY-ESO-1+ cancers. Proc Natl Acad Sci U S A. 2000;97:12198–203. doi: 10.1073/pnas.220413497. [DOI] [PMC free article] [PubMed] [Google Scholar]
- 34.Jager E, Nagata Y, Gnjatic S, et al. Monitoring CD8 T cell responses to NY-ESO-1: correlation of humoral and cellular immune responses. Proc Natl Acad Sci U S A. 2000;97:4760–5. doi: 10.1073/pnas.97.9.4760. [DOI] [PMC free article] [PubMed] [Google Scholar]
- 35.Moffett P, Pelletier J. Different transcriptional properties of mSim-1 and mSim-2. FEBS Lett. 2000;466:80–6. doi: 10.1016/s0014-5793(99)01750-0. [DOI] [PubMed] [Google Scholar]
- 36.Ema M, Ikegami S, Hosoya T, et al. Mild impairment of learning and memory in mice overexpressing the mSim2 gene located on chromosome 16: an animal model of Down’s syndrome. Hum Mol Genet. 1999;8:1409–15. doi: 10.1093/hmg/8.8.1409. [DOI] [PubMed] [Google Scholar]
- 37.Woods S, Farrall A, Procko C, Whitelaw ML. The bHLH/Per-Arnt-Sim transcription factor SIM2 regulates muscle transcript myomesin2 via a novel, non-canonical E-box sequence. Nucleic Acids Res. 2008;36:3716–27. doi: 10.1093/nar/gkn247. [DOI] [PMC free article] [PubMed] [Google Scholar]
- 38.Deyoung MP, Scheurle D, Damania H, Zylberberg C, Narayanan R. Down’s syndrome-associated single minded gene as a novel tumor marker. Anticancer Res. 2002;22:3149–57. [PubMed] [Google Scholar]
- 39.Kwak HI, Gustafson T, Metz RP, Laffin B, Schedin P, Porter WW. Inhibition of breast cancer growth and invasion by single-minded 2s. Carcinogenesis. 2007;28:259–66. doi: 10.1093/carcin/bgl122. [DOI] [PubMed] [Google Scholar]
- 40.Aleman MJ, DeYoung MP, Tress M, Keating P, Perry GW, Narayanan R. Inhibition of Single Minded 2 gene expression mediates tumor-selective apoptosis and differentiation in human colon cancer cells. Proc Natl Acad Sci U S A. 2005;102:12765–70. doi: 10.1073/pnas.0505484102. [DOI] [PMC free article] [PubMed] [Google Scholar]
- 41.Purcell AW, McCluskey J, Rossjohn J. More than one reason to rethink the use of peptides in vaccine design. Nat Rev Drug Discov. 2007;6:404–14. doi: 10.1038/nrd2224. [DOI] [PubMed] [Google Scholar]
- 42.Kanodia S, Kast WM. Peptide-based vaccines for cancer: realizing their potential. Expert Rev Vaccines. 2008;7:1533–45. doi: 10.1586/14760584.7.10.1533. [DOI] [PubMed] [Google Scholar]
- 43.Kiessling A, Fussel S, Wehner R, et al. Advances in specific immunotherapy for prostate cancer. Eur Urol. 2008;53:694–708. doi: 10.1016/j.eururo.2007.11.043. [DOI] [PubMed] [Google Scholar]
- 44.Noguchi M, Itoh K, Yao A, et al. Immunological evaluation of individualized peptide vaccination with a low dose of estramustine for HLA-A24+ HRPC patients. Prostate. 2005;63:1–12. doi: 10.1002/pros.20157. [DOI] [PubMed] [Google Scholar]
- 45.Murphy G, Tjoa B, Ragde H, Kenny G, Boynton A. Phase I clinical trial: T-cell therapy for prostate cancer using autologous dendritic cells pulsed with HLA-A0201-specific peptides from prostate-specific membrane antigen. Prostate. 1996;29:371–80. doi: 10.1002/(SICI)1097-0045(199612)29:6<371::AID-PROS5>3.0.CO;2-B. [DOI] [PubMed] [Google Scholar]
- 46.Tjoa BA, Murphy GP. Progress in active specific immunotherapy of prostate cancer. Semin Surg Oncol. 2000;18:80–7. doi: 10.1002/(sici)1098-2388(200001/02)18:1<80::aid-ssu10>3.0.co;2-a. [DOI] [PubMed] [Google Scholar]
- 47.Vonderheide RH, Domchek SM, Schultze JL, et al. Vaccination of cancer patients against telomerase induces functional antitumor CD8+ T lymphocytes. Clin Cancer Res. 2004;10:828–39. doi: 10.1158/1078-0432.ccr-0620-3. [DOI] [PubMed] [Google Scholar]
- 48.Fuessel S, Meye A, Schmitz M, et al. Vaccination of hormone-refractory prostate cancer patients with peptide cocktail-loaded dendritic cells: results of a phase I clinical trial. Prostate. 2006;66:811–21. doi: 10.1002/pros.20404. [DOI] [PubMed] [Google Scholar]
- 49.Waeckerle-Men Y, Uetz-von Allmen E, Fopp M, et al. Dendritic cell-based multi-epitope immunotherapy of hormone-refractory prostate carcinoma. Cancer Immunol Immunother. 2006;55:1524–33. doi: 10.1007/s00262-006-0157-3. [DOI] [PMC free article] [PubMed] [Google Scholar]
- 50.Thomas-Kaskel AK, Zeiser R, Jochim R, et al. Vaccination of advanced prostate cancer patients with PSCA and PSA peptide-loaded dendritic cells induces DTH responses that correlate with superior overall survival. Int J Cancer. 2006;119:2428–34. doi: 10.1002/ijc.22097. [DOI] [PubMed] [Google Scholar]
Associated Data
This section collects any data citations, data availability statements, or supplementary materials included in this article.
Supplementary Materials
Supplementary Figure 1: Validation of 15 novel prostate TAA by qRT-PCR. qRT-PCR validation of mRNA expression levels of individual genes (AMACR, BICD1, C10orf137, CDC2L6, ICA1, KIAA1661, MAP7, MYO6, OR51E2, PAICS, PCSK6, PVT1, RGS10, SGEF and SIM2) was performed by two-step real-time RT-PCR analysis on Applied Biosystems 7900HT Prism instrument.. From a total of 23 genes tested, only the 15 genes that were significantly overexpressed (P<.05) in 7 PCa compared to 8 normal prostate specimens are shown here.