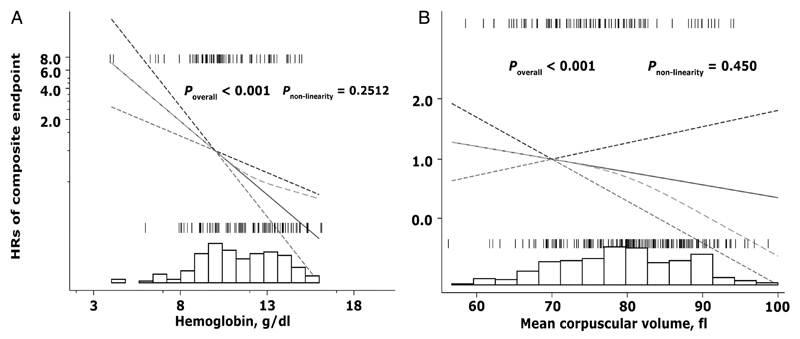
Figure 3.
Adjusted HRs for (A) haemoglobin (Hb) and (B) mean corpuscular volume (MCV) as independent predictors of composite endpoint among patients with heart failure. Results from Cox regression models showing the linear relationships of Hb and MCV with composite endpoint were overlaid on the plot of the spline model, demonstrating that the simpler parametric model adequately described the covariate effects. Dashed green lines represent the fit of the spline. Solid black lines represent the parametric Cox regression fit, while dotted lines represent pointwise 95% confidence limits for the parametric fits. All models were constrained to cross at a HR of unity. Distribution of patients across Hb and MCV are represented by underlaid histograms. Tick marks above the HR curve represent patients with composite endpoint, whereas tick marks below the curve represent patients without composite endpoint.

