

Abstract
Whether minority concentration in a neighborhood exposes residents to or protects them from health risks has generated burgeoning scholarly interests, yet endogeneity as a result of neighborhood selection largely remains unclear in the literature. This study addresses such endogeneity and simultaneously investigates the roles of co-ethnic density and immigrant enclaves in influencing high blood pressure and high cholesterol level among Latinos, the largest minority group in the United States. Pooled cross-sectional data that included both native and foreign-born Latinos of Puerto Rican, Mexican, and other origins (N=1,563) from the 2006 and 2008 Southeastern Pennsylvania Household Health Survey were linked to census-tract profiles from the 2005–2009 American Community Survey. Results from both multilevel regression and propensity score matching analysis confirmed the deleterious effect of residential co-ethnic density on Latino adults’ health risks over and above individual risk factors. We also found selection bias associated with the observed protective effect of immigrant concentration, which is likely a result of residential preference.
Keywords: Racial composition, Neighborhoods, Health, Latino, Immigrants, Sample selection, Propensity score matching
Introduction
During recent decades, the Latino population in the United States has grown rapidly and is currently the largest group of all racial/ethnic minorities. They are also projected to increase from 17.4% of total US population in 2014 to 28.6% by 2060 (Colby and Ortman 2014). Parallel to their growth, there is also evidence of rising residential segregation and co-ethnic density within Latino communities (Charles 2003). While segregation is defined as the degree to which two or more racial/ethnic groups live separately from one another in a geographically defined area (Massey and Denton 1988), co-ethnic density refers to proportions of people of the same ethnicity in such an area (White and Borrell 2011). Although Latino segregation from whites is not yet as high as black-white segregation, the 2010 census data shows that Latinos have seen persistent segregation compared to thirty years ago, and concentration among their co-ethnics has been more widespread (Logan, Fischer, and Buchmann 2013). Residential patterns also have significant implications for the overall health status of Latinos as well as the total US population (Diez Roux and Mair 2010; Gee and Payne-Sturges 2004; Williams and Collins 2001).
About half of Latino adults in the US are foreign-born (Pew Research Center 2014). Upon arrival, they are often constrained by social, cultural, or financial barriers and prefer to live in areas clustered with other immigrants, in order to seek affordable housing, familiar culture, and social networks (Iceland and Scopilliti 2008). Although immigrant enclaves may also see high co-ethnic concentration, historically, they tend to be inclusive of residents of various origins and are not homogeneous to one specific group (Williams and Collins 2001). This difference might be due to distinct mechanisms driving these two separate yet concomitant patterns. Whereas race-based residential segregation may be prompted by macro-level structural forces, immigrant enclaves could be a result of self-preference at the initial stage of immigrant’s assimilation process (Logan, Wenquan, and Alba 2002). It is thus important to distinguish co-ethnic density from immigrant concentration in researching neighborhood contexts.
Health risk factors such as high blood pressure and high cholesterol level serve as early physiological indicators for cardiovascular diseases and other health problems later in the life course. Despite their unexpected advantage in certain health indicators such as mortality, which is often referred to as the “Hispanic paradox” (González Burchard et al. 2005), health risks including high blood pressure and high cholesterol level have hit Latinos disproportionately compared to whites (Crimmins et al. 2007). There is urgent need to identify multilevel determinants of these risk factors among Latinos, yet current research attempting to disentangle the differential roles of Latino co-ethnic density and immigrant concentration has been limited. More importantly, existing work analyzing observational data to date has often ignored the endogeneity in the neighborhood–health link, making results more vulnerable in generating causal inference.
This study specifically addresses such endogeneity as a result of neighborhood selection, and simultaneously investigates the roles of co-ethnic density and immigrant enclaves in shaping health risks among Latino adults. We used a sample collected from Pennsylvania, a region that had seen drastic increase of Latino populations. During the years of 2000 and 2010, Latinos had grown 46% in the city of Philadelphia and 83% in Pennsylvania overall, and as of the year 2012 they represented 12.3% of the city of Philadelphia’s population and 5.7% of Pennsylvania’s population (City of Philadelphia 2012). By utilizing propensity score matching, we are able to analyze two comparable samples of Latinos who share similar individual characteristics that contribute to their likelihood of living in a co-ethnic or immigrant-concentrated neighborhood. This allows us to reduce neighborhood selection bias before investigating neighborhood effects. We then compare results from propensity score analysis to those obtained from multilevel regression models.
Neighborhood Racial/ethnic Contexts and Latino Health
Whether neighborhood minority concentration is protective or detrimental for minority health has spurred burgeoning scholarly interests in recent years (Becares et al. 2012; Kramer and Hogue 2009; Pickett and Wilkinson 2008). One strand of argument centers on the deleterious effects of residential segregation that persistently produce health risks as a result of area deprivation and socio-political adversities (Anderson and Fullerton 2014; Frank, Cerda, and Rendon 2007; Kershaw, Albrecht, and Carnethon 2013). The other strand points to potential benefits of residing with co-ethnics or other minorities, which may foster stronger social ties, provide health-promoting cultural and economic resources, and protect minorities from discrimination or migration-related stress (Alvarez and Levy 2012; Nobles et al. 2017; Yang, Zhao, and Song 2017). In their study of immigration concentration and neighborhood violence, Graif and Sampson (2009) pointed to the two equally important aspects associated with the immigration effects, the component of segregation and the component of diversity. Their argument provides insight into the health literature on the debate about minority concentration and health outcomes. Studying the Latino population offers a great opportunity to address this debate and to look at the effects of both co-ethnic density and immigrant concentration. On the one hand, many Latinos in the US are socioeconomically disadvantaged compared to whites and Asians, and neighborhoods concentrated with Latinos have witnessed adversities comparable to segregated black neighborhoods, (Charles 2003). On the other hand, Latinos account for the largest share of all foreign-born in the US (Colby and Ortman 2014); thus the health benefits of living in immigrant enclaves are supposed to manifest among them.
Regarding co-ethnic density, existing evidence is mixed on its impact on Latinos’ cardiovascular health risks. For example, one study in Chicago found that a higher proportion of Latinos and foreign-born individuals (combined together) in a neighborhood was associated with lower likelihood of reporting hypertension among Latinos (Viruell-Fuentes, Ponce, and Alegría 2012). But the same study also found that, among those living with hypertension, Latino- and immigrant-concentration were associated with having worse hypertension care and treatment. Since this study did not differentiate Latino density and immigrant concentration, complexities between these two neighborhood characteristics remain to be explored. Another study looking at sociocultural features of Mexican American neighborhoods in Texas applied items such as Mexican nameplates and placards in Spanish to measure the Mexican cultural environment within residential neighborhoods (Salinas et al. 2012). The authors found that persons living in neighborhoods with greater Mexican cultural environment had higher risks of having diabetes and unstable blood glucoses. Indeed, a recent review focusing on Latino density and diabetes in the US failed to find a converging pattern in this literature (Durazo, Mbassa, and Albert 2016). Theoretically, living in high Latino density areas could exert both health-promoting and health-demoting influences on cardiovascular factors such as blood pressure and cholesterol level. On the beneficial side, these communities may offer more opportunities for residents to establish ethnic social ties that help promote culturally specific resources such as ethnic grocery stores and social gatherings and activities among co-ethnic friends which can be preventive of cardiovascular risk factors. In addition, they could provide a shelter for ethnic minorities buffering against anxiety and distress from exposure to discrimination, which has been found to be linked to elevated blood pressure (McClure et al. 2010; Ryan et al. 2006). On the negative side, however, Latino density has also been found to be associated with higher prevalence of certain unhealthy practices such as decreased consumption of fruits and vegetables (Reyes-Ortiz et al. 2009) and reduced outdoor physical activities as a result of neighborhood disorder, limited access to facilities, or concerns about safety (Li and Wen 2013; Mellerson et al. 2010; Wen et al. 2013). As these hypothesized mechanisms have suggested paradoxical consequences on cardiovascular-related outcomes, whether Latino density positively or negatively affects their health risks warrants further investigation.
Review of the past literature did not show much empirical evidence on the link between immigrant concentration and Latino’s blood pressure and cholesterol level. However, research on other health outcomes suggested that immigrant concentration could, indeed, be beneficial for Latinos. One study in Chicago found that neighborhoods with higher proportions of immigrants witnessed significantly lower prevalence of asthma and other breathing problems among foreign-born Latinos (Cagney, Browning, and Wallace 2007). Another nationwide study also suggested that immigrant neighborhood conferred salubrious effects on immune functioning among Latino young adults (Ford and Browning 2015). Similarly, research on obesity confirmed potential benefits of immigrant concentration among Latino children and adults (Kimbro and Denney 2013; Nobari et al. 2013; Wen and Maloney 2011). These findings are not surprising given previous findings that healthier food environment surrounding immigrant communities (Osypuk et al. 2009), which could encourage healthful dietary intake and reduce risk factors elevating cholesterol level. From a psychosocial perspective, living in a more familiar social and cultural environment with co-ethnics nearby may provide opportunities of initial adjustment for those newly arrived foreign-born, which could potentially reduce acculturative stress and health risks.
Endogeneity in Neighborhood Effects
Residential selection bias is a thorny methodological challenge in assessing contextual influences on individual health outcomes (Diez Roux and Mair 2010). That is, where people live is not the result of a random process; rather, personal factors such as lifestyle preferences often influence individuals’ residential location decision. For instance, cross-sectional studies may suggest that neighborhoods with more favorable recreational resources, such as better accessibility to parks and open space, should have positive influences on their residents’ engagement in physical activities because it is observed that residents in more resourceful neighborhoods exhibit higher prevalence rates of physical activity. However, it is also possible that people with healthier lifestyles are more likely to live in these areas because they value neighborhood features that are friendly to outdoor activities. In the same vein, this endogeneity concern also applies to cardiovascular risk factors such as blood pressure and cholesterol level given the established effects of lifestyle factors on these risk factors.
Recent studies using cross-sectional data have started to take on various approaches to address sample selection in the neighborhood–health association. For example, Chaix and colleagues (2011) studied the association between neighborhood education and diabetes in France, and their analytical approach was in line with the traditional Heckman selection models by estimating separate and joint models for neighborhood predictors of the likelihood of study participation and of diabetes. Another group of researchers studied neighborhood walkability and weight status in Utah and compared age groups based on the assumption that youth had less residential choices compared to adults (Smith et al. 2011). Not surprisingly, both these two studies detected neighborhood selection bias.
Propensity score analysis has been introduced as an approach for causal inference in nonexperimental or observational data (Rosenbaum and Rubin 1983). Previous applications using this method have found that even after accounting for selection bias, neighborhood effects still persist. For example, a study of built environment and walking used propensity score for population weights to estimate propensity-score adjusted effects of built-environment measures on walking (Boer et al. 2007). Another study of neighborhood SES and obesity in France compared multilevel regression results from both propensity-score matched sample and unmatched sample, and confirmed the inverse relationship in the neighborhood SES–obesity link (Leal et al. 2011). Yet, few studies have applied propensity score matching method to examine the contextual effects of Latino ethnic density and immigrant concentration on health-related outcomes.
The present study aims to fill this gap using propensity score matching approach and also to assess the relative contributions of co-ethnic density versus immigrant concentration to blood pressure and cholesterol level–two cardiovascular risk factors. We ask the following two questions: (1) Are Latino co-ethnic density and immigrant concentration positively or negatively associated with Latinos’ likelihood of having high blood pressure or high cholesterol level? (2) Are these associations robust after taking into account sample selection bias?
Methods
Data
This study used pooled cross-sectional data from the 2006 and 2008 Southeastern Pennsylvania (SEPA) Household Health Survey administrated by the Public Health Management Corporation. This biennial cross-sectional survey took a stratified probability sample from 54 service areas in Bucks, Chester, Delaware, Montgomery, and Philadelphia counties, where each service area had about 30,000 to 75,000 adult residents, and was conducted through telephone interviews with people aged 18 or older. People aged 60 and older were oversampled for the purpose of asking specific questions to this age group. Self-reported person-level data from the SEPA Household Health Survey were then linked to census-tract profiles obtained from the 2005–2009 American Community Survey (ACS). Our sample included 1,563 native- and foreign-born Latinos of Puerto Rican, Mexican, and other origins who resided in 513 census tracts. Each census tract had an average of 2.8 subjects, with a range from 1 to 44.
List-wise deletion was performed to exclude missing data, with the percentage of missing values less than 3% for any variable. Compared to our analytical sample, respondents who had missing values were more likely to be male (40.2% vs. 30.9%), less likely to be married or living with partners (39.4% vs. 49.5%), more likely to be socioeconomically disadvantaged (high school or below 74.5% vs. 61.8%; below FPL 38.2% vs. 26.7%) and more likely to ever experience discrimination (23.6% vs. 16%). In addition, it is noteworthy that this sample is not representative of the general Latino population in the US. The Southeastern Pennsylvania region had a disproportionately larger Puerto Rican population and lower-than-average socioeconomic achievement compared to the general Latino population.
Individual-level Measures
The outcome measures were two indicators of biological health risks. High blood pressure was determined if a respondent in the SEPA survey answered “Yes” to the question “Have you ever been told by a doctor or other health professional that you have high blood pressure or hypertension?” Respondents who answered “No” or “Only during pregnancy” were considered not having high blood pressure. Similarly, high cholesterol level was determined if a respondent in the survey answered “Yes” to the question “Have you ever been told by a doctor or other health professional that you have high cholesterol?” Respondents who answered “No” were considered not having high cholesterol level.
There were two sets of individual-level covariates. One set is for the traditional multilevel models regressing on health risks, and the other set is for the predictor model in the propensity score analysis predicting the likelihood of being in the treatment group. In the multilevel regression analysis, individual socio-demographic controls included self-reported age (ranging from 18–91), age2, sex (male vs. female), marital status (married/living with partner, separated/divorced/widowed, and single), nativity (US born vs. foreign born), educational attainment (high school or below, some college, and college or above), income-poverty ratio (below 100% federal poverty line, between 100%–200% federal poverty line, and 200% federal poverty line or higher), and survey year (2006 vs. 2008). We controlled for respondents’ health insurance status (yes vs. no), and included a measure of ever experiencing racial discrimination in seeking medical care or housing (yes vs. no). This discrimination measure was created based on responses to two questions “Have you ever experienced discrimination, been prevented from doing something, or been hassled or made to feel inferior in seeking medical care because of your race, ethnicity, or color? Yes or No” and “Have you ever experienced discrimination, been prevented from doing something, or been hassled or made to feel inferior in getting housing because of your race, ethnicity, or color? Yes or No.” We also included three health behavior variables as hypothesized pathways linking neighborhood contexts to health; they were being a current smoker (not at all/never smoked vs. every day/some days), leisure-time physical activity (more than 3 days per week vs. 3 days or less per week), and number of servings of fruits and vegetables on a typical day (ranging from 0 to 11).
In the predictor model in the propensity score analysis, covariates were considered predictors of living in Latino- or immigrant-concentrated neighborhoods. These covariates included most individual controls in the multilevel regression models predicting the two health risk factors: age, age2, sex, nativity, educational attainment, and income-poverty ratio. Additional variables were also included to predict the likelihood of living in these neighborhoods. Family size summarized the total number of related adults and children in one’s household. It was then dichotomized by indicating whether a household had less than five people (coded 0) or had five or more people (coded 1). We also included a more detailed measure of housing discrimination (never, once, 2–3 times, 4 or more times). This measure was based on the survey question “Have you ever experienced discrimination, been prevented from doing something, or been hassled or made to feel inferior in getting housing because of your race, ethnicity, or color? Yes or No” and the follow-up question “How many times?” if respondents said “Yes” to the previous question. To achieve balancing property in the matching process, marital status and insurance status were not included in the predictor model.
Neighborhood-level Measures
All neighborhood measures were drawn from the 2005–2009 American Community Survey (ACS) census tract estimates. Latino co-ethnic density was based on the raw ACS estimates of the percentage of Latino residents in each census tract (ranging from 0 to 0.860). The original continuous measure was then dichotomized as whether a census tract had 25 percent or more Latino residents, following previous studies (Kirby et al. 2012; Wen, Lauderdale, and Kandula 2009). Tracts with 25 percent or more Latino residents were coded 1 to indicate high Latino density neighborhoods, while tracts having less than 25 percent Latino residents were coded 0 and were considered low Latino density neighborhoods.
Immigrant concentration was based on raw ACS estimates of the percentage of foreign-born residents in each census tract (ranging from 0 to 0.572). We then categorized the original continuous measure based on tertiles in the sample to indicate low (ranging from 0 to 0.048), medium (ranging from 0.049 to 0.095), or high immigrant concentration (ranging from 0.049 to 0.572) in a tract.
Taking into account neighborhood SES is essential in detangling ethnic density effects from area deprivation associated with minority concentration (Becares et al. 2012; Roy, Hughes, and Yoshikawa 2012). Tract-level information on percent of residents living in poverty was first obtained from ACS data. Following the categorization of the Census Bureau, we then created a dichotomous measure of neighborhood poverty indicating whether a neighborhood had at least 20% of residents living below the poverty level (U.S. Census Bureau). We also conducted sensitivity analysis using alternative categorizations of neighborhood-level Latinos density, immigrant concentration, and poverty concentration; results remained unchanged.
Statistical Analysis
Our analysis proceeded in two steps. In the first step, we estimated traditional two-level random effects logistic regression models predicting high blood pressure and high cholesterol level, respectively. For each health outcome, we first examined the crude effect of Latino co-ethnic density while adjusting for individual-level covariates (Model 1). In Model 2, we examined the crude effect of immigrant concentration, also adjusting for individual-level covariates. Then in Model 3, both Latino density and immigrant concentration were included, while adjusting for neighborhood poverty and individual controls. Model 4 further included the three health behaviors as potential mediators. Results were reported in odds ratios with 95% confidence intervals.
In the second step, propensity score matching was used to assess whether the results obtained from multilevel regression analysis were susceptible to sample selection bias. Our analysis followed the procedures recommended by Oakes and Johnson (2006). First, we estimated propensity scores for each respondent from a logistic regression model predicting living in a high Latino- or high immigrant-concentrated neighborhood on a set of individual predictors. Specifically, for Latino density, living in tracts with 25 percent or more Latinos was the treatment group and living in tracts with less than 25 percent Latinos was the control group. For immigrant concentration, living in the high tertile was the treatment group and living in the low tertile was the control group; the medium tertile category of immigrant concentration was excluded in the propensity score matching analysis for the ease of comparison. As described earlier, individual predictors used for estimating propensity scores were hypothesized variables that could potentially influence respondents’ residential choices; they included age, sex, nativity, educational attainment, income, family size, ever experienced discrimination, and housing discrimination.
After a propensity score was estimated for each respondent, we examined the overlap in propensity scores between the two comparison groups (treatment and control). If the overlap was sufficient and satisfactory for the matching, we then proceeded with nearest neighbor matching within a caliper of 0.01. Nearest neighbor matching was preferred because it was the more transparent approach in that subjects were matched within a predetermined range (Oakes and Johnson 2006). The next step was to check covariate balance by looking at the standardized difference (% bias) between the treatment group and the control group. We used 10% as the cutoff point to determine whether covariate balance was achieved and matched pairs were appropriate; that is, the matching was acceptable only when the standardized difference (% bias) was less than 10%. Once satisfied, the final step was to estimate a causal effect of the treatment, shown as the average effect of the treatment on the treated (ATT) (Guo and Fraser 2015):
where Y1 indicated the two health outcomes (i.e., high blood pressure, high cholesterol) that would have resulted if a respondent had lived in the treatment group (i.e., high Latino density, high immigrant concentration) and Y0 indicated the health outcomes if the same respondent had lived in the control group (i.e., low Latino density, low immigrant concentration). The treatment effect of living in a Latino- or immigrant-concentrated neighborhood on health outcomes was expressed as Y1 − Y0.
We chose to estimate ATT over other types of treatment effects because our substantive interest was the estimated effect of living with co-ethnics or with other immigrants among Latinos. Heckman (2005) also pointed out that ATT was more relevant in the policy contexts. We used bootstrapping standard errors with 100 replications to calculate t-statistics and to determine if the ATT was significant at the 0.05 level. Both regression analysis and propensity score matching were conducted in Stata 14.
Results
Descriptive Statistics
Descriptive information on study participants was presented in Table 1. Prevalence for both health outcomes was relatively high among Latino respondents. About 27% respondents reported they had high blood pressure, and about 24% respondents reported high cholesterol level. The majority (69%) of respondents were female and over half (57%) of them were foreign born. Socioeconomic indicators showed that only 38% respondents had some college education or above, and about 27% lived below the federal poverty line. There were about 22% respondents who did not have health insurance coverage at the time of interview. Experience of discrimination was also present. About 16% respondents reported that they had ever experienced discrimination in seeking medical care or getting housing because of their race/ethnicity or color. As for health behaviors, about 21% respondents were smokers at the time of interview, 37% exercised more than three times a week, and the average serving of fruits/vegetable per day was just over 2. At the neighborhood level, both Latino density and immigrant concentration were evident. About 39% respondents lived in neighborhoods that had 25 percent or more Latinos, and about 42% lived in the high tertile in terms of percentage of foreign-born residents. And about 57% respondents lived in neighborhoods where 20 percent or more residents were below poverty line, indicating relatively low neighborhood SES within Latino communities.
Table 1.
Descriptive Statistics, Southeastern Pennsylvania Household Health Survey 2006 and 2008
| Percentage or Mean | Observations | |
|---|---|---|
| Individual-level Variables | ||
| High blood pressure | 26.73% | 1,560 |
| High cholesterol level | 23.88% | 1,554 |
| Age | 41.83 (15.01) | 1,563 |
| Male | 30.90% | 1,563 |
| Marital status | 1,555 | |
| Married/living with partner | 49.45% | |
| Separated/divorced/widowed | 31.19% | |
| Single | 19.36% | |
| US born | 42.77% | 1,555 |
| Educational attainment | 1,554 | |
| High school or below | 61.78% | |
| Some college | 18.73% | |
| College or above | 19.50% | |
| Income-poverty ratio | 1,563 | |
| < 100% FPL | 26.68% | |
| 100%–200% FPL | 31.99% | |
| ≥ 200% FPL | 41.33% | |
| Family size (5 or more) | 15.04% | 1,563 |
| Health insurance (yes) | 78.31% | 1,563 |
| Discrimination (yes) | 15.97% | 1,528 |
| Housing discrimination | 1,530 | |
| Never | 91.05% | |
| Once | 2.22% | |
| 2–3 times | 4.71% | |
| 4 or more times | 2.03% | |
| Current smoker | 21.12% | 1,558 |
| Leisure-time physical activity | 36.91% | 1,558 |
| Fruits/vegetable intake | 2.22 (1.67) | 1,525 |
| Survey year 2008 | 32.35% | 1,563 |
| Neighborhood-level Variables | ||
| Percent Latino ≥ 25% | 38.86% | 1,562 |
| Immigrant concentration | 1,562 | |
| Low | 21.45% | |
| Medium | 36.88% | |
| High | 41.68% | |
| Neighborhood poverty ≥ 20% | 56.57% | 1,561 |
|
| ||
| Sample Size (N) | 1,563 | |
Note. Unweighted sample. Standard errors are in parentheses. Sample size for each variable may vary due to different amounts of missing data.
Multilevel Regression Analysis
For the first step of our analysis, we regressed the likelihood of having high blood pressure and high cholesterol level, respectively, on a set of neighborhood- and individual-level covariates using two-level random intercept logistic models. Results were presented in Table 2. Key variables of interest here were Latino density and immigrant concentration, and their patterns were largely consistent across the two health outcomes. That is, among Latinos, high Latino density (percent Latino ≥ 25%) was significantly associated with increased likelihood of having high blood pressure (OR = 1.42; 95% CI: 1.03, 1.96; Model 1) and high cholesterol level (OR = 1.36; 95% CI: 1.01, 1.82; Model 1). At the same time, Models 3 showed that Latinos living in high immigrant-concentrated neighborhoods had significantly decreased likelihood of having high blood pressure (OR = 0.63; 95% CI: 0.43, 0.92) or high cholesterol level (OR = 0.70; 95% CI: 0.49, 1.00). Adding health behaviors only rendered the significant effect of high immigrant concentration on cholesterol level to partially significant (OR = 0.71; 95% CI: 0.49, 1.01; Model 4). Neighborhood poverty was not significantly associated with having either high blood pressure or high cholesterol level. We did note that the association between Latino density and blood pressure was no longer significant when neighborhood poverty concentration was controlled for (Model 3 and Model 4), but this was not the case for cholesterol level. This might imply stronger confounding effects of neighborhood poverty for blood pressure than for cholesterol level.
Table 2.
Odds Ratio from Multilevel Logistic Regression Models Predicting High Blood Pressure and High Cholesterol Level
| High Blood Pressure | High Cholesterol Level | |||||||
|---|---|---|---|---|---|---|---|---|
|
| ||||||||
| Model 1 | Model 2 | Model 3 | Model 4 | Model 1 | Model 2 | Model 3 | Model 4 | |
| Neighborhood-level Variables | ||||||||
| Percent Latino ≥ 25% | 1.42* [1.03–1.96] |
1.34 [0.91–1.97] |
1.34 [0.91–1.98] |
1.36* [1.01–1.82] |
1.48* [1.02–2.14] |
1.47* [1.02–2.14] |
||
| Immigrant concentration (medium) | 0.77 [0.52–1.15] |
0.73 [0.49–1.09] |
0.75 [0.50–1.12] |
0.88 [0.62–1.25] |
0.79 [0.55–1.14] |
0.80 [0.56–1.16] |
||
| Immigrant concentration (high) | 0.65* [0.44–0.95] |
0.63* [0.43–0.92] |
0.64* [0.44–0.94] |
0.73+ [0.51–1.04] |
0.70* [0.49–1.00] |
0.71+ [0.49–1.01] |
||
| Neighborhood poverty ≥ 20% | 1.25 [0.87–1.80] |
1.23 [0.85–1.77] |
0.91 [0.64–1.31] |
0.89 [0.62–1.29] |
||||
| Individual-level Variables | ||||||||
| Age | 1.12*** [1.07–1.18] |
1.12*** [1.07–1.18] |
1.12*** [1.05–1.07] |
1.12*** [1.06–1.17] |
1.19*** [1.13–1.26] |
1.19*** [1.13–1.26] |
1.19*** [1.13–1.26] |
1.19*** [1.13–1.25] |
| Age2 | 1.00* [1.00–1.00] |
1.00* [1.00–1.00] |
1.00* [1.00–1.00] |
1.00* [1.00–1.00] |
1.00*** [1.00–1.00] |
1.00*** [1.00–1.00] |
1.00*** [1.00–1.00] |
1.00* [1.00–1.00] |
| Male | 1.16 [0.86–1.56] |
1.15 [0.85–1.55] |
1.18 [0.87–1.58] |
1.16 [0.85–1.57] |
1.20 [0.89–1.62] |
1.18 [0.88–1.59] |
1.20 [0.89–1.62] |
1.19 [0.87–1.61] |
| Separated/divorced/widowed | 1.30+ [0.95–1.79] |
1.33+ [0.96–1.83] |
1.25 [0.91–1.73] |
1.24 [0.90–1.71] |
1.63** [1.18–2.24] |
1.67** [1.21–2.29] |
1.61** [1.17–2.22] |
1.61** [1.16–2.23] |
| Single | 1.01 [0.68–1.52] |
1.00 [0.67–1.51] |
0.97 [0.64–1.45] |
0.94 0.62–1.42 |
1.64* [1.10–2.46] |
1.65* [1.11–2.47] |
1.62* [1.08–2.43] |
1.59* [1.05–2.39] |
| US born | 1.26 [0.95–1.69] |
1.19 [0.89–1.60] |
1.24 [0.93–1.66] |
1.21 [0.90–1.63] |
0.76+ [0.57–1.03] |
0.72* [0.54–0.96] |
0.75+ [0.56–1.01] |
0.76+ [0.56–1.02] |
| Some college | 0.79 [0.55–1.13] |
0.77 [0.53–1.11] |
0.78 [0.54–1.13] |
0.81 [0.56–1.17] |
0.70+ [0.48–1.02] |
0.68* [0.47–0.99] |
0.69+ [0.47–1.00] |
0.72+ [0.49–1.05] |
| College or above | 0.57** [0.38–0.86] |
0.55** [0.36–0.83] |
0.59* [0.39–0.89] |
0.61* [0.40–0.93] |
0.60* [0.40–0.90] |
0.58** [0.39–0.86] |
0.61* [0.41–0.91] |
0.64* [0.42–0.97] |
| 100%–200% FPL | 0.64** [0.45–0.89] |
0.62** [0.44–0.87] |
0.63** [0.45–0.89] |
0.64** [0.45–0.89] |
0.83 [0.58–1.17] |
0.81 [0.57–1.14] |
0.81 [0.57–1.15] |
0.82 [0.57–1.16] |
| 200% FPL or above | 0.47*** [0.33–0.69] |
0.44*** [0.30–0.63] |
0.48*** [0.33–0.70] |
0.49*** [0.34–0.71] |
0.90 [0.62–1.31] |
0.84 [0.58–1.22] |
0.89 [0.61–1.29] |
0.90 [0.62–1.32] |
| Health insurance (yes) | 1.50* [1.03–2.16] |
1.45* [1.00–2.11] |
1.45* [1.00–2.10] |
1.42+ [0.98–2.06] |
1.65* [1.12–2.42] |
1.60* [1.09–2.35] |
1.61* [1.10–2.37] |
1.58* [1.08–2.33] |
| Discrimination (yes) | 1.31 [0.92–1.87] |
1.29 [0.90–1.84] |
1.29 [0.90–1.84] |
1.27 [0.89–1.82] |
1.30 [0.91–1.86] |
1.29 [0.90–1.84] |
1.28 [0.90–1.84] |
1.27 [0.89–1.83] |
| Current smoker | 1.33+ [0.95–1.85] |
1.11 [0.79–1.56] |
||||||
| Leisure-time physical activity | 0.81 [0.61–1.07] |
0.82 [0.62–1.10] |
||||||
| Fruits/vegetable intake | 1.01 [0.93–1.10] |
0.96 [0.88–1.05] |
||||||
| Survey year 2008 | 1.06 [0.78–1.42] |
0.96 [0.70–1.31] |
1.00 [0.73–1.36] |
1.02 [0.74–1.39] |
0.96 [0.70–1.30] |
0.91 [0.67–1.24] |
0.94 [0.69–1.28] |
0.94 [0.69–1.29] |
| Constant | 0.01*** [0.00–0.02]) |
0.01*** [0.00–0.04] |
0.01*** [0.00–0.03] |
0.01*** [0.00–0.03] |
0.00*** [0.00–0.00] |
0.00*** [0.00–0.01] |
0.03*** [0.02–0.06] |
0.00*** [0.00–0.01] |
|
| ||||||||
| Observations | 1,456 | 1,456 | 1,456 | 1,456 | 1,456 | 1,456 | 1,456 | 1,456 |
| Number of tracts | 513 | 513 | 513 | 513 | 513 | 513 | 513 | 513 |
Note. 95% confidence intervals are in parentheses.
p<0.001,
p<0.01,
p<0.05,
p<0.10
Propensity Score Matching Analysis for Latino Density
We estimated a logistic regression model predicting the propensity of respondents living in a neighborhood with 25 percent or more Latinos (see Supplementary Table 1). It showed that being male, born in the US, higher educational attainment, and higher income were all negatively associated with the likelihood of living in Latino-concentrated neighborhoods. However, according to Oakes and Johnson (2006), we should not pay too much attention to assess statistical significance of covariates for such prediction models, as they were simply used to generate propensity scores and to create the two comparison groups. Therefore, all the original variables were used to estimate the propensity score for each respondent.
Figure 1 illustrated the propensity score overlap between the two groups of neighborhood Latinos density. As an indication of selection bias, the overlap showed that respondents living in neighborhoods of high Latino density had a greater propensity for living in such areas. Test of balancing property of propensity scores suggested there was sufficient overlap in the distribution of propensity scores. Therefore, we continued with the patching process using “nearest neighbor” matching.
Figure 1.
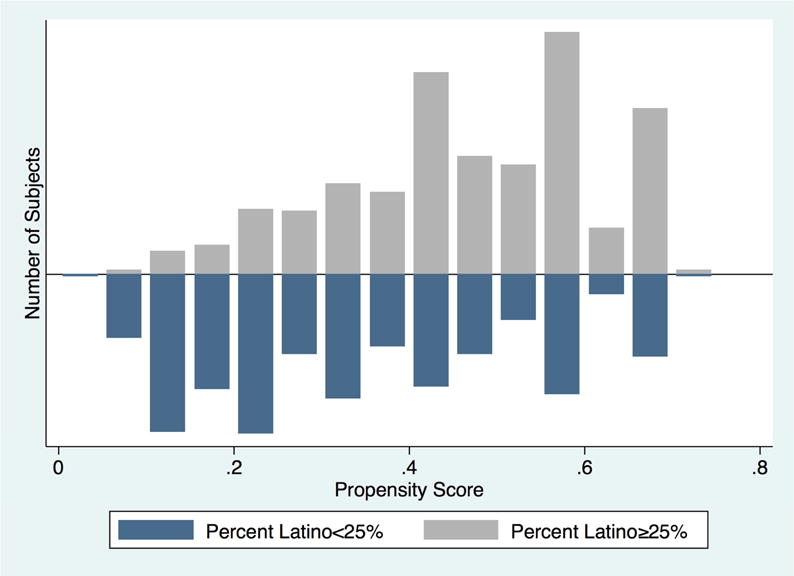
Overlap in Propensity Score by Neighborhood Latino Density
After the matching, assessment of covariate balance showed significant reduction in standardized difference (% bias) between the treatment group and the control group. All covariates became more balanced, and % bias were all within the 10% threshold. Estimates of the average effect of the treatment on the treated (ATT) were then conducted. Tables 3 and 4 presented ATT estimates for Latino density when high blood pressure and high cholesterol level were the outcomes, respectively. After taking into account sample selection bias, the estimated difference for having high blood pressure between respondents living in neighborhoods of high Latino density and those of low Latino density remained at about 0.07. Bootstrapping standard error with 100 replications was 0.027. The ATT was significant at the 0.05 level. Similarly, the estimated difference for having high cholesterol level remained at about 0.07 and the ATT was also significant at the 0.05 level. They suggested that residents living in Latino-concentrated neighborhoods were, indeed, more likely to have both health risks.
Table 3.
ATT for Latino Density when High Blood Pressure is the Outcome
| Sample | Treated | Controls | Difference | Standard Error | t-Statistic |
|---|---|---|---|---|---|
| Unmatched | 0.33 | 0.23 | 0.10 | 0.02 | 4.13 |
| Matched | 0.32 | 0.24 | 0.07 | 0.03 | 2.52 |
Note. Bootstrapping standard error is 0.027 (with 100 replications). Critical t-statistic is 1.96.
Table 4.
ATT for Latino Density when High Cholesterol Level is the Outcome
| Sample | Treated | Controls | Difference | Standard Error | t-Statistic |
|---|---|---|---|---|---|
| Unmatched | 0.28 | 0.21 | 0.08 | 0.02 | 3.47 |
| Matched | 0.29 | 0.22 | 0.07 | 0.03 | 2.61 |
Note. Bootstrapping standard error is 0.027 (with 100 replications). Critical t-statistic is 1.96.
Propensity Score Matching Analysis for Immigrant Concentration
For immigrant concentration, we also estimated a logistic regression model predicting the propensity of participants living in a neighborhood with percentage of immigrants in the high tertile versus the low tertile (see Supplementary Table 2). Born in the US was negatively associated with living in an immigrant-concentrated neighborhood. Again, as assessment of statistical significance of these repressors did not matter in estimating propensity scores, all the original variables were used to estimate the propensity score for each respondent.
Figure 2 illustrated the propensity score overlap between the two comparison groups of neighborhood immigrant concentration. It showed sufficient overlap in the distribution of propensity scores, indicating it was very likely to find appropriate matches for most residents living in immigrant-concentrated neighborhoods.
Figure 2.
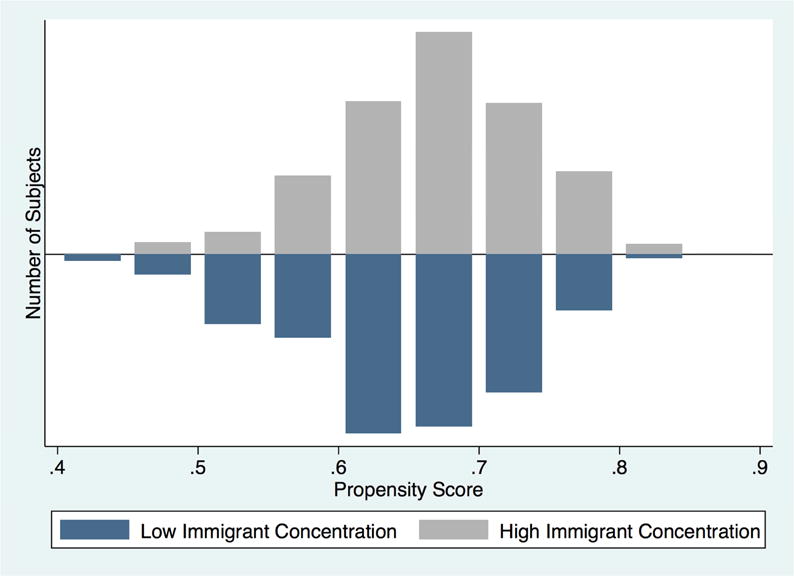
Overlap in Propensity Score by Neighborhood Immigrant Concentration
Assessment of covariate balance after matching showed significant reduction in standardized difference (% bias) between the treatment group and the control group. All covariates became more balanced and standardized differences were all within the 10% threshold. Estimated effects of the average effect of the treatment on the treated (ATT) were then conducted. Tables 5 and 6 presented ATT estimates for immigrant concentration for the two health risks, respectively. After taking into account sample selection bias, the estimated difference for having high blood pressure between respondents living in neighborhoods in the high tertile of immigrant concentration and those living in neighborhoods in the low tertile was about 0.04. The estimated difference for having high cholesterol level was about 0.06. Neither of these two ATT estimates was statistically significant. This result suggested that Latinos living in high immigrant-concentrated neighborhoods did not significantly differ from those living in low immigrant-concentrated neighborhoods. Therefore, selection bias may have played a major role in the observed negative association between immigrant concentration and the two health risk factors shown in multilevel regression models.
Table 5.
ATT for Immigrant Concentration when High Blood Pressure is the Outcome
| Sample | Treated | Controls | Difference | Standard Error | t-Statistic |
|---|---|---|---|---|---|
| Unmatched | 0.22 | 0.32 | −0.10 | 0.03 | −3.26 |
| Matched | 0.27 | 0.30 | −0.04 | 0.04 | −1.07 |
Note. Bootstrapping standard error is 0.035 (with 100 replications). Critical t-statistic is 1.96.
Table 6.
ATT for Immigrant Concentration when High Cholesterol Level is the Outcome
| Sample | Treated | Controls | Difference | Standard Error | t-Statistic |
|---|---|---|---|---|---|
| Unmatched | 0.19 | 0.28 | −0.08 | 0.03 | −2.94 |
| Matched | 0.22 | 0.27 | −0.06 | 0.03 | −1.59 |
Note. Bootstrapping standard error is 0.035 (with 100 replications). Critical t-statistic is 1.96.
Discussion
This study examined differential effects of neighborhood Latino density and immigrant concentration on the likelihood of high blood pressure and high cholesterol level. We utilized propensity score matching approach in the analyses to correct for sample selection bias. Results from both multilevel regression and propensity score matching confirm that Latino density is positively associated with Latinos’ cardiovascular risks. Meanwhile, immigrant concentration is found to be a negative correlate in multilevel regression models but this effect was not replicated in the propensity score matching analyses, suggesting considerable selection bias underlying the observed negative link between immigrant concentration and odds of high blood pressure and high cholesterol level.
We focused on the associations between neighborhood racial/ethnic contexts and two cardiovascular risk factors because they can capture part of the biological “wear and tear” processes underlying the social construction of individual characteristics (Das 2012) and social environment (Bird et al. 2010). The findings suggest that neighborhood racial/ethnic and immigrant composition should play a role in the individual biological “wear and tear” process, net of neighborhood disadvantages and other individual risk factors. Although recent scholarship has inquired into the health impact of residential racial/ethnic contexts, studies that have specifically compared co-ethnic density and immigrant concentration are limited. One nationwide study of birthweight using the 2000 natality data found that higher co-ethnic density was negatively associated with birthweight among infants of US-born mothers of Mexican origin; in contrast, living in immigrant enclaves was associated with higher birthweight among US-born mothers (Osypuk, Bates, and Acevedo-Garcia 2010). Similar patterns were documented in another study that found Latino residential isolation was positively linked to obesity whereas immigrant concentration was negatively associated with the risk of obesity in the state of Utah (Wen and Maloney 2011). Results from our multilevel analyses are consistent with these two studies in that neighborhood co-ethnic density might be detrimental for Latinos’ cardiovascular health while immigrant concentration could protect them from health risks. Comparing the health effects of these two neighborhood predictors provides a more comprehensive view to understand neighborhood influences on physiological dysregulation among the Latino population.
This study also adds to the literature by addressing endogeneity in the neighborhood–health link. We utilize the propensity score matching method to correct for potential situations of structural confounding. This is achieved by performing analyses between participants who are exchangeable between high-density and low-density of Latino co-ethnics or immigrants, on the basis of a set of individual predictors that could possibly influence these two residential patterns. In doing this, observed differences in the outcomes (i.e., high blood pressure, high cholesterol level) between the treatment group and the control group is inferred to be the result of the treatment alone (Oakes and Johnson 2006). Our results show that the positive association between Latino density and health risks is robust net of the selection bias, but the negative association between immigrant concentration and health is subject to strong selection bias.
Drawing on theoretical and empirical work on race-based residential patterns can well explain the negative effects of Latino density on their health risks. Many Latinos in the United States are socioeconomically disadvantaged, and they also tend to be clustering in more deprived residential neighborhoods. Neighborhood socioeconomic deprivation is also associated with neighborhood disorder and deficiency in health-promoting facilities, discouraging residents to maintain healthy diet and engage in physical activities (Mellerson et al. 2010; Wen et al. 2013). Cumulative disadvantages are also linked to greater exposure to individual- and neighborhood-level stressors which are shown to be playing crucial roles in the “wear and tear” process and physiological dysregulation (McEwen 2001). By looking at Latino density, a proxy measure of race-based residential segregation (White and Borrell 2011), our finding is in line with Williams and Collins’ position that residential segregation is a fundamental cause of racial disparities in health (Williams and Collins 2001). It also echoes previous findings showing that Latinos living in neighborhoods of higher co-ethnic density are more likely to exhibit poorer health or behavioral outcomes such as substance use and delinquency (Frank et al. 2007), overweight or obesity (Do et al. 2007, Wen and Maloney 2011), low birthweight (Osypuk et al. 2010;), and poor self-reported health (Roy, Hughes, and Yoshikawa 2013).
It remains inconclusive whether immigrant concentration exerts contextual influences on individual health risks. Recent evidence based on cross-sectional data has shown that immigrant concentration may protect against neighborhood violence (Graif and Sampson 2009) as well as health risks such as low birthweight (Osypuk et al. 2010) and obesity (Ishizawa and Jones 2016; Kimbro and Denney 2013; Nobari et al. 2013; Wen and Maloney 2011). Immigrant-concentrated neighborhoods also witness healthier food environment in terms of availability of fresh food and lower consumption of high-fat diet (Osypuk et al. 2009; Park et al. 2011), which is beneficial to both blood pressure and cholesterol level. In addition, immigrant communities can be helpful for newly arrived immigrants to buffer against migration-related stress and thus may lower their biological risks (Pan and Carpiano 2013). Taken together, these perspectives offer credible hypotheses that immigrant communities can produce health benefits via a set of social, psychological and structural mechanisms for Latinos. However, all these studies have relied on regression analysis of cross-sectional survey data, and have not been able to directly address selection bias. The present study has shown that the observed effects of immigrant concentration are largely attributable to neighborhood selection, echoing a recent analysis showing that selection bias plays a major role in neighborhood effects on obesity (Smith et al. 2011). Indeed, it is suggested that immigrant concentration is more likely a result of compositional effects as compared to residential segregation or co-ethnic density, as recent immigrants are likely to select their residential neighborhoods as part of their assimilation process (Mair et al. 2010). That said, propensity score analysis based on observational studies is still not a final solution to draw causal inference (Oakes 2004). Future research may consider more rigorous study designs such as longitudinal study of neighborhood change or an experimental approach to better understand the causal relationship between neighborhood exposure and individual health outcomes. Moreover, future research may look into residential histories and apply additional operationalization such as language use or cultural preferences to better assess the influence of living in immigrant communities.
Several study limitations should be noted. First, our key individual-level variables are based on self-reported data, including the two health outcomes. It is likely that some respondents were living with high blood pressure and/or high cholesterol level at the time of interview but were not aware of these conditions. This could be more possible among the survey subsample of Latinos, as many of them are socioeconomically disadvantaged or foreign-born and face structural or cultural barriers in seeking medical care or health information. Therefore, the prevalence of both health outcomes could be underestimated (Newell et al. 1999). In addition, closer look of missing data reveals that socioeconomically disadvantaged respondents are more likely to be excluded in our analyses. Moreover, since this study is based on a sample of Latinos collected in southeastern Pennsylvania area, our findings should be interpreted with the consideration of local social, cultural, and political contexts. As mentioned earlier, the racial make-up in our sample somewhat differs from the Latinos nationwide. That said, our multilevel regression results are comparable to prior studies of different Latino populations (e.g., Wen and Maloney 2011); this leads to greater confidence in generalizing our results.
In conclusion, this study makes a unique contribution to the literature by providing evidence on health implications of neighborhood racial/ethnic contexts and by directly addressing neighborhood selection bias. We have observed the beneficial influence of immigrant concentration, which is likely a result of immigrants’ residential choices thereby reflecting more of a compositional effect rather than a contextual effect. This finding underscores the need to take into account selection bias in researching neighborhood effects, as some groups like recent immigrants may be more subject to the forces of neighborhood selection than others. At the same time, our results have demonstrated deleterious effects of neighborhood co-ethnic density on Latino cardiovascular health. This result lends support to the notion that neighborhood racial-ethnic integration should be considered in urban design among other policy priorities. Such integration could be implemented through interventions in housing planning, commodification, and public spaces (Fincher et al. 2014). In addition, culturally appropriate strategies and policies should target the underserved population and ethnic communities in order to prevent Latino cardiovascular health risks.
Supplementary Material
Highlights.
We address the endogeneity from neighborhood selection using propensity score matching
We examine influences of co-ethnic density and immigrant concentration on Latinos’ blood pressure and cholesterol level
The positive association between co-ethnic density and health risks was confirmed in propensity score analysis
Neighborhood selection may account for the observed negative association between immigrant concentration and health risks
Acknowledgments
This study was funded by the National Institute of General Medical Sciences of the National Institutes of Health (R01CA140319-01A1; PI: Wen). Li also acknowledged a faculty summer grant from the College of Natural and Behavioral Sciences provided by K. T. and E. L. Norris Foundation.
Footnotes
Publisher's Disclaimer: This is a PDF file of an unedited manuscript that has been accepted for publication. As a service to our customers we are providing this early version of the manuscript. The manuscript will undergo copyediting, typesetting, and review of the resulting proof before it is published in its final citable form. Please note that during the production process errors may be discovered which could affect the content, and all legal disclaimers that apply to the journal pertain.
References
- Alvarez Kimberly J, Levy Becca R. Health Advantages of Ethnic Density for African American and Mexican American Elderly Individuals. American Journal of Public Health. 2012;102(12):2240–42. doi: 10.2105/AJPH.2012.300787. [DOI] [PMC free article] [PubMed] [Google Scholar]
- Anderson Kathryn Freeman, Fullerton Andrew S. Residential Segregation, Health, and Health Care: Answering the Latino Question. Race and Social Problems. 2014;6(3):262–79. [Google Scholar]
- City of Philadelphia. Fact Sheet: Philadelphia’s Hispanic Population - Official Philadelphia Tourism Pressroom. 2012 Retrieved May 5, 2017 http://press.visitphilly.com/releases/fact-sheet-philadelphia-s-hispanic-population.
- Becares Laia, et al. Ethnic Density Effects on Physical Morbidity, Mortality, and Health Behaviors: A Systematic Review of the Literature. American Journal of Public Health. 2012;102(12):e33–66. doi: 10.2105/AJPH.2012.300832. [DOI] [PMC free article] [PubMed] [Google Scholar]
- Bird Chloe E, et al. Neighborhood Socioeconomic Status and Biological ‘Wear and Tear’ in a Nationally Representative Sample of US Adults. Journal of Epidemiology and Community Health. 2010;64(10):860–65. doi: 10.1136/jech.2008.084814. [DOI] [PMC free article] [PubMed] [Google Scholar]
- Boer Rob, Zheng Yuhui, Overton Adrian, Ridgeway Gregory K, Cohen Deborah A. Neighborhood Design and Walking Trips in Ten U.S. Metropolitan Areas. American Journal of Preventive Medicine. 2007;32(4):298–304. doi: 10.1016/j.amepre.2006.12.012. [DOI] [PMC free article] [PubMed] [Google Scholar]
- Cagney Kathleen A, Browning Christopher R, Wallace Danielle M. The Latino Paradox in Neighborhood Context: The Case of Asthma and Other Respiratory Conditions. American Journal of Public Health. 2007;97(5):919–25. doi: 10.2105/AJPH.2005.071472. [DOI] [PMC free article] [PubMed] [Google Scholar]
- Chaix Basile, et al. Neighborhood Effects on Health: Correcting Bias from Neighborhood Effects on Participation. Epidemiology. 2011;22(1):18–26. doi: 10.1097/EDE.0b013e3181fd2961. [DOI] [PubMed] [Google Scholar]
- Charles Camille Zubrinsky. The Dynamics of Racial Residential Segregation. Annual Review of Sociology. 2003;29(1):167–207. [Google Scholar]
- Colby Sandra L, Ortman Jennifer M. Projections of the Size and Composition of the US Population: 2014 to 2060. Current Population Reports. 2014:25–1143. [Google Scholar]
- Crimmins Eileen M, Kim Jung Ki, Alley Dawn E, Karlamangla Arun, Seeman Teresa. Hispanic Paradox in Biological Risk Profiles. American Journal of Public Health. 2007;97(7):1305–10. doi: 10.2105/AJPH.2006.091892. [DOI] [PMC free article] [PubMed] [Google Scholar]
- Das Aniruddha. How Does Race Get ‘under the Skin’?: Inflammation, Weathering, and Metabolic Problems in Late Life. Social Science & Medicine. 2012;77:75–83. doi: 10.1016/j.socscimed.2012.11.007. [DOI] [PMC free article] [PubMed] [Google Scholar]
- Diez Roux Ana V, Mair Christina. Neighborhoods and Health. Annals of the New York Academy of Sciences. 2010;1186:125–45. doi: 10.1111/j.1749-6632.2009.05333.x. [DOI] [PubMed] [Google Scholar]
- Do D Phuong, et al. Neighborhood Context and Ethnicity Differences in Body Mass Index: A Multilevel Analysis Using the NHANES III Survey (1988–1994) Economics and Human Biology. 2007;5(2):179–203. doi: 10.1016/j.ehb.2007.03.006. [DOI] [PMC free article] [PubMed] [Google Scholar]
- Durazo Eva M, Mbassa Rachel S, Albert Michelle A. Ethnic Enclaves and Type II Diabetes: A Focus on Latino/Hispanic Americans. Current Cardiovascular Risk Reports. 2016;10(11):36. [Google Scholar]
- Fincher Ruth, Iveson Kurt, Leitner Helga, Preston Valerie. Planning in the multicultural city: Celebrating diversity or reinforcing difference? Progress in Planning. 2014;92:1–55. [Google Scholar]
- Ford Jodi L, Browning Christopher R. Exposure to Neighborhood Immigrant Concentration from Adolescence to Young Adulthood and Immune Function among Latino Young Adults. Health & Place. 2015;32:59–64. doi: 10.1016/j.healthplace.2014.12.010. [DOI] [PMC free article] [PubMed] [Google Scholar]
- Frank R, Cerda M, Rendon M. Barrios and Burbs: Residential Context and Health-Risk Behaviors among Angeleno Adolescents. Journal of Health and Social Behavior. 2007;48(3):283–300. doi: 10.1177/002214650704800306. [DOI] [PubMed] [Google Scholar]
- Gee Gilbert C, Payne-Sturges Devon C. Environmental Health Disparities: A Framework Integrating Psychosocial and Environmental Concepts. Environmental Health Perspectives. 2004;112(17):1645–53. doi: 10.1289/ehp.7074. [DOI] [PMC free article] [PubMed] [Google Scholar]
- González Burchard Esteban, et al. Latino Populations: A Unique Opportunity for the Study of Race, Genetics, and Social Environment in Epidemiological Research. American Journal of Public Health. 2005;95(12):2161–68. doi: 10.2105/AJPH.2005.068668. [DOI] [PMC free article] [PubMed] [Google Scholar]
- Graif C, Sampson RJ. Spatial Heterogeneity in the Effects of Immigration and Diversity on Neighborhood Homicide Rates. Homicide Studies. 2009;13(3):242–60. doi: 10.1177/1088767909336728. [DOI] [PMC free article] [PubMed] [Google Scholar]
- Guo Shenyang, Fraser Mark W. Propensity Score Analysis: Statistical Methods and Applications. 2nd. Thousand Oaks: Sage Publications; 2015. [Google Scholar]
- Heckman James J. The Scientific Model of Causality. Sociological Methodology. 2005;35(1):1–97. [Google Scholar]
- Iceland J, Scopilliti M. Immigrant Residential Segregation in U.S. Metropolitan Areas, 1990–2000. Demography. 2008;45(1):79–94. doi: 10.1353/dem.2008.0009. [DOI] [PMC free article] [PubMed] [Google Scholar]
- Ishizawa Hiromi, Jones Antwan. Immigrant Neighborhood Concentration, Acculturation and Obesity among Young Adults. Journal of Urban Affairs. 2016;38(2):298–311. [Google Scholar]
- Kershaw Kiarri N, Albrecht Sandra S, Carnethon Mercedes R. Racial and Ethnic Residential Segregation, the Neighborhood Socioeconomic Environment, and Obesity among Blacks and Mexican Americans. American Journal of Epidemiology. 2013;177(4):299–309. doi: 10.1093/aje/kws372. [DOI] [PMC free article] [PubMed] [Google Scholar]
- Kimbro Rachel Tolbert, Denney Justin T. Neighborhood Context and Racial/ethnic Differences in Young Children’s Obesity: Structural Barriers to Interventions. Social Science & Medicine. 2013;95:97–105. doi: 10.1016/j.socscimed.2012.09.032. [DOI] [PubMed] [Google Scholar]
- Kirby James B, Liang Lan, Chen Hsin-Jen, Wang Youfa. Race, Place, and Obesity: The Complex Relationships among Community Racial/ethnic Composition, Individual Race/ethnicity, and Obesity in the United States. American Journal of Public Health. 2012;102(8):1572–78. doi: 10.2105/AJPH.2011.300452. [DOI] [PMC free article] [PubMed] [Google Scholar]
- Kramer Michael R, Hogue Carol R. Is Segregation Bad for Your Health? Epidemiologic Reviews. 2009;31:178–94. doi: 10.1093/epirev/mxp001. [DOI] [PMC free article] [PubMed] [Google Scholar]
- Leal Cinira, Bean Kathy, Thomas Frédérique, Chaix Basile. Are Associations between Neighborhood Socioeconomic Characteristics and Body Mass Index or Waist Circumference Based on Model Extrapolations? Epidemiology. 2011;22(5):694–703. doi: 10.1097/EDE.0b013e3182257784. [DOI] [PubMed] [Google Scholar]
- Li Kelin, Wen Ming. Racial and Ethnic Disparities in Leisure-Time Physical Activity in California: Patterns and Mechanisms. Race and Social Problems. 2013;5(3):147–56. doi: 10.1007/s12552-013-9087-9. [DOI] [PMC free article] [PubMed] [Google Scholar]
- Logan John R, Fischer Claude, Buchmann Claudia. The Persistence of Segregation in the Metropolis: New Findings from the 2010 Census 2013 [Google Scholar]
- Logan John R, Wenquan Zhang, Alba Richard D. Immigrant Enclaves and Ethnic Communities in New York and Los Angeles. American Sociological Review. 2002;67(2):299–322. [Google Scholar]
- Mair Christina, et al. Is Neighborhood Racial/ethnic Composition Associated with Depressive Symptoms? The Multi-Ethnic Study of Atherosclerosis. Social Science & Medicine. 2010;71(3):541–50. doi: 10.1016/j.socscimed.2010.04.014. [DOI] [PMC free article] [PubMed] [Google Scholar]
- Massey Douglas S, Denton Nancy A. The Dimensions of Residential Segregation. Social Forces. 1988;67(2):281–315. [Google Scholar]
- McClure Heather H, et al. Discrimination, Psychosocial Stress, and Health among Latin American Immigrants in Oregon. American Journal of Human Biology. 2010;22(3):421–23. doi: 10.1002/ajhb.21002. [DOI] [PMC free article] [PubMed] [Google Scholar]
- McEwen BS. From Molecules to Mind. Stress, Individual Differences, and the Social Environment. Annals of the New York Academy of Sciences. 2001;935:42–49. [PubMed] [Google Scholar]
- Mellerson Jenelle, et al. Residential Segregation and Exercise among a National Sample of Hispanic Adults. Health & Place. 2010;16(3):613–15. doi: 10.1016/j.healthplace.2009.12.013. [DOI] [PubMed] [Google Scholar]
- Newell Sallie A, Girgis Afaf, Sanson-Fisher Rob W, Savolainen Nina J. The Accuracy of Self-Reported Health Behaviors and Risk Factors Relating to Cancer and Cardiovascular Disease in the General Population: A Critical Review. American Journal of Preventive Medicine. 1999;17(3):211–29. doi: 10.1016/s0749-3797(99)00069-0. [DOI] [PubMed] [Google Scholar]
- Nobari Tabashir Z, et al. Immigrant Enclaves and Obesity in Preschool-Aged Children in Los Angeles County. Social Science & Medicine. 2013;92:1–8. doi: 10.1016/j.socscimed.2013.05.019. [DOI] [PMC free article] [PubMed] [Google Scholar]
- Nobles Carrie J, et al. Residential Segregation and Mental Health among Latinos in a Nationally Representative Survey. Journal of Epidemiology and Community Health. 2017;71(4):318–23. doi: 10.1136/jech-2016-208034. [DOI] [PMC free article] [PubMed] [Google Scholar]
- Oakes J Michael. The (Mis)estimation of Neighborhood Effects: Causal Inference for a Practicable Social Epidemiology. Social Science & Medicine. 2004;58(10):1929–52. doi: 10.1016/j.socscimed.2003.08.004. [DOI] [PubMed] [Google Scholar]
- Oakes J Michael, Johnson Pamela Jo. Methods in Social Epidemiology. San Francisco, CA: Jossey-Bass; 2006. Propensity Score Matching for Social Epidemiology; pp. 370–92. [Google Scholar]
- Osypuk TL, Bates LM, Acevedo-Garcia D. Another Mexican Birthweight Paradox? The Role of Residential Enclaves and Neighborhood Poverty in the Birthweight of Mexican-Origin Infants. Social Science and Medicine. 2010;70(4):550–60. doi: 10.1016/j.socscimed.2009.10.034. [DOI] [PMC free article] [PubMed] [Google Scholar]
- Osypuk TL, Roux AV, Hadley C, Kandula NR. Are Immigrant Enclaves Healthy Places to Live? The Multi-Ethnic Study of Atherosclerosis. Social Science & Medicine. 2009;69(1):110–20. doi: 10.1016/j.socscimed.2009.04.010. [DOI] [PMC free article] [PubMed] [Google Scholar]
- Pan Stephen W, Carpiano Richard M. Immigrant Density, Sense of Community Belonging, and Suicidal Ideation Among Racial Minority and White Immigrants in Canada. Journal of Immigrant and Minority Health. 2013;15(1):34–42. doi: 10.1007/s10903-012-9657-8. [DOI] [PubMed] [Google Scholar]
- Park Yoosun, et al. Neighbourhood Immigrant Acculturation and Diet among Hispanic Female Residents of New York City. Public Health Nutrition. 2011;14(9):1593–1600. doi: 10.1017/S136898001100019X. [DOI] [PMC free article] [PubMed] [Google Scholar]
- Pew Research Center. Hispanic Nativity Shift. 2014 Retrieved February 24, 2017 http://www.pewhispanic.org/2014/04/29/hispanic-nativity-shift.
- Pickett Kate E, Wilkinson Richard G. People like Us: Ethnic Group Density Effects on Health. Ethnicity & Health. 2008;13(4):321–34. doi: 10.1080/13557850701882928. [DOI] [PubMed] [Google Scholar]
- Reyes-Ortiz Carlos A, Ju Hyunsu, Eschbach Karl, Kuo Yong-Fang, Goodwin James S. Neighbourhood Ethnic Composition and Diet among Mexican-Americans. Public Health Nutrition. 2009;12(12):2293–2301. doi: 10.1017/S1368980009005047. [DOI] [PMC free article] [PubMed] [Google Scholar]
- Rosenbaum Paul R, Rubin Donald B. The Central Role of the Propensity Score in Observational Studies for Causal Effects. Biometrika. 1983;70(1):41. [Google Scholar]
- Roy Amanda L, Hughes Diane, Yoshikawa Hirokazu. Exploring Neighborhood Effects on Health and Life Satisfaction: Disentangling Neighborhood Racial Density and Neighborhood Income. Race and Social Problems. 2012;4(3–4):193–204. [Google Scholar]
- Roy Amanda Leigh, Hughes Diane, Yoshikawa Hirokazu. Intersections Between Nativity, Ethnic Density, and Neighborhood SES: Using an Ethnic Enclave Framework to Explore Variation in Puerto Ricans’ Physical Health. American Journal of Community Psychology. 2013;51(3–4):468–79. doi: 10.1007/s10464-012-9564-0. [DOI] [PubMed] [Google Scholar]
- Ryan Andrew M, Gee Gilbert C, Laflamme David F, Mitchell F. The Association between Self-Reported Discrimination, Physical Health and Blood Pressure: Findings from African Americans, Black Immigrants, and Latino Immigrants in New Hampshire. Journal of Health Care for the Poor and Underserved. 2006;17(2):116–32. doi: 10.1353/hpu.2006.0092. [DOI] [PubMed] [Google Scholar]
- Salinas Jennifer J, et al. Mexican Cultural Neighborhood Environment and Diabetes Risk in Mexican Americans. Hispanic Health Care International. 2012;10(3):146–53. [Google Scholar]
- Smith Ken R, et al. Effects of Neighborhood Walkability on Healthy Weight: Assessing Selection and Causal Influences. Social Science Research. 2011;40(5):1445–55. doi: 10.1016/j.ssresearch.2011.04.009. [DOI] [PMC free article] [PubMed] [Google Scholar]
- U.S. Census Bureau. Statistical Brief: Poverty Areas. Retrieved May 5, 2017 https://www.census.gov/population/socdemo/statbriefs/povarea.html.
- Viruell-Fuentes Edna A, Ponce Ninez A, Alegría Margarita. Neighborhood Context and Hypertension Outcomes Among Latinos in Chicago. Journal of Immigrant and Minority Health. 2012;14(6):959–67. doi: 10.1007/s10903-012-9608-4. [DOI] [PubMed] [Google Scholar]
- Wen Ming, Lauderdale Diane S, Kandula Namratha R. Ethnic Neighborhoods in Multi-Ethnic America, 1990–2000: Resurgent Ethnicity in the Ethnoburbs? Social Forces. 2009;88(1):425–460. [Google Scholar]
- Wen Ming, Maloney Thomas N. Latino Residential Isolation and the Risk of Obesity in Utah: The Role of Neighborhood Socioeconomic, Built-Environmental, and Subcultural Context. Journal of Immigrant and Minority Health. 2011;13(6):1134–41. doi: 10.1007/s10903-011-9439-8. [DOI] [PMC free article] [PubMed] [Google Scholar]
- Wen Ming, Zhang Xingyou, Harris Carmen D, Holt James B, Croft Janet B. Spatial Disparities in the Distribution of Parks and Green Spaces in the USA. Annals of Behavioral Medicine. 2013;45(Suppl 1):S18–27. doi: 10.1007/s12160-012-9426-x. [DOI] [PMC free article] [PubMed] [Google Scholar]
- White Kellee, Borrell Luisa N. Racial/ethnic Residential Segregation: Framing the Context of Health Risk and Health Disparities. Health & Place. 2011;17(2):438–48. doi: 10.1016/j.healthplace.2010.12.002. [DOI] [PMC free article] [PubMed] [Google Scholar]
- Williams DR, Collins C. Racial Residential Segregation: A Fundamental Cause of Racial Disparities in Health. Public Health Reports. 2001;116(5):404–16. doi: 10.1093/phr/116.5.404. [DOI] [PMC free article] [PubMed] [Google Scholar]
- Yang Tse Chuan, Zhao Yunhan, Song Qian. Residential Segregation and Racial Disparities in Self-Rated Health: How Do Dimensions of Residential Segregation Matter? Social Science Research. 2017;61:29–42. doi: 10.1016/j.ssresearch.2016.06.011. [DOI] [PMC free article] [PubMed] [Google Scholar]
Associated Data
This section collects any data citations, data availability statements, or supplementary materials included in this article.