

Summary
Elevated risk of developing Alzheimer’s disease (AD) is associated with hypomorphic variants of TREM2, a surface receptor required for microglial responses to neurodegeneration, including proliferation, survival, clustering and phagocytosis. How TREM2 promotes such diverse responses is unknown. Here, we find that microglia in AD patients carrying TREM2 risk variants and TREM2-deficient mice with AD-like pathology have abundant autophagic vesicles, as do TREM2-deficient macrophages under growth factor limitation or ER stress. Combined metabolomics and RNA-seq linked this anomalous autophagy to defective mTOR signaling, which affects ATP levels and biosynthetic pathways. Metabolic derailment and autophagy were offset in vitro through Dectin-1, a receptor that elicits TREM2-like intracellular signals, and cyclocreatine, a creatine analog that can supply ATP. Dietary cyclocreatine tempered autophagy, restored microglial clustering around plaques, and decreased plaque-adjacent neuronal dystrophy in TREM2-deficient mice with amyloid-β pathology. Thus, TREM2 enables microglial responses during AD by sustaining cellular energetic and biosynthetic metabolism.
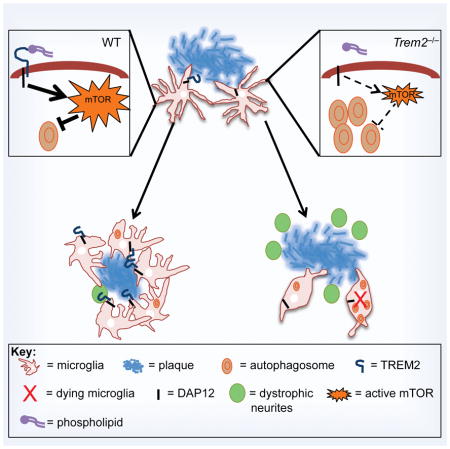
Graphical Abstract
The Alzheimer’s Disease risk factor TREM2 regulates microglial function through modulation of cellular biosynthetic metabolism.
Introduction
Alzheimer’s disease (AD) is the most common cause of late-onset dementia. AD lesions in the central nervous system (CNS) include plaques of amyloid β (Aβ) peptides and neurofibrillary tangles of hyperphosphorylated tau protein, both linked to synapse loss, neuronal death and ultimately cognitive decline (Holtzman et al., 2011; Huang and Mucke, 2012). Rare familial AD is due to mutations in amyloid precursor protein (APP) and presenilins (PS) that promote the generation of Aβ peptides prone to aggregation (Tanzi, 2012). However, the risk for common late-onset AD is associated with rare variants of immune receptors expressed on microglia (Guerreiro and Hardy, 2014; Tanzi, 2012). One of these receptors, TREM2, recognizes phospholipids, apoptotic cells and lipoproteins (Atagi et al., 2015; Bailey et al., 2015; Wang et al., 2015; Yeh et al., 2016). TREM2 transmits intracellular signals through two adapters, DAP12 and DAP10, which recruit protein tyrosine kinase Syk and phosphatidylinositol 3-kinase (PI3-K), respectively (Peng et al., 2010). Arginine-to-histidine variants at position 47 (R47H) or 62 (R62H) of TREM2 increase the risk for sporadic AD and impair binding to phospholipid ligands (Atagi et al., 2015; Bailey et al., 2015; Guerreiro and Hardy, 2014; Wang et al., 2015; Yeh et al., 2016). These variants, as well as TREM2 deficiency and haploinsufficiency in mouse models of AD, moderate microglial proliferation, survival and accumulation around Aβ plaques, thereby facilitating Aβ plaque buildup and injury of adjacent neurons (Jay et al., 2017; Ulrich et al., 2014; Wang et al., 2015; Wang et al., 2016; Yuan et al., 2016). TREM2 has also been implicated in microglial phagocytosis of dead neurons, damaged myelin and Aβ plaques (Neumann and Takahashi, 2007; Yeh et al., 2016). However, why defective TREM2 function or expression affects microglia responses to AD lesions is not known.
To address this question, we first used electron and confocal microscopy to analyze microglia from 5XFAD mice, which develop Aβ accumulation that mimics AD pathology due to the expression of mutant APP and PS1 under neural-specific elements of the mouse Thy1 promoter. Microglia from 5XFAD mice lacking TREM2 had many more autophagic vesicles than did microglia in 5XFAD mice. This observation was replicated in humans, as microglia in AD patients carrying TREM2 risk variants also had more autophagic vesicles than did microglia in AD patients with the common TREM2 variant. Autophagy is an intracellular degradation pathway essential for cellular and energy homeostasis (Galluzzi et al., 2014). It provides a mechanism for the elimination of misfolded proteins and damaged organelles and compensates for nutrient deprivation during cell starvation through recycling of cytosolic components. Because autophagy is partially regulated by mammalian target of rapamycin (mTOR)-dependent pathways (Saxton and Sabatini, 2017), we assessed the impact of TREM2-deficiency on mTOR activation and found that, indeed, anomalous autophagy reflected defective activation of mTOR signaling.
Similarly, enhanced autophagy was observed in TREM2-deficient macrophages in vitro, which was further amplified by growth factor limitation or ER stress; this provided a model system for probing biochemical and metabolic pathways in microglia during Aβ accumulation. Combined metabolomics, RNA-seq and system analyses of TREM2-deficient macrophages confirmed the impairment of mTOR activation, energetic pathways, ATP levels and biosynthetic pathways. Thus, TREM2 sustains cell energetic and biosynthetic metabolism through mTOR signaling. Metabolic derailment and autophagy were offset in vitro through activation of Dectin-1, a surface receptor that triggers a signaling pathway similar to that of TREM2–DAP12 (Dambuza and Brown, 2015). Metabolic abnormalities were also rescued by incubating cells with the creatine analog 1-carboxymethyl-2-iminoimidazolidine (cyclocreatine), which can passively cross membranes and, upon phosphorylation by creatine kinase, generate a supply of ATP for energy demands independent of the TREM2-mTOR axis (Kurosawa et al., 2012). Remarkably, dietary administration of cyclocreatine in 5XFAD mice lacking TREM2 prevented microglial autophagy, enhanced microglia numbers and clustering around Aβ plaques, and mitigated plaque-associated neurite dystrophy. This provides proof of principle that strategies aimed at sustaining basic microglial metabolism may be promising for treatment of AD and other neurodegenerative diseases associated with microglial dysfunction.
Results
Defect in TREM2 elicits autophagy in vivo in the 5XFAD mouse model and AD patients
To determine the impact of TREM2 deficiency on microglia function, we examined the structure of microglia from the 5XFAD mouse model of AD by transmission electron microscopy (TEM). Strikingly, microglia from Trem2−/− 5XFAD mice contained abundant multivesicular/multilamellar structures suggestive of autophagosomes, which were largely absent in microglia from 5XFAD, Trem2−/− or wild-type (WT) mice (Fig. 1A, B). To determine whether these structures reflected ongoing autophagy in situ, we examined brain sections by confocal microscopy for the presence of LC3+ puncta, which denote autophagosomes decorated by lipidated LC3II (Klionsky et al., 2016). Many large LC3+ puncta were evident in microglia in Trem2−/− 5XFAD mice, whereas LC3+ puncta were sparse in microglia in WT, Trem2−/−, and 5XFAD mice (Fig. 1C, D and Fig. S1). These observations were translatable to human disease. We observed dramatically more LC3+ microglia in post-mortem brain sections from both R47H and R62H heterozygous AD patients than in those from case-matched AD patients homozygous for the common TREM2 variant (Fig. 1E, F, Table 1). Taken together, these data suggest that autophagic-like vesicles accumulate in the microglia of TREM2-deficient mice and humans with TREM2 risk alleles during the development of AD.
Figure 1. Defect in TREM2 enhances autophagy in vivo in the 5XFAD mouse model and in AD patients.

(A) TEM images of microglia (CD45+, CD11b+, F4/80+ cells) sorted from 8-month-old WT, Trem2−/−, 5XFAD, and Trem2−/− 5XFAD mice.
(B) Average number of multivesicular and multilamellar structures/cell (30 cells analyzed/genotype).
(C) Confocal images of plaque bearing regions of the cortex (1.1 mm Bregma to 0.8 mm Bregma) of 8-month-old WT, Trem2−/−, 5XFAD, and Trem2−/− 5XFAD mice show Iba-1+ microglia (red), methoxy X04+ plaques (blue), and LC3 (green). Z-stacks composed of ~30 images taken at 1.2 μm intervals were analyzed. Results are reported as an average of 2 regions of interest (ROI) analyzed.
(D) Quantification of the % of microglia that are positive for LC3 puncta. ~150–400 microglia/HPF were analyzed depending on the genotype of the animal.
(E) Confocal images of sections from post-mortem brains of R47H+ AD patients and case-matched controls (CV, common variant of TREM2) show Iba-1+ microglia (red), methoxy X04+ plaques (blue), and LC3 (green). 3 ROIs/donor were analyzed and between 400 and 700 microglia/individual were analyzed.
(F) Percentages of LC3+ microglia in post mortem specimens of AD patients with different genotypes.
*** p<0.005, ****p<0.001 by One-way ANOVA with Holm-Sidak’s multiple comparisons test. 15 cells from 2 separate mice were visualized for TEM (A, B). Confocal images are representative of 3 female mice per group (C, I) or 7 R47H, 4 R62H, and 8 case matched AD patients for post-mortem specimens (E). Immunoblots are representative of 3 independent experiments from microglia from 3 separate mice per group (G). Arrowheads indicate multilamellar and multivesicular structures (A) or LC3+ vesicles (C, E, I). See also Figure S1 and Table S1.
TREM2 deficiency impairs mTOR signaling and enhances AMPK activation in microglia
To corroborate the association between TREM2 deficiency and increased autophagy, we performed biochemical analyses on sorted microglia ex vivo. The ratio of lipidated LC3II to non-lipidated LC3I was markedly higher in microglia from Trem2−/− 5XFAD mice than in microglia from 5XFAD mice, consistent with the increased number of autophagic vesicles in TREM2-deficient microglia (Fig. 2A, B). To determine whether the increase in autophagosomes was due to activation of autophagy or blockade of lysosomal degradation, we measured protein and mRNA levels of p62, an autophagy cargo protein that is digested by lysosomal enzymes. The amount of p62 protein was lower in microglia from Trem2−/− 5XFAD mice than in microglia from 5XFAD mice. This difference was unrelated to transcription, as p62 (Sqstm1) mRNA levels were similar (Fig. 2A and Fig. S2A). Thus, TREM2 deficiency results in bona fide autophagy.
Figure 2. Defect in TREM2 impairs mTOR activation and elicits AMPK activation, autophagy and cell death in microglia from 5XFAD mice.

(A) Microglia were sorted as in Figure 1A. Immunoblots for LC3I/II, p62, phospho-Akt (serine 473), phospho-AMPK, phospho-NDRG1, phospho-4EBP1, phospho-ULK1 (serine 757), and β-actin were performed on cell lysates.
(B) Quantification of the LC3II/I ratio in microglia from different genotypes.
(C) Single cell suspensions of brain tissue were incubated with MitoTraker Green and stained for CD45+, CD11b+, F4/80+. Representative histograms comparing unstained 5XFAD microglia and stained 5XFAD and Trem2−/− 5XFAD microglia are shown.
(D) Quantification of the geometric mean fluorescence intensity (gMFI) of microglia from 3 mice of each genotype is shown.
(E) Confocal images of brain sections of 8 month-old WT, Trem2−/−, 5XFAD, and Trem2−/− 5XFAD mice were taken as in Fig. 1C. Images depict Iba-1+ microglia (red), methoxy X04+ plaques (blue), and cleaved caspase-3 (green).
(F) Quantification of the % of LC3+ microglia that are positive for cleaved caspase-3.
****p<0.001 by One-way ANOVA with Holm-Sidak’s multiple comparisons test (B and F). ** p<0.01 by Student’s T test (D). Immunoblots are representative of 3 independent experiments from microglia from 3 separate mice per group (A). Confocal images are representative of 3 female mice per group (E). See also Figure S2.
Why is autophagic flux amplified in 5XFAD mice lacking TREM2? Autophagy often reflects an adaptive response to stress that can occur when cells cannot satisfy increased demands for energy and protein synthesis (Kroemer et al., 2010). Since the serine/threonine kinase target of rapamycin (mTOR) has a crucial role in stimulating both energetic and anabolic metabolism, cell growth and proliferation (Laplante and Sabatini, 2012), we hypothesized that the autophagy observed in microglia in Trem2−/− 5XFAD mice might result from a defect in mTOR signaling. mTOR signals through two distinct complexes, mTORC1 and mTORC2. Immunoblotting of sorted microglia from Trem2−/− 5XFAD and 5XFAD mice revealed decreased phosphorylation of 4EBP1, an mTORC1 effector, as well as Akt (serine 473) and NDRG1, both mTORC2 effectors, in the TREM2-deficient microglia (Fig. 2A). Ulk1, a key inducer of autophagy, which is inhibited by mTOR signaling through phosphorylation at serine 757 (Kim et al., 2011), was less phosphorylated in microglia from Trem2−/− 5XFAD mice, consistent with reduced mTOR activation and increased autophagy (Fig. 2A). Impaired mTOR signaling was associated with phosphorylation of AMP-activated protein kinase (AMPK), a sensor of low energy states (Fig. 2A).
Providing further evidence for defective energetic and anabolic metabolism associated with TREM2 deficiency, microglia from Trem2−/− 5XFAD mice had a lower mitochondrial mass than did microglia from 5XFAD mice (Fig. 2C, D). Furthermore, gene expression microarray analyses of sorted microglia from Trem2−/− 5XFAD and 5XFAD mice revealed that TREM2 deficiency was associated with decreased expression of genes encoding translation initiation factors, ribosomal proteins, glucose transporters, glycolytic enzymes, as well as the transcription factor HIF1α that controls glycolysis (Fig. S2B–G). Taken together, these data demonstrate that during the development of AD, TREM2 deficiency derails the mTOR pathway, anabolic and energetic metabolism in microglia, which induces compensatory autophagy in both mice and humans.
To determine whether autophagy in TREM2-deficient microglia can effectively compensate for the metabolic defects in vivo and prevent apoptosis, we examined brain sections by confocal microscopy for the presence of cleaved caspase-3, an indicator of apoptosis. We found that cleaved caspase-3 was much more abundant in microglia in Trem2−/− 5XFAD mice than in microglia in 5XFAD mice (Fig. 2E, F). Additionally, the percentage of microglia with colocalization of cleaved caspase-3 and LC3+ puncta was higher in Trem2−/− 5XFAD mice than in 5XFAD mice (Fig. S2H, I). Thus, autophagy may not be sufficient to sustain the microglial response to stress, at least at the late time point of disease progression analyzed.
Macrophages lacking TREM2 inadequately signal through mTOR and undergo more autophagy
We then asked whether TREM2-deficiency could derail mTOR signaling in bone marrow-derived macrophages (BMDMs) in vitro. To mimic the metabolic stress that occurs during disease, we used growth factor deprivation. BMDMs were cultured overnight in concentrations of CSF1-containing L cell-conditioned medium (LCCM) ranging from optimal to limiting (10% to 0.5%). Trem2−/− BMDMs contained more autophagic vesicles (Fig. 3A, B) and had a higher LC3II/LC3I ratio than did WT cells when CSF1 was limiting (Fig. 3C). Addition of the lysosomal inhibitor bafilomycin greatly increased LC3II in Trem2−/− BMDMs, confirming that the increase in autophagosomes was due to increased autophagic flux rather than reduced autophagosome degradation (Fig. 3D, E).
Figure 3. TREM2 deficiency affects mTOR signaling and induces autophagy in BMDM.

(A) TEM images of WT and Trem2−/− BMDM cultured overnight in either in 10% or 0.5% LCCM as source of CSF1.
(B) Number of multivesicular structures/cell observed in the TEM images. 30 cells/genotype and condition were analyzed.
(C) Quantification of the LC3II/LC3I ratio in BMDMs from WT and Trem2−/− mice cultured in 10% or 0.5% LCCM overnight or starved in HBSS for 4 hours prior to lysis.
(D) Immunoblots for LC3 and actin performed on lysates from WT and Trem2−/− BMDMs cultured in 10% or 0.5% LCCM overnight. Cell were treated with bafilomycin for 5 hours prior to harvest at a final concentration of 0.5 μg/ml
(E) Quantification of LC3II/LC3I ratio in BMDMs from WT and Trem2−/− mice treated as indicated.
(F–H) Immunoblots for phosphorylated Akt (serine 473), NDRG1, S6K, 4EBP1, (F), AMPK, (G), Ulk1 (serine 317 and serine 757) (H) and relative controls. Lysates were from WT and Trem2−/− BMDM cultured overnight in 10% or 0.5% LCCM
(I) Immunoblots for phosphorylated Akt (serine 473), NDRG1, S6K, 4EBP1, mTOR, total S6K, Akt, and actin performed on lysates from WT and Trem2−/− BMDMs cultured overnight in 10% or 0.5% LCCM followed by the addition of wortmannin for 3 hours prior to harvest.
(J, K) Immunoblots for LC3 and phosphoserine 473 Akt in WT and Trem2−/− BMDM cultured in 10% LCCM with the indicated concentration of tunicamycin. Bar graph shows LC3II/LC3I ratios.
Error bar represents mean ± SEM. *p<0.05, **p<0.01, or ****p<0.001 by One-way ANOVA with Holm-Sidak’s multiple comparisons test (B, C, E, K). Data are representative of at least 3 independent experiments. Arrowheads indicate multilamellar and multivesicular structures (A). See also Figure S3.
As observed in sorted microglia, autophagy in BMDMs was linked to impaired mTOR signaling. Trem2−/− BMDMs had less phosphorylated 4EBP1, Akt (serine 473) and NDRG1 (Fig. 3F) and more phosphorylated AMPK (Fig. 3G) in both optimal CSF1 and limiting CSF1 than did WT BMDMs. In limiting CSF1, Trem2−/− BMDMs had decreased inhibitory phosphorylation of Ulk1 at serine 757, while activating phosphorylation of Ulk1 at serine 317 increased (Fig. 3H). Thus, lack of TREM2 suppressed mTOR activation and elicited compensatory AMPK and Ulk1 activation and autophagy in BMDMs in response to metabolic stress, very similar to our observations of microglia in 5XFAD mice.
As TREM2 signaling adapters DAP12 and DAP10 have been shown to activate PI3-K, which in turn can activate mTOR, we asked whether enhanced mTOR signaling in WT BMDM compared to Trem2−/− BMDM was dependent on PI3-K. Inhibition of PI3-K with wortmannin or LY294002 caused a major reduction in phosphorylation of mTOR and its downstream targets in WT BMDMs; the residual amount of phosphorylation was similar to that seen in Trem2−/− BMDMs (Fig. 3I and S3A). In addition to limiting CSF1, other stressors may differentially modulate mTOR signaling and autophagy in WT and Trem2−/− BMDMs. Treatment with tunicamycin, which provokes endoplasmic reticulum (ER) stress, unfolded protein response and autophagy, induced greater LC3II/LC3I ratios and less phosphorylated Akt (serine 473) in Trem2−/− BMDMs than in WT BMDMs (Fig. 3J, K). Thus, TREM2 deficiency affects cell responses to multiple stressors.
TREM2 signaling may not just have a more pronounced effect on cells under stress conditions, but may actually increase under such conditions. When cultured in media containing 10% FBS, TREM2 reporter cells, which express GFP upon TREM2 engagement (Wang et al., 2015), showed some activation (Fig. S3B). However, upon serum starvation, a significantly higher proportion of reporter cells became activated, possibly due to exposure of the TREM2 ligand phosphatidylserine on the outer leaflet of stressed cells. This activation could be blocked by inclusion of an anti-TREM2 antibody. Thus, in multiple in vitro settings of stress, TREM2-expressing cells are more able to sustain mTOR activation and suppress autophagy in a PI3-K-dependent manner than are cells lacking TREM2.
TREM2 deficiency curtails anabolic and energetic metabolism in BMDMs
To directly demonstrate the impact of TREM2 deficiency on energetic and anabolic pathways in BMDMs, we performed mass spectrometry to quantify cellular metabolites, and RNA sequencing (RNA-seq) to quantify mRNA levels of metabolic enzymes. Analysis of metabolite data alone, or in combination with RNA-Seq data by a systems-based algorithm (Sergushichev et al., 2016), revealed widespread differences between WT and Trem2−/− BMDMs in various metabolic pathways. Compared to WT BMDMs in optimal CSF1, Trem2−/− BMDMs cultured under the same conditions exhibited: 1) a marked decrease of key intermediates in the synthesis of nucleotides (e.g. phosphoribosyl pyrophosphate), N-glycosylated proteins (e.g. UDP-glucose), and phospholipids (e.g. CDP-ethanolamine); 2) a decrease in glycolytic metabolites (e.g. glucose 6-phosphate and fructose bisphosphate) and tricarboxylic acid (TCA) cycle intermediates (citrate and succinate); and 3) an increase in catabolic products of amino acids (e.g. indolacetate) and phospholipids (e.g. glycerol 3-phosphate) (Fig. 4A, Fig. S4A). Moreover, a selective increase in malate and fumarate suggested an enhanced malate-aspartate shuttle to sustain defective NADH oxidation and NAD regeneration (Fig. 4A). Unbiased network analysis combining metabolic and RNA-seq data highlighted defects in metabolites and enzymes involved in glycolysis, TCA cycle and pentose phosphate pathway in Trem2−/− BMDMs (Fig. 4B).
Figure 4. TREM2 deficiency reduces anabolic and energetic metabolism in BMDM.

(A) Top most changed metabolites between WT and Trem2−/− BMDM cultured overnight in 10% LCCM. Defined as p≤0.01 and identified in the mouse metabolic network analysis in B.
(B) Shiny-genes and metabolites (GAM) output for network analysis combining mass spectrometry and RNA-seq data highlights differences between WT and Trem2−/− BMDM cultured in 10% LCCM. Enzyme-encoding mRNAs and metabolites downregulated or upregulated in Trem2−/− cells vs WT cells are indicated with green or red nodes and connectors, respectively.
(C) Top most changed metabolites between WT and Trem2−/− BMDM cultured in 0.5% LCCM. Defined as p≤0.01 and identified in the mouse metabolic network analysis in Fig. S4C.
(D) ATP content of WT and Trem2−/− BMDM cultured in the indicated concentration of LCCM overnight.
(E) Extracellular acidification rate (ECAR) and baseline oxygen consumption rate (OCR) by WT and Trem2−/− BMDM cultured overnight in the indicated concentration of LCCM.
(F, G) Mitochondrial mass of WT and Trem2−/− BMDM assessed by Mito Tracker Green incorporation (F) and by the ratio of mitochondrial-to nuclear DNA (G).
Error bar represents mean ± SEM. *p<0.05, ** p<0.01, or ****p<0.001 by One-way ANOVA with Holm-Sidak’s multiple comparisons test (C) or Student’s T test (F, G). Data are representative of at least 3 independent experiments. See also Figure S4.
CSF1 reduction further deteriorated energy and anabolic metabolism in Trem2−/− BMDMs. Under these conditions, again in comparison to WT BMDMs, Trem2−/− BMDMs underwent a marked increase in symmetrical dimethyl arginine, indicative of protein catabolism, as well as an increase in ADP-ribose, indicative of NAD degradation (Fig. 4C, Fig. S4B,C). Furthermore, stores of high-energy phosphates, such as phosphocreatine and ATP, were depleted in Trem2−/− BMDMs cultured in limiting CSF1 conditions (Fig. S4D). A luciferase-based ATP assay confirmed an ATP deficiency in Trem2−/− BMDMs, which was exacerbated at low CSF1 concentrations (Fig. 4D). We further assessed the energy metabolism of WT and Trem2−/− BMDMs using the Seahorse analyzer. A lower extracellular acidification rate (ECAR), indicative of less glycolytic flux, was noted in Trem2−/− BMDMs both at baseline and after induction of maximal glycolytic capacity by oligomycin and FCCP. This deficit widened relative to WT cells as the CSF1 concentration was reduced (Fig. 4E). Trem2−/− BMDMs had only a slightly reduced oxygen consumption rate (OCR) compared to WT BMDMs when cultured in standard CSF1 concentrations, indicating relatively intact oxidative phosphorylation; however, a deficit in OCR emerged as the CSF1 concentration was reduced (Fig. 4E). Trem2−/− BMDMs also had fewer mitochondria than WT BMDMs on a per cell basis as measured by MitoTracker Green fluorescence and by the mitochondrial-to-nuclear DNA ratio (Fig. 4F, G). These findings were not restricted to BMDMs, as resting and thioglycolate-elicited peritoneal TREM2-deficient macrophages also had a lower mitochondrial mass than did WT macrophages (Fig. S4E–H). Cultured adult primary Trem2−/− microglia recapitulated the deficiencies in energetic metabolism and mTOR signaling as well as autophagy observed in Trem2−/− BMDMs (Fig. S4I–M). Thus, lack of TREM2-mTOR signaling impairs the energy status and anabolism of BMDMs and other primary macrophages both in steady state and under energetic stress.
Enhanced energy storage or Dectin-1 signaling can compensate for TREM2 deficiency in vitro
Given the dramatic effect of TREM2 deficiency on mTOR activation and energy utilization in BMDMs, we tested whether bypassing TREM2 and directly compensating for these deficits by alternative means could restore the cellular energy status of Trem2−/− BMDMs. Muscle physiology studies have extensively demonstrated that creatine phosphate contributes to the regeneration of ATP and to the maintenance of uniformly high ATP/ADP ratios in muscle fibers (Walker, 1979). Moreover, the creatine analog 1-carboxymethyl-2-iminoimidazolidine (cyclocreatine) can, upon phosphorylation, generate a long-acting phosphagen that can effectively sustain cellular ATP levels during increased energy demand (Kurosawa et al., 2012; Woznicki and Walker, 1979). Thus, we tested whether addition of cyclocreatine to the culture medium could rescue energetic metabolism in Trem2-deficient BMDMs. Indeed, incubation with cyclocreatine improved ECAR, which was accompanied by less autophagy, increased mTOR signaling and cell viability (Fig. 5A–C and data not shown).
Figure 5. Enhanced energy storage or dectin-1 signaling can compensate for TREM2 deficiency.

(A) ECAR of WT and Trem2−/− BMDM incubated overnight in 0.5% LCCM ± 10 mM cyclocreatine.
(B) Viability of WT and Trem2−/− BMDM incubated for 40 hours in 0.5% LCCM ± cyclocreatine.
(C) Immunoblots of LC3, phosphorylated mTOR, phosphorylated Akt (serine 473), and actin in WT and Trem2−/− BMDM incubated overnight in 0.5% LCCM ± 5 mM cyclocreatine.
(D, F) LC3, phosphoserine 473 Akt, p62, and actin immunoblots from WT and Trem2−/− BMDM incubated overnight in the indicated concentration of LCCM ± depleted zymosan.
(E) Quantification of the LC3II/LC3I ratio derived from immunoblots of LC3 as shown in D.
(G) ATP content of WT and Trem2−/− BMDM cultured in the indicated concentration of LCCM ± zymosan overnight.
*p<0.05 or ****p<0.001 by One-way ANOVA with Holm-Sidak’s multiple comparisons test (B, E, G). Data are representative of results from at least 3 independent experiments.
To test whether engagement of receptors that elicit signaling pathways similar to those of TREM2 could also mitigate autophagy and support cell survival, Trem2−/− and WT BMDMs were cultured with depleted zymosan, a selective ligand of Dectin-1, which activates Syk and PI3-K signaling independent of DAP12 (Dambuza and Brown, 2015). Dectin-1 activation curbed autophagy in CSF1-starved TREM2-deficient BMDMs to levels seen in WT BMDMs in low CSF1, as indicated by a reduction in the LC3II/LC3I ratio (Fig. 5D, E) along with increased amounts of p62 (Fig. 5F). Treatment with zymosan also enhanced cellular ATP levels in Trem2−/− BMDMs, restoring them to WT BMDM levels (Fig. 5G). Thus, alternative energetic and signaling pathways can compensate for lack of TREM2 signaling.
Cyclocreatine rescues microgliosis and clustering and moderates neurite dystrophy in vivo
Since cyclocreatine rescued metabolism and viability and suppressed autophagy in Trem2−/− BMDMs in vitro and given previous studies showing that cyclocreatine is passively transported across membranes and can accumulate and function as a phosphagen in the mouse brain in vivo (Kurosawa et al., 2012), we asked whether dietary supplementation with cyclocreatine could rescue microglial function and suppress autophagy in vivo in Trem2−/− 5XFAD mice. The drinking water of 5XFAD and Trem2−/− 5XFAD mice was supplemented with cyclocreatine from 10 weeks of age until 8 months of age. Remarkably, significantly fewer multivesicular/multilamellar structures were seen by TEM in microglia of Trem2−/− 5XFAD mice treated with cyclocreatine than in microglia of untreated mice (Fig. 6A, B). Confocal microscopy corroborated that cyclocreatine treatment ameliorated many autophagy and viability parameters in Trem2−/− 5XFAD mice, such as the number of LC3 puncta/high powered field (HPF) (Fig. 6C, D), the percentage of LC3+ microglia (Fig. S5A), and the percentage of cleaved caspase-3+ microglia (Fig. 6E), although others parameter did not reach statistical significance (Fig. S5B–D). Furthermore, clustering of microglia around plaques (Fig. 6C, F) and the number of microglia/HPF in plaque-bearing regions of the cortex (Fig. S5E) were both significantly increased in Trem2−/− 5XFAD mice treated with cyclocreatine compared to untreated Trem2−/− 5XFAD mice. These findings indicate that dietary supplementation with cyclocreatine is sufficient to partially rescue the defect in microgliosis and microglial clustering around plaques in Trem2−/− 5XFAD mice, while concomitantly mitigating autophagy and death of the microglia.
Figure 6. Enhanced Energy Storage Can Correct Microglial Defects in TREM2-deficent 5XFAD Mice.

(A) TEM images of microglia sorted from 8-month-old 5XFAD, and Trem2−/− 5XFAD mice ± cyclocreatine.
(B) Quantification of the number of multivesicular and multilamellar structures/cell from A.
(C) Confocal images of brain sections of 8-month-old 5XFAD, and Trem2−/− 5XFAD mice ± cyclocreatine show Iba-1+ microglia (red), methoxy X04+ plaques (blue), and LC3 (green).
(D) Quantification of the number of LC3 puncta per HPF in the cortexes of the indicated mice.
(E) Quantification of the percentage of microglia that were cleaved caspase-3 positive from the indicated mice.
(F) Clustering analysis quantifying the number of microglia per mm3 within 15 μm of the surface of plaques.
*p<0.05, ***p<0.005 and ****p<0.001 by One-way ANOVA with Holm-Sidak’s multiple comparisons test (B, D–F) results pooled from 2 independent experiments representing a total of 5–8 male and female mice per treatment group. Arrowheads indicate multilamellar and multivesicular structures (A) or LC3+ vesicles (C). See also Figure S5.
To assess the impact of cyclocreatine on microglial activation, which is also impaired in Trem2−/− 5XFAD mice, we quantified the percentage of microglia that expressed the activation marker osteopontin (Spp1), a protein that, in the brain, is upregulated in microglia in the context of Aβ deposition (Orre et al., 2014; Wang et al., 2015). Untreated Trem2−/− 5XFAD mice had very few Spp1+ microglia, while cyclocreatine-treated Trem2−/− 5XFAD mice had significantly more Spp1+ microglia, as did TREM2-sufficient 5XFAD mice (Fig. 7A, B). Moreover, biochemical analysis of microglia isolated ex vivo demonstrated that cyclocreatine treatment of Trem2−/− 5XFAD mice also restored microglial mTOR signaling and limited autophagy compared to untreated Trem2−/− 5XFAD mice (Fig. 7C, D).
Figure 7. Energy Supplementation Can Offset Neuronal Damage in TREM2 Deficient 5XFAD mice.

(A) Representative images depicting plaques (X04 in blue), nuclei (To-Pro3 in white), microglia (Iba-1 in red), and Spp1 (in green) staining in cortexes of mice from the indicated genotypes.
(B) Quantification of the percentage of microglia that were Spp1+ in the indicated genotypes of mice. Confocal images were taken as in Figure 1C.
(C) Immunoblots performed on lysates of microglia sorted from the indicated genotype and treatment group of mice. Immunoblots for phosphorylated Akt (serine 473), NDRG1, total LC3, Akt, and actin.
(D) Quantification of the LC3II/LC3I ratio observed in immunoblots from 3 mice of each of the indicated genotypes and treatment groups.
(E) Average intensity of the plaques observed in the cortexes of mice from the indicated genotypes and treatment groups.
(F) Representative images depicting plaques (X04 in blue), nuclei (To-Pro3 in white), and N-terminus APP (green) from the indicated mice and treatment groups. Confocal images were taken as in Figure 1C.
(G) Quantification of the number of dystrophic neurites/plaque in the indicated mice and treatment group.
N.S. indicates not significant, *p<0.05, and ****p<0.001 by One-way ANOVA with Holm-Sidak’s multiple comparisons test (A, C, D, F) results pooled from 2 independent experiments representing a total of 5–8 male and female mice per treatment group. See also Figure S5.
As a major function of TREM2 in vivo is enabling microglia to form a barrier around plaques that prevents spreading of Aβ fibrils and alleviates dystrophy of plaque-adjacent neurites (Wang et al., 2016; Yuan et al., 2016), we asked whether cyclocreatine treatment of Trem2−/− 5XFAD mice impacted plaque morphology and/or neuronal dystrophy. While plaques in untreated Trem2−/− 5XFAD mice had a lower density than those in 5XFAD mice as measured by methoxy-X04 staining intensity, the density of plaques in cyclocreatine treated Trem2−/− 5XFAD mice resembled that of plaques in 5XFAD mice (Fig. 7E), although plaque shape complexity was not significantly altered (Fig. S5F). Despite reducing plaque density, cyclocreatine did not moderate plaque accumulation or the engulfment of plaque particulates by microglia, at least at this time point (Fig. S5G–I). As APP is known to accumulate as distinct rounded particles in dystrophic neurites, we used APP deposition around plaques to assess neurite dystrophy (Masliah et al., 1996; Wang et al., 2016; Yuan et al., 2016). Cyclocreatine treatment of Trem2−/− 5XFAD mice significantly reduced plaque-associated neurite dystrophy compared to untreated Trem2−/− 5XFAD mice to levels observed in 5XFAD mice (Fig. 7F, G). Taken together, these data indicate that cyclocreatine administration improves microglial metabolism and the protective response to Aβ plaques in TREM2-deficient 5XFAD mice.
Discussion
Increasing evidence supports the hypothesis that the microglial response to AD lesions controls disease progression (Gold and El Khoury, 2015; Hong et al., 2016; Meyer-Luehmann and Prinz, 2015; Perry and Holmes, 2014; Tejera and Heneka, 2016; Wang et al., 2016; Yuan et al., 2016). Toll-like receptors and NOD-like receptors have been previously implicated in the microglia response to Aβ accumulation and shown to mediate an inflammatory response that contributes to pathology (Freeman and Ting, 2016; Heneka et al., 2015; Heneka et al., 2013). To sustain cytokine secretion, these receptors induce a striking metabolic reprogramming, which consists of a switch from fatty acid metabolism and oxidative phosphorylation to glycolysis (O’Neill and Pearce, 2016). In our study, TREM2 emerges as an innate immune receptor that impacts microglia metabolism in AD through a distinct mechanism, which consists of basic activation of mTOR signaling that supports long-term cell trophism, survival, growth, and proliferation, rather than drastic metabolic reprogramming. This function of TREM2 is reminiscent of the tonic function of the B cell antigen receptor in mature B cells, which delivers survival signals through PI3-K (Werner et al., 2010). Likewise, cell membrane phospholipids and lipoprotein particles may continuously engage TREM2, inducing tonic mTOR signaling through upstream activators, such as PI3-K, PDK1 and Akt, which are recruited by the TREM2-associated signaling subunits DAP12 and DAP10 (Ford and McVicar, 2009; Peng et al., 2010). This concept provides a unifying mechanism to explain the reported broad and long-term impact of TREM2 on diverse microglial functions, such as survival, proliferation, clustering around plaques, as well as phagocytosis of apoptotic cells and myelin debris (Jay et al., 2017; Neumann and Takahashi, 2007; Wang et al., 2015; Yeh et al., 2016; Yuan et al., 2016).
We found that the defective mTOR signaling in TREM2-deficient microglia is associated with a compensatory increase of autophagy in vitro and in vivo in AD. Reduced glycolysis and autophagy are known to attenuate inflammation (Netea-Maier et al., 2016) and, indeed, microglia from 5XFAD mice lacking TREM2 weakly express inflammatory mediators in comparison to microglia from 5XFAD mice (Wang et al., 2015). Moreover, autophagy may also enhance microglial clearance of Aβ (Cho et al., 2014; Lucin et al., 2013; Shibuya et al., 2014), as it does in neurons (Hara et al., 2006; Komatsu et al., 2006; Yang et al., 2011). However, a long-term defect in mTOR activation results in global microglial dysfunction, reduced cell viability and proliferation, as demonstrated by increased caspase-3 activation in microglia and by the previously reported increase in dying microglia around plaques in Trem2−/− 5XFAD mice (Wang et al., 2015). Thus, while increased autophagy may be beneficial in reducing inflammation and Aβ load in the short-term, a defect in mTOR signaling is detrimental and severely impairs microglia fitness and capacity to respond to Aβ accumulation in the long-term.
TREM2-deficient microglia have been thought to improperly remain in a homeostatic state during neurodegenerative disease rather than responding appropriately to pathology, a paradigm that has been supported by transcriptomic analysis of these cells. However, for the first time, we demonstrate that on a biochemical and ultrastructural level, TREM2-deficient microglia adopt a severely divergent cellular state that does not reflect homeostasis during neurodegeneration, with a dramatic loss of mTOR signaling and robust induction of autophagy. These results suggest that TREM2-deficient microglia are not simply ignoring plaque pathology, but rather that they are being actively driven into a stressed state that is normally compensated by TREM2-dependent survival signals. An important implication of this finding is that microglia in a neurodegenerative environment probably receive not only positive activating signals but also negative cytotoxic signals. Thus, it may not be microglial activation per se that is required to protect against neurodegeneration, but rather avoidance of a dysfunctional, low-energy state induced by the disease. Based on our findings, previous reports of impaired microglial activation in a variety of settings may be due to either impaired recognition of activating signals or to impaired resistance to cytotoxic signals - two possibilities that can be distinguished by the strength of mTOR signaling. Counteracting such dysfunction by metabolic compensation may also represent a fundamentally distinct therapeutic approach.
Along these lines, our study shows that the defect in mTOR-mediated metabolic activation in TREM2-deficient cells can be corrected in vitro through the creatine kinase pathway or by triggering the Dectin-1 pathway, which transmits intracellular signals similar to those of TREM2. Based on these results, we adopted a therapeutic strategy based on the use of cyclocreatine, an analog of creatine that crosses membranes, enters the brain (Woznicki and Walker, 1979), can be phosphorylated and dephosphorylated by creatine kinases (McLaughlin et al., 1972), and can generate a supply of ATP (Kurosawa et al., 2012). Remarkably, we found that administration of dietary cyclocreatine throughout the progression of Aβ accumulation improves microglia viability, numbers and clustering around Aβ plaques. As a result, plaques are denser and, most importantly, plaque-associated neurite dystrophy is greatly reduced. Although cyclocreatine treatment was not sufficient to reduce the overall Aβ plaque accumulation, this may depend on time point chosen for analysis and/or cyclocreatine dosage and duration of treatment. While the creatine kinase pathway has been previously recognized to play an important role in the CNS in neurotransmitter release, membrane potential maintenance, Ca2+ homeostasis, and ion gradient restoration (Snow and Murphy, 2001; Wyss and Kaddurah-Daouk, 2000), our results indicate that this system may also be exploited for sustaining microglial metabolism. It should be noted that in certain settings cyclocreatine can inhibit creatine kinase and can also have systemic effects such as alteration in pancreatic hormones and glucose metabolism (Ara et al., 1998; Kuiper et al., 2008). Thus, it must be emphasized that our findings provide proof of principal studies and the use of cyclocreatine as a preventative treatment for AD is not advisable. Future studies will be required to precisely define the mechanisms through which cyclocreatine impacts microglial responses to Aβ.
Additionally, it will be important to determine whether cyclocreatine has any impact on proteolytic shedding of TREM2 from microglia, which results in the release of soluble TREM2 with potential pro-survival functions. Altogether, our study provides indicates that strategies aimed at sustaining microglial metabolism may be promising for therapeutic intervention in AD and other neurodegenerative diseases linked to TREM2 deficiency and microglial dysfunction in general.
CONTACT FOR REAGENT AND RESOURCE SHARING
Further information and requests for resources and reagents should be directed to and will be fulfilled by the Lead Contact, Dr. Marco Colonna (mcolonna@wustl.edu).
EXPERIMENTAL MODEL AND SUBJECT DETAILS
Mice
Mice were of mixed sexes. Mice within experiments were age and sex matched. For studies using 5XFAD and Trem2−/− 5XFAD animals all animals were 8 months of age at the time of use. For bone marrow and primary microglia mice were used from 6 weeks of age until 12 weeks of age. Mice used in this study include WT C57BL/6J, 5XFAD, Trem2−/−, and Trem2−/− 5XFAD animals. All animals were backcrossed until at least >98% C57BL/6J confirmed by genotype wide microsatellite typing. Mice were housed under specific pathogen free conditions. Mice from different genotypes were cohoused. Mice did not undergo any procedures prior to their stated use. For cyclocreatine treatment mixed litters of sex matched mice were randomly assigned to experimental groups. All studies performed on mice were done in accordance with the Institutional Animal Care and Use Committee at Washington University in St. Louis approved all protocols used in this study.
Human post-mortem samples
Characteristics of donors of human post-mortem brain tissue at the time of collection is indicated in Table S1. Samples from 7 R47H, 4 R62H, and 8 case matched AD patients were examined. Samples were obtained from the Knight Alzheimer’s Disease Research Center at Washington University. Protocol numbers: Healthy Aging and Senile Dementia (HASD) Morphology Core: 89-0555 and Program Project: Alzheimer’s Disease Research Center (ADRC): 89-0556.
Cell lines and primary cells
Bone marrow derived macrophages and microglia were prepared from sex and age matched mice. To prepare bone marrow-derived macrophages, femurs and tibias were removed and flushed with PBS. Cells were counted and plated at 2.5 × 10⁶ cells/100 mm petri dish in RPMI supplemented with Glutamax, penicillin/streptomycin, non-essential amino acids, pyruvate, and 10% heat inactivated fetal bovine serum (complete RPMI) and 10% L-cell conditioned medium (LCCM). Cells were cultured for 4–5 days before use. Microglia were prepared as previously described (Wang et al., 2015). Briefly, brains were dissociated by using a Neural Tissue Dissociation Kit (T) (Miltenyi Biotech Cat. Number 130-093-231). Cells suspensions were labeled with anti-mouse CD45 magnetic beads and isolated on LS columns (Miltenyi Biotic). Cells were plated onto poly-L-lysine coated polystyrene plates in complete RPMI supplemented with 20% LCCM and 10 ng/ml human TGF-β. Media was changed on day 3 post plating and cells were used 5–7 days post plating.
Trem2 reporter cells were maintained in 10% FBS in RPMI-1640 supplemented with sodium pyruvate, GlutaMAX, and penicillin/streptomycin. Trem2 reporter cells were based on the 2B4 NFAT-GFP cells developed by Arase et al. (Arase et al., 2002). The sex of the mouse from which 2B4 t-cell hybridoma cells were derived has not been reported (Arase et al., 2002; Hedrick et al., 1982).
METHOD DETAILS
Mice
The generation of Trem2−/− and Trem2−/− 5XFAD mice has been described previously (Oakley et al., 2006; Turnbull et al., 2006; Wang et al., 2015). All mice were on a C57BL/6 background. Age and sex matched mice were used for all experiments; experimental cohorts of mice were cohoused from birth to control for the microbiota.. For in vivo cyclocreatine treatment 10-week old mice were put on cyclocreatine-containing water, treatment was continued until mice reached 8 months of age (Santa Cruz SC-217964 S). Desired intake of cyclocreatine was approximately 0.28 mg/g of body weight/day, which is approximately the same as the standard creatine dose used in humans of 285 mg/kg of body weight/day (Kurosawa et al., 2012). Cyclocreatine was administered in drinking water at a final concentration of 2.33 mg/ml. The Institutional Animal Care and Use Committee at Washington University in St. Louis approved all protocols used in this study.
Human post-mortem brain tissue
Paraffin-embedded sections (8 um) from the frontal cortex of individuals carrying the common variant (CV) of TREM2 (8) or heterozygous for the CV and either R47H (7), R62H (4) were obtained from the Knight Alzheimer’s Disease Research Center at Washington University. Protocol numbers: Healthy Aging and Senile Dementia (HASD) Morphology Core: 89-0555 and Program Project: Alzheimer’s Disease Research Center (ADRC): 89-0556. R47H and R62H carriers were case matched for age, gender, and CERAD-Reagan plaque score to CV TREM2 control individuals. Detailed demographic characteristics are provided in Supplemental Table 1.
Immunohistochemistry of human post-mortem brain tissue
Brain sections were deparaffinized with xylene and rehydrated with decreasing concentrations of ethanol. Antigen retrieval was performed by incubating sections for 20 minutes in a 95°C citrate buffer bath (10 mM sodium citrate, 0.05% Tween-20, pH 6.0) prior to staining. Sections were blocked in 3% goat serum in PBS for 30 minutes at room temperature (RT) followed by incubation with rabbit anti-Iba1 (1:250, Wako; catalog no. 019-19741) overnight at 4° C. Sections were washed in PBS and incubated for 1 hour at room temperature (RT) with methoxy-XO4 (20 μg/ml) (Tocris Bioscience #4920) and anti-rabbit DyLight 549 (Vector Laboratories DI-1549). Sections were washed and incubated overnight in anti-LC3A/B Alexa Fluor 488 (Cell Signaling Technologies #13082). Sections were washed and mounted using Fluoromount G (SouthernBiotech #0100-01) and images were collected using a Nikon A1Rsi+ confocal microscope. Images were then processed with Imaris 7.7 (Bitplane).
Cell culture and biochemical assays
To prepare bone marrow-derived macrophages, femurs and tibias were removed and flushed with PBS. Cells were counted and plated at 2.5 × 10⁶ cells/100 mm petri dish in RPMI supplemented with Glutamax, penicillin/streptomycin, non-essential amino acids, pyruvate, and 10% heat inactivated fetal bovine serum (complete RPMI) and 10% L-cell conditioned medium (LCCM). Cells were cultured for 4–5 days before use. Microglia were prepared as previously described (Wang et al., 2015). Briefly, brains were dissociated by using a Neural Tissue Dissociation Kit (T) (Miltenyi Biotech Cat. Number 130-093-231). Cell suspensions were labeled with anti-mouse CD45 magnetic beads and isolated on LS columns (Miltenyi Biotic). Cells were plated onto poly-L-lysine coated polystyrene plates in complete RPMI supplemented with 20% LCCM and 10 ng/ml human TGF-β. Media was changed on day 3 post plating and cells were used 5–7 days post plating. ATP concentrations were determined with an ATP Determination Kit (Invitrogen).
Microglia sorting
Microglia were isolated from the indicated animals as previously described (Wang et al., 2015). CD45+, CD11b+, F4/80+ (Biolegend Cat. Number 103134, eBioscience Cat. Numbers 11-0112 and 17-4801) cells in the brain were fluorescence-activated cell-sorted (FACS) directly into RLT-plus lysis buffer for microarray or 2% FBS in PBS for TEM or immunoblot lysates. For microarray RNA extraction was performed using a RNeasy micro kit (QIAGEN). Microarray hybridization (Affymetrix MoGene 1.0 ST array) and data processing were performed at the Washington University Genome Center. For normalization, raw data was processed by Robust Multi-Array (RMA) method and genes were pre-filtered for expression value ≥ 120 expression units, a cut-off above which genes have a 95% chance of expression demonstrated in Immgen data set, which uses the same array platform(Wang et al., 2015). QIAGEN IPA analysis was preformed by comparing fold change and p-values for all genes 5XFAD and Trem2-deficient 5XFAD microglia. Heatmaps and hierarchical clustering were generated from preselected gene-lists using Morpheus. Microarray data has been deposited at GEO:GSE65067.
Immunoblotting
BMDM or microglia were lysed in RIPA buffer (50 mM Tris, 150mM NaCl, 1% SDS, and 1% Triton X100) containing PMSF, leupeptin, activated sodium orthovanidate, apoprotinin, and phosphatase inhibitor cocktail 3 (Sigma Aldrich Cat. Number P0044). Lysates were flash frozen on dry ice and stored at −80° C until use. Lysates were thawed and 4× LDS running buffer and 10% β-mercaptoethanol were added. Lysates were heated to 95 °C for 10 minutes and run on either a 15 % polyacrylamide gel with a 4% stacking gel, a 12% bis-tris gel (Nupage), or a 4–12% bis-tris gel (Nupage). Proteins were transferred to nitrocellulose and blocked for 1 hour at RT in 5% milk in Tris buffered saline with 0.05% Tween 20 (TBST). Membranes were incubated in primary antibody overnight at 4 °C (Supplemental Table 2). Membranes were subsequently washed and incubated in Lienco anti-rabbit HRP for 1 hour at RT, washed, and developed using either SuperSignal West Pico Chemiluminescent Substrate or a combination of SuperSignal West Pico Chemiluminescent Substrate and SuperSignal West Femto Chemiluminescent Substrate.
Metabolite profiling by EIS-MS/MS
BMDMs were cultured in either 0.5% or 10% LCCM overnight in complete RPMI. Polar metabolites were extracted according to General Metabolics protocol for extraction of polar metabolites from adherent mammalian cell culture. Briefly, cells were washed in pre-warmed 75mM ammonium carbonate in water. Metabolites were extracted by addition of 70 °C 70% ethanol for 3 minutes. Ethanol was removed and plates were washed with additional 70 °C 70% ethanol. Debris was pelleted by spinning at 14,000 rpm in a tabletop microcentrifuge for 10 minutes at 4 °C. Extracts were moved to a fresh tube and shipped to General Metabolics for assessment by EIS-MS/MS. Differential expression analysis was done using limma.
RNA-seq analysis
Cells were cultured as described in the metabolite profiling by EIS-MS/MS section above. mRNA was extracted from cell lysates using oligo-dT beads (Invitrogen). For cDNA synthesis, we used custom oligo-dT primer with a barcode and adaptor-linker sequence (CCTACACGACGCTCTTCCGATCT-XXXXXXXX-T15). After first-strand synthesis, samples were pooled together based on Actb qPCR values and RNA-DNA hybrids were degraded with consecutive acid-alkali treatment. Subsequently, a second sequencing linker (AGATCGGAAGAGCACACGTCTG) was ligated with T4 ligase (NEB) followed by SPRI-beads (Agencourt AMPure XP, BeckmanCoulter) clean-up. The mixture was enriched by PCR for 12 cycles and SPRI-beads (Agencourt AMPure XP, BeckmanCoulter) purified to yield final strand-specific RNA-seq libraries. Libraries were sequenced using a HiSeq 2500 (Illumina) using 50 bp × 25 bp pair-end sequencing. Second read (read-mate) was used for sample demultiplexing. Reads were aligned to the GRCm38.p2 assembly of mouse genome using STAR aligner. Aligned reads were quantified using quant3p script (github.com/ctlab/quant3p) to account for specifics of 3′ sequencing. RefSeq genome annotation was used and DESeq2 was used for differential gene expression analysis. RNAseq data has been deposited at GEO:GSE98563.
Network analysis
Network analysis was performed as previously described utilizing Shiny GAM (https://artyomovlab.wustl.edu/shiny/gam/) (Sergushichev et al., 2016; Vincent et al., 2015). We considered a network of chemical mappings between carbon atoms in substrates and products for all annotated reactions in KEGG database using RPAIRs entries. The scores for nodes and edges were assigned according to log(p-value), such that highly significant gene or metabolite signals had positive scores and not significant had negative scores. Using an exact solver (https://github.com/ctlab/sgmwcs-solver) we found a module with a maximal weight, with counting positive scores maximum once for a measured entity (a mass-spectrometry peak or a gene). For clarity, addition edges between nodes in the module were added if the corresponding gene was highly expressed (was in a top 3000 expressed genes).
qRT-PCR
Total RNA was isolated with TRIzol Reagent (Invitrogen) and single-strand cDNA was synthesized with a High Capacity cDNA Reverse Transcription Kit (Applied Biosystems). Genomic DNA was extracted using the QIAamp DNA micro kit (Qiagen) to determine mtDNA/nDNA ratios. Real-time PCR was performed using SYBR Green real-time PCR master mix (Thermo-Fisher) and LightCycler 96 detection system (Roche). mtDNA primers were to cytochrome c oxidase subunit 1 and nDNA primers were to NADH:ubiquinone oxidoreductase core subunit V1.
Metabolism assays
For real-time analysis of extracellular acidification rates (ECAR) macrophages were analyzed using an XF96 Extracellular Flux Analyzer (Agilent Technologies). Cells were incubated overnight in complete RPMI in the indicated concentration of LCCM with or without cyclocreatine (10 mM). Measurements were taken under basal conditions and following the sequential addition of 1 μM oligomycin and 1.5 μM fluoro-carbonyl cyanide phenylhydrazone (FCCP) (purchased from Sigma-Aldrich).
Transmission electron microscopy
For ultrastructural analyses, cells were fixed in 2% paraformaldehyde/2.5% glutaraldehyde in 100 mM sodium cacodylate buffer, pH 7.2 for 1 hr at RT (Polysciences Inc., Warrington, PA). Samples were washed in sodium cacodylate buffer and postfixed in 1% osmium tetroxide for 1 hr (Polysciences Inc.). Samples were then rinsed extensively in deionized water prior to en bloc staining with 1% aqueous uranyl acetate for 1 hr (Ted Pella Inc., Redding, CA). Following several rinses in dH20, samples were dehydrated in a graded series of ethanol and embedded in Eponate 12 resin (Ted Pella Inc.). Sections of 95 nm were cut with a Leica Ultracut UCT ultramicrotome (Leica Microsystems Inc., Bannockburn, IL), stained with uranyl acetate and lead citrate, and viewed on a JEOL 1200 EX transmission electron microscope (JEOL USA Inc., Peabody, MA) equipped with an AMT 8 megapixel digital camera and AMT Image Capture Engine V602 software (Advanced Microscopy Techniques, Woburn, MA).
For quantitation of multivesicular/multilamellar structures, 30 cells that were cross-sectioned through the nucleus (indicating cross-section through the middle of cell) were randomly chosen, and images of each cell were taken at 6,000X and 20,000X magnification. The cross-sectional area of each of the multivesicular structures were determined using Image J 1.38g (National Institutes of Health, USA, customized for AMT images). Data is expressed as the 1) total number of a multivesicular/multilammelar structures per cross-sectional area of cytosol and 2) the total cross-sectional area of multivesicular/multilamellar structures per area of cytosol.
Preparation of brain samples and confocal microscopy
Confocal microscopy analysis was preformed as previously described (Wang et al., 2015). Briefly, mice were anesthetized with ketamine/xylazine and perfused with ice-cold PBS containing 1 U/ml of heparin. Brains were fixed in 4% PFA overnight at 4 °C rinsed in PBS and incubated overnight at 4 °C in 30% sucrose before freezing in a 2:1 mixture of 30% sucrose and optimal cutting temperature compound. Serial 40 μm coronal sections were cut on a cryo-sliding microtome. Floating sections from 1.1 mm Bregma to 0.8 mm Bregma for cortical imaging or slides with fixed human sections were stained with Iba-1 (Waco Chemicals Cat. Number 019-19741) overnight at 4 °C followed by staining with anti-rabbit IgG DyLight 549 (Vector Laboratories Cat. Number DI-1549) and methoxy-X04 (Tocris Cat. Number 4920) for 1 hour at RT. Finally, sections were stained for with anti-LC3 Alexa 488 ± anti-cleaved caspase 3 (Cell Signaling Technologies Cat. Number 13082 and 9602). Images were collected using a Nikon A1Rsi+ confocal microscope. Images were then processed with Imaris 7.7 (Bitplane).
Microglia clustering analysis
Positions of microglia and positions and volumes of plaques within z-stacks were derived from analysis in Imaris, and microglia-plaque association was determined using automated scripts in Matlab. Briefly, each plaque in the z-stack was modeled as an idealized sphere with the same volume and center of mass. Microglia density within 15 μm of the plaque surface was determined by isolating the voxels of the image that fall within 15 μm of the edge of the idealized plaque. The number of microglia contained in these voxels was divided by the total volume of those voxels to obtain density for a single plaque. Densities of all plaques in a z-stack were averaged together, and the resulting values were averaged together for all z-stacks corresponding to a single animal.
Reporter cell assay
The 2B4 T cell hybridoma cell line was retrovirally transduced with an NFAT-GFP reporter construct, and TREM2 reporter cells were generated by a second retroviral transduction with a TREM2 overexpression construct and selected by puromycin resistance, as previously described (Wang et al., 2015). Cells were cultured routinely in complete media (10% FBS in RPMI-1640 supplemented with sodium pyruvate, GlutaMAX, and penicillin/streptomycin). For serum starvation, cells were plated at a density of 25,000 cells/well in a 96-well plate in either complete media or RPMI-1640 in the presence of 20% anti-TREM2 hybridoma supernatant (clone M178, generated in house) or 20% isotype control hybridoma supernatant (Wang et al., 2015). After 16 hours, the percent of GFP+ cells among live cells was measured by flow cytometry.
Quantification of methoxy-X04 coverage
To measure total plaque area, brain sections were stained with methoxy X04. Images were collected using a Nikon Eclipse 80i microscope. For quantitative analysis, images were converted to 8-bit greyscale and stitched using the “Stitching” plugin in ImageJ. Cortex (~1.1 mm Bregma to 0.8 mm Bregma) and hippocampus (~−1.7 Bregma to −2.4 Bregma) were determined by manual selection. The threshold of selected images were set at 1.5× mean intensity of the selected area to highlight plaques and analyzed using the “Measure” function in ImageJ to calculate the percent area covered. Identified objects after thresholding were individually inspected to confirm the object as a plaque or not. Two brain sections per mouse were used for quantification. The average of two sections was used to represent a plaque load for each mouse.
Plaque morphology analysis
Methoxy-X04-stained sections were imaged by confocal microscopy using a 60X objective and 1.5X digital zoom in the cortex at ~1.1 mm Bregma to 0.8 mm Bregma. Z images were taken at 1.2 μm intervals. 20–30 μm z-stacks were z-projected by maximum intensity projection and individual plaques were selected in ImageJ. Each individual plaque was traced using a combination of thresholds and edge detection and smoothened using image erosion. The average intensity was determined by averaging values of pixels within the plaque trace. The shape index was calculated as 4π*(perimeter pixels)2/(all pixels).
QUANTIFICATION AND STATISTICAL ANALYSIS
Data in figures are presented as mean ± SEM. Unless otherwise stated statistical analysis was performed using Prism (GraphPad). Quantification of confocal microscopy, immunoblots, and electron microscopy images were performed using Imaris, ImageJ, Matlab, and FIJI. Differential metabolite expression was analyzed using limma. Pathway analysis of microarray data was performed using IPA software. RNAseq analysis was performed by using Second read (read-mate) for sample demultiplexing. Reads were aligned using STAR aligner and quantified using quant3p scirpt. RefSeq genome annotation was used and DESeq2 was used for differential gene expression analysis. Combined RNAseq and metabolite network analysis was performed utilizing Shiny GAM. Statistical analysis to compare the mean values for multiple groups was performed using Prism by one-way ANOVA with Holm-Sidak’s multiple comparisons test. Comparison of two groups was performed in Prism using a two-tailed unpaired t-test (Mann Whitney). Values were accepted as significant if P≤0.05. Intragroup variation compared between groups was similar in all experiments.
DATA AND SOFTWARE AVAILABILITY
Microarray data has been deposited at GEO:GSE65067.
RNAseq data has been deposited at GEO:GSE98563.
Supplementary Material
Lower magnification confocal images of cortexes of WT, Trem2−/−, 5XFAD and Trem2−/−5XFAD mice. Confocal images are representative of 3 female mice per group.
(A) Sqstm1 expression taken from microarrays of sorted microglia from 8 month old WT, Trem2−/−, 5XFAD and Trem2−/− 5XFAD mice.
(B) Top 10 pathways in IPA analysis of differentially expressed genes from 5XFAD and Trem2−/− 5XFAD microglia. Negative log10 p-values are shown.
(C) Gene enrichment plots for genes included in the eIF2, glycolysis, and mTOR signaling modules of IPA. Plots were generated utilizing gene-set enrichment analysis (GSEA) software.
(D–F) Heat maps comparing WT, 5XFAD, Trem2−/−, and Trem2−/− 5XFAD microglia for expression of genes included in the eIF2 (D), glycolysis (E) and mTOR signaling (F) pathways.
(G) Illustration of the glycolytic pathway: proteins indicated in red correspond to genes upregulated in 5XFAD but not Trem2−/− 5XFAD microglia compared to WT microglia.
(H) Mosaic of images depicting representative images of microglia (Iba1 red), plaques (methoxy-X04 blue), cleaved caspase-3 (aqua), LC3 (green), and total merged images from a 5XFAD and a Trem2−/− 5XFAD animal.
(I) Quantification of the percentage of microglia that are both LC3 and cleaved caspase-3 positive.
Microarray data represents analyses of microglia sorted from 3 WT, 4 Trem2−/−, 5 5XFAD, and 5 Trem2−/− 5XFAD mice (A–G). Confocal images are representative of 3 female mice per group (H). ***p<0.005 by One-way ANOVA with Holm-Sidak’s multiple comparisons test (I).
(A) Immunoblots for phosphorylated Akt (serine 473), NDRG1, S6K, 4EBP1, mTOR, total S6K, Akt, and actin performed on lysates from WT and Trem2−/− BMDMs cultured overnight in 10% or 0.5% LCCM followed by the addition of Ly294002 for 3 hours prior to harvest.
(B) Reporter cell assay assessing TREM2 activation in reporter cell line incubated at optimal and low serum conditions with or without soluble anti-TREM2.
N.S. indicates not significant and ****p<0.001 by One-way ANOVA with Holm-Sidak’s multiple comparisons test (B). Results are representative of at least 3 independent experiments.
(A, B) Heatmaps representing the total metabolic profiles of WT compared to Trem2−/− BMDMs culture overnight in 10% LCCM (A) or 0.5% LCCM (B).
(C) Shiny-GAM output for network analysis combining RNA-seq and mass spectrometry data highlights differences between WT and Trem2−/− BMDM cultured overnight in 0.5% LCCM. Enzymes-encoding mRNAs and metabolites that are downregulated or upregulated in Trem2−/− cells vs. WT cells are represented by green or red nodes and connectors, respectively.
(D) Quantification of phosphocreatine from WT and Trem2−/− BMDMs cultured in the indicated concentration of LCCM.
(E, F) Assessment and quantification of the mitochondrial mass of resident peritoneal macrophages from WT and Trem2−/− mice by MitoTraker Green incorporation.
(G, H) Assessment and quantification of the mitochondrial mass of thioglycolate elicited peritoneal macrophages from WT and Trem2−/− mice by MitoTracker Green incorporation.
(I) ATP content of WT and Trem2−/− microglia cultured in 10% LCCM overnight.
(J) Mitochondrial content of WT and Trem2−/− microglia assessed by the ratio of mitochondrial-to-nuclear DNA
(K) Extracellular acidification rate (ECAR) of WT and Trem2−/− microglia cultured overnight in 10% LCCM.
(L) Primary WT and Trem2−/− microglia were incubated overnight in the indicated concentration of LCCM. Immunoblots for LC3, phosphoserine 757 Ulk1, phosphoserine 317 Ulk1, phosphoserine 473 Akt, phospho-NDRG1, and β actin were performed.
(M) Quantification of the LC3II/LC3I ratio from immunoblot preformed on primary microglia shown in L.
*p<0.05 or ****p<0.001 by One-way ANOVA with Holm-Sidak’s multiple comparisons test (D, F, I, H, K). Results are representative of at least 3 independent experiments (E–K) or 2 independent experiments (L, M).
(A) Quantification of the percentage of microglia that contain LC3 puncta in the cortexes of brains from mice of the indicated genotype and treatment group.
(B) Quantification of the number of LC3 puncta per LC3+ microglia.
(C) Quantification of the relative enrichment of LC3+ microglia within 15 μm of a plaque surface in the cortexes of brains from mice of the indicated genotype and treatment group.
(D) Quantification of the relative enrichment of cleaved caspase-3+ microglia within 15 μm of a plaque surface in the cortexes of brains from mice of the indicated genotype and treatment group.
(E) Quantification of the number of microglia per high-powered field in the cortexes of brains from mice of the indicated genotype and treatment group.
(F) Assessment of the complexity of plaques in the cortexes from mice of the indicated genotype and treatment group.
(G, H) The percent of the overall area of the cortex (F) and hippocampus (G) 1.5X brighter than the mean in methoxy-X04 stained sections from mice of the indicated genotype and treatment group.
(I) Quantification of the percentage of microglia containing methoxy-X04 in plaque bearing regions of the cortexes from mice of the indicated genotype and treatment group.
N.S. indicates not significant, **p<0.01 or ****p<0.001 by One-way ANOVA with Holm-Sidak’s multiple comparisons test (A, B, D, E). Results pooled from 2 independent experiments representing a total of 5–8 male and female mice per treatment group.
Highlights.
TREM2-deficient microglia undergo increased autophagy in an AD mouse model
Microglia in humans with AD-risk associated TREM2 alleles display marked autophagy
TREM2 deficiency impairs microglial mTOR activation and metabolism
Cyclocreatine improves microglia metabolism and pathology in TREM2-deficient AD mice
Acknowledgments
We would like to thank Dr. Edward Driggers at General Metabolomics for providing metabolite analysis services. We also would like to thank Drs. Edward J. Pearce and David E. Sanin at the Max Planck Institute of Immunobiology and Epigenetics for discussions and experimental assistance. Finally, we would like to thank Dr. Robert E. Schmidt for assistance in interpreting TEM images. This work was funded by National Institutes of Health grants RF1AG05148501 (M. Colonna), 5T32CA009547-30 (T.K. Ulland), P01 AG03991, and P01 AG026276 (D.M. Holtzman), Knight ADRC P50 AG0568 1 (M. Colonna), Cure Alzheimer’s Fund (M. Colonna), RG4687A1/1 from National Multiple Sclerosis Society (M. Cella), Government of Russian Federation grant 074-U01 (A.A. Sergushichev and Alexander A. Loboda).
Footnotes
Authors Contributions: T.K.U., W.S., S.C.H, J.D.U., A.K., E.L., Y. W., Y. Z. and W.L.B performed in vitro and in vivo studies. N.J.C. provided CERAD Reagan plaque scores. T.K.U., W.S., S.C.H., A.S., and W.L.B. analyzed data. S.G. provided and maintained all mouse lines. J.D.U. and D.M.H. provided human samples. S.G., E.R.U., H.W.V., M.C., D.M.H., and M.N.A. provided critical insights and advice. M.C. supervised the research. T.K.U., W.S., and M.C. prepared the manuscript with input from all other authors.
Publisher's Disclaimer: This is a PDF file of an unedited manuscript that has been accepted for publication. As a service to our customers we are providing this early version of the manuscript. The manuscript will undergo copyediting, typesetting, and review of the resulting proof before it is published in its final citable form. Please note that during the production process errors may be discovered which could affect the content, and all legal disclaimers that apply to the journal pertain.
References
- Ara G, Gravelin LM, Kaddurah-Daouk R, Teicher BA. Antitumor activity of creatine analogs produced by alterations in pancreatic hormones and glucose metabolism. In vivo. 1998;12:223–231. [PubMed] [Google Scholar]
- Arase H, Mocarski ES, Campbell AE, Hill AB, Lanier LL. Direct recognition of cytomegalovirus by activating and inhibitory NK cell receptors. Science. 2002;296:1323–1326. doi: 10.1126/science.1070884. [DOI] [PubMed] [Google Scholar]
- Atagi Y, Liu CC, Painter MM, Chen XF, Verbeeck C, Zheng H, Li X, Rademakers R, Kang SS, Xu H, et al. Apolipoprotein E is a Ligand for Triggering Receptor Expressed on Myeloid Cells 2 (TREM2) J Biochem. 2015 doi: 10.1074/jbc.M115.679043. [DOI] [PMC free article] [PubMed] [Google Scholar]
- Bailey CC, DeVaux LB, Farzan M. The Triggering Receptor Expressed on Myeloid Cells 2 Binds Apolipoprotein E. J Biochem. 2015 doi: 10.1074/jbc.M115.677286. [DOI] [PMC free article] [PubMed] [Google Scholar]
- Cho MH, Cho K, Kang HJ, Jeon EY, Kim HS, Kwon HJ, Kim HM, Kim DH, Yoon SY. Autophagy in microglia degrades extracellular beta-amyloid fibrils and regulates the NLRP3 inflammasome. Autophagy. 2014;10:1761–1775. doi: 10.4161/auto.29647. [DOI] [PMC free article] [PubMed] [Google Scholar]
- Dambuza IM, Brown GD. C-type lectins in immunity: recent developments. Curr Opin Immunol. 2015;32:21–27. doi: 10.1016/j.coi.2014.12.002. [DOI] [PMC free article] [PubMed] [Google Scholar]
- Ford JW, McVicar DW. TREM and TREM-like receptors in inflammation and disease. Curr Opin Immunol. 2009;21:38–46. doi: 10.1016/j.coi.2009.01.009. [DOI] [PMC free article] [PubMed] [Google Scholar]
- Freeman LC, Ting JP. The pathogenic role of the inflammasome in neurodegenerative diseases. J Neurochem. 2016;136(Suppl 1):29–38. doi: 10.1111/jnc.13217. [DOI] [PubMed] [Google Scholar]
- Galluzzi L, Pietrocola F, Levine B, Kroemer G. Metabolic control of autophagy. Cell. 2014;159:1263–1276. doi: 10.1016/j.cell.2014.11.006. [DOI] [PMC free article] [PubMed] [Google Scholar]
- Gold M, El Khoury J. beta-amyloid, microglia, and the inflammasome in Alzheimer’s disease. Semin Immunopathol. 2015;37:607–611. doi: 10.1007/s00281-015-0518-0. [DOI] [PMC free article] [PubMed] [Google Scholar]
- Guerreiro R, Hardy J. Genetics of Alzheimer’s disease. Neurotherapeutics. 2014;11:732–737. doi: 10.1007/s13311-014-0295-9. [DOI] [PMC free article] [PubMed] [Google Scholar]
- Hara T, Nakamura K, Matsui M, Yamamoto A, Nakahara Y, Suzuki-Migishima R, Yokoyama M, Mishima K, Saito I, Okano H, et al. Suppression of basal autophagy in neural cells causes neurodegenerative disease in mice. Nature. 2006;441:885–889. doi: 10.1038/nature04724. [DOI] [PubMed] [Google Scholar]
- Hedrick SM, Matis LA, Hecht TT, Samelson LE, Longo DL, Heber-Katz E, Schwartz RH. The fine specificity of antigen and Ia determinant recognition by T cell hybridoma clones specific for pigeon cytochrome c. Cell. 1982;30:141–152. doi: 10.1016/0092-8674(82)90020-4. [DOI] [PubMed] [Google Scholar]
- Heneka MT, Golenbock DT, Latz E. Innate immunity in Alzheimer’s disease. Nat Immunol. 2015;16:229–236. doi: 10.1038/ni.3102. [DOI] [PubMed] [Google Scholar]
- Heneka MT, Kummer MP, Stutz A, Delekate A, Schwartz S, Vieira-Saecker A, Griep A, Axt D, Remus A, Tzeng TC, et al. NLRP3 is activated in Alzheimer’s disease and contributes to pathology in APP/PS1 mice. Nature. 2013;493:674–678. doi: 10.1038/nature11729. [DOI] [PMC free article] [PubMed] [Google Scholar]
- Holtzman DM, Morris JC, Goate AM. Alzheimer’s disease: the challenge of the second century. Sci Transl Med. 2011;3:77sr71. doi: 10.1126/scitranslmed.3002369. [DOI] [PMC free article] [PubMed] [Google Scholar]
- Hong S, Beja-Glasser VF, Nfonoyim BM, Frouin A, Li S, Ramakrishnan S, Merry KM, Shi Q, Rosenthal A, Barres BA, et al. Complement and microglia mediate early synapse loss in Alzheimer mouse models. Science. 2016;352:712–716. doi: 10.1126/science.aad8373. [DOI] [PMC free article] [PubMed] [Google Scholar]
- Huang Y, Mucke L. Alzheimer mechanisms and therapeutic strategies. Cell. 2012;148:1204–1222. doi: 10.1016/j.cell.2012.02.040. [DOI] [PMC free article] [PubMed] [Google Scholar]
- Jay TR, Hirsch AM, Broihier ML, Miller CM, Neilson LE, Ransohoff RM, Lamb BT, Landreth GE. Disease Progression-Dependent Effects of TREM2 Deficiency in a Mouse Model of Alzheimer’s Disease. J Neurosci. 2017;37:637–647. doi: 10.1523/JNEUROSCI.2110-16.2016. [DOI] [PMC free article] [PubMed] [Google Scholar]
- Kim J, Kundu M, Viollet B, Guan KL. AMPK and mTOR regulate autophagy through direct phosphorylation of Ulk1. Nat Cell Biol. 2011;13:132–141. doi: 10.1038/ncb2152. [DOI] [PMC free article] [PubMed] [Google Scholar]
- Klionsky DJ, Abdelmohsen K, Abe A, Abedin MJ, Abeliovich H, Acevedo Arozena A, Adachi H, Adams CM, Adams PD, Adeli K, et al. Guidelines for the use and interpretation of assays for monitoring autophagy (3rd edition) Autophagy. 2016;12:1–222. doi: 10.1080/15548627.2015.1100356. [DOI] [PMC free article] [PubMed] [Google Scholar]
- Komatsu M, Waguri S, Chiba T, Murata S, Iwata J, Tanida I, Ueno T, Koike M, Uchiyama Y, Kominami E, et al. Loss of autophagy in the central nervous system causes neurodegeneration in mice. Nature. 2006;441:880–884. doi: 10.1038/nature04723. [DOI] [PubMed] [Google Scholar]
- Kroemer G, Marino G, Levine B. Autophagy and the integrated stress response. Mol Cell. 2010;40:280–293. doi: 10.1016/j.molcel.2010.09.023. [DOI] [PMC free article] [PubMed] [Google Scholar]
- Kuiper JW, Pluk H, Oerlemans F, van Leeuwen FN, de Lange F, Fransen J, Wieringa B. Creatine kinase-mediated ATP supply fuels actin-based events in phagocytosis. PLoS biology. 2008;6:e51. doi: 10.1371/journal.pbio.0060051. [DOI] [PMC free article] [PubMed] [Google Scholar]
- Kurosawa Y, Degrauw TJ, Lindquist DM, Blanco VM, Pyne-Geithman GJ, Daikoku T, Chambers JB, Benoit SC, Clark JF. Cyclocreatine treatment improves cognition in mice with creatine transporter deficiency. J Clin Invest. 2012;122:2837–2846. doi: 10.1172/JCI59373. [DOI] [PMC free article] [PubMed] [Google Scholar]
- Laplante M, Sabatini DM. mTOR signaling in growth control and disease. Cell. 2012;149:274–293. doi: 10.1016/j.cell.2012.03.017. [DOI] [PMC free article] [PubMed] [Google Scholar]
- Lucin KM, O’Brien CE, Bieri G, Czirr E, Mosher KI, Abbey RJ, Mastroeni DF, Rogers J, Spencer B, Masliah E, et al. Microglial beclin 1 regulates retromer trafficking and phagocytosis and is impaired in Alzheimer’s disease. Neuron. 2013;79:873–886. doi: 10.1016/j.neuron.2013.06.046. [DOI] [PMC free article] [PubMed] [Google Scholar]
- Masliah E, Sisk A, Mallory M, Mucke L, Schenk D, Games D. Comparison of neurodegenerative pathology in transgenic mice overexpressing V717F beta-amyloid precursor protein and Alzheimer’s disease. J Neurosci. 1996;16:5795–5811. doi: 10.1523/JNEUROSCI.16-18-05795.1996. [DOI] [PMC free article] [PubMed] [Google Scholar]
- McLaughlin AC, Cohn M, Kenyon GL. Specificity of creatine kinase for guanidino substrates. Kinetic and proton nuclear magnetic relaxation rate studies. J Biol Chem. 1972;247:4382–4388. [PubMed] [Google Scholar]
- Meyer-Luehmann M, Prinz M. Myeloid cells in Alzheimer’s disease: culprits, victims or innocent bystanders? Trends in neurosciences. 2015;38:659–668. doi: 10.1016/j.tins.2015.08.011. [DOI] [PubMed] [Google Scholar]
- Netea-Maier RT, Plantinga TS, van de Veerdonk FL, Smit JW, Netea MG. Modulation of inflammation by autophagy: Consequences for human disease. Autophagy. 2016;12:245–260. doi: 10.1080/15548627.2015.1071759. [DOI] [PMC free article] [PubMed] [Google Scholar]
- Neumann H, Takahashi K. Essential role of the microglial triggering receptor expressed on myeloid cells-2 (TREM2) for central nervous tissue immune homeostasis. J Neuroimmunol. 2007;184:92–99. doi: 10.1016/j.jneuroim.2006.11.032. [DOI] [PubMed] [Google Scholar]
- O’Neill LA, Pearce EJ. Immunometabolism governs dendritic cell and macrophage function. J Exp Med. 2016;213:15–23. doi: 10.1084/jem.20151570. [DOI] [PMC free article] [PubMed] [Google Scholar]
- Oakley H, Cole SL, Logan S, Maus E, Shao P, Craft J, Guillozet-Bongaarts A, Ohno M, Disterhoft J, Van Eldik L, et al. Intraneuronal beta-amyloid aggregates, neurodegeneration, and neuron loss in transgenic mice with five familial Alzheimer’s disease mutations: potential factors in amyloid plaque formation. J Neurosci. 2006;26:10129–10140. doi: 10.1523/JNEUROSCI.1202-06.2006. [DOI] [PMC free article] [PubMed] [Google Scholar]
- Orre M, Kamphuis W, Osborn LM, Jansen AH, Kooijman L, Bossers K, Hol EM. Isolation of glia from Alzheimer’s mice reveals inflammation and dysfunction. Neurobiol Aging. 2014;35:2746–2760. doi: 10.1016/j.neurobiolaging.2014.06.004. [DOI] [PubMed] [Google Scholar]
- Peng Q, Malhotra S, Torchia JA, Kerr WG, Coggeshall KM, Humphrey MB. TREM2- and DAP12-dependent activation of PI3K requires DAP10 and is inhibited by SHIP1. Sci Signal. 2010;3:ra38. doi: 10.1126/scisignal.2000500. [DOI] [PMC free article] [PubMed] [Google Scholar]
- Perry VH, Holmes C. Microglial priming in neurodegenerative disease. Nat Rev Neurol. 2014;10:217–224. doi: 10.1038/nrneurol.2014.38. [DOI] [PubMed] [Google Scholar]
- Saxton RA, Sabatini DM. mTOR Signaling in Growth, Metabolism, and Disease. Cell. 2017;168:960–976. doi: 10.1016/j.cell.2017.02.004. [DOI] [PMC free article] [PubMed] [Google Scholar]
- Sergushichev AA, Loboda AA, Jha AK, Vincent EE, Driggers EM, Jones RG, Pearce EJ, Artyomov MN. GAM: a web-service for integrated transcriptional and metabolic network analysis. Nucleic Acids Res. 2016;44:W194–200. doi: 10.1093/nar/gkw266. [DOI] [PMC free article] [PubMed] [Google Scholar]
- Shibuya Y, Chang CC, Huang LH, Bryleva EY, Chang TY. Inhibiting ACAT1/SOAT1 in microglia stimulates autophagy-mediated lysosomal proteolysis and increases Abeta1-42 clearance. The Journal of neuroscience : the official journal of the Society for Neuroscience. 2014;34:14484–14501. doi: 10.1523/JNEUROSCI.2567-14.2014. [DOI] [PMC free article] [PubMed] [Google Scholar]
- Snow RJ, Murphy RM. Creatine and the creatine transporter: a review. Mol Cell Biochem. 2001;224:169–181. doi: 10.1023/a:1011908606819. [DOI] [PubMed] [Google Scholar]
- Tanzi RE. The genetics of Alzheimer disease. Cold Spring Harb Perspect Med. 2012;2 doi: 10.1101/cshperspect.a006296. [DOI] [PMC free article] [PubMed] [Google Scholar]
- Tejera D, Heneka MT. Microglia in Alzheimer’s disease: the good, the bad and the ugly. Curr Alzheimer Res. 2016;13:370–380. doi: 10.2174/1567205013666151116125012. [DOI] [PubMed] [Google Scholar]
- Turnbull IR, Gilfillan S, Cella M, Aoshi T, Miller M, Piccio L, Hernandez M, Colonna M. Cutting edge: TREM-2 attenuates macrophage activation. J Immunol. 2006;177:3520–3524. doi: 10.4049/jimmunol.177.6.3520. [DOI] [PubMed] [Google Scholar]
- Ulrich JD, Finn MB, Wang Y, Shen A, Mahan TE, Jiang H, Stewart FR, Piccio L, Colonna M, Holtzman DM. Altered microglial response to Abeta plaques in APPPS1-21 mice heterozygous for TREM2. Mol Neurodegener. 2014;9:20. doi: 10.1186/1750-1326-9-20. [DOI] [PMC free article] [PubMed] [Google Scholar]
- Vincent EE, Sergushichev A, Griss T, Gingras MC, Samborska B, Ntimbane T, Coelho PP, Blagih J, Raissi TC, Choiniere L, et al. Mitochondrial Phosphoenolpyruvate Carboxykinase Regulates Metabolic Adaptation and Enables Glucose-Independent Tumor Growth. Mol Cell. 2015;60:195–207. doi: 10.1016/j.molcel.2015.08.013. [DOI] [PubMed] [Google Scholar]
- Walker JB. Creatine: biosynthesis, regulation, and function. Adv Enzymol Relat Areas Mol Biol. 1979;50:177–242. doi: 10.1002/9780470122952.ch4. [DOI] [PubMed] [Google Scholar]
- Wang Y, Cella M, Mallinson K, Ulrich JD, Young KL, Robinette ML, Gilfillan S, Krishnan GM, Sudhakar S, Zinselmeyer BH, et al. TREM2 lipid sensing sustains the microglial response in an Alzheimer’s disease model. Cell. 2015;160:1061–1071. doi: 10.1016/j.cell.2015.01.049. [DOI] [PMC free article] [PubMed] [Google Scholar]
- Wang Y, Ulland TK, Ulrich JD, Song W, Tzaferis JA, Hole JT, Yuan P, Mahan TE, Shi Y, Gilfillan S, et al. TREM2-mediated early microglial response limits diffusion and toxicity of amyloid plaques. J Exp Med. 2016;213:667–675. doi: 10.1084/jem.20151948. [DOI] [PMC free article] [PubMed] [Google Scholar]
- Werner M, Hobeika E, Jumaa H. Role of PI3K in the generation and survival of B cells. Immunol Rev. 2010;237:55–71. doi: 10.1111/j.1600-065X.2010.00934.x. [DOI] [PubMed] [Google Scholar]
- Woznicki DT, Walker JB. Formation of a supplemental long time-constant reservoir of high energy phosphate by brain in vivo and in vitro and its reversible depletion by potassium depolarization. J Neurochem. 1979;33:75–80. doi: 10.1111/j.1471-4159.1979.tb11708.x. [DOI] [PubMed] [Google Scholar]
- Wyss M, Kaddurah-Daouk R. Creatine and creatinine metabolism. Physiol Rev. 2000;80:1107–1213. doi: 10.1152/physrev.2000.80.3.1107. [DOI] [PubMed] [Google Scholar]
- Yang DS, Stavrides P, Mohan PS, Kaushik S, Kumar A, Ohno M, Schmidt SD, Wesson D, Bandyopadhyay U, Jiang Y, et al. Reversal of autophagy dysfunction in the TgCRND8 mouse model of Alzheimer’s disease ameliorates amyloid pathologies and memory deficits. Brain : a journal of neurology. 2011;134:258–277. doi: 10.1093/brain/awq341. [DOI] [PMC free article] [PubMed] [Google Scholar]
- Yeh FL, Wang Y, Tom I, Gonzalez LC, Sheng M. TREM2 Binds to Apolipoproteins, Including APOE and CLU/APOJ, and Thereby Facilitates Uptake of Amyloid-Beta by Microglia. Neuron. 2016;91:328–340. doi: 10.1016/j.neuron.2016.06.015. [DOI] [PubMed] [Google Scholar]
- Yuan P, Condello C, Keene CD, Wang Y, Bird TD, Paul SM, Luo W, Colonna M, Baddeley D, Grutzendler J. TREM2 Haplodeficiency in Mice and Humans Impairs the Microglia Barrier Function Leading to Decreased Amyloid Compaction and Severe Axonal Dystrophy. Neuron. 2016;90:724–739. doi: 10.1016/j.neuron.2016.05.003. [DOI] [PMC free article] [PubMed] [Google Scholar]
Associated Data
This section collects any data citations, data availability statements, or supplementary materials included in this article.
Supplementary Materials
Lower magnification confocal images of cortexes of WT, Trem2−/−, 5XFAD and Trem2−/−5XFAD mice. Confocal images are representative of 3 female mice per group.
(A) Sqstm1 expression taken from microarrays of sorted microglia from 8 month old WT, Trem2−/−, 5XFAD and Trem2−/− 5XFAD mice.
(B) Top 10 pathways in IPA analysis of differentially expressed genes from 5XFAD and Trem2−/− 5XFAD microglia. Negative log10 p-values are shown.
(C) Gene enrichment plots for genes included in the eIF2, glycolysis, and mTOR signaling modules of IPA. Plots were generated utilizing gene-set enrichment analysis (GSEA) software.
(D–F) Heat maps comparing WT, 5XFAD, Trem2−/−, and Trem2−/− 5XFAD microglia for expression of genes included in the eIF2 (D), glycolysis (E) and mTOR signaling (F) pathways.
(G) Illustration of the glycolytic pathway: proteins indicated in red correspond to genes upregulated in 5XFAD but not Trem2−/− 5XFAD microglia compared to WT microglia.
(H) Mosaic of images depicting representative images of microglia (Iba1 red), plaques (methoxy-X04 blue), cleaved caspase-3 (aqua), LC3 (green), and total merged images from a 5XFAD and a Trem2−/− 5XFAD animal.
(I) Quantification of the percentage of microglia that are both LC3 and cleaved caspase-3 positive.
Microarray data represents analyses of microglia sorted from 3 WT, 4 Trem2−/−, 5 5XFAD, and 5 Trem2−/− 5XFAD mice (A–G). Confocal images are representative of 3 female mice per group (H). ***p<0.005 by One-way ANOVA with Holm-Sidak’s multiple comparisons test (I).
(A) Immunoblots for phosphorylated Akt (serine 473), NDRG1, S6K, 4EBP1, mTOR, total S6K, Akt, and actin performed on lysates from WT and Trem2−/− BMDMs cultured overnight in 10% or 0.5% LCCM followed by the addition of Ly294002 for 3 hours prior to harvest.
(B) Reporter cell assay assessing TREM2 activation in reporter cell line incubated at optimal and low serum conditions with or without soluble anti-TREM2.
N.S. indicates not significant and ****p<0.001 by One-way ANOVA with Holm-Sidak’s multiple comparisons test (B). Results are representative of at least 3 independent experiments.
(A, B) Heatmaps representing the total metabolic profiles of WT compared to Trem2−/− BMDMs culture overnight in 10% LCCM (A) or 0.5% LCCM (B).
(C) Shiny-GAM output for network analysis combining RNA-seq and mass spectrometry data highlights differences between WT and Trem2−/− BMDM cultured overnight in 0.5% LCCM. Enzymes-encoding mRNAs and metabolites that are downregulated or upregulated in Trem2−/− cells vs. WT cells are represented by green or red nodes and connectors, respectively.
(D) Quantification of phosphocreatine from WT and Trem2−/− BMDMs cultured in the indicated concentration of LCCM.
(E, F) Assessment and quantification of the mitochondrial mass of resident peritoneal macrophages from WT and Trem2−/− mice by MitoTraker Green incorporation.
(G, H) Assessment and quantification of the mitochondrial mass of thioglycolate elicited peritoneal macrophages from WT and Trem2−/− mice by MitoTracker Green incorporation.
(I) ATP content of WT and Trem2−/− microglia cultured in 10% LCCM overnight.
(J) Mitochondrial content of WT and Trem2−/− microglia assessed by the ratio of mitochondrial-to-nuclear DNA
(K) Extracellular acidification rate (ECAR) of WT and Trem2−/− microglia cultured overnight in 10% LCCM.
(L) Primary WT and Trem2−/− microglia were incubated overnight in the indicated concentration of LCCM. Immunoblots for LC3, phosphoserine 757 Ulk1, phosphoserine 317 Ulk1, phosphoserine 473 Akt, phospho-NDRG1, and β actin were performed.
(M) Quantification of the LC3II/LC3I ratio from immunoblot preformed on primary microglia shown in L.
*p<0.05 or ****p<0.001 by One-way ANOVA with Holm-Sidak’s multiple comparisons test (D, F, I, H, K). Results are representative of at least 3 independent experiments (E–K) or 2 independent experiments (L, M).
(A) Quantification of the percentage of microglia that contain LC3 puncta in the cortexes of brains from mice of the indicated genotype and treatment group.
(B) Quantification of the number of LC3 puncta per LC3+ microglia.
(C) Quantification of the relative enrichment of LC3+ microglia within 15 μm of a plaque surface in the cortexes of brains from mice of the indicated genotype and treatment group.
(D) Quantification of the relative enrichment of cleaved caspase-3+ microglia within 15 μm of a plaque surface in the cortexes of brains from mice of the indicated genotype and treatment group.
(E) Quantification of the number of microglia per high-powered field in the cortexes of brains from mice of the indicated genotype and treatment group.
(F) Assessment of the complexity of plaques in the cortexes from mice of the indicated genotype and treatment group.
(G, H) The percent of the overall area of the cortex (F) and hippocampus (G) 1.5X brighter than the mean in methoxy-X04 stained sections from mice of the indicated genotype and treatment group.
(I) Quantification of the percentage of microglia containing methoxy-X04 in plaque bearing regions of the cortexes from mice of the indicated genotype and treatment group.
N.S. indicates not significant, **p<0.01 or ****p<0.001 by One-way ANOVA with Holm-Sidak’s multiple comparisons test (A, B, D, E). Results pooled from 2 independent experiments representing a total of 5–8 male and female mice per treatment group.