Abstract
Conventional mammographic dosimetry has been developed over the past forty years. Prior to the availability of high resolution three-dimensional breast images, certain assumptions about breast anatomy were required. These assumptions were based upon the information evident on two-dimensional mammograms; they included assumptions of thick skin, a uniform mixture of glandular and adipose tissue, and a median breast density of 50%. Recently, the availability of high-resolution breast CT studies has provided more accurate data about breast anatomy, and this, in turn, has provided the opportunity to update mammographic dosimetry.
Based on hundreds of data sets on breast CT volume, a number of studies were performed and reported which have shed light on the basic breast anatomy specific to dosimetry in mammography. It was shown that the average skin thickness of the breast was approximately 1.5 mm, instead of the 4 or 5 mm in the past. In another study, 3-D breast CT data sets were used for validation of the 2-D algorithm developed at the University of Toronto, leading to data suggesting that the overall average breast density is of the order of 16–20%, rather than the previously assumed 50%. Both of these assumptions led to normalized glandular dose (DgN) coefficients which are higher than those of the past. However, a comprehensive study on hundreds of breast CT data sets confirmed the findings of other investigators that there is a more centralized average location of glandular tissue within the breast. Combined with Monte Carlo studies for dosimetry, when accurate models of the distribution of glandular tissue were used, a 30% reduction in the radiation dose (as determined by the DgN coefficient) was found as an average across typical molybdenum and tungsten spectra used clinically. The 30% average reduction was found even when the thinner skin and the lower average breast density were considered.
The article reviews three specific anatomic observations made possible based on high-resolution breast CT data by several different research groups. It is noted that, periodically, previous assumptions pertaining to dosimetry can be updated when new information becomes available, so that more accurate dosimetry is achieved. Dogmatic practices typically change slowly, but it is hoped that the medical physics community will continue to evaluate changes in DgN coefficients such that they become more accurate.
Introduction
In the early days of breast imaging (1960s), industrial non-screen film was used to achieve the very high spatial resolution thought to be required for breast imaging. Dose levels were very high (150 mGy per image), but few women were imaged with use of this technology which predated an organized screening program. When breast cancer screening programs were instituted (1980s) in the United States, both xerographic detectors and screen/film systems were used initially. Xeromammography made use of selenium plates with an analog processing system that used charged toner particles, with the net effect of producing edge enhancement.1 Because of its good resolution at high spatial frequencies, xeromammography was very effective for the detection of microcalcifications, but was less than optimal for detection of mass lesions because the spatial frequency response of this detector technology was relatively poor. Ultimately, xeromammography gave way to screen/film mammography in the commercial marketplace because of improvements in its ability to image both microcalcifications and soft tissue masses with good fidelity.
A number of methods for computing radiation dose to the breast were proposed during this early era in breast imaging, including the entrance skin exposure2,3, the exposure measured at the midplane of the breast4, and other metrics.5 Early phantoms for radiation dosimetry were used experimentally, however, in many cases these phantoms did not mimic breast tissues accurately. The early days of breast dosimetry has been described by many authors6–9, and a review of recent developments of methods for estimating dose in breast x-ray imaging has been published.10 The acceptance of the mean glandular dose (MGD) as the modern metric for breast dosimetry was promoted in a landmark publication by Hammerstein et al.11 These researchers and others12–16, advocated for a dose metric which involved computing the dose only to the glandular tissue of the breast, and specifically excluding the dose to adipose tissue and skin. This concept was justified because it was recognized that fibroglandular tissue of the breast is the tissue at risk for breast cancer - the incidence of radiation-induced adipose or skin cancers is much smaller. To be clear, cancer of the adipose tissue or of the skin is not considered “breast cancer”, because it does not emanate from breast parenchyma tissue.
Because the three-dimensional anatomy of the breast was not widely accessible in the early days of breast dosimetry, for simplicity glandular tissue was assumed to be perfectly mixed with adipose tissue throughout the extent of the breast. It was also assumed that the average patient had an average glandular fraction of about 50%, with a range from 0% to 100%, spanning the spectrum of glandular fractions in women. In this report, an x% fibroglandular fraction is understood to coexist with a [100% -x%] adipose fraction. Thus, breast tissue phantoms are typically available in the range of glandular fractions from 0% to 100%. For clinical medical physicists who measure the performance of mammography equipment with these phantoms by using automatic exposure control, it was observed that the 6 or 8 cm thick 100% glandular fraction phantoms almost always caused mammography systems to enter a fault mode due to a trigger of the backup timer, suggesting that phantoms simulating large, 100% glandular breasts were unrealistic. More on this topic will be considered later.
In this report, we discuss how research experience with the development and clinical translation of three-dimensional breast computed tomography17,18 (bCT) has given rise to anatomic information that has better informed the field of breast imaging. Specifically, the knowledge gained from CT images of the breast have been used to change several ideas with respect to two-dimensional (mammography) breast dosimetry. For the purposes of this report, we include breast tomosynthesis as a two-dimensional imaging technology, because due to its limited angle nature, the dosimetry19 and image texture parameters20 are far more like two-dimensional mammography than true three-dimensional breast computed tomography.
Breast Computed Tomography (bCT)
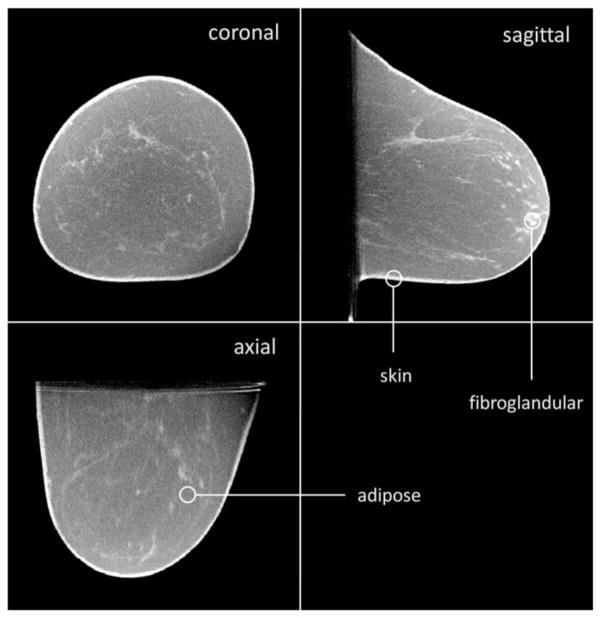
The breast CT program at our institution has been underway since the year 2000. Since then, four research breast CT prototype systems have been designed, fabricated, and tested clinically. Several clinical trials have been performed, and to date 600 patients have been imaged on one of these four prototype breast CT scanners. In most cases, each patient had both breasts imaged on the breast scanner, so that we have more than 1200 volume data sets corresponding to individual breasts. The breast volume data sets represent high resolution, thin slice CT images (typically 0.25 to 0.35 mm in slice thickness) of the breast. The coronal plane is formatted into a 512 × 512 pixel array, with the number of CT images proportional to the length of the breast – typically resulting in 300 to 500 images along the z-axis. Examples of breast CT images are shown in Fig. 1. The breast CT images have been analyzed in several ways, including texture analysis, size analysis, shape analysis, and assessment of other specific breast parameters. The parameters which have primarily impacted 2-D breast dosimetry include (1) the skin thickness of the breast, (2) the average and range of the breast density, and (3) the spatial distribution of glandular tissue within the breast. The role of each of these parameters in changing prevailing notions based on two-dimensional mammography will be discussed below. First, however, basic breast dosimetry for mammography is reviewed in the next section.
Figure 1.
A breast CT volume data set is illustrated. The coronal, sagittal, and axial views are shown. These images are from a 5123 voxel data set, and the viewing software allows the user to “fly through” the image data. This type of data can be analyzed for skin thickness, breast density, breast density distribution, volume, and many other parameters which are useful in characterizing the anatomy in the breast.
Basic Breast Dosimetry for Mammography
Breast dosimetry for mammography focuses on the average absorbed dose (energy imparted per unit mass, i.e., dE/dM) deposited in the glandular compartment of the breast. The normalized glandular dose coefficient, DgN, is defined as
| Eqn 1 |
where Dgl is the glandular dose and Ksk is the air kerma at the entrance skin surface. The DgN coefficients are computed by use of Monte Carlo techniques, which generally compute both the Dgl and Ksk during the same Monte Carlo run. DgN values are dependent upon several parameters pertaining both to the x-ray system and to the breast being imaged.
X-ray system parameters which impact breast dosimetry include the x-ray spectrum, which is characterized by the anode/filter combination, the x-ray tube potential (kV), and the measured half-value layer (HVL). Anode materials used for breast imaging include molybdenum, rhodium, and tungsten. Filter materials for molybdenum anodes include molybdenum and rhodium, and rhodium target x-ray spectra have traditionally been filtered with rhodium. More recently, mammography equipment vendors have begun to use tungsten targets. Filtration materials for tungsten spectra include aluminum, molybdenum, rhodium, silver, and palladium.
The DgN values are also dependent upon breast-specific parameters, including the compressed breast thickness (which usually ranges between 2 cm and 8 cm) and the breast density. Historic compilations of DgN values21–25 tend to refer to the breast density as being 0% glandular, 50% glandular, or 100% glandular and the medical physicist is left to interpolate between these values for a specific glandular fraction. When the glandular fraction was unknown, it was common to assume a 50% glandular breast.
The denominator in Equation 1 is the air kerma measured at the entrance surface of the breast, Ksk. At our institution, we measure and tabulate the air kerma (free-in-air) at 50 cm from the x-ray source (K50). Therefore, the air kerma at the skin needs to be determined because of the inverse square law for the specific compressed breast thickness being imaged. For a mammography system with a 67.5 cm distance between the x-ray source and the breast platform (for example), and for a breast of thickness T (in cm), the inverse square law correction would be
| Eqn 2 |
With knowledge of the appropriate DgN value and the known entrance air kerma at the skin, the mean glandular dose is calculated as
| Eqn 3 |
In the following, our focus is on several observations which have changed the value of DgN compared to historical values.
Skin Thickness
Methods
In many of the historical Monte Carlo investigations that focused on breast dosimetry, researchers assumed a skin thickness of 4 mm (Wu23,24, Boone21,25, and others) or, in some cases, 5 mm (Dance22). Skin has a density of approximately 1.09 g/ml, where the density of glandular tissue is approximately 1.04 g/ml, and that of adipose tissue is 0.94 g/ml. The skin acts to attenuate the x-ray beam before to it reaches glandular tissue; this is especially important given the low x-ray energies used for breast imaging. After the breast-CT program at UC Davis got under way, breast images from hundreds of patients became available. It was clear upon inspection and review that the skin thickness was not 4 or 5 mm, but was much thinner. We set out to quantify the thickness of the skin based upon a large sample of breast images.26
The geometric accuracy of the breast CT scanner was confirmed by imaging a custom-designed mechanical jig which had a series of ≥6 plastic BBs placed 25 mm apart, in all three spatial dimensions. The physical distances between these BBs were compared with the distances measured on the CT images. These comparisons showed < 1% difference in each Cartesian coordinate.
We used a total of 100 single breast volume data sets, acquired from 51 different women to measure the skin thickness. The center of mass of the breast in the coronal plane was determined, and lines projecting from the center of the breast outward at 0.5° integrals over 360° were computed. Each line continued to the edge of the breast until the skin/air interface was reached. Note that the skin/air interface is easily detected due to the large discontinuity between Hounsfield unit (HU) values between air (HU=−1000) and skin (HU≈100). From the skin/air interface, the derivative of the HU profiles along each line was computed, and the greatest slope was taken as the skin/adipose barrier. A total of 720 measurements at 0.5° intervals around the full 360° circle were extracted, and a five-element RECT function (equal weight to each kernel element) was used in convolution to reduce noise. Because of the rounding of the breast anteriorly (toward the nipple), the skin thickness in the coronal plane increased. To address this, we used surface points both on the skin/air interface and on the skin/adipose interface to fit two planes which were approximately parallel to the tangent of the surface of these two interfaces. This procedure was designed to estimate the skin thickness accurately by properly addressing the skin curvature in three dimensions. More details on this procedure can be found in reference 26.
Results
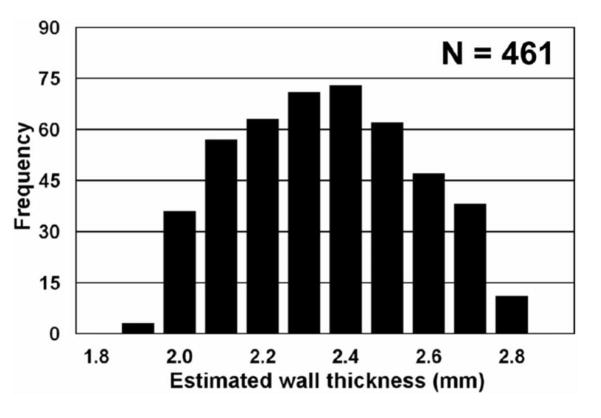
To evaluate the accuracy of the skin thickness assessment algorithm, we filled a breast-shaped plastic bowl filled with water and imaged it on the breast CT scanner. The thickness of the bowl was evaluated manually at 61 individual points with a calibrated micrometer. The thickness of the bowl was computed as 2.58 ± 0.17 mm. We used the algorithm described above to assess the thickness of the bowl automatically. A histogram of 461 wall thickness measurements is shown in Figure 2. From these measurements, the thickness of the bowl ranged from 1.9 to 2.7 mm, and the average wall thickness was computed as 2.30 ± 0.21 mm. These data demonstrate that the algorithm accuracy is of the order of 0.2–0.3 mm, which was considered adequate for this assessment.
Figure 2.
To validate thickness measurements from breast CT images, a breast-shaped plastic bowl was imaged on the breast CT scanner, and 461 measurements of the plastic thickness were determined. Physical measurements of the wall thickness of the bowl showed a slight 0.20 mm bias between physical measurements and those made from the CT images.
Adapted from a figure in reference 26.
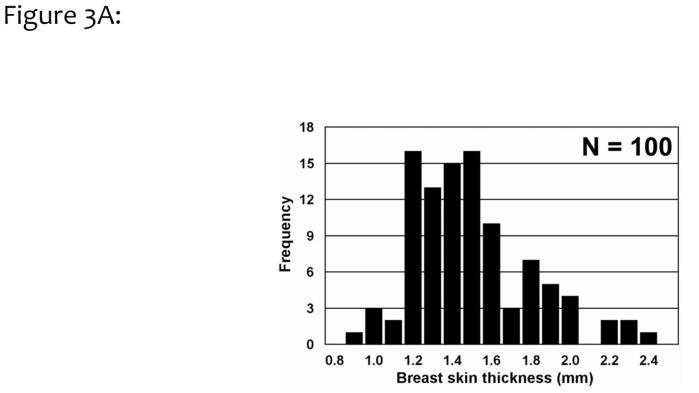
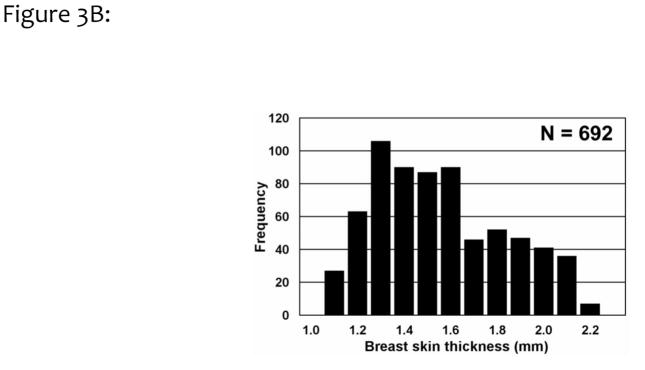
A histogram of the breast skin thickness for 100 breasts is shown in Fig. 3A. Averaging across these 100 breasts, the skin thickness was found to be 1.45 ±0.30 mm, significantly different from the previous assumption of a 4 or 5 mm skin thickness. These results are consistent with a subsequent findings of an average skin thickness of 1.44 mm by Shi et al.27 Skin thickness measurements for a single breast are illustrated in Figure 3B, where 692 individual measurements were performed by the algorithm. For this assessment of precision, the breast thickness was measured as 1.51 ±0.28 mm, with a range spanning between 1.1 to 2.1 mm.
Figure 3.
Figure 3A. The average breast skin thicknesses from 100 breasts, corresponding to 51 women, are shown. The overall skin thickness range from 0.9 to 2.3 mm, with an average of 1.45 mm (SD = 0.30 mm).
Adapted from a figure in reference 26.
Figure 3B. To evaluate the combination of precision and variation in skin thickness, 692 thickness measurements were made of a single breast CT image data set. This breast had a mean skin thickness of 1.51 mm (SD=0.28 mm), showing an overall coefficient of variation of 18.5%.
Adapted from a figure in reference 26.
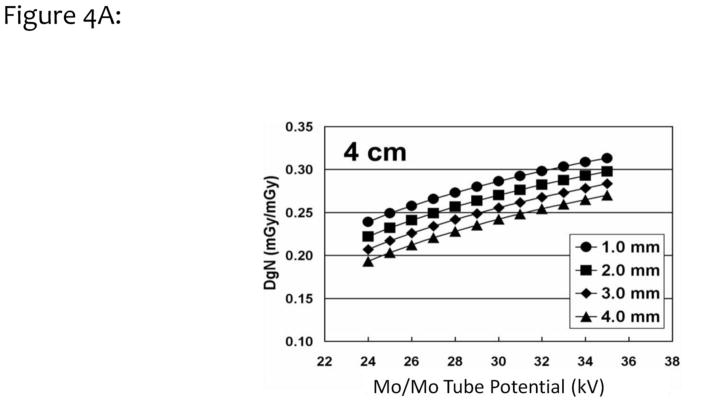
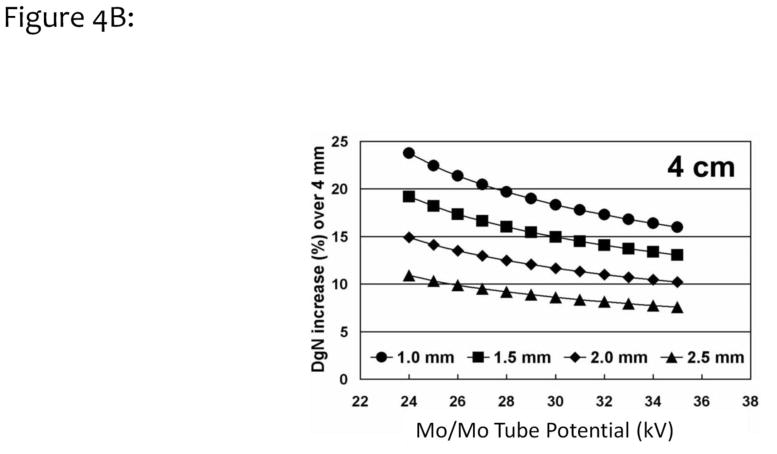
Monte Carlo simulations based on the SIERRA code developed at our institution28 were performed with the assumption of different skin thickness values. The DgN coefficients for a typical 4 cm compressed breast are shown as a function of tube potential in Fig. 4A. The four curves correspond to different skin thicknesses, ranging from 1.0 mm to 4.0 mm. This figure illustrates the impact of skin thickness on the absolute DgN coefficient value. In Fig. 4B, the differences (in percent) between a 4 mm skin thickness assumption and various other assumptions are demonstrated. For the 1.5 mm skin thickness curve (square symbols) in Figure 4B, and a typical tube potential of 27 kV for this 4 cm breast, a 17% increase in the DgN value is seen relative to the case where a 4 mm skin thickness was assumed.
Figure 4.
Figure 4A. Monte Carlo studies were performed over a range of different skin thicknesses (from 1.0 to 4.0 mm, see legend), and the normalized glandular dose coefficients (DgN) were computed for a 4 cm compressed breast thickness. The DgN coefficients were evaluated at x-ray tube potentials ranging from 24 to 35 kV.
Adapted from a figure in reference 26
Figure 4B. Data similar to those shown in Fig. 4A were used for computing the increase in DgN coefficients, relative to a 4 mm skin thickness, for skin thicknesses ranging from 1.0 to 2.5 mm. For the typical tube potential use for imaging of a 4 cm thick breast (~28 kV), a 17% increase in the DgN coefficient was observed for the 1.5 –mm-thick skin.
Adapted from a figure in reference 26.
Skin Thickness Conclusions
The take-home lesson from the finding of a much thinner breast skin thickness than previously thought, is that we need to constantly refine and improve assumptions used in computer modeling. Where a 17% increase in DgN values is not huge, it also is not negligible. While skin is composed of several layers including the epidermis, dermis, and hypodermis, only the outer visibly dense layer that is easily seen and measured on breast CT images matters with respect to radiation dosimetry of the breast.
Breast Density: Magnitude
The breast CT image data (Figure 1) demonstrate glandular tissue distinct from adipose tissue, all surrounded by the skin layer. Computer segmentation algorithms have been developed29 that identify and flag each voxel within the breast image data set as air, skin, adipose tissue, or glandular tissue. It is then a simple matter to sum up all of the glandular voxels, and to divide by the total number of voxels that comprise the volume of the breast. In some cases, this included skin, and in other cases, skin was excluded in the computation of the total volume of the breast.
Methods
Researchers at the University of Toronto have been studying the magnitude of breast density from two-dimensional mammograms for many years.30,31 The University of Toronto semiautomatic algorithm, called Cumulus, was applied to thousands of mammographic images. In a more recent collaborative study, segmented breast CT images with known volume glandular fractions (VGF) were used as a “gold standard” for validation of the accuracy of the Cumulus algorithm.32 To do this, we identified 26 cases which included both breast CT and digital mammography images at UC Davis. The mammograms were evaluated by the Cumulus algorithm, and the breast density determined by Cumulus-V on 2-D mammograms was compared directly with the volume glandular fraction determined on 3-D breast CT volume data sets, for the same breasts.
In another study pertaining to the magnitude of breast density on breast CT volume data sets33, the volume glandular fraction was evaluated as a function of patient age. The volume glandular fraction was also evaluated as a function of the size of the breast quantified as the diameter of the breast at the chest wall, as measured on breast CT images.
Results
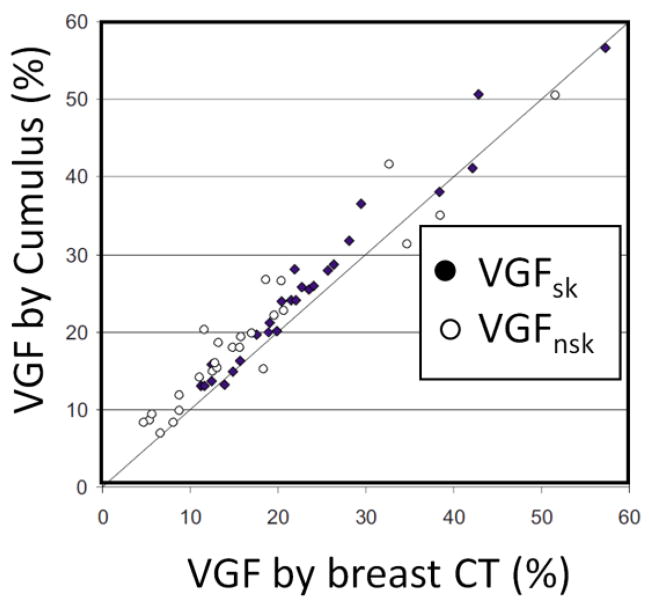
The comparison between the volume glandular fraction determined by the Cumulus algorithm is compared with the VGF determined by segmenting breast CT images in Fig 5. With the skin included, the slope of the linear regression line was 1.008 with an intercept of only 1.9% VGF. With skin excluded, the slope was 0.91 with an intercept of 4.1%. In both cases, the differences in the VGF measured between Cumulus and the gold standard breast CT data were very small.
Figure 5.
Volume glandular fraction (VGF) measurements determined from segmented breast CT images are compared to the VGF estimates made on two-dimensional mammograms by use of the Cumulus code developed at the University of Toronto. Good agreement is seen.
Adapted from a figure in reference 32
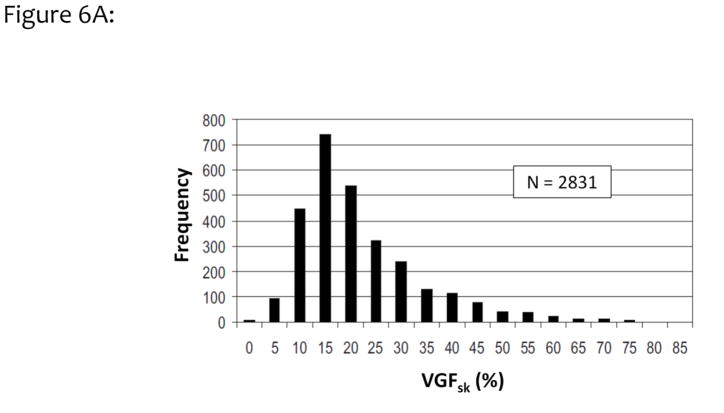
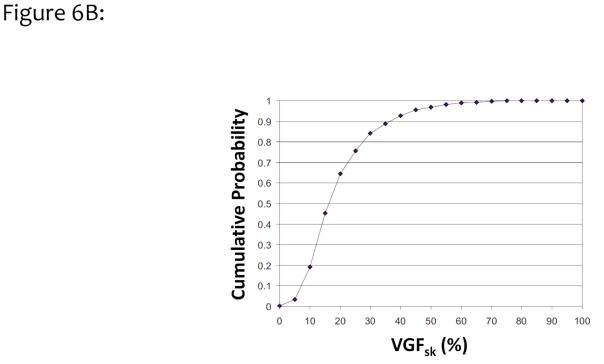
Figure 6A illustrates a histogram of 2831 women as a function of VGF from combined measurements with the 2D Cumulus algorithm at the University of Toronto and the 3D breast segmentation algorithm at UC Davis. The mean VGF (including skin) for this data set was 19.3%, with a standard deviation of 12.1%. These findings are similar to the results published by Vedantham et al., who found a mean VGF of 15.8% by using 137 bCT volume data sets.34 Figure 6B shows the integral of the data shown in Fig. 6A, resulting in the cumulative probability for the volume glandular fraction (with skin included). Based on this figure, the median breast density for this large cohort of women is approximately 16%. Only a small fraction, approximately 3% of women, have breast densities greater than 50%, and only 10% of women had VGFs greater than 35%.
Figure 6.
Figure 6A. The data from UC Davis and University Toronto were combined, resulting in this histogram of the distribution of volume glandular fractions for 2831 women residing in North America. Less than 5% of women have volume glandular fractions greater than 50%, based upon these data.
Adapted from a figure in reference 32.
Figure 6B. The data shown in Fig. 6A were integrated to demonstrate the cumulative probability distribution of breast density as a function of VGF. These data illustrate that the median woman has approximately 16% VGF.
Adapted from a figure in reference 32.
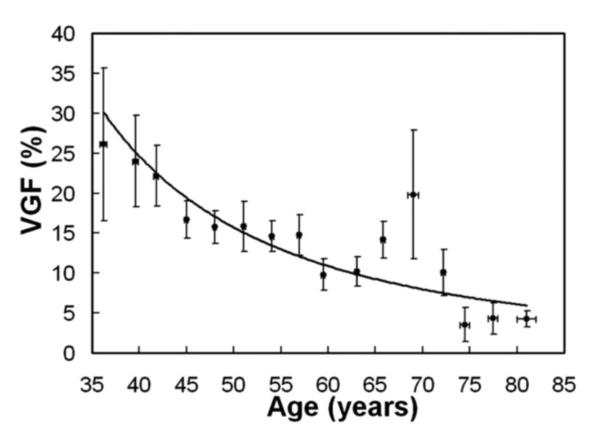
Figure 7 shows the VGF as a function of patient age. This set represents data on 219 breasts from 210 women. The data were binned into sixteen age groups, shown as individual data points (with error bars) in the figure. Breast density has a strong relationship with age, and averages about 30% for premenopausal women and declines to about 5% for women 74 years and older.
Figure 7.
The VGF determined using segmentation of breast CT image data sets is shown as a function of patient age, for 219 patients. These data are from the normal, unaffected breast. The dramatic reduction in breast density as a function of age is illustrated in this figure.
Adapted from a figure in reference 33.
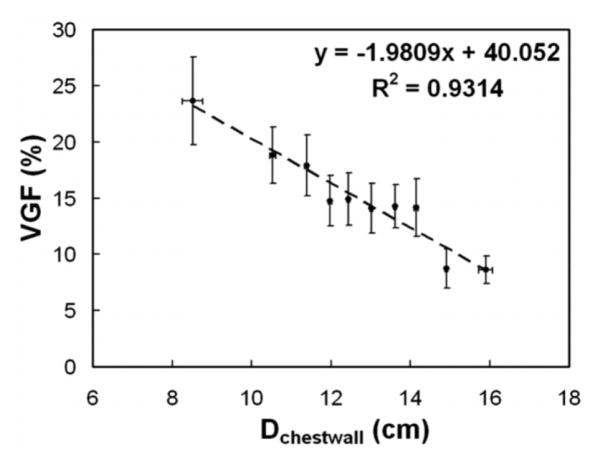
Figure 8 shows the VGF as a function of breast diameter, defined as the value at the chest wall (Dchestwall). The data include VGF measurements on 219 breasts. The VGF decreases by about 2% for each 1 cm increase in the diameter of the breast. These data support the notion that larger breasts tend to be more adipose in nature.
Figure 8.
The VGF is shown here as a function of the breast diameter at the chest wall. This figure illustrates that larger breasts have lower VGF levels than do smaller diameter breasts.
Adapted from a figure in reference 33.
Breast Density Magnitude Conclusions
With validation from 3-D breast CT data sets, the University of Toronto Cumulus-derived data demonstrate that the average magnitude of breast density is much lower than previously thought, with a median VGF of approximately 16% instead of the “myth” of the 50% glandular breast. Also, instead of a previous belief that breast density ranges from 0% to 100%, the data from almost 3000 women (Fig. 6B) show that the 90% range of breast density (i.e., from the 5th percentile to the 95th percentile) spans from approximately 6% VGF to 43% VGF – a range of 37% glandular fraction. Research on 210 women undergoing breast CT reinforces the clinical observation that as women age, their breasts become more “fatty-replaced” (Figure 7). The data also demonstrate that the VGF of the breast declines monotonically as the diameter of the breast increases.
It is noted that existing DgN values increase as the breast density decreases, for the same size breast. Using the example of a tungsten anode with a rhodium filter at 30 kV for a 5 cm compressed breast thickness (Tables 7 and 8 in Reference 25), the DgN values are 12.5% larger for the median 16% glandular fraction breast than for a mythical 50% glandular fraction breast. These observations are true using historical DgN values, which have been based upon the assumption that the glandular tissue and adipose tissue in the breast are perfectly mixed throughout the volume of the breast. We show in the next section that this assumption has been changed with the advent of high resolution 3-D breast image data sets.
Breast Density: Distribution
Virtually all breast dosimetry reports prior to 2014 assumed a homogeneous distribution of glandular and adipose tissue throughout the breast volume. This means that, for example, for a breast with a 16% glandular fraction, every voxel in the breast (except for skin) was comprised of a mixture of 16% glandular tissue and 84% adipose tissue. The advent of large numbers of breast CT image data sets has enabled a more detailed look at the spatial distribution of glandular tissue within the breast, based upon average values obtained from many women. These data have given rise to a more accurate, heterogeneous model of the glandular distribution within the breast.
Methods
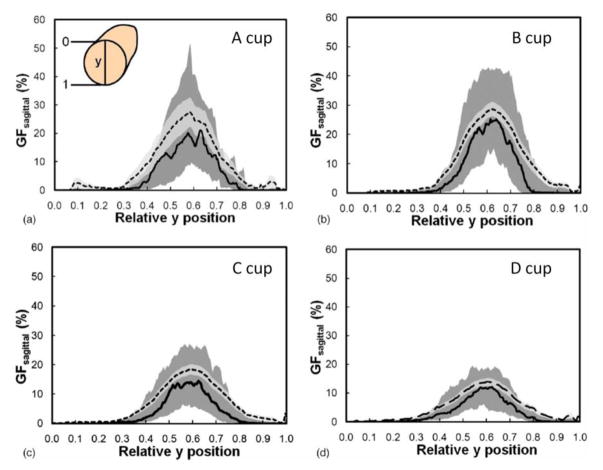
The volume data sets produced by breast CT of 200 women were evaluated in an initial study (Huang 201133). Prior to scanning, the only breast size-specific information available was a woman’s self-reported bra cup size. By use of segmented image data (where each voxel was characterized as being air, skin, adipose tissue, or glandular tissue), the radial distribution of glandular tissue was evaluated for each bra cup size (A, B, C, and D). The radial distribution was evaluated by first finding the center of mass in the coronal projection, at each point along the z (posterior-anterior) direction. A total of 100 annuli were centered at the center of mass, and the fraction of glandular voxels within each annulus was computed and averaged across all women with the same bra cup size. The diameter of each breast was normalized to unity, so each breast was scaled such that all 100 annuli were aligned within each breast. This study characterized the radial glandular fraction that was parameterized and used subsequently in reference 36.
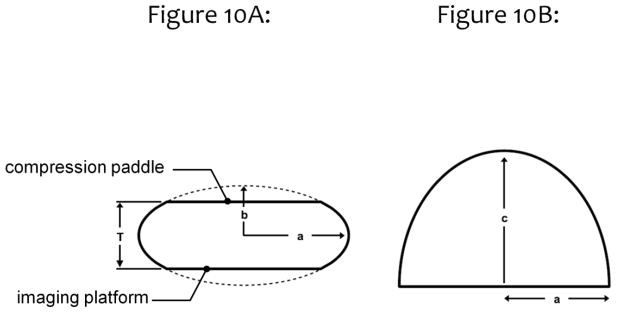
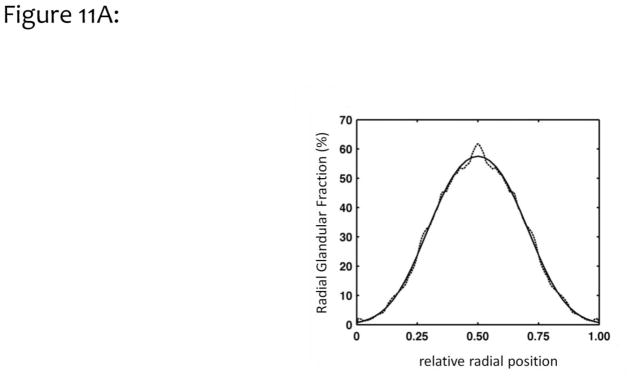
In a more thorough evaluation of the dosimetric ramifications of a heterogeneous glandular distribution in mammographic imaging, the breast was modeled as idealized shapes as illustrated in Fig. 10. The coronal projection (Fig. 10A) of these model breasts was a truncated ellipsoid, where the bottom of the breast rests on the imaging platform, and the top of the breast is pressed against the compression paddle. The inferior-superior projection of the breast (Fig. 10B) shows an idealized half ellipse, typical of the compressed breast. The radial glandular fraction from the previous study (Huang, 2011) from all bra cup sizes was averaged and fitted to a bi-Gaussian distribution. This idealized fit is shown in Fig. 11A.
Figure 10.
This figure illustrates the mathematical model used to define the compressed breast geometry for a Monte Carlo comparison between the assumptions of a homogeneous glandular distribution and of a heterogeneous glandular distribution. The values of a, b, and c are defined in reference 36.
Adapted from a figure in reference 36.
Figure 11.
Figure 11A. The glandular breast distribution data shown in Fig. 9 was modeled as a bi-Gaussian distribution defining the spatial extent of glandular tissue in the compressed-breast model. With some minor discrepancy, the bi-Gaussian distribution characterizes the measured data reasonably well.
Adapted from a figure in reference 36.
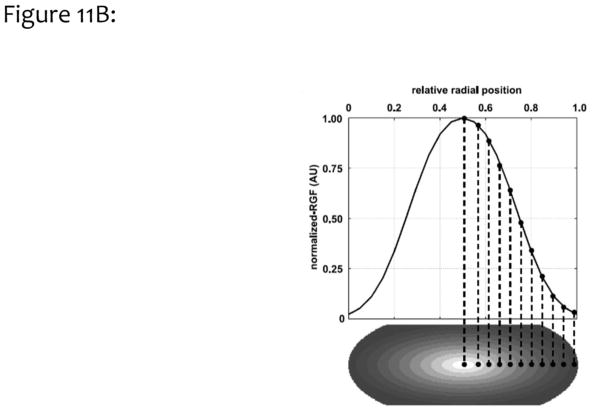
Figure 11B. The bi-Gaussian distribution was used to simulate heterogeneous VGF levels, with higher levels at the center of the breast and lower values extending toward the skin lines.
Adapted from a figure in reference 36.
Validation of the MCNPX Monte Carlo code was performed under the assumption of a homogeneous breast composition for both monoenergetic and polyenergetic x-ray beams. The monoenergetic data were compared with previous published work from Boone21,25, and the polyenergetic data were compared with previously published work by Wu23,24. A recently refined spectral model35 was used for spectrally weighting of monoenergetic DgN values so that polyenergetic DgN values were produced for comparison.
After validation of the homogeneous model, it was necessary to demonstrate the validity of calculating the glandular dose by use of a heterogeneous model. The homogeneous model assumed that every voxel in the breast contained a mixture of 17% glandular tissue and 83% adipose tissue. A heterogeneous model was designed in which all voxels were either 100% glandular tissue, or 100% adipose tissue. In this model, 17% of the voxels in the breast were purely glandular, and the remaining 83% of the voxels were purely adipose. The distribution of the glandular voxels throughout the breast was determined by use of a random number generator, with a uniform spatial distribution. It should be noted that the homogeneous model required multiplying the raw results by a correction factor25, whereas the heterogeneous model did not36.
After the heterogeneous model was validated as described above, more realistic glandular distributions were modeled in which the glandular fraction was the greatest in the center of the breast, and was reduced towards the edges, based upon the previously defined bi- Gaussian distribution. Breasts of different dimensions were modeled, and the median breast density for each breast size was assumed. The size-dependence of the breast density illustrated in Fig. 8 was then used to Monte Carlo model and compare the DgN values between the homogeneous and heterogeneous models for glandular tissue distribution.
For all Monte Carlo simulations, a minimum of one million photons was evaluated at each monoenergetic x-ray energy. If the noise in a simulation was greater than 5%, larger photon numbers were used to reduce quantum noise below 5%. To compute DgN values for polyenergetic x-ray beams, we used an appropriate x-ray spectrum to spectrally weight the monoenergetic dosimetry data. The x-ray spectra were generated using the recently-published TASMICS spectral model.36
Results
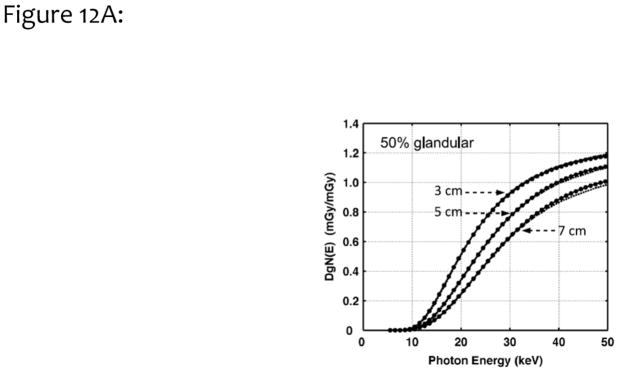
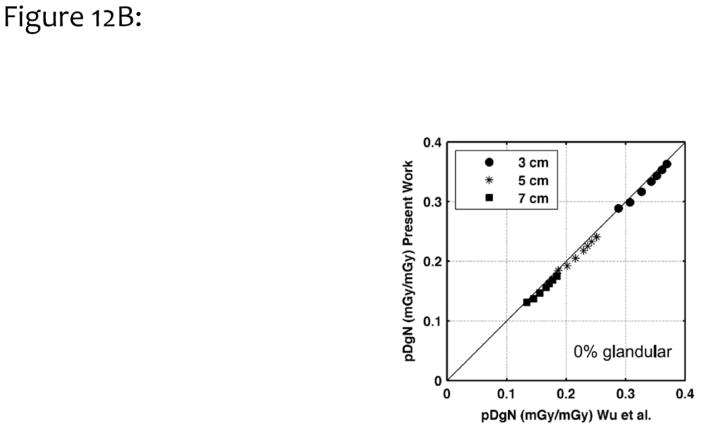
Figure 12A illustrates the monoenergetic DgN values as a function of photon energy for three different compressed breast thicknesses (as indicated in the figure). These data are for the assumption of a homogeneous 50% glandular breast. In this figure, the results are compared with those reported previously by Boone21. The average difference between the two methods was 1.2%, when data were averaged across all breast thicknesses and photon energies; thus, there was good correspondence. Fig. 12B compares polyenergetic DgN results with those produced by Wu et al.23,24, for a homogeneous 0% glandular breast. The difference was 3.8%, which is considered very good, given the differences in Monte Carlo code, spectral shape, phantom design, and decades between implementation.
Figure 12.
Figure 12A. To validate the Monte Carlo study, we compared monoenergetic DgN coefficients for three different breast compressed thicknesses (3, 5, and 7 cm) across a range of monoenergetic incident x-ray photons, for a 50% homogeneous glandular breast. These data were compared with earlier published work by Boone.
Adapted from a figure in reference 36.
Figure 12B. Polyenergetic DgN (pDgn) coefficients from this work were compared with those previously published by Wu, for homogeneous glandular breasts of different thicknesses (3, 5, 7 cm) and different spectra ranging from 23 kV to 35 kV (by 2 kV increments).
Adapted from a figure in reference 36.
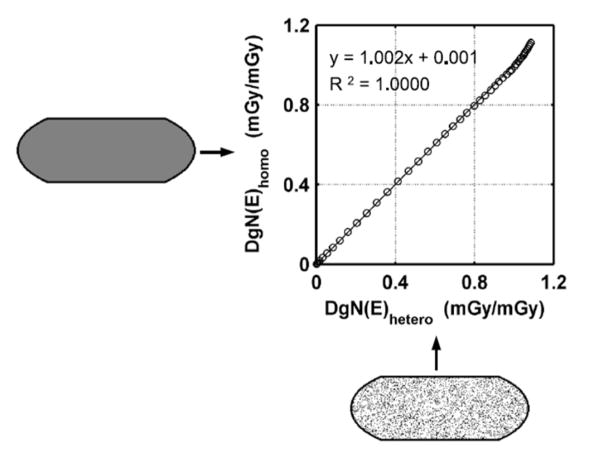
Figure 13 compares the monoenergetic DgN values for a completely homogeneous breast with a 17% glandular fraction (vertical axis) with those for a heterogeneous breast with a homogeneous distribution of 17% glandular voxels (horizontal axis). Excellent agreement between the two models was observed, demonstrating that the computational model using the heterogeneous distribution matched the performance of the homogeneous model quite well.
Figure 13.
This figure illustrates monoenergetic DgN coefficients calculated by use of both the homogeneous assumption (vertical axis) and the heterogeneous model with a homogeneous distribution (horizontal axis). Excellent correspondence is illustrated, showing the accuracy of the discrete-voxel heterogeneous model.
Adapted from a figure in reference 36
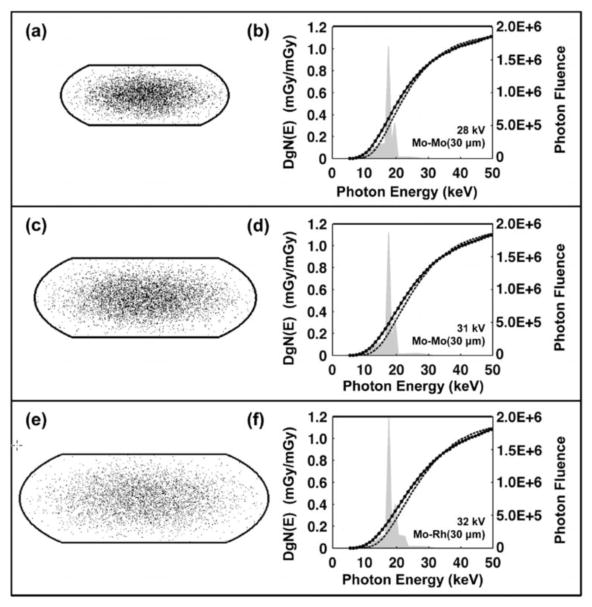
Figure 14 shows three different breast sizes on the left vertical panel, from small (a) to medium (c) to large (e). The median breast density was 17% for the small breast, 12.6% for the median breast, and 7% for the largest breast, showing the realistic decrease in glandular fraction as a function of breast size seen in Figure 8. The right column of graphs in Figure 14 illustrate the monoenergetic DgN coefficients for each breast size versus photon energy, with the darker line corresponding to the homogeneous glandular model and the thinner line corresponding to the heterogeneous (bi-Gaussian) model. Molybdenum anode spectra are also illustrated in the right column of figures, and these correspond to clinical technique factors that are used for each breast size: for the small breast, a 28 kV Mo/Mo spectrum; for the medium-sized breast, a 31 kV Mo/Mo spectrum, and for the large breast, a 32 kV Mo/Rh spectrum.
Figure 14.
Data for breasts ranging from small (a, b), to medium (c, d), to large (e, f) breasts are shown in this figure. Stochastic voxelized phantoms were used to simulate the heterogeneous distribution of glandular tissue, with higher concentrations toward the center and lower concentrations towards the edges of the breast. A 1.5 mm-thick-skin was modeled. The heterogeneous and homogeneous monoenergetic DgN values are shown in the three plots along the right-hand column of this figure, and the heterogeneous DgN values are lower than the homogeneous values for most combinations. The typical spectra used in mammography for the small to large breasts are superimposed on the figures with the DgN values. Most of the x-ray spectra coincide in regions along the curves where the separation between the (monoenergetic) homogeneous and heterogeneous DgN values is greatest. The product of the weighted spectra and the DgN (E) curves (with additional normalization) result in the polyenergetic DgN values.
Adapted from a figure in reference 36
The DgN (E) graphs on the right vertical panel of Figure 14 show that the curves for the homogeneous model are, in general, above those of the heterogeneous model. The difference between these two curves is largest at low x-ray energies and decreases at higher x-ray energies. The overlaid spectral shapes serve to illustrate the region on each curve which is most important clinically. It is seen that most of the spectra are positioned at relatively low photon energies, corresponding to the region where the difference between the two curves is greatest. Consequently, when spectral weighting is used to produce the realistic polyenergetic DgN values for these three breast sizes, the differences are considerable. For the small, medium, and large breasts, the polyenergetic DgN values for the molybdenum anode show differences of 28.6%, 36.4%, and 38.1%, respectively. The same data for tungsten anode spectra (graphs not shown) correspond to 19.3%, 25.4%, and 25.2%, respectively for the small, medium, and large breast models. In all cases, the DgN values produced by the more accurate heterogeneous model are significantly lower than those for the historically-used homogeneous model. For the molybdenum anode spectra averaged over breast size, the average reduction in the (clinically realistic) polyenergetic DgN values is 35.3%, and for the tungsten anode spectra the difference is 24.2%. These important findings are consistent with earlier observations by Dance37 and later by Sechopoulos.38 The contribution of our study is that the glandular distributions were modeled from the average of a relatively large population (N=219) over a range of women with different ages, breast density, ethnicity, and breast dimensions.
Breast Density Distribution Conclusions
Taking the molybdenum and tungsten anode data together, there is an approximate 30% reduction in the DgN values when an accurate heterogeneous model of glandular tissue distribution is considered. Referring to Equation 3, the determination of the air kerma (Ksk) used in clinical mammography settings has not been affected by the investigations described above; however, on average, the DgN value has been reduced by approximately 30%. This means that the MGD – the mean glandular dose – calculated clinically for the past four decades has been about 30% higher than these more recent findings would suggest.
Discussion
New knowledge can change old perceptions. With the advent of high-resolution three-dimensional breast imaging by dedicated breast CT, a better understanding of breast anatomy has emerged. However, this process developed gradually. The realization that the skin thickness is approximately 1.5 mm, as opposed to the 4.0 mm as assumed previously, led to an estimate of approximately 17% increase in DgN values, and hence in the MGD. Subsequently, it was realized that the average breast density was closer to 16% than to 50%, and this increased the DgN by another 13%. The combination of these two effects suggested higher radiation dose levels (DgN values) to the breast. However, by realistically modeling the distribution of glandular tissue in the breast, including the thinner skin and lower average breast densities, it was found that DgN values are decreased from historical values by 30%, a significant finding.
What accounts physically for the 30% reduction in DgN values (and hence the MGD) compared to historical values, as reported in reference 36? By realistically simulating the glandular tissue more centrally in the breast, the x-ray beam has to penetrate a thin skin layer and a relatively thick layer of adipose tissue before reaching the region of the breast where glandular tissue is more concentrated. Put simply, the outer skin and fat layers of the breast protect the glandular tissue by absorbing the high doses which occur as the x-ray beam enters the breast.
Summary
In this article, we reviewed three important issues which have an impact on 2-D mammography dosimetry. Whereas the focus of the discussion was on the influence that a better understanding of breast anatomy has on the DgN coefficient, the combination of all of these factors led to the observation that the result is a ~30% reduction in DgN values compared to historical norms. This means that the MGD reduced by the same factor. It is important to understand that the 30% reduction in MGD did not happen only in the last few years; this reduction in dose estimation stretches back to the earliest days of mammography. The breast anatomy has not changed over the last 40 years, it is just that our understanding of breast anatomy has improved, and this has better informed the ability to compute the radiation dose to the breast. This is true, indeed everywhere that routine breast screening has been implemented. Whereas a change in dogma requires years to have an impact on practice, the we hope in time the concepts described in this article will eventually be accepted into the clinical practice of medical physics. Indeed, there is a joint task group of the American Association of Physicists in Medicine (AAPM), the European Federation of Medical Physics (EFOMP), and the International Commission on Radiation Units and Measurement (ICRU), headed by Drs. Ioannis Sechopoulos and David Dance, which is focused on developing an international standard for breast dosimetry, based upon the many of the concepts discussed in this article and elsewhere.
Figure 9.
These four figures illustrate the radial distribution of glandular tissue for breasts classified by bra cup size (A to D). As the breast size changes, the distribution of the glandular components of the breast are approximately normally distributed, with lower VGF at the periphery of the breast and higher VGF levels towards the center.
Adapted from a figure in reference 33.
Acknowledgments
This communication was funded in part by NIH grants P30 CA093373 and R01 CA181081. The comments made are solely the responsibility of the authors and do not necessarily represent the official views of the National Cancer Institute or the National Institutes of Health.
References
- 1.Pagani JJ, Bassett LW, Gold R, et al. Efficacy of combined film-screen/xeromammography: preliminary report. American Journal of Roentgenology. 1980;135(1):141–146. doi: 10.2214/ajr.135.1.141. [DOI] [PubMed] [Google Scholar]
- 2.Jensen J, Butler P. Breast exposure: nationwide trends; a mammographic quality assurance program--results to date. Radiologic technology. 1978;50(3):251. [PubMed] [Google Scholar]
- 3.Fitzgerald M, White DR, White E, Young J. Mammographic practice and dosimetry in Britain. Br J Radiol. 1981;54(639):212–220. doi: 10.1259/0007-1285-54-639-212. [DOI] [PubMed] [Google Scholar]
- 4.United States. Department of Health E, Welfare, Service USPH, Health NIo. Final Reports of National Cancer Institute Ad Hoc Working Groups on Mammography Screening for Breast Cancer and Summary Report of Their Joint Findings and Recommendations. 1977 [Google Scholar]
- 5.Boag JW, Stacey AJ, Davis R. Radiation exposure to the patient in xeroradiography. Br J Radiol. 1976;49(579):253–261. doi: 10.1259/0007-1285-49-579-253. [DOI] [PubMed] [Google Scholar]
- 6.Dance DR, Skinner CL, Carlsson GA. Breast dosimetry. Appl Radiat Isot. 1999;50(1):185–203. doi: 10.1016/s0969-8043(98)00047-5. [DOI] [PubMed] [Google Scholar]
- 7.Barnes GT Medicine SEAAoPi. Screen film mammography: imaging considerations and medical physics responsibilities. proceedings of SEAAPM Spring Symposium; April 6, 1990; Columbia, South Carolina. Medical Physics Publishing; 1991. [Google Scholar]
- 8.Haus A, Yaffe M. A categorical course in physics: technical aspects of breast imaging. 80th Scientific Assembly of the Radiological Society of North America (RSNA); Oak Brook, IL. 1994; [Google Scholar]
- 9.Huda W, Nickoloff EL, Boone JM. Overview of patient dosimetry in diagnostic radiology in the USA for the past 50years. Medical physics. 2008;35(12):5713–5728. doi: 10.1118/1.3013604. [DOI] [PubMed] [Google Scholar]
- 10.Dance DR, Sechopoulos I. Dosimetry in x-ray-based breast imaging. Phys Med Biol. 2016;61(19):R271–R304. doi: 10.1088/0031-9155/61/19/R271. [DOI] [PMC free article] [PubMed] [Google Scholar]
- 11.Hammerstein GR, Miller DW, White DR, Masterson ME, Woodard HQ, Laughlin JS. Absorbed radiation dose in mammography. Radiology. 1979;130(2):485–491. doi: 10.1148/130.2.485. [DOI] [PubMed] [Google Scholar]
- 12.Karlsson M, Nygren K, Wickman G, Hettinger G. Absorbed dose in mammary radiography. Acta Radiol Ther Phys Biol. 1976;15(3):252–258. doi: 10.3109/02841867609131962. [DOI] [PubMed] [Google Scholar]
- 13.Sabel M, Ruff A, Weishaar J. Thermoluminescent dosimetry for radiation exposure of the breast during film and xeromammography (author’s transl) Rofo. 1978;128(5):616–622. doi: 10.1055/s-0029-1230915. [DOI] [PubMed] [Google Scholar]
- 14.Schneider G, Kindl P, Spreizer H. New Aspects in Evaluation of Average-Absorbed Dose of Parenchyma in Mammography. Fortschr Rontg Neuen. 1978;128(1):82–86. doi: 10.1055/s-0029-1230795. [DOI] [PubMed] [Google Scholar]
- 15.Shrivastava PN. Radiation-Dose in Mammography - an Energy-Balance Approach. Radiology. 1981;140(2):483–490. doi: 10.1148/radiology.140.2.7255726. [DOI] [PubMed] [Google Scholar]
- 16.Stanton L, Villafana T, Day JL, Lightfoot DA. Dosage Evaluation in Mammography. Radiology. 1984;150(2):577–584. doi: 10.1148/radiology.150.2.6691119. [DOI] [PubMed] [Google Scholar]
- 17.Lindfors KK, Boone JM, Nelson TR, Yang K, Kwan AL, Miller DF. Dedicated breast CT: initial clinical experience. Radiology. 2008;246(3):725–733. doi: 10.1148/radiol.2463070410. [DOI] [PMC free article] [PubMed] [Google Scholar]
- 18.Boone JM, Nelson TR, Lindfors KK, Seibert JA. Dedicated breast CT: radiation dose and image quality evaluation. Radiology. 2001;221(3):657–667. doi: 10.1148/radiol.2213010334. [DOI] [PubMed] [Google Scholar]
- 19.Sechopoulos I, Sabol JM, Berglund J, et al. Radiation dosimetry in digital breast tomosynthesis: report of AAPM Tomosynthesis Subcommittee Task Group 223. Med Phys. 2014;41(9):091501. doi: 10.1118/1.4892600. [DOI] [PubMed] [Google Scholar]
- 20.Chen L, Abbey CK, Nosratieh A, Lindfors KK, Boone JM. Anatomical complexity in breast parenchyma and its implications for optimal breast imaging strategies. Med Phys. 2012;39(3):1435–1441. doi: 10.1118/1.3685462. [DOI] [PMC free article] [PubMed] [Google Scholar]
- 21.Boone JM. Normalized glandular dose (DgN) coefficients for arbitrary X-ray spectra in mammography: computer-fit values of Monte Carlo derived data. Med Phys. 2002;29(5):869–875. doi: 10.1118/1.1472499. [DOI] [PubMed] [Google Scholar]
- 22.Dance DR. Monte Carlo calculation of conversion factors for the estimation of mean glandular breast dose. Phys Med Biol. 1990;35(9):1211–1219. doi: 10.1088/0031-9155/35/9/002. [DOI] [PubMed] [Google Scholar]
- 23.Wu X, Barnes GT, Tucker DM. Spectral dependence of glandular tissue dose in screen-film mammography. Radiology. 1991;179(1):143–148. doi: 10.1148/radiology.179.1.2006265. [DOI] [PubMed] [Google Scholar]
- 24.Wu X, Gingold EL, Barnes GT, Tucker DM. Normalized average glandular dose in molybdenum target-rhodium filter and rhodium target-rhodium filter mammography. Radiology. 1994;193(1):83–89. doi: 10.1148/radiology.193.1.8090926. [DOI] [PubMed] [Google Scholar]
- 25.Boone JM. Glandular breast dose for monoenergetic and high-energy X-ray beams: Monte Carlo assessment. Radiology. 1999;213(1):23–37. doi: 10.1148/radiology.213.1.r99oc3923. [DOI] [PubMed] [Google Scholar]
- 26.Huang SY, Boone JM, Yang K, Kwan AL, Packard NJ. The effect of skin thickness determined using breast CT on mammographic dosimetry. Med Phys. 2008;35(4):1199–1206. doi: 10.1118/1.2841938. [DOI] [PMC free article] [PubMed] [Google Scholar]
- 27.Shi L, Vedantham S, Karellas A, O’Connell AM. Technical note: Skin thickness measurements using high-resolution flat-panel cone-beam dedicated breast CT. Med Phys. 2013;40(3):031913. doi: 10.1118/1.4793257. [DOI] [PMC free article] [PubMed] [Google Scholar]
- 28.Boone JM, Buonocore MH, Cooper VN. Monte Carlo validation in diagnostic radiological imaging. Medical physics. 2000;27(6):1294–1304. doi: 10.1118/1.599007. [DOI] [PubMed] [Google Scholar]
- 29.Packard N, Boone JM. Glandular segmentation of cone beam breast CT volume images. Paper presented at: Medical Imaging; 2007. [Google Scholar]
- 30.Yaffe MJ. Mammographic density. Measurement of mammographic density. Breast Cancer Research. 2008;10(3):209. doi: 10.1186/bcr2102. [DOI] [PMC free article] [PubMed] [Google Scholar]
- 31.Byng JW, Yaffe MJ, Jong RA, et al. Analysis of mammographic density and breast cancer risk from digitized mammograms. Radiographics. 1998;18(6):1587–1598. doi: 10.1148/radiographics.18.6.9821201. [DOI] [PubMed] [Google Scholar]
- 32.Yaffe MJ, Boone JM, Packard N, et al. The myth of the 50-50 breast. Med Phys. 2009;36(12):5437–5443. doi: 10.1118/1.3250863. [DOI] [PMC free article] [PubMed] [Google Scholar]
- 33.Huang SY, Boone JM, Yang K, et al. The characterization of breast anatomical metrics using dedicated breast CT. Med Phys. 2011;38(4):2180–2191. doi: 10.1118/1.3567147. [DOI] [PMC free article] [PubMed] [Google Scholar]
- 34.Vedantham S, Shi L, Karellas A, O’Connell AM. Dedicated breast CT: fibroglandular volume measurements in a diagnostic population. Medical physics. 2012;39(12):7317–7328. doi: 10.1118/1.4765050. [DOI] [PMC free article] [PubMed] [Google Scholar]
- 35.Hernandez AM, Boone JM. Tungsten anode spectral model using interpolating cubic splines: unfiltered x-ray spectra from 20 kV to 640 kV. Med Phys. 2014;41(4):042101. doi: 10.1118/1.4866216. [DOI] [PMC free article] [PubMed] [Google Scholar]
- 36.Hernandez AM, Seibert JA, Boone JM. Breast dose in mammography is about 30% lower when realistic heterogeneous glandular distributions are considered. Med Phys. 2015;42(11):6337–6348. doi: 10.1118/1.4931966. [DOI] [PMC free article] [PubMed] [Google Scholar]
- 37.Dance DR, Hunt RA, Bakic PR, et al. Breast dosimetry using high-resolution voxel phantoms. Radiat Prot Dosimetry. 2005;114(1–3):359–363. doi: 10.1093/rpd/nch510. [DOI] [PubMed] [Google Scholar]
- 38.Sechopoulos I, Bliznakova K, Qin X, Fei B, Feng SS. Characterization of the homogeneous tissue mixture approximation in breast imaging dosimetry. Med Phys. 2012;39(8):5050–5059. doi: 10.1118/1.4737025. [DOI] [PMC free article] [PubMed] [Google Scholar]


