

Abstract
Background and Purpose
Ca2+‐activated Cl− channels (CaCCs) are gated open by a rise in intracellular Ca2+ concentration ([Ca2+]i), typically provoked by activation of Gq‐protein coupled receptors (GqPCR). GqPCR activation initiates depletion of plasmalemmal phosphatidylinositol 4,5‐bisphosphate (PIP2). Here, we determined whether PIP2 acts as a signalling lipid for CaCCs coded by the TMEM16A and TMEM16B genes.
Experimental Approach
Patch‐clamp electrophysiology, in conjunction with genetically encoded systems to control cellular PIP2 content, was used to define the mechanism of action of PIP2 on TMEM16A and TMEM16B channels.
Key Results
A water‐soluble PIP2 analogue (diC8‐PIP2) activated TMEM16A channels by up to fivefold and inhibited TMEM16B by ~0.2‐fold. The effects of diC8‐PIP2 on TMEM16A currents were especially pronounced at low [Ca2+]i. In contrast, diC8‐PIP2 modulation of TMEM16B channels did not vary over a broad [Ca2+]i range but was only detectable at highly depolarized membrane potentials. Modulation of TMEM16A and TMEM16B currents was due to changes in channel gating, while single channel conductance was unaltered. Co‐expression of TMEM16A or TMEM16B with a Danio rerio voltage‐sensitive phosphatase (DrVSP), which degrades PIP2, led to reduction and enhancement of TMEM16A and TMEM16B currents respectively. These effects were abolished by an inactivating mutation in DrVSP and antagonized by simultaneous co‐expression of a phosphatidylinositol‐4‐phosphate 5‐kinase that catalyses PIP2 formation.
Conclusions and Implications
PIP2 acts as a modifier of TMEM16A and TMEM16B channel gating. Drugs interacting with PIP2 signalling may affect TMEM16A and TMEM16B channel gating and have potential uses in basic science and implications for therapy.
Abbreviations
- CaCC
calcium‐activated chloride channel
- DrVSP
Danio rerio voltage‐sensitive phosphatase
- Erev
reversal potential
- GqPCR
Gq‐protein coupled receptors
- IP3
inositol triphosphate
- PIP2
phosphatidylinositol 4,5‐bisphosphate
- PLC
phospholipase C
- PIPK
PIP 5‐kinase type Iγ
- Vm
membrane potential
Introduction
Calcium‐activated chloride channels (CaCCs) are anion channels that are gated open in response to an increase in intracellular free Ca2+ concentration ([Ca2+]i), and by changes in the cell membrane potential (V m) towards depolarized values (Hartzell et al., 2005; Ferrera et al., 2011; Huang et al., 2012a). Thus, CaCCs provide a link between Ca2+ signalling and membrane electrical activity. CaCCs are present in a wide range of tissues and play diverse physiological roles including modulation of mucus secretion in epithelial cells, control of neuronal and cardiac excitability as well as modulation of smooth muscle contraction (Hartzell et al., 2005; Ferrera et al., 2011; Huang et al., 2012a).
The TMEM16 family encompasses genes coding for CaCCs, such as TMEM16A and TMEM16B, as well as a gene (TMEM16F) encoding a protein with reportedly combined ion channel and lipid scramblase activity (Pedemonte and Galietta, 2014; Picollo et al., 2015). The TMEM16A and TMEM16B channels share significant (~55%) sequence homology and present similarities in their electrophysiological properties (Scudieri et al., 2011). For example, TMEM16A and TMEM16B display very similar degrees of selectivity and permeability to a range of anions (Adomaviciene et al., 2013). Furthermore, the TMEM16A and TMEM16B channels are activated within overlapping ranges of [Ca2+]i (e.g. Adomaviciene et al., 2013; Betto et al., 2014; Cruz‐Rangel et al., 2015). The TMEM16A and TMEM16B paralogues also share some pharmacological properties. For instance, both TMEM16A and TMEM16B are modulated in a complex manner by antracene‐9‐carboxilic acid (A9C) (Cherian et al., 2015; Ta et al., 2016). These channels are inhibited by A9C via an open channel block mechanism while also being allosterically activated by the compound (Cherian et al., 2015; Ta et al., 2016). TMEM16A and TMEM16B are also blocked by other commonly used Cl− channel blockers such as 4,4′‐diisothiocyano‐2,2′‐stilbenedisulfonic acid (DIDS) and niflumic acid with comparable potencies (Bradley et al., 2014; Liu et al., 2015; Pifferi et al., 2009). In contrast, a recently identified drug (Ani9) selectively inhibited TMEM16A, with no significant block of TMEM16B (Seo et al., 2016).
TMEM16A and TMEM16B differ in terms of their expression profiles and physiological roles. TMEM16A is involved in functions such as transepithelial Cl− transport (Kunzelmann et al., 2012; Scudieri et al., 2012; Huang et al., 2012a) and in the modulation of smooth muscle tone (Davis et al., 2010; Manoury et al., 2010; Thomas‐Gatewood et al., 2011; Heinze et al., 2014; Wang et al., 2015). Conversely, TMEM16B is chiefly involved in the control of sensory processes including olfaction and vision (Stephan et al., 2009; Stohr et al., 2009; Hengl et al., 2010; Pietra et al., 2016) and is expressed in neuronal and glial cells (Ayoglu et al., 2016). In spite of participating in somewhat distinct physiological functions, TMEM16A and TMEM16B appear to be modulated by common signalling pathways. It is well established that activation of Gq‐protein coupled receptors, such as α1‐adrenoceptors and P2Y receptors, leads to activation of phospholipase C (PLC) that breaks down phosphatidylinositol 4,5‐bisphosphate (PIP2) and leads to the formation of inositol triphosphate (IP3). TMEM16A and TMEM16B channels can be activated by an IP3‐mediated increase in [Ca2+]i (Hartzell et al., 2005; Ferrera et al., 2011; Huang et al., 2012a). Understanding whether agonist‐induced changes in PIP2 levels also participate in the control of the activity of TMEM16A and TMEM16B channels is an important question in the cellular physiology of CaCCs. Indeed, PIP2 is known to modulate the activity of a variety of ion channel types (Suh and Hille, 2008; Hille et al., 2015).
A recent study presented biochemical evidence that PIP2 binds to both cloned and native smooth muscle TMEM16A channels (Pritchard et al., 2014). This study also included functional evidence that PIP2 modulates native CaCC currents in rat isolated, pulmonary artery smooth muscle cells (rPASMCs). For instance, inclusion of diC8‐PIP2, a water‐soluble PIP2 analogue, into the pipette solution led to a decrease in whole‐cell CaCC current in rPASMCs. Thus, it was proposed that PIP2 has an inhibitory effect on the native CaCC current in rPASMCs. Whether PIP2 functionally modulates cloned TMEM16A channels remains to be established. Furthermore, the possible modulation of the closely related TMEM16B channels by PIP2 has never been tested. Studying PIP2 modulation of cloned TMEM16A and TMEM16B channels in a heterologous expression system allows the underlying molecular mechanism to be examined in the absence of additional tissue‐specific modulatory pathways.
Here, we showed that cloned TMEM16A and TMEM16B channels are differentially modulated by PIP2, being activated and inhibited by this lipid respectively. The effect of PIP2 on TMEM16A channels was especially pronounced in the low μM range of [Ca2+]i and was observed at negative as well as positive V m. In contrast, the effects of PIP2 on TMEM16B did not differ significantly over a wide range of [Ca2+]i but was only detectable at highly depolarized V m (≥50 mV). Thus, PIP2 may modulate TMEM16A under resting conditions as well as during membrane depolarization. In contrast, TMEM16B may be modulated only at highly depolarized V m, which might be reached by some types of excitable cells during action potential firing, especially during pathological conditions associated with elevations of the action potential peak. Identification of these new regulatory mechanisms highlights novel pathways for potential pharmacological intervention; small molecules that affect PIP2 metabolism or directly interfere with PIP2 binding/transduction on TMEM16A or TMEM16B channels could affect channel gating and serve as novel channel modulators.
Methods
Cell culture and transfection
This study involved (i) mouse TMEM16A [isoform (ac) (Caputo et al., 2008)] channels; (ii) mouse TMEM16B [isoform A (Ponissery Saidu et al., 2013)] channels; (iii) PIP 5‐kinase type Iγ (PIPK) (provided by Y. Aikawa and T.F. Martin, University of Wisconsin, Madison, WI) each subcloned into the pcDNA3.1 vector; and (iv) Danio rerio voltage‐sensitive phosphatase (DrVSP) subcloned into pIRES‐EGFP vector (provided by Prof Y. Okamura, Osaka University). Site‐directed mutagenesis was performed as described previously (Tammaro and Ashcroft, 2009). HEK‐293T cells were cultured as previously described (Smith et al., 2013) and transfected with 0.6 μg of TMEM16A or TMEM16B, 1 μg of DrVSP or PIPK and 0.2 μg of CD8 constructs using Fugene HD (Promega, UK) according to the manufacturer's instructions. Cells were used ~12–36 h after transfection. Transfected cells were visualized using the anti‐CD8 antibody‐coated beads method (Jurman et al., 1994). Cells expressing CD8 were randomly selected for patch‐clamp recordings.
Electrophysiology
TMEM16A and TMEM16B currents were measured with the whole‐cell or inside‐out configuration of the patch‐clamp technique as detailed in the Supplementary Information.
Composition of solutions
The extracellular solution contained (mM): 150 NaCl, 1 CaCl2, 1 MgCl2, 10 glucose, 10 D‐mannitol and 10 HEPES; pH was adjusted to 7.4 with NaOH. The intracellular solution contained (mM): 130 CsCl, 10 EGTA, 1 MgCl2, 10 HEPES and 8 CaCl2 to obtain ~0.3 μM of [Ca2+]i; pH was adjusted to 7.3 with NaOH. Nominally, Ca2+‐free solution was obtained by omitting CaCl2. The intracellular solutions containing ~0.6, ~1, ~2 and ~78 μM [Ca2+]i were obtained by replacing EGTA with equimolar H‐EDTA and by adding 2.1, 3.1, 4.8 and 9 mM CaCl2 respectively. In the experiments involving recovery of the DrVSP‐mediated modulation of TMEM16A and TMEM16B currents, MgATP (1 mM) was included in the pipette solution.
The water‐soluble PIP2 analogue diC8‐PIP2 (Echelon Biosciences, Salt Lake City, UT) was dissolved in an aqueous stock solution at 5 mg·mL−1, aliquoted and kept at −20°C. An appropriate amount of these stock aliquots was added to electrophysiological solutions on the day of the experiment. The resulting working solutions had concentrations of 1 μg·mL−1 (1.17 μM), 3 μg·mL−1 (3.51 μM), 10 μg·mL−1 (11.7 μM), 30 μg·mL−1 (35.1 μM) or 100 μg·mL−1 (117 μM).
Main stimulation protocols
Current versus diC8‐PIP2 concentration ([diC8‐PIP2]) relationship
In our recordings conditions, HEK‐293T cells presented a small endogenous background current (Adomaviciene et al., 2013; Ta et al., 2016). To assess the sensitivity of TMEM16A and TMEM16B channels to diC8‐PIP2 during inside‐out patch‐clamp recordings (experiments of Figures 1 and 2), the currents were measured at +70 mV in nominally Ca2+‐free solution and in solutions containing a given [Ca2+]i. The small current measured in Ca2+‐free solution constitutes the endogenous background current and was subtracted offline from the current measured in the presence of Ca2+ before averaging the results. Thus, the resulting current represents the CaCC current component due to TMEM16A or TMEM16B channel activity.
Figure 1.
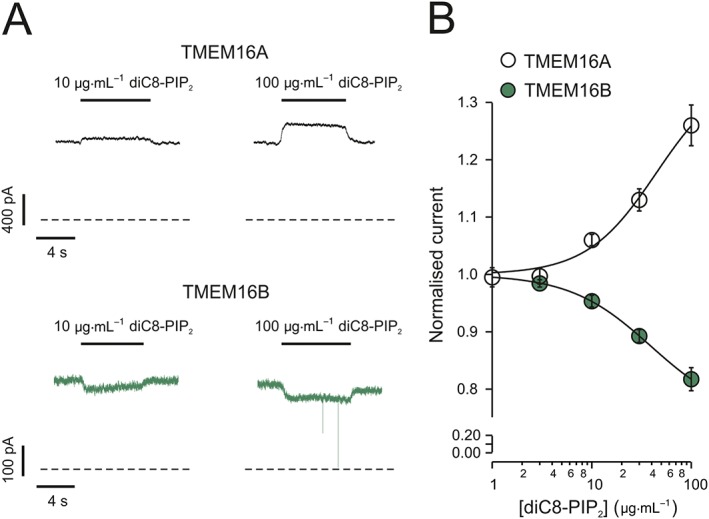
Effects of diC8‐PIP2 on TMEM16A and TMEM16B currents. (A) Currents recorded from inside‐out patches excised from HEK‐293T cells expressing either TMEM16A or TMEM16B, as indicated. diC8‐PIP2 was applied to the intracellular side of the patch, as indicated by the horizontal bars. The V m was maintained at +70 mV for the entire duration of the recordings. [Ca2+]i was 0.6 or 1 μM for experiments involving TMEM16A or TMEM16B respectively. Dashed lines represent zero‐current levels. (B) Mean relationships between diC8‐PIP2 concentration ([diC8‐PIP2]) and TMEM16A or TMEM16B currents, expressed relative to the current measured in the absence of diC8‐PIP2. The smooth curves through the points represent the best fits of the data using equation 1 (TMEM16A) or equation 2 (TMEM16B). The number of experiments was 12 (TMEM16A) or 9 (TMEM16B).
Figure 2.
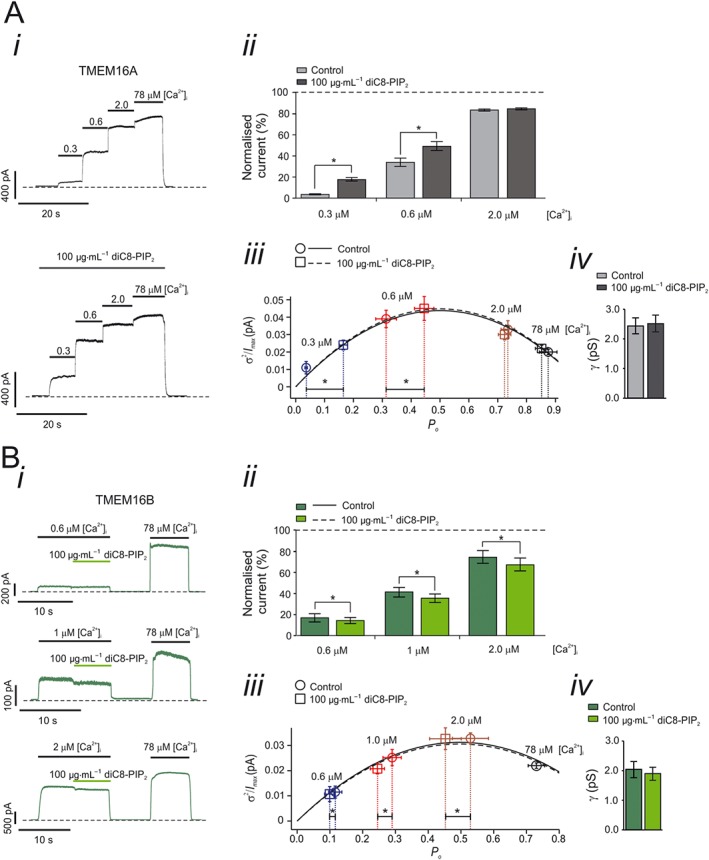
Effects of [Ca2+]i on the sensitivity of TMEM16A and TMEM16B currents to intracellular diC8‐PIP2. (A, panel i) Currents recorded from an inside‐out patch excised from a HEK‐293T cell expressing TMEM16A in response to various [Ca2+]i, as indicated by the horizontal bars. diC8‐PIP2 [100 μg·mL−1 (117 μM)] was applied to the intracellular side of the patch, as indicated by the horizontal bar. The V m was maintained at +70 mV for the entire duration of the recordings. Dashed lines represent zero‐current levels. (A, panel ii) Mean TMEM16A current amplitudes measured in the absence (control) or presence of diC8‐PIP2 and various [Ca2+]i. Currents measured at each [Ca2+]i were normalized to the current measured in 78 μM [Ca2+]i. (A, panel iii) TMEM16A current variance (σ 2) normalized for the maximal current (I max) and plotted against the P o for tracts of stationary currents recorded in the presence of various [Ca2+]i and in the absence or presence of diC8‐PIP2. The parabolic lines are the best fit of the data using a quadratic function. (A, panel iv) Mean TMEM16A single channel conductance (γ) obtained from stationary noise analysis conducted in the presence or absence of diC8‐PIP2 [100 μg·mL−1 (117 μM)]. The number of experiments was 15 in each case. * P < 0.05 (paired t‐test). (B, panel i) Currents recorded from inside‐out patches excised from HEK‐293T cells expressing TMEM16B, in response to various [Ca2+]i as indicated by the horizontal bars. diC8‐PIP2 [100 μg·mL−1 (117 μM)] was applied to the intracellular side of the patch as indicated by the horizontal bars. The V m was maintained at +70 mV for the entire duration of the recordings. Dashed lines represent zero‐current levels. (B, panel ii) Mean TMEM16B current amplitudes measured in the absence (control) or presence of diC8‐PIP2 and various [Ca2+]i. Currents measured at each [Ca2+]i were normalized to the current measured in 78 μM [Ca2+]i. (B, panel iii) TMEM16B current variance (σ 2) normalized for the maximal current (I max) and plotted against the P o for tracts of stationary currents recorded in the presence of various [Ca2+]i in the absence and presence of diC8‐PIP2. The parabolic lines are the best fit of the data using a quadratic function. (B, panel iv) Mean TMEM16B single channel conductance (γ) obtained from stationary noise analysis conducted in the presence or absence of diC8‐PIP2 [100 μg·mL−1 (117 μM)]. The number of experiments was 9 (experiments conducted in 0.6 μM [Ca2+]i), 12 (1.0 μM [Ca2+]i) or 21 (2.0 μM [Ca2+]i). * P < 0.05 (paired t‐test).
TMEM16A and TMEM16B currents measured in the presence of diC8‐PIP2 (I diC8‐PIP2) were normalized to currents measured in the absence of diC8‐PIP2 (I 0) and plotted against diC8‐PIP2 concentration ([diC8‐PIP 2]). As outlined in the Results section, TMEM16A and TMEM16B currents were activated and inhibited by diC8‐PIP2 respectively.
The [diC8‐PIP 2]‐response curves for TMEM16A were fitted with a Hill equation of the form
| (1) |
where A max is the maximal TMEM16A current activation, K a is the [diC8‐PIP 2] at which activation is half‐maximal and h is the Hill coefficient.
The [diC8‐PIP 2]‐response curves for TMEM16B were fitted with a Hill equation of the form
| (2) |
where K i is the [diC8‐PIP 2] at which inhibition is half maximal and j is the Hill coefficient.
Current versus V m relationship (I–V‐tail protocol)
Current versus V m relationships were constructed by measuring currents in response to V m steps of 1 s duration (test pulses) from −100 to +140 mV in 40 mV increments. Each test pulse was preceded by a V m step to +70 mV of 1 s duration (pre‐pulse). Pulses were elicited every 2 s from a holding V m of 0 mV. Steady‐state currents were measured at the end of the test pulses. For determination of the current reversal potential (E rev), instantaneous currents were estimated from extrapolation of single exponential fits of the test‐pulse currents to the beginning of each test pulse. These instantaneous current values were plotted as a function of the V m. The chord conductance and E rev were determined from the linear fit of the instantaneous I–V m relationship (Tammaro et al., 2005; Adomaviciene et al., 2013).
Stationary noise analysis
Stationary noise analysis (DeFelice, 1981) assumes that there are N independent and identical channels with a single conducting level, i. The macroscopic current (I) is given by
| (3) |
From binomial theory, the variance, σ 2, is related to I by
| (4) |
Tracts (1–5 s duration) of stationary currents were measured at +70 mV and in different [Ca2+]i in both the absence and presence of diC8‐PIP2. For each tract of current, the σ 2 and mean I were calculated. Background variance and current measured in 0 [Ca2+]i were subtracted, and the σ 2 ‐I plot was fit with equation 4 with i and N as free parameters. Single channel conductance (γ) was calculated by dividing i by the V m at which the experiment was conducted. The σ 2 and I measured at each [Ca2+]i were subsequently normalized for the estimated maximal current (I max, corresponding to P o = 1) and averaged. In this way, the ordinate represents σ 2/I max and the abscissa represents P o.
Recovery of TMEM16A currents from DrVSP‐mediated inhibition
A double‐pulse protocol was used to determine the time required for the response of TMEM16A or TMEM16B currents to recover following DrVSP activation during a 4 s pulse to +100 mV (conditioning pulse). The conditioning pulse was followed by a varying recovery period (3 to 55 s) at −50 mV and a subsequent 4 s test pulse to +100 mV. The effect of DrVSP was assessed by measuring the difference between the peak (I p) and the steady‐state (I ss) current elicited by each depolarizing pulse (I p − I ss). The extent of recovery was expressed as the ratio of I p − I ss measured during a test pulse relative to that measured during the conditioning pulse. Time constant of recovery (τ r) was obtained by fitting a single exponential function to the relationship between extent of recovery and the duration of the recovery period.
Data analysis
Data and statistical analysis comply with the recommendations on experimental design and analysis in pharmacology (Curtis et al., 2015). Electrophysiological data were analysed with routines developed in the IgorPro (Wavemetrics, OR, USA) environment. Methods of analysis were established during study design, and prior to execution of the experiments, to remove possible operator bias. Statistical significance was determined with two‐tailed paired or unpaired t‐tests or one‐way ANOVA with Bonferroni's post test, as appropriate. For all statistical tests, P‐values < 0.05 were considered significant. Data are given as mean ± SEM alongside the number of experiments (n). The SPSS (version 22; SPSS Inc., Chicago, IL, USA) or Excel (Microsoft, USA) programmes were used for statistical analysis.
Nomenclature of targets and ligands
Key protein targets and ligands in this article are hyperlinked to corresponding entries in http://www.guidetopharmacology.org, the common portal for data from the IUPHAR/BPS Guide to PHARMACOLOGY (Southan et al., 2016), and are permanently archived in the Concise Guide to PHARMACOLOGY 2015/16 (Alexander et al., 2015).
Results
Sensitivity of TMEM16A and TMEM16B channels to diC8‐PIP2
The project began by testing the sensitivity of cloned TMEM16A channels to diC8‐PIP2, a water soluble PIP2 analogue frequently used to investigate the sensitivity of ion channels to PIP2 (Suh and Hille, 2008; Hille et al., 2015). TMEM16A currents were recorded in inside‐out patches excised from transfected HEK‐293T cells (Figure 1). In these experiments, V m was kept constant at +70 mV and [Ca2+]i was 0.6 μM. This [Ca2+]i caused near half‐maximal TMEM16A channel activation (see below, Figure 2A). When diC8‐PIP2 was applied to the intracellular side of the patch, the TMEM16A current increased in a dose‐dependent manner up to a factor of 1.26 ± 0.04 (n = 12) in 100 μg·mL−1 (117 μM) diC8‐PIP2 (Figure 1). As described in greater detail below, the activating effect of PIP2 on TMEM16A channels became much more pronounced in the presence of lower [Ca2+]i. The TMEM16A sequence shares significant degree of homology with that of TMEM16B. We therefore tested the possibility that TMEM16B is also modulated by diC8‐PIP2. Because TMEM16B channels are less sensitive to activation by [Ca2+]i than TMEM16A channels (Adomaviciene et al., 2013; Scudieri et al., 2013), the [Ca2+]i in these experiments was elevated to 1 μM, a value causing approximately half‐maximal activation in our experimental conditions (Figure 2B). In this way, the effect of diC8‐PIP2 could be compared under conditions that cause similar extent of activation of TMEM16A and TMEM16B currents. Surprisingly, it was found that diC8‐PIP2 100 μg·mL−1 (117 μM) inhibited TMEM16B currents by up to a factor of 0.82 ± 0.02 (n = 9) (Figure 1). The Hill fit of the relationships between the TMEM16A or TMEM16B currents and [diC8‐PIP2] yielded a K a of ~45 μg·mL−1 (~53 μM) and h of ~1.2 (TMEM16A) (Table 1) and K i of ~39 μg·mL−1 (~46 μM) and j of ~1.1 (TMEM16B) (Table 2).
Table 1.
Parameters obtained from the Hill fit of the relationship between the extent of TMEM16A current activation and [diC8‐PIP2]
| K a (μg·mL−1) | K a (μM) | h | A max | |
|---|---|---|---|---|
| TMEM16A | 45 ± 8 (n = 12) | 53 ± 9 (n = 12) | 1.2 ± 0.4 (n = 12) | 1.4 ± 0.1 (n = 12) |
A max, maximal extent of current activation; h, Hill coefficient; K a, diC8‐PIP2 concentration producing half‐maximal activation of the channel (expressed in either in μg·mL−1 or in μM).
Table 2.
Parameters obtained from the Hill fit of the relationship between the extent of TMEM16B current inhibition and [diC8‐PIP2]
| K i (μg·mL−1) | K i (μM) | j | |
|---|---|---|---|
| TMEM16B | 39 ± 2 (n = 9) | 46 ± 2 (n = 9) | 1.1 ± 0.1 (n = 9) |
j, Hill coefficient; K i, diC8‐PIP2 concentration producing half‐maximal inhibition of the channel (expressed in either in μg·mL−1 or in μM).
Effects of intracellular Ca2+ on the sensitivity of TMEM16A and TMEM16B channels to diC8‐PIP2
Intracellular Ca2+ levels are dynamically regulated in both excitable and non‐excitable cells. We asked if the effects of diC8‐PIP2 on cloned TMEM16A and TMEM16B channels varied depending on [Ca2+]i. TMEM16A currents were recorded from inside‐out patches exposed to different [Ca2+]i in the absence or presence of 100 μg·mL−1 (117 μM) diC8‐PIP2 (Figure 2Ai). Currents were normalized for the currents observed in the presence of 78 μM [Ca2+]i as this Ca2+ level maximally activates TMEM16A channels (e.g. Adomaviciene et al., 2013; Scudieri et al., 2013). TMEM16A currents were not affected by 100 μg·mL−1 (117 μM) PIP2 under these conditions (Suppl. Figure S1). In the presence of 0.3 μM [Ca2+]i, diC8‐PIP2 increased the currents by a factor of 5.27 ± 1.29 (n = 15). In contrast, in the presence of 0.6 μM [Ca2+]i, diC8‐PIP2 caused an increase of the currents by a factor of 1.44 ± 0.17 (n = 15) while in 2 μM [Ca2+]i, there was no significant current activation (Figure 2Aii). Thus, the effects of diC8‐PIP2 on TMEM16A currents are strongly [Ca2+]i‐dependent.
To quantify the effects of [Ca2+]i on the sensitivity of TMEM16B channels to diC8‐PIP2, a protocol distinct from the one adopted for TMEM16A channels was used. This was because we found that TMEM16B currents ran‐down more rapidly than TMEM16A currents when exposed to high [Ca2+]i. Thus, an experimental protocol of overall shorter duration was used to examine diC8‐PIP2 effect on TMEM16B currents. For each individual patch, the effect of diC8‐PIP2 was tested for an individual [Ca2+]i and currents were normalized for the currents obtained in 78 μM [Ca2+]i (Figure 2Bi). This approach was justified by the fact that diC8‐PIP2 did not modulate TMEM16B currents measured in 78 μM [Ca2+]i (Suppl. Figure S1). diC8‐PIP2 inhibited the currents by a factor of 0.85 ± 0.02 (n = 9) in 0.6 μM [Ca2+]i, 0.87 ± 0.02 (n = 12) in 1.0 μM [Ca2+]i, and 0.89 ± 0.01 (n = 21) in 2.0 μM [Ca2+]i (Figure 2Bii). These degrees of inhibition were not statistically different from each other (one‐way ANOVA). Thus, the effects of diC8‐PIP2 on TMEM16B currents did not vary within the 0.6–2 μM [Ca2+]i range, although there was no detectable diC8‐PIP2 inhibition in the presence of very high [Ca2+]i (~78 μM), which resulted in maximal channel activation.
Changes in macroscopic current amplitude may be caused by changes in i, P o or N. Changes in N are unlikely to occur in our experimental conditions (inside‐out patch‐clamp) as channel trafficking requires intracellular components that are presumably disrupted during patch excision. Stationary noise analysis revealed that application of diC8‐PIP2 [100 μg·mL−1 (117 μM)] resulted in an increase in P o of TMEM16A channels. This increase was Ca2+ dependent: P o was increased by 5.90 ± 1.20 (n = 15) fold in the presence of 0.3 μM [Ca2+]i while in the presence of 0.6 μM [Ca2+]i it increased only by a factor of 1.63 ± 0.17 (n = 15) and there was no detectable change in ≥2 μM [Ca2+]i (Figure 2Aiii). In contrast, γ of the TMEM16A channel was not affected by diC8‐PIP2 being ~2.5 pS in both the absence and presence of the lipid (Figure 2Aiv). Stationary noise analysis also revealed that diC8‐PIP2 caused reduction in P o of TMEM16B channels of a factor 0.87 ± 0.02 (n = 9), 0.85 ± 0.02 (n = 12) and 0.85 ± 0.02 (n = 21) in 0.6 μM, 1.0 μM and 2.0 μM [Ca2+]i, respectively (Figure 2Biii). The γ of the TMEM16B channel was ~2 pS in both the absence and presence of diC8‐PIP2 (Figure 2Biv). Thus, the changes in TMEM16A and TMEM16B current amplitudes caused by diC8‐PIP2 were due to changes in channel gating while γ was not affected.
Effects of Vm on the sensitivity of TMEM16A and TMEM16B channels to diC8‐PIP2
We next tested the effects of diC8‐PIP2 at various V m. During inside‐out patch‐clamp, a pre‐pulse of +70 mV was used to open TMEM16A or TMEM16B channels followed by a series of test pulses (I_V tail protocol (Figure 3Ai)). TMEM16A and TMEM16B currents were recorded in the presence of 0.3 μM and 0.6 μM [Ca2+]i, respectively (Figure 3Ai and Figure 3Bi). These [Ca2+]i were chosen as the effect of diC8‐PIP2 on TMEM16A is especially pronounced at 0.3 μM [Ca2+]i while 0.6 μM [Ca2+]i is a concentration that causes comparable basal activation of TMEM16B channels in our experimental conditions. The first observation was that the intracellular diC8‐PIP2 did not alter the E rev of TMEM16A or TMEM16B current. In the absence and presence of 100 μg·mL−1 (117 μM) diC8‐PIP2 in the intracellular solution, the E rev of TMEM16A current was 3.1 ± 1.1 mV (n = 9) and 3.4 ± 0.4 mV (n = 9), respectively (Figure 3Aii), and the E rev of TMEM16B was −1.3 ± 1.0 mV (n = 15) and −1.2 ± 1.4 mV (n = 15), respectively (Figure 3Bii). These values are very close to the expected E rev for Cl− in our recording conditions (~1 mV). Thus, diC8‐PIP2 did not alter the TMEM16A and TMEM16B channel selectivity to ions. The slope of the instantaneous current versus voltage relationship provides a measure of the conductance of the membrane. In the absence and presence of 100 μg·mL−1 (117 μM) diC8‐PIP2 in the intracellular solution, the membrane conductance for patches expressing TMEM16A was significantly increased from 1.3 ± 0.2 nS (n = 9) to 4.1 ± 0.8 nS (n = 9) (P < 0.05, paired t‐test) while for patches expressing TMEM16B it was significantly decreased from 1.9 ± 0.2 nS (n = 15) to 1.6 ± 0.2 nS (n = 15) (P < 0.05, paired t‐test).
Figure 3.
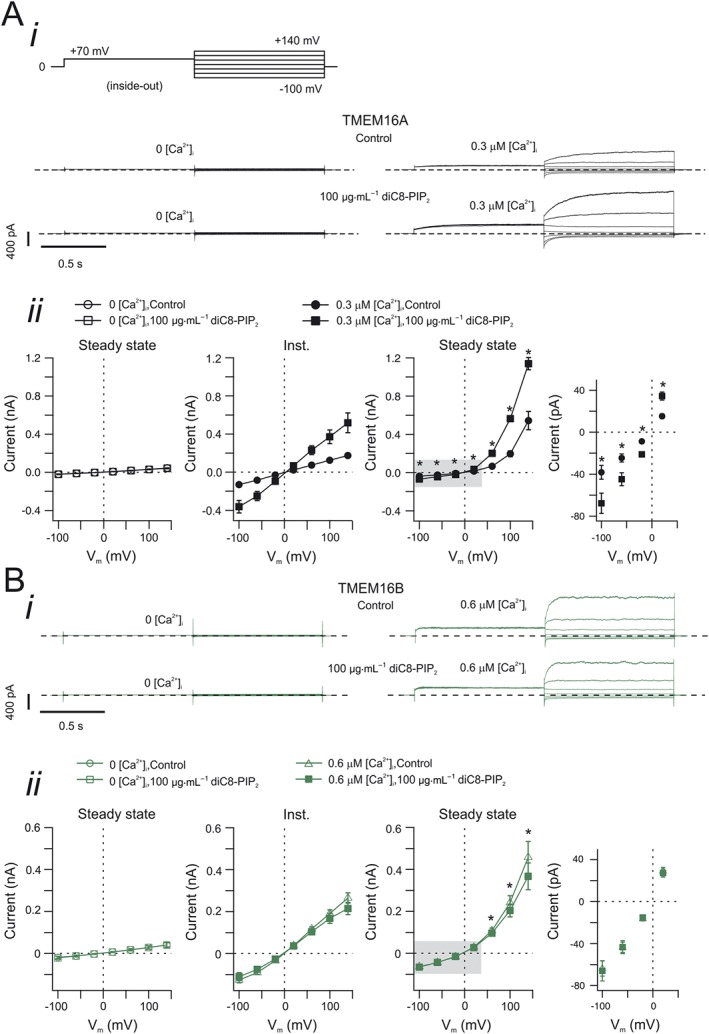
Effects of V m on the sensitivity of TMEM16A and TMEM16B currents to intracellular diC8‐PIP2. (A, panel i) Currents recorded from inside‐out patches excised from HEK‐293T cells expressing TMEM16A. The stimulation protocol is shown in the top left corner. diC8‐PIP2 [100 μg·mL−1 (117 μM)] was applied to the intracellular side of the patch, as indicated. Dashed horizontal lines represent zero‐current level. [Ca2+]i was 0 or 0.3 μM, as indicated. (A, panel ii) Mean instantaneous and steady‐state TMEM16A current versus V m relationships measured in the absence (control) or presence of diC8‐PIP2 [100 μg·mL−1 (117 μM)], as indicated. The rightmost panel represents an expansion of the area highlighted in grey in the steady‐state current versus V m relationship panel. The number of experiments was 6 (experiments conducted in 0 [Ca2+]i) or 9 (0.3 μM [Ca2+]i). (B, panel i) Currents recorded from inside‐out patches excised from HEK‐293T cells expressing TMEM16B. The stimulation protocol is shown in the top left corner in A, panel i. diC8‐PIP2 [100 μg·mL−1 (117 μM)] was applied to the intracellular side of the patch, as indicated. Dashed horizontal lines represent zero‐current level. [Ca2+]i was 0 or 0.6 μM, as indicated. (B, panel ii) Mean instantaneous and steady‐state TMEM16B current versus V m relationships measured in the absence (control) or presence of diC8‐PIP2 [100 μg·mL−1 (117 μM)], as indicated. The rightmost panel represents an expansion of the area highlighted in grey in the steady‐state current versus V m relationships panel. The number of experiments was 5 (experiments conducted in 0 [Ca2+]i) or 15 (0.6 μM [Ca2+]i). * P < 0.05 (paired t‐test).
It is noteworthy that the diC8‐PIP2 promoted an increase in TMEM16A steady‐state current at all V m (Figure 3Aii). In contrast, the inhibitory effect of diC8‐PIP2 on TMEM16B steady‐state current was only observed at V m > 50 mV (Figure 3Bii).
We finally examined the requirement for intracellular Ca2+ in the development of the effects of diC8‐PIP2 on TMEM16A and TMEM16B currents. We found that in the absence of intracellular Ca2+ (nominally Ca2+‐free intracellular solution), diC8‐PIP2 exhibited no effect on the TMEM16A and TMEM16B currents at all tested V m (Figure 3Aii, Bii and Suppl. Figure S2 for expanded version of the image). This indicates that the application of diC8‐PIP2 cannot lead to activation of TMEM16A channel in the absence of intracellular Ca2+. Furthermore, the data demonstrate a lack of inhibition of the small endogenous currents in cells transfected with TMEM16B and in Ca2+ free solution.
Sensitivity of TMEM16A and TMEM16B channels to endogenous PIP2
To test whether endogenous PIP2 modulates TMEM16A and TMEM16B currents, cells were co‐transfected with either TMEM16A or TMEM16B channels in conjunction with the membrane‐localized protein Danio rerio voltage‐sensitive phosphatase (DrVSP), which depletes endogenous PIP2 content by dephosphorylation when V m is brought to depolarized values (Okamura et al., 2009).
Initial control experiments were carried out in the absence of DrVSP. Under this condition, when V m was stepped to +100 mV for 4 s from the holding potential of −100 mV, large TMEM16A and TMEM16B whole‐cell currents were elicited that reached a stable steady‐state value (Figure 4). As previously reported, the TMEM16A currents activated more slowly than TMEM16B currents (Adomaviciene et al., 2013; Scudieri et al., 2013; Cruz‐Rangel et al., 2015). The rate of TMEM16A and TMEM16B current activation was quantified by fitting the currents with a single exponential function with time constant τf. The τf for TMEM16A currents was ~5 times greater than that for TMEM16B currents (Figure 4, Table 3). This stimulation pulse was repeated three times, with 0.5 s intervals between each stimulation. During these stimulations, the kinetics of the TMEM16A and TMEM16B currents remained unchanged (Figure 4 and Table 3). The amplitude of the steady‐state TMEM16A current was 473 ± 70 pA/pF (n = 8, first pulse); 473 ± 69 pA/pF (n = 8, second pulse) and 488 ± 69 pA/pF (n = 8, third pulse). The steady‐state TMEM16B current was 113 ± 15 pA/pF (n = 8, first pulse); 114 ± 15 pA/pF (n = 8, second pulse) and 115 ± 16 pA/pF (n = 8, third pulse).
Figure 4.
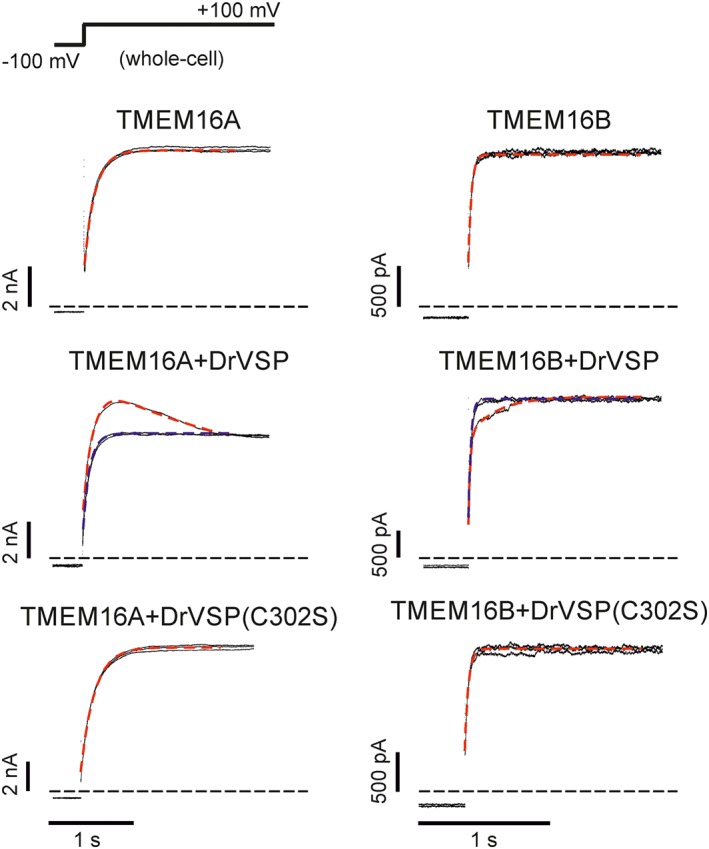
Effects of DrVSP activation on the kinetics of TMEM16A and TMEM16B currents. Whole‐cell currents recorded from HEK‐293T cells expressing either TMEM16A or TMEM16B alone, or co‐transfected with either DrVSP or DrVSP(C302S), as indicated. [Ca2+]i was 0.3 or 0.6 μM for experiments involving TMEM16A or TMEM16B channels respectively. The stimulation protocol is shown in the top left corner. Each panel represents the current elicited by three consecutive voltage pulses from −100 to +100 mV (inter‐pulse duration was 0.5 s). Dashed Red traces represent the mono‐ or bi‐exponential fit of the currents elicited by the first pulse. Dashed blue traces represent the mono‐exponential fit of the currents elicited by the third pulse. Horizontal dashed black lines represent zero‐current levels.
Table 3.
Parameters obtained from single or double exponential fit of the TMEM16A and TMEM16B currents elicited by three consecutive pulses to +100 mV
| Order of the pulse | ||||
|---|---|---|---|---|
| First | Second | Third | ||
| τ f (ms) | τs (ms) | τ f (ms) | τ f (ms) | |
| TMEM16A | 143 ± 10 (n = 8) | − | 151 ± 10 (n = 8) | 158 ± 12 (n = 8) |
| TMEM16A + VSP | 157 ± 19 (n = 14) | 468 ± 84 (n = 14) | 134 ± 13 (n = 14) | 130 ± 15 (n = 14) |
| TMEM16A + VSP(C302S) | 173 ± 22 (n = 5) | − | 182 ± 28 (n = 5) | 186 ± 28 (n = 5) |
| TMEM16B | 27 ± 2 (n = 8) | − | 26 ± 2 (n = 8) | 25 ± 1 (n = 8) |
| TMEM16B + VSP | 24 ± 2 (n = 12) | 624 ± 23 (n = 12) | 35 ± 2 (n = 12) | 33 ± 2 (n = 12) |
| TMEM16B + VSP(C302S) | 29 ± 2 (n = 8) | − | 29 ± 2 (n = 8) | 29 ± 2 (n = 8) |
TMEM16 channels are either expressed on their own or in combination with DrVSP or DrVSP(C302S), as indicated
When cells were co‐transfected with TMEM16A and DrVSP, the first depolarizing step to +100 mV elicited a whole‐cell current with a biphasic component. In these experiments, the holding V m was −100 mV to maintain DrVSP inactive. During the depolarizing step, the current reached a maximal point [187 ± 53 pA/pF (n = 14)] and then relaxed to a lower amplitude steady‐state level of 136 ± 39 pA/pF (n = 14) (Figure 4). This current was fitted with a double exponential function, with time constants τf of ~160 ms and τs of ~470 ms (Figure 4 and Table 3). The following two stimulations, however, gave rise to currents that were well described by a single exponential function with τf of ~130 ms (Table 3) and steady‐state values of 137 ± 40 pA/pF (n = 14) and 138 ± 38 pA/pF (n = 14) respectively. These values were indistinguishable from the current amplitude of ~136 pA/pF reached at the end of the first stimulus.
The same stimulation protocol was used to examine the current activation kinetics in HEK‐293T cells co‐transfected with TMEM16B and DrVSP. It was found that the first stimulation elicited a biphasic whole‐cell current that increased to a final, steady‐state value (Figure 4). This biphasic kinetics was characterized by τf of ~25 ms and τs of ~620 ms (Figure 4 and Table 3). The current amplitude at the initial transient plateau was 85 ± 12 pA/pF (n = 12), and steady‐state current at the end of the pulse was 94 ± 12 pA/pF (n = 12). In contrast, the subsequent two stimulations elicited currents with a single exponential time course with τf of ~30 ms in each case (Table 3). The steady‐state current amplitude was 96 ± 13 pA/pF (n = 12) and 97 ± 13 pA/pF (n = 12) for the second and the third pulse, respectively (Figure 4).
We interpreted the biphasic current time course of TMEM16A and TMEM16B currents observed in response to the first stimulation as being the result of the depletion of endogenous PIP2 by DrVSP. The subsequent stimulations would not manifest these effects, as endogenous PIP2 would already be depleted. We tested this idea by examining the consequence of co‐transfecting TMEM16A or TMEM16B channels with a mutant form of DrVSP, which does not support PIP2 dephosphorylation (Imai et al., 2012). This DrVSP has the cysteine at position 302 mutated into serine and was termed DrVSP(C302S). When DrVSP(C302S) was present, each stimulation to +100 mV gave rise to TMEM16A and TMEM16B currents with single exponential kinetics indistinguishable from currents recorded in the absence of DrVSP. The TMEM16A steady‐state current amplitude was 355 ± 140 pA/pF (n = 5), 363 ± 144 pA/pF (n = 5) and 364 ± 142 pA/pF (n = 5) for the first, second and third pulse respectively (Figure 4, Table 3). The TMEM16B steady‐state current amplitude was 115 ± 17 pA/pF (n = 8), 118 ± 19 pA/pF (n = 8) and 122 ± 20 pA/pF (n = 8) for the first, second and third pulse respectively (Figure 4, Table 3).
Combined effects of DrVSP and PIPK on TMEM16A and TMEM16B channels
To further test the hypothesis that the effects of DrVSP on TMEM16A and TMEM16B currents were due to endogenous PIP2 depletion, cells were co‐transfected with either TMEM16A or TMEM16B in conjunction with DrVSP and PIPK. This was done with the rationale that the presence of PIPK would oppose the effect of DrVSP by synthesizing additional PIP2. Whole‐cell currents were recorded in response to a single depolarizing step to +100 mV for 4 s from a holding potential of −100 mV (Figure 5A). These whole‐cell currents had kinetics involving multiple components and could not be satisfactorily described by a double exponential function; at least the sum of three exponentials was required to fit these currents (not shown). We measured the extent of DrVSP‐mediated inhibition of TMEM16A currents in the absence and presence of PIPK as the ratio between the peak current and the current measured at the end of the depolarizing pulse. This ratio was 0.75 ± 0.03 (n = 14) and 0.90 ± 0.02 (n = 14) in the absence and presence of PIPK respectively (Figure 5B). Thus, the presence of PIPK reduced the TMEM16A current inhibition provoked by DrVSP. We also examined the combined effect of DrVSP and PIPK on TMEM16B channels (Figure 5A). This was assessed as the ratio of the current measured at the beginning and at the end of the depolarizing pulse. This ratio was 1.12 ± 0.02 (n = 12) and 1.42 ± 0.10 (n = 12) in the absence and presence of PIPK respectively (Figure 5B). Thus, an elevated level of PIP2 caused by PIPK inhibited TMEM16B currents, and this allowed greater scope for activation when the cell was depleted of PIP2 by DrVSP.
Figure 5.
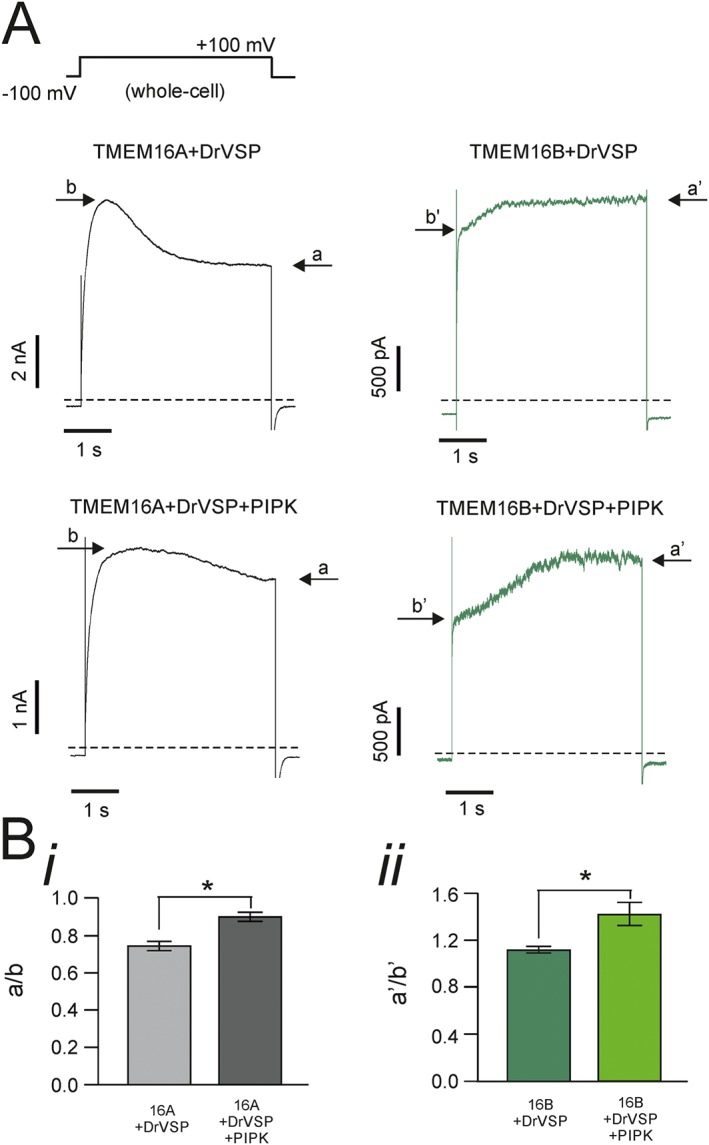
Combined effects of DrVSP and PIPK on TMEM16A and TMEM16B currents. (A) Whole‐cell currents obtained from HEK‐293T cells co‐transfected with TMEM16A or TMEM16B, DrVSP and PIPK, as indicated. [Ca2+]i was 0.3 or 0.6 μM for experiments involving TMEM16A or TMEM16B channels respectively. The stimulation protocol is shown in the top left corner. Dashed lines represent zero‐current levels. Arrows indicate the steady‐state current (a) and the peak current (b) during the depolarizing pulse. (B, panel i) Mean extent of TMEM16A current inhibition measured as the ratio between current (a) and (b) in HEK‐293T cells co‐transfected with TMEM16A and DrVSP (n = 14) or with DrVSP and PIPK (n = 14); (B, panel ii) Mean extent of current activation measured as the ratio between current a' and b' in HEK‐293T cells co‐transfected with TMEM16B and DrVSP (n = 12) or TMEM16B with DrVSP and PIPK (n = 12). * P < 0.05 (paired t‐test).
Recovery of the DrVSP‐mediated inhibition of TMEM16A and TMEM16B channels
We argued that if the effects of DrVSP on the TMEM16A and TMEM16B currents were due to bona fide depletion of PIP2 from the plasma membrane of transfected HEK‐293T cells, these effects could be replicated if enough time was allowed for PIP2 synthesis to occur in the cells. This possibility was tested using a double‐pulse protocol (see Methods) during whole‐cell recordings in cells transfected with TMEM16A or TMEM16B and DrVSP (Figure 6). In these experiments, 1 mM of MgATP was included in the intracellular solution to enable PIP2 synthesis by endogenous phosphatidylinositol phosphate kinases. Furthermore, the holding potential was maintained at −50 mV, which is close to the resting membrane potential in HEK‐293T cells, while also being sufficient to maintain DrVSP inactivated (Okamura et al., 2009). Figure 6 shows that the DrVSP‐mediated modulation of TMEM16A and TMEM16B currents is completely restored after about ≥50 s ‘recovery’ period at −50 mV. The relationship between the extent of recovery of this effect versus the duration of the time interval spent at −50 mV was characterized by a τr of 7.2 ± 0.7 s (n = 11) and 10.9 ± 2.5 s (n = 10) (N.S., t‐test) for TMEM16A and TMEM16B respectively.
Figure 6.
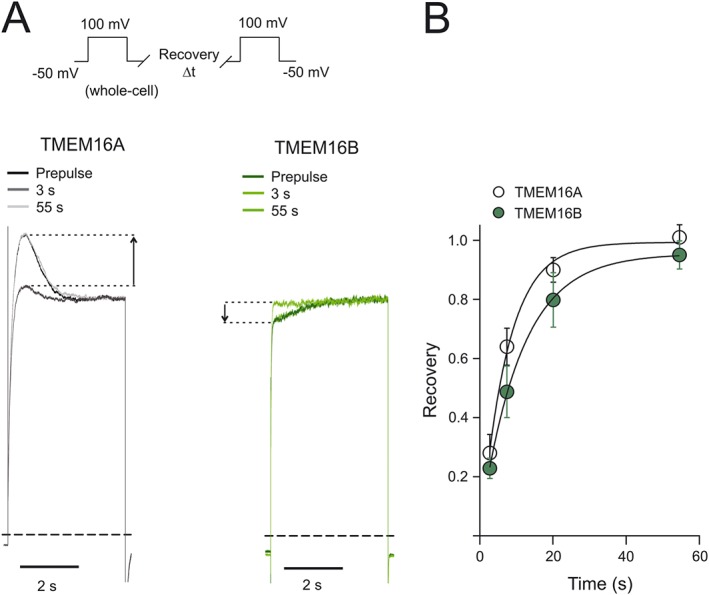
Time course of the recovery of TMEM16A and TMEM16B currents in response to DrVSP activation. (A) Whole‐cell currents recorded from HEK‐293T cells expressing TMEM16A or TMEM16B, and DrVSP, as indicated. Currents were elicited using the double‐pulse protocol described in Methods and illustrated in the top left corner. In each panel, the current elicited by a pre‐pulse was superimposed over the current elicited by two test pulses following recovery periods of different durations (3 and 55 s). To facilitate visual comparison, currents were normalized for the steady‐state current reached during each pulse. Dashed lines represent zero‐current levels. (B) Mean relationship between the extent of recovery of the DrVSP‐mediated modulation of the currents and the recovery time. The number of experiments was 11 (for TMEM16A and TMEM16B). The smooth curves through the points represent the best fit of the data with single exponential functions.
Discussion
The key finding of this study is the observation that PIP2 provokes opposing effects on TMEM16A and TMEM16B channels, leading to channel activation and inhibition respectively. These modulatory effects of PIP2 occurred in a concentration range similar to that causing modulation of other ion channel types including, but not limited to, KCNQ (e.g. Zhang et al., 2003; Li et al., 2011), Kv (e.g. Rodriguez‐Menchaca et al., 2012) and TRPC1 (e.g. Saleh et al., 2009) channels. The extent of PIP2 modulation of the TMEM16A current varied significantly depending on [Ca2+]i; in contrast, the extent of modulation of TMEM16B current did not vary over a broad range of [Ca2+]i tested (0.6–2 μM). Furthermore, the effects of PIP2 on the TMEM16A current were observable at all V m tested, while TMEM16B was only modulated at highly depolarized V m > 50 mV. This suggests that in vivo modulation of TMEM16A currents by PIP2 may occur under resting conditions as well as at depolarized V m. In contrast, the effect of PIP2 on TMEM16B may only become relevant in the rare types of excitable cells that reach highly depolarized V m > 50 mV during action potentials.
Modulation of TMEM16A and TMEM16B channels by diC8‐PIP2
A recent study indicated that PIP2 binds directly to TMEM16A channels (Pritchard et al., 2014). This study also included functional evidence that PIP2 inhibited native CaCC currents in isolated rPASMCs. In this published study, however, the functional effects of PIP2 on cloned TMEM16A channels were not investigated. Thus, we set out to study the extent of modulation of the heterologously expressed TMEM16A channel (and the closely related TMEM16B channel) by diC8‐PIP2 as well as endogenous PIP2. The use of heterologous expression systems allows the effects of channel modulation to be examined in the absence of potential additional tissue‐specific modulatory pathways. diC8‐PIP2 enhanced cloned TMEM16A currents recorded from excised inside‐out patches and depletion of endogenous cellular PIP2 inhibited whole‐cell currents. It is known that TMEM16A is an essential component of CaCC in rPASMCs (Manoury et al., 2010). However, the possibility that in rPASMCs the TMEM16A channels are associated with endogenous binding partners or combine with other TMEM16 members to form channels with novel regulatory properties cannot be excluded. Thus, cell specific components may be responsible for the differential regulation of TMEM16A channel in PASMCs and heterologous expression systems. At present, it is not known whether TMEM16A in other native cell types, including vascular smooth muscle cells from other circulations, is differentially modulated by PIP2. Defining this could be of considerable importance in understanding how potential pharmacological agents acting on PIP2 synthesis/depletion may affect TMEM16A in different cell types.
A previous study indicated that heterologous whole‐cell TMEM16A currents were insensitive to compounds that interfere with inositolphosphates and phosphatidylinositols (Tian et al., 2013). Our observation that the effects of diC8‐PIP2 on TMEM16A currents were negligible at relative high (>2 μM) [Ca2+]i could explain the lack of effect observed by Tian et al. (2013). In this study, whole‐cell TMEM16A currents were elicited in response to factors that result in high [Ca2+]i such as ionomycin (Morgan and Jacob, 1994) or prolonged exposure of cells to extracellular ATP (Qi et al., 2000).
In our study, we also observed that TMEM16B currents were inhibited by diC8‐PIP2 in the same concentration range that activated TMEM16A. Both changes in TMEM16A and TMEM16B current amplitudes were due to changes in channel gating, while single channel conductance and ion selectivity remained unaltered. Thus, the diC8‐PIP2 acts as a gating modifier of cloned TMEM16A and TMEM16B channels.
The concentration range of diC8‐PIP2 that modulated the TMEM16A and TMEM16B currents [1–100 μg·mL−1 (1.17–117 μM)] is similar to the reported concentration of endogenous PIP2. Reported values of membrane PIP2 concentration include ~2–30 μM in cultured cell lines (McLaughlin et al., 2002), ~50 μM in unstimulated neutrophils (Stephens et al., 1991) or 200 μM in platelets in the resting state (Hartwig et al., 1995).
Modulation of TMEM16A and TMEM16B channels by endogenous PIP2
The voltage‐sensitive protein phosphatase DrVSP was used to assess the sensitivity of the TMEM16A channel to endogenous PIP2. DrVSP is a membrane‐resident phosphoinositide 5‐phosphatase that enables rapid depletion of PIP2 content in intact cells when V m is brought from negative to positive values (Okamura et al., 2009). Specifically, and consistently with the modulatory effects of diC8‐PIP2 in inside‐out patches, DrVSP activation reduced the amplitude of TMEM16A currents, whereas TMEM16B current amplitude was increased.
The kinetics of PIP2 depletion by DrVSP have been investigated using fluorescence resonance energy transfer imaging of PIP2 levels in HEK‐293T cells (Itsuki et al., 2014). It was shown that within ~1 s of activation of the phosphatase, PIP2 in the membrane was significantly depleted (Itsuki et al., 2014). This time course of alterations in plasmalemmal PIP2 content is consistent with the changes in current amplitude we observed in cells expressing TMEM16A or TMEM16B channels and DrVSP. The effects of DrVSP on TMEM16A and TMEM16B currents were abolished when a second depolarizing pulse was elicited after ~0.5 s. We interpret this loss of modulation as due to the fact that PIP2 has been depleted during the first pulse. Consistent with this idea was the fact that the DrVSP‐dependent modulations of TMEM16A and TMEM16B currents were fully re‐established after ~55 s at −50 mV. This duration corresponds to the estimated time of PIP2 re‐synthesis by endogenous PIPK (Loew, 2007; Falkenburger et al., 2010; Itsuki et al., 2014).
The reduction in the effects of DrVSP on TMEM16A currents caused by overexpression of PIPK is qualitatively consistent with an increased amount of PIP2 being present in the cell. On the other hand, the increased basal amount of PIP2 might have rendered the effects of DrVSP on TMEM16B more pronounced: a higher initial extent of current inhibition caused by increased basal levels of PIP2 would provide greater scope for current activation following DrVSP activation.
Towards the identification of PIP2 binding site(s) in TMEM16A and TMEM16B channels
The TMEM16A or TMEM16B current versus [diC8‐PIP2] relationships we have determined do not provide a direct indication of diC8‐PIP2 affinity. The mid‐points of these curves are presumably influenced by competition between diC8‐PIP2 and endogenous PIP2, the exact concentration of which was unknown. The parameters j and h of the Hill fit of these relationships equalled ~1 in each case, which may be suggestive of a similar number of diC8‐PIP2 molecules binding to the TMEM16A and TMEM16B channels.
In general, PIP2 modulates ion channels by binding to a diverse range of recognition domains, albeit with different specificities and potencies (Lemmon, 2003; Gamper and Shapiro, 2007; Huang, 2007; Hansen, 2015; Hille et al., 2015). Recognition domains include pleckstrin homology domains, myristoylated alanine‐rich C‐kinase substrate domains, phox homology domains, FYVE zinc finger domains, epsin N‐terminal homology domains and 4.1 protein‐ezrin‐radixin‐moesin domains. These domains differ significantly in structural conformation, size and specificity (Lemmon, 2003; Gamper and Shapiro, 2007; Huang, 2007; Hansen, 2015; Hille et al., 2015). The precise set of residues involved in PIP2 binding cannot be directly identified through analysis of the TMEM16A and TMEM16B primary structure. This is because typically PIP2 binding sites involve residues that are distant in protein primary structures but may be positioned next to each other in their tertiary structures. Understanding the structural determinants of TMEM16A and TMEM16B channels involved in PIP2 binding will be an important pursuit for future research.
Pharmacological and pathophysiological significance
The extent to which PIP2 modulation of TMEM16A or TMEM16B channels affects the cell electrical activity may vary depending on the cell type. Factors that may determine the impact of this modulation on cell electrical activity may include (1) the proximity of TMEM16A or TMEM16B channels to cellular mechanisms that determine membrane PIP2 contents (such as PLC or PIPK), the abundance and distribution of which may vary from cell type to cell type and (2) the contribution that TMEM16A or TMEM16B channels play to the electrical activity of an individual cell type, which may depend on factors such as channel expression and the complement of other transport mechanisms being present.
PIP2 levels are dynamically regulated in living cells, depending on the extent of PIP2‐depleting and PIP2‐synthesizing mechanisms. For example, muscarinic stimulation of sympathetic neurons leads to significant dynamic variations in PIP2 levels (Kruse et al., 2016). It is noteworthy that in some cell types, such as mouse portal vein smooth muscle cells, TMEM16A appear to localize in caveolin‐1 containing plasma membrane lipid rafts (Sones et al., 2010). These are regions of the membrane that also tend to concentrate a variety of receptors, including GPCRs (Insel and Patel, 2009). Furthermore, in cell types such as nociceptive sensory neurons, TMEM16A localized to the same membrane fraction as GPCRs such as the bradykinin B2 receptor, protease‐activated receptor PAR2 and also with caveolin‐1, a lipid raft marker (Jin et al., 2013). Thus, in these cell types, TMEM16A may be surrounded by a local membrane environment in which changes in PIP2 concentration may vary dynamically in the immediate vicinity of the TMEM16A channel.
Interfering pharmacologically with PIP2 signalling could lead to modulation of TMEM16A or TMEM16B channel activity. Pharmacological modulators of TMEM16A and TMEM16B channels would constitute important tools for scientific research and potentially for therapeutic treatment of conditions associated with altered Cl− transport. For instance, TMEM16A channels have been proposed as possible therapeutic targets for respiratory diseases of impaired mucus clearance, including cystic fibrosis, chronic obstructive pulmonary disease and asthma (Huang et al., 2012b; Sondo et al., 2014; Sala‐Rabanal et al., 2015). The importance of TMEM16A in epithelial cell function is emphasized by the observation that mice in which the TMEM16A gene has been deleted show a strongly reduced Ca2+‐dependent Cl− secretion, accumulation of mucus in the airways and impaired mucociliary transport (Ousingsawat et al., 2009; Rock et al., 2009). Furthermore, Th‐2 cytokines‐driven goblet cell hyperplasia, a feature of asthma and other respiratory diseases, leads to alteration of TMEM16A expression in human cells and consequent alteration in bicarbonate transport; this in turn affects mucus properties (Gorrieri et al., 2016). TMEM16A channels are also abundantly expressed in arterial smooth muscle. Overexpression of TMEM16A has been reported in pulmonary arteries during pulmonary hypertension (Sun et al., 2012), and up‐regulation of Cl− currents has been implicated in the proliferation of PASMCs (Liang et al., 2009). Thus, agents that reduce TMEM16A activity could be beneficial in treating pulmonary hypertension by inducing smooth muscle relaxation and possibly by reducing cell proliferation.
We have shown that PIP2 modulates TMEM16B channels, which are especially relevant in hippocampal neurons (Huang et al., 2012c), olfactory neurons and photoreceptors (Stephan et al., 2009; Stohr et al., 2009; Hengl et al., 2010; Pietra et al., 2016). In these cell types, however, the peak of the action potential does not overshoot the 50 mV. Thus, PIP2 modulation in these cells is unlikely to occur under physiological conditions. TMEM16B is also expressed in DRG neurons (Zhao et al., 2016), which reportedly are characterized by a peak of AP of ~55 mV, and this value may be slightly elevated in the presence of gain‐of‐function mutations in voltage‐gated sodium (Nav) channels (Dib‐Hajj et al., 2008; Hoeijmakers et al., 2012). Elevation of the peak of action potential might also occur during hypernatraemia, which shifts the Na+ equilibrium potential towards higher values. It is conceivable that gain‐of‐function mutations in voltage‐gated calcium (Cav) channels might also be associated with an increased action potential peak. Thus, potential PIP2‐mimicking drugs might interfere with TMEM16B channels under these types of pathological conditions and might be an important consideration in terms of safety pharmacology under these special circumstances.
Author contributions
P.T. conceived and designed the study. All authors designed and performed individual experiments and analysed the data. P.T. and C.M.T drafted the manuscript, while all authors reviewed and approved the final version of the manuscript.
Conflict of interest
The authors declare no conflicts of interest.
Declaration of transparency and scientific rigour
This Declaration acknowledges that this paper adheres to the principles for transparent reporting and scientific rigour of preclinical research recommended by funding agencies, publishers and other organisations engaged with supporting research.
Supporting information
Figure S1 Effects of diC8‐PIP2 on TMEM16A and TMEM16B currents elicited by 78 μM [Ca2+]i. A. Currents recorded from inside‐out patches excised from HEK‐293T cells expressing either TMEM16A or TMEM16B, as indicated. diC8PIP2 [100 μg·mL−1 (117 μM)] was applied as indicated by the horizontal bars. The V m was keep at +70 mV for the entire duration of the recordings. The dashed lines represent the zero‐current level. B. Mean TMEM16A or TMEM16B currents measured in the presence of diC8‐PIP2 normalized to the currents measured in the absence of diC8‐PIP2. The number of experiments was 8–12 in each case.
Figure S2 Effects of diC8‐PIP2 on TMEM16A and TMEM16B currents in nominally Ca2+‐free intracellular solution. Mean TMEM16A or TMEM16B steady‐state current versus V m relationships measured in the absence (control) or presence of diC8‐PIP2 [100 μg·mL−1 (117 μM)]. [Ca2+]i, was 0.
Acknowledgements
We thank Dr Hannah Garnett for preliminary experiments at the early stage of the project. N.J.G.R and K.E.A. hold a Wellcome Trust (Oxion) and BHF DPhil studentship respectively.
Ta, C. M. , Acheson, K. E. , Rorsman, N. J. G. , Jongkind, R. C. , and Tammaro, P. (2017) Contrasting effects of phosphatidylinositol 4,5‐bisphosphate on cloned TMEM16A and TMEM16B channels. British Journal of Pharmacology, 174: 2984–2999. doi: 10.1111/bph.13913.
References
- Adomaviciene A, Smith KJ, Garnett H, Tammaro P (2013). Putative pore‐loops of TMEM16/anoctamin channels affect channel density in cell membranes. J Physiol 591: 3487. [DOI] [PMC free article] [PubMed] [Google Scholar]
- Alexander SPH, Peters JA, Kelly E, Marrion N, Benson HE, Faccenda E et al. (2015). The Concise Guide to PHARMACOLOGY 2015/16: Other ion channels. Br J Pharmacol 172: 5942–5955. [DOI] [PMC free article] [PubMed] [Google Scholar]
- Ayoglu B, Mitsios N, Kockum I, Khademi M, Zandian A, Sjöberg R et al. (2016). Anoctamin 2 identified as an autoimmune target in multiple sclerosis. Proc Natl Acad Sci 113: 2188–2193. [DOI] [PMC free article] [PubMed] [Google Scholar]
- Betto G, Cherian OL, Pifferi S, Cenedese V, Boccaccio A, Menini A (2014). Interactions between permeation and gating in the TMEM16B/anoctamin2 calcium‐activated chloride channel. J Gen Physiol 143: 703–718. [DOI] [PMC free article] [PubMed] [Google Scholar]
- Bradley E, Fedigan S, Webb T, Hollywood MA, Thornbury KD, McHale NG et al. (2014). Pharmacological characterization of TMEM16A currents. Channels 8: 308–320. [DOI] [PMC free article] [PubMed] [Google Scholar]
- Caputo A, Caci E, Ferrera L, Pedemonte N, Barsanti C, Sondo E et al. (2008). TMEM16A, a membrane protein associated with calcium‐dependent chloride channel activity. Science (New York, NY) 322: 590–594. [DOI] [PubMed] [Google Scholar]
- Cherian OL, Menini A, Boccaccio A (2015). Multiple effects of anthracene‐9‐carboxylic acid on the TMEM16B/anoctamin2 calcium‐activated chloride channel. Biochim Biophys Acta 1848: 1005–1013. [DOI] [PubMed] [Google Scholar]
- Cruz‐Rangel S, De Jesus‐Perez JJ, Contreras‐Vite JA, Perez‐Cornejo P, Hartzell HC, Arreola J (2015). Gating modes of calcium‐activated chloride channels TMEM16A and TMEM16B. J Physiol 593: 5283–5298. [DOI] [PMC free article] [PubMed] [Google Scholar]
- Curtis MJ, Bond RA, Spina D, Ahluwalia A, Alexander SP, Giembycz MA et al. (2015). Experimental design and analysis and their reporting: new guidance for publication in BJP. Br J Pharmacol 172: 3461–3471. [DOI] [PMC free article] [PubMed] [Google Scholar]
- Davis AJ, Forrest AS, Jepps TA, Valencik ML, Wiwchar M, Singer CA et al. (2010). Expression profile and protein translation of TMEM16A in murine smooth muscle. Am J Physiol 299: C948–C959. [DOI] [PMC free article] [PubMed] [Google Scholar]
- DeFelice LJ (1981). Introduction to Membrane Noise. Plenum: New York. [Google Scholar]
- Dib‐Hajj SD, Estacion M, Jarecki BW, Tyrrell L, Fischer TZ, Lawden M et al. (2008). Paroxysmal extreme pain disorder M1627K mutation in human Nav1.7 renders DRG neurons hyperexcitable. Mol Pain 4: 37. [DOI] [PMC free article] [PubMed] [Google Scholar]
- Falkenburger BH, Jensen JB, Hille B (2010). Kinetics of PIP2 metabolism and KCNQ2/3 channel regulation studied with a voltage‐sensitive phosphatase in living cells. J Gen Physiol 135: 99–114. [DOI] [PMC free article] [PubMed] [Google Scholar]
- Ferrera L, Zegarra‐Moran O, Galietta LJ (2011). Ca2+‐activated Cl− channels. Compr Physiol 1: 2155–2174. [DOI] [PubMed] [Google Scholar]
- Gamper N, Shapiro MS (2007). Target‐specific PIP(2) signalling: how might it work? J Physiol 582: 967–975. [DOI] [PMC free article] [PubMed] [Google Scholar]
- Gorrieri G, Scudieri P, Caci E, Schiavon M, Tomati V, Sirci F et al. (2016). Goblet cell hyperplasia requires high bicarbonate transport to support mucin release. Sci Rep 6: 36016. [DOI] [PMC free article] [PubMed] [Google Scholar]
- Hansen SB (2015). Lipid agonism: The PIP2 paradigm of ligand‐gated ion channels. Biochim Biophys Acta 1851: 620–628. [DOI] [PMC free article] [PubMed] [Google Scholar]
- Hartwig JH, Bokoch GM, Carpenter CL, Janmey PA, Taylor LA, Toker A et al. (1995). Thrombin receptor ligation and activated Rac uncap actin filament barbed ends through phosphoinositide synthesis in permeabilized human platelets. Cell 82: 643–653. [DOI] [PubMed] [Google Scholar]
- Hartzell C, Putzier I, Arreola J (2005). Calcium‐activated chloride channels. Annu Rev Physiol 67: 719–758. [DOI] [PubMed] [Google Scholar]
- Heinze C, Seniuk A, Sokolov MV, Huebner AK, Klementowicz AE, Szijarto IA et al. (2014). Disruption of vascular Ca2+‐activated chloride currents lowers blood pressure. J Clin Invest 124: 675–686. [DOI] [PMC free article] [PubMed] [Google Scholar]
- Hengl T, Kaneko H, Dauner K, Vocke K, Frings S, Mohrlen F (2010). Molecular components of signal amplification in olfactory sensory cilia. Proc Natl Acad Sci U S A 107: 6052–6057. [DOI] [PMC free article] [PubMed] [Google Scholar]
- Hille B, Dickson EJ, Kruse M, Vivas O, Suh BC (2015). Phosphoinositides regulate ion channels. Biochim Biophys Acta 1851: 844–856. [DOI] [PMC free article] [PubMed] [Google Scholar]
- Hoeijmakers JG, Han C, Merkies IS, Macala LJ, Lauria G, Gerrits MM et al. (2012). Small nerve fibres, small hands and small feet: a new syndrome of pain, dysautonomia and acromesomelia in a kindred with a novel NaV1.7 mutation. Brain 135: 345–358. [DOI] [PubMed] [Google Scholar]
- Huang CL (2007). Complex roles of PIP2 in the regulation of ion channels and transporters. Am J Physiol Renal Physiol 293: F1761–F1765. [DOI] [PubMed] [Google Scholar]
- Huang F, Wong X, Jan LY (2012a). International Union of Basic and Clinical Pharmacology. LXXXV: calcium‐activated chloride channels. Pharmacol Rev 64: 1–15. [DOI] [PMC free article] [PubMed] [Google Scholar]
- Huang F, Zhang H, Wu M, Yang H, Kudo M, Peters CJ et al. (2012b). Calcium‐activated chloride channel TMEM16A modulates mucin secretion and airway smooth muscle contraction. Proc Natl Acad Sci U S A 109: 16354–16359. [DOI] [PMC free article] [PubMed] [Google Scholar]
- Huang WC, Xiao S, Huang F, Harfe BD, Jan YN, Jan LY (2012c). Calcium‐activated chloride channels (CaCCs) regulate action potential and synaptic response in hippocampal neurons. Neuron 74: 179–192. [DOI] [PMC free article] [PubMed] [Google Scholar]
- Imai Y, Itsuki K, Okamura Y, Inoue R, Mori MX (2012). A self‐limiting regulation of vasoconstrictor‐activated TRPC3/C6/C7 channels coupled to PI(4,5)P(2)‐diacylglycerol signalling. J Physiol 590: 1101–1119. [DOI] [PMC free article] [PubMed] [Google Scholar]
- Insel PA, Patel HH (2009). Membrane rafts and caveolae in cardiovascular signaling. Curr Opin Nephrol Hypertens 18: 50–56. [DOI] [PMC free article] [PubMed] [Google Scholar]
- Itsuki K, Imai Y, Hase H, Okamura Y, Inoue R, Mori MX (2014). PLC‐mediated PI(4,5)P2 hydrolysis regulates activation and inactivation of TRPC6/7 channels. J Gen Physiol 143: 183–201. [DOI] [PMC free article] [PubMed] [Google Scholar]
- Jin X, Shah S, Liu Y, Zhang H, Lees M, Fu Z et al. (2013). Activation of the Cl− channel ANO1 by localized calcium signals in nociceptive sensory neurons requires coupling with the IP3 receptor. Sci Signal 6: ra73. [DOI] [PMC free article] [PubMed] [Google Scholar]
- Jurman ME, Boland LM, Liu Y, Yellen G (1994). Visual identification of individual transfected cells for electrophysiology using antibody‐coated beads. Biotechniques 17: 876–881. [PubMed] [Google Scholar]
- Kruse M, Vivas O, Traynor‐Kaplan A, Hille B (2016). Dynamics of phosphoinositide‐dependent signaling in sympathetic neurons. J Neurosci 36: 1386–1400. [DOI] [PMC free article] [PubMed] [Google Scholar]
- Kunzelmann K, Tian Y, Martins JR, Faria D, Kongsuphol P, Ousingsawat J et al. (2012). Airway epithelial cells – functional links between CFTR and anoctamin dependent Cl− secretion. Int J Biochem Cell Biol 44: 1897–1900. [DOI] [PubMed] [Google Scholar]
- Lemmon MA (2003). Phosphoinositide recognition domains. Traffic 4: 201–213. [DOI] [PubMed] [Google Scholar]
- Li Y, Zaydman MA, Wu D, Shi J, Guan M, Virgin‐Downey B et al. (2011). KCNE1 enhances phosphatidylinositol 4,5‐bisphosphate (PIP2) sensitivity of IKs to modulate channel activity. Proc Natl Acad Sci U S A 108: 9095–9100. [DOI] [PMC free article] [PubMed] [Google Scholar]
- Liang W, Ray JB, He JZ, Backx PH, Ward ME (2009). Regulation of proliferation and membrane potential by chloride currents in rat pulmonary artery smooth muscle cells. Hypertension 54: 286–293. [DOI] [PubMed] [Google Scholar]
- Liu Y, Zhang H, Huang D, Qi J, Xu J, Gao H et al. (2015). Characterization of the effects of Cl− channel modulators on TMEM16A and bestrophin‐1 Ca2+ activated Cl− channels. Pflugers Arch 467: 1417–1430. [DOI] [PubMed] [Google Scholar]
- Loew LM (2007). Where does all the PIP2 come from? J Physiol 582: 945–951. [DOI] [PMC free article] [PubMed] [Google Scholar]
- Manoury B, Tamuleviciute A, Tammaro P (2010). TMEM16A/Anoctamin 1 protein mediates calcium‐activated chloride currents in pulmonary arterial smooth muscle cells. J Physiol 588: 2305–2314. [DOI] [PMC free article] [PubMed] [Google Scholar]
- McLaughlin S, Wang J, Gambhir A, Murray D (2002). PIP2 and proteins: interactions, organization, and information flow. Annu Rev Biophys Biomol Struct 31: 151–175. [DOI] [PubMed] [Google Scholar]
- Morgan AJ, Jacob R (1994). Ionomycin enhances Ca2+ influx by stimulating store‐regulated cation entry and not by a direct action at the plasma membrane. Biochem J 300 (Pt 3): 665–672. [DOI] [PMC free article] [PubMed] [Google Scholar]
- Okamura Y, Murata Y, Iwasaki H (2009). Voltage‐sensing phosphatase: actions and potentials. J Physiol 587: 513–520. [DOI] [PMC free article] [PubMed] [Google Scholar]
- Ousingsawat J, Martins JR, Schreiber R, Rock JR, Harfe BD, Kunzelmann K (2009). Loss of TMEM16A causes a defect in epithelial Ca2+‐dependent chloride transport. J Biol Chem 284: 28698–28703. [DOI] [PMC free article] [PubMed] [Google Scholar]
- Pedemonte N, Galietta LJ (2014). Structure and function of TMEM16 proteins (anoctamins). Physiol Rev 94: 419–459. [DOI] [PubMed] [Google Scholar]
- Picollo A, Malvezzi M, Accardi A (2015). TMEM16 proteins: unknown structure and confusing functions. J Mol Biol 427: 94–105. [DOI] [PMC free article] [PubMed] [Google Scholar]
- Pietra G, Dibattista M, Menini A, Reisert J, Boccaccio A (2016). The Ca2+‐activated Cl− channel TMEM16B regulates action potential firing and axonal targeting in olfactory sensory neurons. J Gen Physiol 148: 293–311. [DOI] [PMC free article] [PubMed] [Google Scholar]
- Pifferi S, Dibattista M, Menini A (2009). TMEM16B induces chloride currents activated by calcium in mammalian cells. Pflugers Arch 458: 1023–1038. [DOI] [PubMed] [Google Scholar]
- Ponissery Saidu S, Stephan AB, Talaga AK, Zhao H, Reisert J (2013). Channel properties of the splicing isoforms of the olfactory calcium‐activated chloride channel anoctamin 2. J Gen Physiol 141: 691–703. [DOI] [PMC free article] [PubMed] [Google Scholar]
- Pritchard HA, Leblanc N, Albert AP, Greenwood IA (2014). Inhibitory role of phosphatidylinositol 4,5‐bisphosphate on TMEM16A‐encoded calcium‐activated chloride channels in rat pulmonary artery. Br J Pharmacol 171: 4311–4321. [DOI] [PMC free article] [PubMed] [Google Scholar]
- Qi Z, Murase K, Obata S, Sokabe M (2000). Extracellular ATP‐dependent activation of plasma membrane Ca(2+) pump in HEK‐293 cells. Br J Pharmacol 131: 370–374. [DOI] [PMC free article] [PubMed] [Google Scholar]
- Rock JR, O'Neal WK, Gabriel SE, Randell SH, Harfe BD, Boucher RC et al. (2009). Transmembrane protein 16A (TMEM16A) is a Ca2+‐regulated Cl− secretory channel in mouse airways. J Biol Chem 284: 14875–14880. [DOI] [PMC free article] [PubMed] [Google Scholar]
- Rodriguez‐Menchaca AA, Adney SK, Tang QY, Meng XY, Rosenhouse‐Dantsker A, Cui M et al. (2012). PIP2 controls voltage‐sensor movement and pore opening of Kv channels through the S4‐S5 linker. Proc Natl Acad Sci U S A 109: E2399–E2408. [DOI] [PMC free article] [PubMed] [Google Scholar]
- Sala‐Rabanal M, Yurtsever Z, Berry KN, Brett TJ (2015). Novel roles for chloride channels, exchangers, and regulators in chronic inflammatory airway diseases. Mediators Inflamm 2015: 497387. [DOI] [PMC free article] [PubMed] [Google Scholar]
- Saleh SN, Albert AP, Large WA (2009). Obligatory role for phosphatidylinositol 4,5‐bisphosphate in activation of native TRPC1 store‐operated channels in vascular myocytes. J Physiol 587: 531–540. [DOI] [PMC free article] [PubMed] [Google Scholar]
- Scudieri P, Caci E, Bruno S, Ferrera L, Schiavon M, Sondo E et al. (2012). Association of TMEM16A chloride channel overexpression with airway goblet cell metaplasia. J Physiol 590: 6141–6155. [DOI] [PMC free article] [PubMed] [Google Scholar]
- Scudieri P, Sondo E, Caci E, Ravazzolo R, Galietta LJ (2013). TMEM16A‐TMEM16B chimaeras to investigate the structure‐function relationship of calcium‐activated chloride channels. Biochem J 452: 443–455. [DOI] [PubMed] [Google Scholar]
- Scudieri P, Sondo E, Ferrera L, Galietta LJ (2011). The anoctamin family: TMEM16A and TMEM16B as calcium‐activated chloride channels. Exp Physiol 97: 177–183. [DOI] [PubMed] [Google Scholar]
- Seo Y, Lee HK, Park J, Jeon DK, Jo S, Jo M et al. (2016). Ani9, a novel potent small‐molecule ANO1 inhibitor with negligible effect on ANO2. PLoS One 11: e0155771. [DOI] [PMC free article] [PubMed] [Google Scholar]
- Smith KJ, Chadburn AJ, Adomaviciene A, Minoretti P, Vignali L, Emanuele E et al. (2013). Coronary spasm and acute myocardial infarction due to a mutation (V734I) in the nucleotide binding domain 1 of ABCC9. Int J Cardiol 168: 3506–3513. [DOI] [PubMed] [Google Scholar]
- Sondo E, Caci E, Galietta LJ (2014). The TMEM16A chloride channel as an alternative therapeutic target in cystic fibrosis. Int J Biochem Cell Biol 52: 73–76. [DOI] [PubMed] [Google Scholar]
- Sones WR, Davis AJ, Leblanc N, Greenwood IA (2010). Cholesterol depletion alters amplitude and pharmacology of vascular calcium‐activated chloride channels. Cardiovasc Res 87: 476–484. [DOI] [PMC free article] [PubMed] [Google Scholar]
- Southan C, Sharman JL, Benson HE, Faccenda E, Pawson AJ, Alexander SPH et al. (2016). The IUPHAR/BPS guide to PHARMACOLOGY in 2016: towards curated quantitative interactions between 1300 protein targets and 6000 ligands. Nucleic Acids Res 44: D1054–D1068. [DOI] [PMC free article] [PubMed] [Google Scholar]
- Stephan AB, Shum EY, Hirsh S, Cygnar KD, Reisert J, Zhao H (2009). ANO2 is the cilial calcium‐activated chloride channel that may mediate olfactory amplification. Proc Natl Acad Sci U S A 106: 11776–11781. [DOI] [PMC free article] [PubMed] [Google Scholar]
- Stephens LR, Hughes KT, Irvine RF (1991). Pathway of phosphatidylinositol(3,4,5)‐trisphosphate synthesis in activated neutrophils. Nature 351: 33–39. [DOI] [PubMed] [Google Scholar]
- Stohr H, Heisig JB, Benz PM, Schoberl S, Milenkovic VM, Strauss O et al. (2009). TMEM16B, a novel protein with calcium‐dependent chloride channel activity, associates with a presynaptic protein complex in photoreceptor terminals. J Neurosci 29: 6809–6818. [DOI] [PMC free article] [PubMed] [Google Scholar]
- Suh BC, Hille B (2008). PIP2 is a necessary cofactor for ion channel function: how and why? Annu Rev Biophys 37: 175–195. [DOI] [PMC free article] [PubMed] [Google Scholar]
- Sun H, Xia Y, Paudel O, Yang X‐R, Sham JSK (2012). Chronic hypoxia‐induced upregulation of Ca2+‐activated Cl‐ channel in pulmonary arterial myocytes: a mechanism contributing to enhanced vasoreactivity. J Physiol 590: 3507–3521. [DOI] [PMC free article] [PubMed] [Google Scholar]
- Ta CM, Adomaviciene A, Rorsman NJ, Garnett H, Tammaro P (2016). Mechanism of allosteric activation of TMEM16A/ANO1 channels by a commonly used chloride channel blocker. Br J Pharmacol 173: 511–528. [DOI] [PMC free article] [PubMed] [Google Scholar]
- Tammaro P, Ashcroft FM (2009). A cytosolic factor that inhibits KATP channels expressed in Xenopus oocytes by impairing Mg‐nucleotide activation by SUR1. J Physiol 587: 1649–1656. [DOI] [PMC free article] [PubMed] [Google Scholar]
- Tammaro P, Smirnov SV, Moran O (2005). Effects of intracellular magnesium on Kv1.5 and Kv2.1 potassium channels. Eur Biophys J 34: 42–51. [DOI] [PubMed] [Google Scholar]
- Thomas‐Gatewood C, Neeb ZP, Bulley S, Adebiyi A, Bannister JP, Leo MD et al. (2011). TMEM16A channels generate Ca2+‐activated Cl− currents in cerebral artery smooth muscle cells. Am J Physiol Heart Circ Physiol 301: H1819–H1827. [DOI] [PMC free article] [PubMed] [Google Scholar]
- Tian Y, Schreiber R, Wanitchakool P, Kongsuphol P, Sousa M, Uliyakina I et al. (2013). Control of TMEM16A by INO‐4995 and other inositolphosphates. Br J Pharmacol 168: 253–265. [DOI] [PMC free article] [PubMed] [Google Scholar]
- Wang B, Li C, Huai R, Qu Z (2015). Overexpression of ANO1/TMEM16A, an arterial Ca‐activated Cl channel, contributes to spontaneous hypertension. J Mol Cell Cardiol 82: 22–32. [DOI] [PubMed] [Google Scholar]
- Zhang H, Craciun LC, Mirshahi T, Rohacs T, Lopes CM, Jin T et al. (2003). PIP(2) activates KCNQ channels, and its hydrolysis underlies receptor‐mediated inhibition of M currents. Neuron 37: 963–975. [DOI] [PubMed] [Google Scholar]
- Zhao L, Li LI, Ma KT, Wang Y, Li J, Shi WY et al. (2016). NSAIDs modulate GABA‐activated currents via Ca2+‐activated Cl− channels in rat dorsal root ganglion neurons. Exp Ther Med 11: 1755–1761. [DOI] [PMC free article] [PubMed] [Google Scholar]
Associated Data
This section collects any data citations, data availability statements, or supplementary materials included in this article.
Supplementary Materials
Figure S1 Effects of diC8‐PIP2 on TMEM16A and TMEM16B currents elicited by 78 μM [Ca2+]i. A. Currents recorded from inside‐out patches excised from HEK‐293T cells expressing either TMEM16A or TMEM16B, as indicated. diC8PIP2 [100 μg·mL−1 (117 μM)] was applied as indicated by the horizontal bars. The V m was keep at +70 mV for the entire duration of the recordings. The dashed lines represent the zero‐current level. B. Mean TMEM16A or TMEM16B currents measured in the presence of diC8‐PIP2 normalized to the currents measured in the absence of diC8‐PIP2. The number of experiments was 8–12 in each case.
Figure S2 Effects of diC8‐PIP2 on TMEM16A and TMEM16B currents in nominally Ca2+‐free intracellular solution. Mean TMEM16A or TMEM16B steady‐state current versus V m relationships measured in the absence (control) or presence of diC8‐PIP2 [100 μg·mL−1 (117 μM)]. [Ca2+]i, was 0.