

Abstract
Objective
To evaluate the efficacy of an emergency department (ED)-based lung-protective mechanical ventilation protocol for the prevention of pulmonary complications.
Methods
This was a quasi-experimental, before-after study that consisted of a pre-intervention period, a run-in period of approximately six months, and a prospective intervention period. The intervention was a multifaceted ED-based mechanical ventilator protocol targeting lung-protective tidal volume, appropriate setting of positive end-expiratory pressure (PEEP), rapid oxygen weaning, and head-of-bed elevation. A propensity score-matched analysis was used to evaluate the primary outcome, which was the composite incidence of acute respiratory distress syndrome and ventilator-associated conditions.
Results
A total of 1,192 patients in the pre-intervention group and 513 patients in the intervention group were included. Lung-protective ventilation increased by 48.4% in the intervention group. In the propensity score-matched analysis (n= 490 in each group), the primary outcome occurred in 71 patients (14.5%) in the pre-intervention group, as compared with 36 patients (7.4%) in the intervention group [adjusted OR, 0.47 (0.31–0.71)]. There was an increase in ventilator-free days (mean difference 3.7, 95% CI 2.3–5.1), ICU-free days (mean difference 2.4, (95% CI 1.0–3.7), and hospital-free days (mean difference 2.4, 95% CI 1.2–3.6) associated with the intervention. The mortality rate was 34.1% in the pre-intervention group and 19.6% in the intervention group, adjusted OR 0.47 (0.35–0.63).
Conclusions
Implementing a mechanical ventilator protocol in the ED is feasible, and is associated with significant improvements in the delivery of safe mechanical ventilation and clinical outcome.
INTRODUCTION
Background
Annually, approximately 250,000 patients receive mechanical ventilation in U.S. emergency departments (ED), many of whom have protracted lengths of stay while awaiting intensive care unit (ICU) admission1,2. Pulmonary complications, such as acute respiratory distress syndrome (ARDS) and ventilator-associated conditions develop in over 20% of ventilated ED patients and adversely affect outcome and resource utilization3–9. As there is increased focus on reducing complications in this high risk cohort, the time spent in the ED represents a vulnerable period where preventive therapies could have significant impact. However, the ED has not been targeted as an arena for prevention10.
Importance
Lung-protective ventilation, by reducing ventilator-associated lung injury, is one important strategy to aid in prevention of pulmonary complications. While lung-protective ventilation is associated with a lower incidence of ARDS, evidence demonstrates that potentially injurious ventilator practices are common in the ED4,5,8,9,11. Lung-protective ventilation in the ED may be effective at reducing pulmonary complications for several reasons. Experimental data has established that ventilator-associated lung injury can occur shortly after the initiation of mechanical ventilation12,13. This is supported by evidence showing that initial ventilator settings influence outcome in patients with, and at risk for, ARDS3,8,9,14. Even if delivered for comparatively brief periods, early lung-protective ventilation during vulnerable periods seems to carry subsequent benefit, as demonstrated by data from the operating room (OR) and in lung donation15,16. Finally, initial ventilator settings influence the future delivery of lung-protective ventilation; it is therefore possible that establishing a lung-protective strategy during the earliest phases of respiratory failure can improve downstream adherence to lung-protective ventilation14.
Goals of This Investigation
The objective of this study was to evaluate the effectiveness of an ED-based lung-protective mechanical ventilation protocol on reducing the incidence of pulmonary complications. Given the high risk of pulmonary complications in mechanically ventilated ED patients, low adherence to lung-protective ventilation, and the association between initial ventilator settings and outcome, we hypothesized that a multifaceted strategy aimed at improving ED mechanical ventilation practices would reduce the incidence of pulmonary complications after ICU admission from the ED.
METHODS
Study design and setting
The Lung-Protective Ventilation Initiated in the ED (LOV-ED) trial was a quasi-experimental, before-after study. It consisted of a pre-intervention period (September 2009 to January 2014), a run-in period of approximately six months, during which lung-protective ventilation was implemented as the standard approach in the ED, and an intervention period (October 2014 to March 2016). The study was approved with waiver of informed consent, as lung-protective ventilation in the ED was adopted as the default approach to mechanical ventilation locally. A detailed description of the methods has been published17. The study was registered at ClinicalTrials.gov (Identifier NCT02543554).
The study was conducted in the ED (intervention) and ICUs (pertinent data and outcomes assessment) of an academic, tertiary medical center.
Selection of participants
For the pre-intervention group, a validated electronic query method was used to identify all consecutive mechanically ventilated patients in the ED17. Briefly, this method used a Boolean keyword search of ED documents. As an assurance against systematic sampling bias between the two groups, it was validated using a previously published prospective observational study as a test cohort for the search strategy5. The search yielded perfect recall (no false negative cases) and perfect precision (no false positive cases). We then applied this search to a random subset of ED documents for each cohort year. This validation set yielded perfect precision each time to identify all consecutive mechanically ventilated patients. The intervention group was followed prospectively and enrolled consecutively, twenty four hours per day.
Mechanically ventilated patients in the ED were assessed for inclusion. Inclusion criteria for both groups were: 1) adult patients age ≥ 18 years; and 2) mechanical ventilation via an endotracheal tube. Exclusion criteria for both groups were: 1) death or discontinuation of mechanical ventilation within 24 hours of presentation; 2) chronic mechanical ventilation; 3) presence of a tracheostomy; 4) transfer to another hospital; and 5) fulfillment of ARDS criteria during ED presentation18.
Interventions
Following a run-in period that included education and collaboration initiatives between Respiratory Care Services and the ED, the intervention period commenced. The ventilator intervention implemented in the ED addressed the parameters in need of quality improvement, as demonstrated by our previous research: 1) lung-protective tidal volume for prevention of volutrauma; 2) appropriate setting of positive end-expiratory pressure (PEEP) to limit atelectrauma; 3) rapid oxygen weaning to limit hyperoxia; and 4) head-of-bed elevation3–5. After endotracheal intubation, the ED respiratory therapist obtained an accurate height with a tape measure, and tidal volume was indexed to predicted body weight. Ventilator settings were then established per protocol (Figure 1), and head-of-bed elevation was performed in all patients, unless specifically contraindicated. The study was designed to be pragmatic and to record data as part of usual care after implementation of the intervention. Therefore all interventions, including ventilator settings, were performed by the ED clinical staff. If the treating team believed that more appropriate ventilator settings could be established off-protocol (e.g. higher tidal volume and lower respiratory rate for status asthmaticus), this was allowed and at the discretion of the clinical team.
Figure 1.
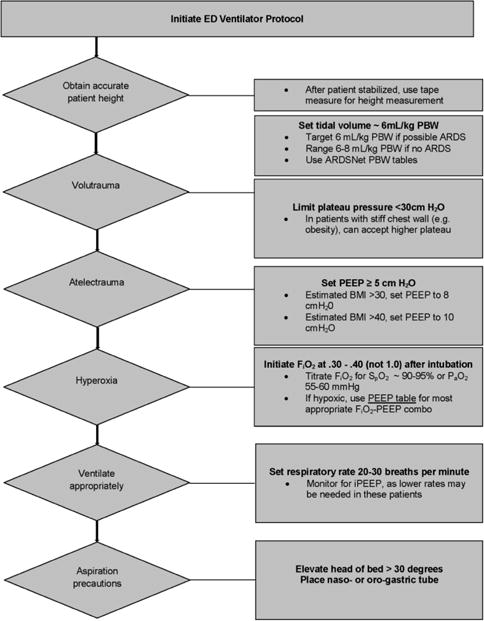
Emergency department ventilator protocol
Methods and Measurements
Data on baseline demographics, comorbid conditions, vital signs at presentation, laboratory variables, illness severity [Acute Physiology and Chronic Health Evaluation (APACHE)-II], ED length of stay, and indication for endotracheal intubation were collected19–21. Treatment variables in the ED included intravenous fluid, administration of blood products, central venous catheter placement, antibiotics, and vasopressor use.
All ED mechanical ventilator settings, airway pressures, pulmonary mechanics, and gas exchange variables were collected. ICU ventilator settings were followed for up to two weeks and collected twice daily. For pressure-targeted modes of ventilation, where plateau pressure is not usually measured, peak pressure was used. Fluid balance was recorded daily after ICU admission. Patients were followed until hospital discharge or death.
To assure that data from both groups was accurate and comparable, after identification and retrieval of the pre-intervention cohort, it was organized into an electronic database to exactly mirror the prospective data collection. Electronic data was then imported into the database. As further assurance of data accuracy, a research assistant, trained and blinded to study objectives and hypotheses, was used to verify data accuracy. Routine meetings between the principal investigator and the research assistant occurred to monitor data collection.
Comorbid conditions are provided in Appendix E1. Severe sepsis and septic shock were defined as previously described22. Lung-protective tidal volume was defined as the use of tidal volume of ≤ 8 mL/kg predicted body weight, as this was the upper limit of tidal volume allowed by previous investigations of low tidal volume ventilation in ARDS23.
Outcomes
The a priori primary outcome was a composite of pulmonary complications after admission: ARDS and ventilator-associated conditions. ARDS was defined according to the Berlin definition and adjudicated as previously described5,18. Adjudicators of ARDS status were blinded to all clinical variables, including ventilator settings and treatment period. See Appendix E2 for our standard operating procedure in adjudicating ARDS status. Ventilator-associated conditions were defined per the Centers for Disease Control (CDC) criteria7,17. Per these criteria, to qualify for a ventilator-associated condition, a patient must have two days of stable or improving ventilator settings, followed by two days of worsening oxygenation [increase in fraction of inspired oxygen (FiO2) or PEEP]. Secondary outcomes included ventilator-, hospital-, and ICU-free days, as well as hospital mortality. The impact of the intervention on the odds of receiving lung-protective ventilation in the ICU was also explored. To screen for heterogeneous treatment effects, a priori subgroups were analyzed according to sepsis, trauma, lactate levels, ED length of stay, those who received blood products in the ED, and those treated with vasopressors in the ED. After propensity score matching, for patients with baseline end-stage renal disease and those intubated for congestive heart failure/pulmonary edema, there was an imbalance between the pre-intervention group and the intervention group. Therefore two post hoc subgroup analyses, which excluded these patients, were performed.
Analysis
Participants were divided into two cohorts: 1) a pre-intervention group (prior to implementation of ED lung-protective ventilation); and 2) an intervention group (after implementation of ED lung protective ventilation).
Descriptive statistics, including mean (standard deviation [SD]), median (interquartile range [IQR]), and frequency distributions were used to assess patient characteristics. The Spearman correlation coefficient (rs) was used to assess the relationship between ED and ICU tidal volume. The primary analysis compared the proportion of patients in each cohort who met the composite primary outcome. Categorical characteristics were compared using the chi-square test. Continuous characteristics were compared using the independent samples t-test or Wilcoxon’s rank-sum test.
Given the nonrandomized treatment assignment and to balance the covariate distribution between the cohorts, a propensity score was derived using multivariable logistic regression with cohort as the dependent variable24,25. Several variables were identified a priori to be important confounding factors to use for the derivation of the propensity score [illness severity, body mass index (BMI), vasopressor use, and sepsis)]. Additional patient characteristics at ED admittance that were unbalanced with clinically important differences were also considered for inclusion in the propensity score. Lack of collinearity among propensity score variables was confirmed using Spearman correlations. Matching using optimal and Greedy methods with various absolute difference thresholds and using different propensity scores were performed, with the goal of achieving balance between clinically important covariates, while retaining as many patients as possible in the intervention group. Ultimately, a propensity score was derived which, after 1:1 Greedy Matching (with 0.3 set as the largest absolute difference compatible with a valid match), achieved balance between the two cohorts in the matched sample for the most important covariates. The final propensity score was derived using the following independent variables: illness severity (i.e. APACHE II), BMI, vasopressor use in the ED, sepsis, trauma, and age. Outcome analysis was performed using the final matched sample with 490 patients in each cohort. Categorical outcomes were compared using logistic regression modeling the odds of the outcome event where the pre-intervention group was the reference for the odds ratio. Count variables (i.e., ventilator-, hospital-, and ICU-free days) were compared using generalized estimating equations negative binomial regression.
The study duration for the prospective intervention period was 72.9 weeks. Given the before-after study design, to account for potential secular trends (i.e. temporal drift) in mechanical ventilation and clinical outcomes occurring over time, the pre-intervention cohort was divided into thirds, based on roughly equivalent epochs of time (73.7 weeks), for comparison to the intervention cohort.
We calculated a priori that with a sample of 513 patients in the intervention group, the study would have at least 80% power to detect a reduction in the primary outcome of 5 to 6 percentage points, at an alpha level of 0.05, assuming an event rate of approximately 20 to 25% in the pre-intervention group3–7. After propensity score matching, the sample of 490 patients per cohort provided 80% statistical power to detect a difference between cohorts of at least 6.7% in the event rate. All tests were two-tailed, and a P value <0.05 was considered statistically significant.
RESULTS
Characteristics of study subjects
Figure 2 presents the study flow diagram and the final study population.
Figure 2.
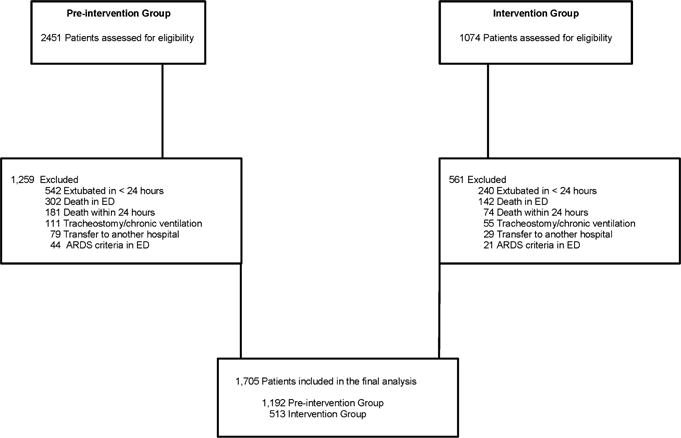
Study flow diagram
Baseline characteristics of the study population are shown in Table 1. Matching on the propensity score allowed the selection of 490 pairs of patients with greater similarity in illness severity and clinically relevant predictors of the primary outcome. After the propensity match, there was a significance difference between the two groups in patients with dialysis-dependence and those intubated secondary to congestive heart failure/pulmonary edema.
Table 1.
Characteristics of mechanically ventilated emergency department patients
| Baseline characteristics | Before Matching | After Matching | ||
|---|---|---|---|---|
|
| ||||
| Pre-intervention Group (n= 1,192) | Intervention Group (n= 513) | Pre-intervention Group (n= 490) | Intervention Group (n= 490) | |
|
| ||||
| Age (yr) | 60.4 (21.1) | 58.0 (24.0) | 58.2 (18.3) | 58.0 (24.0) |
|
| ||||
| Male, n (%) | 628 (52.7) | 303 (59.0) | 271 (55.3) | 288 (58.8) |
|
| ||||
| Race, n (%) | ||||
| Caucasian | 478 (40.1) | 232 (45.2) | 194 (39.6) | 228 (46.5) |
| African-American | 698 (58.6) | 280 (54.6) | 287 (58.6) | 261 (53.3) |
| Other | 16 (1.3) | 1 (0.2) | 9 (1.8) | 1 (0.20) |
|
| ||||
| Comorbidities, n (%) | ||||
| Diabetes | 427 (35.8) | 166 (32.4) | 172 (35.1) | 153 (31.2) |
| Cirrhosis | 84 (7.0) | 41 (8.0) | 41 (8.4) | 37 (7.6) |
| CHF | 289 (24.2) | 115 (22.4) | 121 (24.7) | 101 (20.6) |
| Dialysis | 95 (8.0) | 43 (8.4) | 65 (13.3) | 30 (6.1) |
| COPD | 304 (25.5) | 122 (23.8) | 119 (24.3) | 113 (23.1) |
| Immunosuppression | 95 (8.0) | 66 (12.9) | 70 (14.3) | 59 (12.0) |
| Alcohol abuse | 177 (14.8) | 76 (14.8) | 72 (14.7) | 76 (15.5) |
|
| ||||
| HIV/AIDS | 29 (2.4) | 6 (1.2) | 16 (3.3) | 6 (1.2) |
|
| ||||
| Height (in) | 67.1 (4.1) | 67.9 (3.9) | 67.4 (4.0) | 67.9 (3.9) |
|
| ||||
| Weight (kg) | 84.7 (30.6) | 83.9 (26.5) | 82.0 (27.5) | 83.9 (26.5) |
|
| ||||
| BMI | 29.3 (10.7) | 28.2 (8.8) | 28.1 (9.5) | 28.2 (8.8) |
|
| ||||
| Temperature (Celsius) | 36.9 (1.1) | 36.5 (1.2) | 36.9 (1.2) | 36.5 (1.2) |
|
| ||||
| Mean arterial pressure | 87.3 (22.5) | 84.0 (41.6) | 86.0 (38.0) | 85.3 (54.0) |
|
| ||||
| Lactate | 2.2 (1.4–3.9) | 3.0 (1.6–5.2) | 2.5 (1.4–4.7) | 2.9 (1.6–5.2) |
|
| ||||
| Creatinine | 1.2 (0.8–2.0) | 1.1 (0.8–1.8) | 1.3 (0.8–2.7) | 1.1 (0.8–1.7) |
|
| ||||
| Hemoglobin | 11.6 (2.5) | 12.2 (2.6) | 11.2 (2.7) | 12.3 (2.5) |
|
| ||||
| WBC | 12.9 (7.7) | 13.7 (7.5) | 13.9 (9.9) | 13.8 (7.4) |
|
| ||||
| Platelet | 221.7 (112.1) | 233.3 (105.1) | 219.0 (120.6) | 235.2 (105.4) |
|
| ||||
| INR | 1.4 (0.9) | 1.4 (0.9) | 1.2 (1.1–1.5) | 1.1 (1.0–1.3) |
|
| ||||
| Total bilirubin | 0.5 (0.3–0.9) | 0.4 (0.3–0.7) | 0.5 (0.3–0.9) | 0.4 (0.3–0.7) |
|
| ||||
| Albumin | 3.3 (0.7) | 3.4 (0.7) | 3.2 (0.8) | 3.4 (0.6) |
|
| ||||
| Sodium | 140 (6.3) | 139 (6.2) | 140 (7.0) | 139 (6.0) |
|
| ||||
| Potassium | 4.5 (1.0) | 4.4 (1.1) | 4.5 (1.1) | 4.4 (1.0) |
|
| ||||
| APACHE II* | 14.0 (8.0) | 17.0 (13.0) | 17.0 (8.0) | 16.0 (11.0) |
|
| ||||
| Reason for mechanical ventilation, n (%) | ||||
| Asthma | 30 (2.5) | 9 (1.8) | 4 (0.8) | 9 (1.8) |
| COPD | 95 (8.0) | 29 (5.7) | 23 (4.7) | 29 (5.9) |
| CHF/pulmonary edema | 85 (7.1) | 15 (2.9) | 37 (7.6) | 11 (2.2) |
| Sepsis | 322 (27.0) | 152 (29.6) | 130 (26.5) | 141 (28.8) |
| Trauma | 245 (20.6) | 147 (28.7) | 132 (26.9) | 143 (29.2) |
| Cardiac arrest | 81 (6.8) | 37 (7.2) | 41 (8.4) | 35 (7.1) |
| Drug overdose | 53 (4.4) | 22 (4.3) | 15 (3.1) | 21 (4.3) |
| Other | 281 (23.6) | 101 (19.7) | 108 (22.0) | 101 (20.6) |
|
| ||||
| Sepsis, n (%) | 421 (35.3) | 183 (35.7) | 165 (33.7) | 170 (34.7) |
|
| ||||
| ED LOS (hours) | 6.6 (3.8) | 5.1 (3.0) | 6.6 (3.8) | 5.1 (3.0) |
|
| ||||
| Process of Care Variables | ||||
|
| ||||
| Intravenous fluids in ED (liters) | 1.8 (1.9) | 1.5 (1.4) | 1.9 (2.0) | 1.6 (1.5) |
|
| ||||
| Fluid balance first 24 hours | 2.9 (3.9) | 3.0 (3.8) | 3.4 (3.2) | 3.0 (2.9) |
|
| ||||
| Blood product administration, n (%) | 126 (10.6) | 88 (17.2) | 76 (15.5) | 80 (16.3) |
|
| ||||
| Central venous catheter, n (%) | 357 (29.9) | 163 (31.8) | 181 (36.9) | 149 (30.4) |
|
| ||||
| Antibiotics, n (%) | 517 (43.4) | 230 (44.8) | 220 (44.9) | 215 (43.9) |
|
| ||||
| Vasopressor infusion, n (%) | 233 (19.6) | 148 (28.9) | 132 (26.9) | 133 (27.1) |
CHF: congestive heart failure; COPD: chronic obstructive pulmonary disease; HIV: human immunodeficiency virus; AIDS: acquired immunodeficiency syndrome; BMI: body mass index; WBC: white blood cell; INR: international normalized ratio; APACHE: acute physiology and chronic health evaluation; ED: emergency department; LOS: length of stay
Continuous variables are reported as mean (standard deviation) and median (interquartile range).
modified score, which excludes Glasgow Coma Scale
Main Results
Ventilator characteristics
A total of 3,273 ED ventilator settings were analyzed. Table 2 shows the effect of the intervention on mechanical ventilation practices in the ED. The intervention period was associated with significant changes in tidal volume, PEEP, respiratory rate, FiO2, and adherence to head-of-bed elevation. Tidal volume was reduced by a median of 1.8 mL/kg predicted body weight. Figure 3 shows the distribution of ED tidal volume in the two cohorts. Lung-protective ventilation increased by 48.4%.
Table 2.
Ventilator variables in the emergency department
| Pre-intervention Group (n= 1,192) | Intervention Group (n= 513) | * Odds Ratio or Between-Group Difference (95% CI) | |
|---|---|---|---|
|
| |||
| Tidal volume, mL | |||
| Median (IQR) | 500 (500–550) | 420 (370–470) | |
| Mean (SD) | 515.7 (71.6) | 422.0 (71.5) | −93.7 (−99.5 to −87.8) |
|
| |||
| Tidal volume, mL/kg PBW | |||
| Median (IQR) | 8.1 (7.3–9.1) | 6.3 (6.0–6.7) | |
| Mean (SD) | 8.3 (1.5) | 6.4 (0.8) | −1.8 (−1.9 to −1.7) |
|
| |||
| PEEP | |||
| Median (IQR) | 5 (5–5) | 5 (5–8) | |
| Mean (SD) | 5.4 (1.5) | 6.5 (2.5) | 1.1 (0.9 to 1.3) |
|
| |||
| Respiratory rate | |||
| Median (IQR) | 14 (12–16) | 20 (20–24) | |
| Mean (SD) | 15.3 (3.5) | 20.9 (3.8) | 5.6 (5.3 to 5.9) |
|
| |||
| FiO2 | |||
| Median (IQR) | 80 (50–100) | 40 (40–60) | |
| Mean (SD) | 75.0 (25.9) | 53.4 (21.7) | −21.6 (−23.5 to −19.8) |
|
| |||
| Head-of-bed elevation, n (%) | 989 (39.4) | 704 (92.6) | 19.4 (14.6–25.7) |
|
| |||
| Lung protective ventilation, n (%) | 1202 (47.8) | 731 (96.2) | 37.6 (21.8–64.7) |
|
| |||
| Ventilator Mode, n (%) | |||
| VC-AC | 2274 (90.5) | 687 (90.4) | 0.9 (0.8–1.3) |
| PC-AC | 92 (3.7) | 12 (1.6) | 0.4 (0.2–0.8) |
| VC-SIMV | 32 (1.3) | 2 (0.3) | 0.2 (0.05–0.9) |
| PRVC-AC | 92 (3.7) | 57 (7.5) | 2.1 (1.5–3.0) |
| Other | 23 (0.9) | 2 (0.3) | 0.3 (0.07–1.2) |
|
| |||
| Peak pressure, cm H2O | |||
| Median (IQR) | 29 (24–36) | 26 (21–31) | |
| Mean (SD) | 30.2 (8.8) | 26.7 (7.3) | −3.4 (−4.1 to −2.8) |
|
| |||
| Plateau pressure, cmH2O | |||
| Median (IQR) | 19 (15–23) | 18 (15–23) | |
| Mean (SD) | 19.5 (6.2) | 19.5 (5.7) | −0.04 (−0.7 to 0.7) |
|
| |||
| Mean airway pressure, cmH2O | |||
| Median (IQR) | 10 (8–12) | 11 (9–14) | |
| Mean (SD) | 10.4 (3.0) | 11.8 (3.5) | 1.5 (1.2 to 1.7) |
|
| |||
| Compliance respiratory system (mL/cm H2O) | |||
| Median (IQR) | 38.2 (29.4–50.0) | 34.6 (26.3–45.0) | |
| Mean (SD) | 41.6 (18.0) | 36.7 (14.9) | −4.9 (−7.0 to −2.9) |
|
| |||
| Driving Pressure (cm H2O) | |||
| Median (IQR) | 13 (10–17) | 12 (10–16) | |
| Mean (SD) | 14.3 (6.2) | 13.1 (5.1) | −1.2 (−1.9 to −0.5) |
|
| |||
| Oxygenation index | |||
| Median (IQR) | 3.7 (2.4–6.5) | 4.1 (2.7–7.8) | |
| Mean (SD) | 5.2 (4.2) | 6.3 (5.8) | 1.2 (0.6 to 1.7) |
|
| |||
| pH | |||
| Median (IQR) | 7.34 (7.24–7.41) | 7.29 (7.19–7.38) | |
| Mean (SD) | 7.30 (0.14) | 7.27 (0.15) | −0.05 (−0.06 to −0.03) |
|
| |||
| PaO2 | |||
| Median (IQR) | 156 (102–239) | 118 (80–172) | |
| Mean (SD) | 186.7 (108.5) | 137.8 (80.6) | −48.9 (−58.4 to −39.5) |
|
| |||
| PaCO2 | |||
| Median (IQR) | 41 (34–52) | 43 (37–54) | |
| Mean (SD) | 46.4 (19.7) | 48.5 (19.9) | 2.1 (0.05 to 4.2) |
|
| |||
| PaO2:FiO2 | |||
| Median (IQR) | 227 (135–334) | 263 (158–371) | |
| Mean (SD) | 241.3 (122.5) | 273.1 (136.0) | 31.8 (17.9 to 45.6) |
A total of 3,273 ED ventilator settings were analyzed (2,513 pre-intervention group; 760 intervention group). In the pre-intervention group, peak pressure was monitored for 1,865 settings (74.2%), plateau pressure for 422 settings (16.8%), and mean pressure for 1,804 settings (71.8%).
In the intervention group, all pressures were monitored for each recorded ventilator setting (100%). IQR: interquartile range; SD: standard deviation; PBW: predicted body weight; PEEP: positive end-expiratory pressure; FiO2: fraction of inspired oxygen; VC: volume control; AC: assist control; PC: pressure control; SIMV: synchronized intermittent mandatory ventilation; PRVC: pressure regulated volume control; PaO2: partial pressure of arterial oxygen; PaCO2: partial pressure of arterial carbon dioxide; CI: confidence interval
Odds ratio is presented for binary data and between-group difference is presented as the difference in means for the continuous data.
Figure 3. Distribution of emergency department tidal volume.
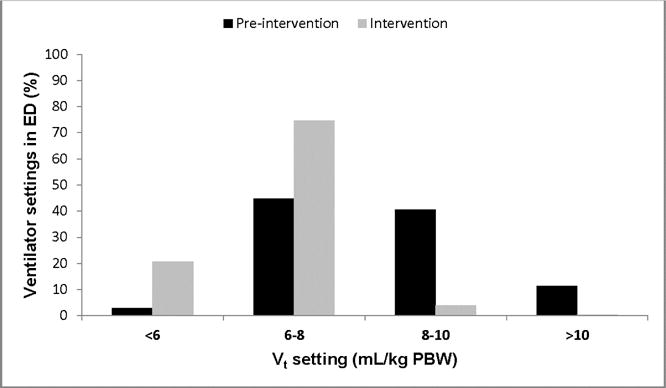
There was an increase in lung-protective ventilation in the ED associated with the intervention (47.8% to 96.2%).
ED: emergency department; PBW: predicted body weight
A total of 22,960 ICU ventilator settings were analyzed. Table 3 shows the comparison of ICU ventilator settings between the two groups. Following the intervention, ICU tidal volume decreased by a median of 1.1 mL/kg predicted body weight. Lung-protective ventilation increased by 30.7%. Multivariable logistic regression analysis demonstrated that the intervention was associated with an increased probability of receiving lung-protective ventilation in the ICU (aOR 5.1, 95% CI 3.76–6.98). The correlation (95% CI) between ED tidal volume and ICU tidal volume was 0.71 (0.67–0.73).
Table 3.
Ventilator variables in the intensive care unit
| Pre-intervention Group (n= 1,192) | Intervention Group (n= 513) | * Odds Ratio or Between-Group Difference (95% CI) | |
|---|---|---|---|
|
| |||
| Tidal volume, mL/kg PBW | |||
| Median (IQR) | 8.1 (7.3–9.1) | 7.0 (6.4–8.0) | |
| Mean (SD) | 8.3 (1.5) | 7.3 (1.4) | −0.9 (−1.0 to −0.9) |
|
| |||
| PEEP | |||
| Median (IQR) | 5 (5–5) | 5 (5–5) | |
| Mean (SD) | 5.6 (1.9) | 5.8 (1.9) | 0.3 (0.2 to 0.3) |
|
| |||
| FiO2 | |||
| Median (IQR) | 40 (40–50) | 40 (40–40) | |
| Mean (SD) | 48.3 (17.2) | 41.4 (11.5) | −6.8 (−7.3 to −6.4) |
|
| |||
| Lung protective ventilation, n (%) | 8404 (46.0) | 3700 (76.7) | 3.9 (3.6–4.2) |
|
| |||
| Ventilator Mode, n (%) | |||
| VC-AC | 13,052 (72.0) | 2,925 (60.6) | 0.6 (0.56–0.64) |
| PC-AC | 749 (4.1) | 342 (7.1) | 1.8 (1.6–2.0) |
| VC-SIMV | 1,456 (8.0) | 145 (3.0) | 0.4 (0.3–0.4) |
| PRVC-AC | 2,783 (15.3) | 977 (20.2) | 1.4 (1.3–1.5) |
| Other | 94 (0.5) | 437 (9.1) | 19.1 (15.3–23.9) |
|
| |||
| Peak pressure, cm H2O | |||
| Median (IQR) | 27 (23–33) | 24 (20–29) | |
| Mean (SD) | 28.3 (7.7) | 24.1 (7.6) | −4.2 (−4.4 to −3.9) |
|
| |||
| Plateau pressure, cmH2O | |||
| Median (IQR) | 21 (17–25) | 20 (16–23) | |
| Mean (SD) | 21.9 (6.4) | 20.3 (5.6) | −1.7 (−1.8 to −1.5) |
|
| |||
| Mean airway pressure, cmH2O | |||
| Median (IQR) | 11 (10–13) | 11 (9–13) | |
| Mean (SD) | 11.8 (3.4) | 11.6 (3.3) | −0.2 (−0.3 to −0.1) |
|
| |||
| Compliance respiratory system (mL/cm H2O) | |||
| Median (IQR) | 33.3 (26.2–42.9) | 34.5 (26.7–44) | |
| Mean (SD) | 36.1 (14.6) | 37.3 (15.8) | 1.2 (0.7 to 1.7) |
|
| |||
| Driving Pressure (cm H2O) | |||
| Median (IQR) | 15 (12–20) | 14 (11–17) | |
| Mean (SD) | 16.4 (6.1) | 14.4 (5.2) | −2.0 (−2.1 to −1.8) |
|
| |||
| Oxygenation index | |||
| Median (IQR) | 4.2 (2.9–6.9) | 3.8 (2.6–5.9) | |
| Mean (SD) | 5.8 (4.7) | 5.0 (4.0) | −0.8 (−1.0 to −0.7) |
|
| |||
| pH | |||
| Median (IQR) | 7.41 (7.35–7.45) | 7.4 (7.36–7.44) | |
| Mean (SD) | 7.39 (0.09) | 7.39 (0.08) | 0.0 (0.0 to 0.0) |
|
| |||
| PaO2 | |||
| Median (IQR) | 118 (86–154) | 120 (89–154) | |
| Mean (SD) | 129.1 (63.4) | 124.9 (46.5) | −4.2 (−6.0 to −2.3) |
|
| |||
| PaO2:FiO2 | |||
| Median (IQR) | 265 (182–360) | 300 (213–398) | |
| Mean (SD) | 281.8 (135.5) | 311.0 (126.2) | 29.1 (24.3 to 34.0) |
A total of 22,960 ventilator settings were analyzed (18,134 pre-intervention group; 4,826 intervention group). In the pre-intervention group, all airway pressures were recorded (100%). In the intervention group, peak pressure was monitored for 4,826 settings (100%); plateau pressure and mean airway pressure for 4,428 settings (91.8%).
After adjustment for covariates (age, gender, body mass index, lactate, APACHE II), the intervention group was associated with an increased probability of receiving lung-protective ventilation in the intensive care unit (aOR 5.1, 95% CI 3.76–6.98).
IQR: interquartile range; SD: standard deviation; PBW: predicted body weight; PEEP: positive end-expiratory pressure; FiO2: fraction of inspired oxygen; VC: volume control; AC: assist control; PC: pressure control; SIMV: synchronized intermittent mandatory ventilation; PRVC: pressure regulated volume control; PaO2: partial pressure of arterial oxygen; CI: confidence interval
Odds ratio is presented for binary data and between-group difference is presented as the difference in means for the continuous data.
Fluid balance after admission
The two groups were well-balanced with respect to fluid administration in the ED, at 24 hours, and during the first week of admission (Table 1, Figure E1).
Primary and secondary outcomes
In the propensity score-matched analysis, there was an absolute risk reduction for the primary outcome of 7.1% [adjusted OR, 0.47 (0.31–0.71)] (Table 4).
Table 4.
Results of outcome analyses
| Before Matching | After Matching | |||||
|---|---|---|---|---|---|---|
| Pre-intervention Group (n= 1,192) | Intervention Group (n= 513) | OR or Between-Group Difference (95% CI) | Pre-intervention Group (n= 490) | Intervention Group (n= 490) | * aOR or Between-Group Difference (95% CI) | |
| Primary composite outcome, n (%) •ARDS •VACs |
171 (14.3) 130 (10.9) 86 (7.2) |
38 (7.4) 22 (4.3) 23 (4.5) |
0.48 (0.33–0.69) 0.37 (0.23–0.58) 0.60 (0.38–0.97) |
71 (14.5) 53 (10.8) 37 (7.6) |
36 (7.4) 20 (4.1) 23 (4.7) |
0.47 (0.31–0.71) 0.35 (0.21–0.60) 0.60 (0.35–1.03) |
| Ventilator-free days | 16.0 (11.4) | 18.2 (10.5) | 2.17 (1.06 to 3.29) | 14.7 (11.7) | 18.4 (10.4) | 3.69 (2.30 to 5.07) |
| Hospital-free days | 10.8 (9.6) | 11.6 (9.2) | 0.87 (−0.09 to 1.84) | 9.4 (9.5) | 11.7 (9.2) | 2.38 (1.21 to 3.55) |
| ICU-free days | 15.0 (10.8) | 15.8 (10.0) | 0.77 (−0.30 to 1.83) | 13.6 (11.1) | 16.0 (9.9) | 2.36 (1.04 to 3.68) |
| Mortality, n (%) | 338 (28.4) | 105 (20.5) | 0.65 (0.51–0.83) | 167 (34.1) | 96 (19.6) | 0.47 (0.35–0.63) |
The primary outcome was a composite pulmonary outcome that combines the event rate for ARDS and VACs.
OR: odds ratio; CI: confidence interval; aOR: adjusted odds ratio; ARDS: acute respiratory distress syndrome; VAC: ventilator-associated condition; ICU: intensive care unit
From logistic regression modeling (categorical data) and generalized estimating equations negative binomial regression (continuous data).
Secondary outcomes are also presented in Table 4. There was an increase in ventilator-free days (mean difference 3.7, 95% CI 2.3–5.1), ICU-free days (mean difference 2.4, (95% CI 1.0–3.7), and hospital-free days (mean difference 2.4, 95% CI 1.2–3.6) associated with the intervention. There was an absolute risk reduction for mortality of 14.5% [adjusted OR, 0.47 (0.35–0.63)].
Subgroup analyses are shown in Table E1. There was a significant reduction in the primary outcome across all subgroups, excluding trauma patients.
Secular trends
During the intervention period, the practice changes in mechanical ventilation in the ED and ICU were a deviation from the temporal trends of the pre-intervention period (Table E2, Figures E2, and E3). The change in primary outcome, ventilator-free days, and mortality was also a deviation from the secular trends of the pre-intervention period, and consistent with implementation of the intervention (Table E2).
LIMITATIONS
There are several limitations to the present study. A before-after study design is prone to temporal trends that may lead to independent changes in care. Analysis of secular changes did not demonstrate this; the greatest change in clinical practice and outcomes was isolated to the intervention period. However, unmeasured confounders that improved overall care during the intervention may have accounted for some of the improved outcomes. The study design can raise concern over proof of causation. These results may be better viewed as an association, yet our results are consistent with some of the RCTs that have shown benefit in critical care. Consistent findings across trial design suggests cause-effect26. Dose-response also suggests causality, and greater benefit was derived for the subgroup of patients with longer ED lengths of stay. As a single-center study, results could be prone to an overestimation of effect. A randomized, multi-center trial would be the most robust way to test the hypothesis and reduce bias. However, many randomized trials in critical care exclude up to 90% of screened patients, limiting external validity and implementation into practice27. We aimed to be pragmatic for the current investigation and believe it applies well to real-world clinical care, as all consecutive patients, satisfying inclusion and exclusion criteria, were enrolled (enhancing external validity). Some imbalance in baseline characteristics between the two study groups did exist. However, propensity score adjustment reduced imbalance in the most important clinical covariates; most of the statistical imbalances prior to propensity score adjustment reflected little clinical significance. Furthermore, subgroup analyses across potentially clinically important imbalances demonstrated a similar significant effect of the intervention (i.e. high internal consistency). After the propensity score match, there was imbalance between the groups in dialysis-dependence and heart failure/pulmonary edema as the etiology of respiratory failure. We know of no data to suggest that the event rate for our primary outcome is higher in these cohorts. The ultimate goal of the propensity match was to achieve balance between the most clinically important variables, and retain as many patients as possible, as the large sample size is a strength of the study. We believe the propensity match was a success in that regard, as there was balance in the most important pre-disposing conditions (illness severity, shock, sepsis, trauma) and risk modifiers (male gender, alcohol abuse, obesity, immunosuppression, diabetes, and blood product administration). Also, in the post hoc subgroup analyses which focused on these imbalances, the intervention remained associated with a reduction in the primary outcome, with a near identical effect size. We did not formally study potential complications, such as patient-ventilator dysynchrony. The majority of data show that lung-protective ventilation is well-tolerated28. Given the known deleterious effects of dysynchrony, if this were present to a significant degree across the study cohort, results would have also been biased toward the null hypothesis29. It should be noted that it is impossible to prescribe a standard ventilator approach to all patients, and some may tolerate a low tidal volume approach poorly (e.g. status asthmaticus, chronic obstructive pulmonary disease, severe metabolic acidosis). These are a minority of patients mechanically ventilated in the ED, suggesting that lung-protective protocols could decrease the unnecessary heterogeneity in management and improve outcome. Finally, the intervention was multifaceted and addressed several ventilator parameters (i.e. a bundle). Given the abundance of pre-clinical and clinical data regarding ventilator-associated lung injury, we hypothesize that mitigation of early ventilator-associated lung injury is responsible for these findings. The tidal volume difference between the two groups was approximately 2mL/kg predicted body weight. This is an interesting finding, but a smaller tidal volume difference than that seen in prior work on lung-protective ventilation in at-risk patients9,11,15. While it may be difficult to ascribe the observed clinical effects to this tidal volume difference, improved outcomes have been seen with tidal volume differences around 1mL/kg predicted body weight in patients with ARDS, and at risk3,14. Our intervention also achieved a significant decrease in the FiO2 and resultant partial pressure of arterial oxygen, which has been shown to improve mortality and decrease ventilator duration in mechanically ventilated ICU patients30. So it is possible that both of these interventions were influential on outcome. However, without a different trial design or any mechanistic outcomes, we are unable to fully dissect from where the exact benefit is derived.
DISCUSSION
The rationale for implementing lung-protective ventilation in the ED hinges on the premise that there is a temporal link between ventilator management during the earliest period of respiratory failure and the development of subsequent complications; early adherence to lung-protective ventilation could therefore improve outcome. Multiple studies show a link between non-protective ventilation in the ICU and ARDS incidence, with ARDS onset typically two days after admission8,9,11,31–36. In a RCT of abdominal surgery patients ventilated for 5.5 hours in the OR (the approximate ED length of stay in the current study), lung-protective ventilation decreased major pulmonary complications and hospital length of stay15. The results of this large before-after study extend mechanical ventilation interventions to the ED and have several implications.
First, lung-protective ventilation strategies can be implemented effectively in the ED. Critical care interventions considered overly complex are unlikely to be implemented effectively in the ED37. As mechanically ventilated patients have higher mortality and longer ED lengths of stay when compared to non-ventilated ED patients, implementing effective and feasible therapies is paramount1. The current study provides data to suggest that an ED-based lung-protective ventilation protocol, which is simple and relatively easy to implement, could be adopted widely and impact outcome.
Second, the implementation of an ED-based lung-protective ventilator protocol not only changed ED mechanical ventilation practices, but also exerted similar influence on ventilator practices in the ICU. This is demonstrated by correlation statistics, a multivariable analysis of predictors of ICU lung-protective ventilation, and analysis of secular trends in ICU mechanical ventilation. Initial ventilator settings in the ICU influence subsequent adherence to lung-protective ventilation in ARDS patients14. Given the known poor adherence to lung-protective ventilation that exists in the ICU, combined with our current results, timely attention to mechanical ventilation immediately after endotracheal intubation could be a high fidelity intervention to improve clinical practice and outcome.
Third, the intervention was associated with a significant reduction in pulmonary complications, hospital mortality, and healthcare resource utilization. These findings were significant after propensity score adjustment, and were stable in subgroup and secular analyses. Therefore, within the context of otherwise routine care in the ED and ICU, these data suggest that LPV initiated in the ED could improve clinical outcome.
In conclusion, this before-after study of mechanically ventilated patients demonstrates that implementing a mechanical ventilator protocol in the ED is feasible, and associated with improvements in the delivery of safe mechanical ventilation and clinical outcome. Innovation can only improve societal health if it reaches the patient and is externally valid. Previous critical care medicine research demonstrates that lung-protective ventilation remains implemented poorly, even for patients with a clear indication for it14,38. By attempting to standardize care delivery and reduce unnecessary practice variability, the present study demonstrated clinical benefit when targeting a site typically not considered for mechanical ventilation research (i.e. the ED)39. In this regard, a new approach of setting the ventilator appropriately immediately after endotracheal intubation could help overcome existing shortfalls in in the implementation of lung-protective ventilation40.
Supplementary Material
Acknowledgments
We would like to thank Karen Steger-May, MA, and Cory Jensen, Division of Biostatistics, Washington University in St. Louis, for their assistance in statistical analysis of the data, especially the propensity score matching. We are indebted to the respiratory therapists, residents and attending emergency physicians at Barnes-Jewish Hospital/Washington University in St. Louis who cared for these patients and implemented the ventilator protocol on a daily basis. Finally, we would like to acknowledge the work of the many clinicians and researchers who have made invaluable contributions in the fields of mechanical ventilation, ARDS, and lung injury prevention. The current report was made possible by their lasting scientific contributions.
Grants/Funding Information:
BMF and AMD were funded by the KL2 Career Development Award, and this research was supported by the Washington University Institute of Clinical and Translational Sciences (Grants UL1 TR000448 and KL2 TR000450) from the National Center for Advancing Translational Sciences (NCATS). BMF was also funded by the Foundation for Barnes-Jewish Hospital Clinical and Translational Sciences Research Program (Grant # 8041-88). AMD was also funded by the Foundation for Anesthesia Education and Research. NMM was supported by grant funds from the Emergency Medicine Foundation and the Health Resources and Services Administration. EA was supported by the Washington University School of Medicine Faculty Scholars grant and the Foundation for Barnes-Jewish Hospital. RJS was supported by the Clinical and Translational Science Award (CTSA) program of the NCATS of the National Institutes of Health (NIH) under Award Numbers UL1 TR000448 and TL1 TR000449. CCB was supported by the Short-Term Institutional Research Training Grant, NIH T35 (NHLBI). RSH was supported by NIH grants R01 GM44118-22 and R01 GM09839. MHK was supported by the Barnes-Jewish Hospital Foundation. Funders played no role in the following: design and conduct of the study; collection, management, analysis, and interpretation of the data; and preparation, review, or approval of the manuscript.
Footnotes
Publisher's Disclaimer: This is a PDF file of an unedited manuscript that has been accepted for publication. As a service to our customers we are providing this early version of the manuscript. The manuscript will undergo copyediting, typesetting, and review of the resulting proof before it is published in its final citable form. Please note that during the production process errors may be discovered which could affect the content, and all legal disclaimers that apply to the journal pertain.
Meetings: Partial data from the implementation phase of this work was presented at the American Thoracic Society Conference on May 17, 2016 in San Francisco, California. The results of the study will be presented as an oral abstract presentation (Star Research Presentation) on January 22, 2017 in Honolulu, Hawaii for the Society of Critical Care Medicine 46th annual congress.
Summary Conflict of Interest Statement: All authors declare that no conflicts of interest exist.
Trial Registration: ClinicalTrials.gov Identifier NCT02543554
Author contributions:
Study concept and design: BMF, ITF, RSH, MHK; Acquisition of data: BMF, ITF, RJS, CCB, AAK; Management of data and quality control: BMF; Analysis and interpretation of data: BMF, ITF, NMM, RSH, MHK; Drafting of the manuscript: BMF; Critical revision and final approval of the manuscript: BMF, ITF, NMM, AMD, CP, BTW, EA, JK, RJS, CCB, AAK, RSH, MHK; Statistical analysis: BMF; Administrative, technical, or material support: BMF, ITF, RJS, CCB, AAK; Study supervision: BMF, MHK. BMF takes responsibility for the manuscript as a whole.
Contributor Information
Brian M. Fuller, Departments of Emergency Medicine and Anesthesiology, Division of Critical Care, Washington University School of Medicine in St. Louis, St. Louis, MO 63110, USA.
Ian T. Ferguson, School of Medicine and Medical Science, University College Dublin, Dublin 4, Ireland.
Nicholas M. Mohr, Departments of Emergency Medicine and Anesthesiology, Division of Critical Care, Roy J. and Lucille A. Carver College of Medicine, University of Iowa, 200 Hawkins Drive, 1008 RCP, Iowa City, IA 52242, USA.
Anne M. Drewry, Department of Anesthesiology, Division of Critical Care Medicine, Washington University School of Medicine in St. Louis, St. Louis, MO 63110, USA.
Christopher Palmer, Departments of Emergency Medicine and Anesthesiology, Division of Critical Care, Washington University School of Medicine in St. Louis, St. Louis, MO 63110, USA.
Brian T. Wessman, Departments of Emergency Medicine and Anesthesiology, Division of Critical Care, Washington University School of Medicine in St. Louis, St. Louis, MO 63110, USA.
Enyo Ablordeppey, Departments of Emergency Medicine and Anesthesiology, Division of Critical Care, Washington University School of Medicine in St. Louis, St. Louis, MO 63110, USA.
Jacob Keeperman, Departments of Emergency Medicine and Anesthesiology, Division of Critical Care, Washington University School of Medicine in St. Louis, St. Louis, MO 63110, USA.
Robert J. Stephens, Washington University School of Medicine in St. Louis, St. Louis, MO 63110, USA
Cristopher C. Briscoe, Washington University School of Medicine in St. Louis, St. Louis, MO 63110, USA
Angelina A. Kolomiets, School of Public Health and Social Justice, Saint Louis University, St. Louis, MO 63104, USA.
Richard S. Hotchkiss, Department of Anesthesiology, Division of Critical Care Medicine, Washington University School of Medicine in St. Louis, St. Louis, MO 63110, USA.
Marin H. Kollef, Department of Medicine, Division of Pulmonary and Critical Care Medicine, Washington University School of Medicine in St. Louis, St. Louis, MO 63110, USA.
References
- 1.Easter BD, Fischer C, Fisher J. The use of mechanical ventilation in the ED. Am J Emerg Med. 2012;30(7):1183–1188. doi: 10.1016/j.ajem.2011.09.008. [DOI] [PubMed] [Google Scholar]
- 2.Rose L, Gray S, Burns K, et al. Emergency department length of stay for patients requiring mechanical ventilation: a prospective observational study. Scandinavian journal of trauma, resuscitation and emergency medicine. 2012;20(1):1. doi: 10.1186/1757-7241-20-30. [DOI] [PMC free article] [PubMed] [Google Scholar]
- 3.Dettmer MR, Mohr NM, Fuller BM. Sepsis-associated pulmonary complications in emergency department patients monitored with serial lactate: An observational cohort study. J Crit Care. 2015;30(6):1163–1168. doi: 10.1016/j.jcrc.2015.07.031. [DOI] [PMC free article] [PubMed] [Google Scholar]
- 4.Fuller B, Mohr N, Dettmer M, et al. Mechanical ventilation and acute lung injury in emergency department patients with severe sepsis and septic shock: an observational study. Acad Emerg Med. 2013;20(7):659–669. doi: 10.1111/acem.12167. [DOI] [PMC free article] [PubMed] [Google Scholar]
- 5.Fuller B, Mohr NM, Miller CN, et al. Mechanical ventilation and acute respiratory distress syndrome in the emergency department: a multi-center, observational, prospective, cross-sectional, study. Chest. 2015;148(2):365–374. doi: 10.1378/chest.14-2476. [DOI] [PMC free article] [PubMed] [Google Scholar]
- 6.Mikkelsen M, Shah CV, Meyer NJ, et al. The epidemiology of acute respiratory distress syndrome in patients presenting to the emergency department with severe sepsis. Shock. 2013;40(5):375–381. doi: 10.1097/SHK.0b013e3182a64682. [DOI] [PMC free article] [PubMed] [Google Scholar]
- 7.Boyer AF, Schoenberg N, Babcock H, et al. A prospective evaluation of ventilator-associated conditions and infection-related ventilator-associated conditions. Chest. 2015;147(1):68–81. doi: 10.1378/chest.14-0544. [DOI] [PubMed] [Google Scholar]
- 8.Fuller BM, Mohr NM, Drewry AM, et al. Lower tidal volume at initiation of mechanical ventilation may reduce progression to acute respiratory distress syndrome-a systematic review. Critical Care. 2013;17(1):R11. doi: 10.1186/cc11936. [DOI] [PMC free article] [PubMed] [Google Scholar]
- 9.Neto A, Cardoso SO, Manetta JA, et al. Association between use of lung-protective ventilation with lower tidal volumes and clinical outcomes among patients without acute respiratory distress syndrome a meta-analysis. JAMA: the journal of the American Medical Association. 2012;308(16):1651–1659. doi: 10.1001/jama.2012.13730. [DOI] [PubMed] [Google Scholar]
- 10.Spragg R, Bernard G, Checkley W, et al. Beyond mortality: future clinical research in acute lung injury. American Journal of Respiratory and Critical Care Medicine. 2010;181(10):1121–1127. doi: 10.1164/rccm.201001-0024WS. [DOI] [PMC free article] [PubMed] [Google Scholar]
- 11.Determann R, Royakkers A, Wolthuis E, et al. Ventilation with lower tidal volumes as compared with conventional tidal volumes for patients without acute lung injury: a preventive randomized controlled trial. Critical care. 2010;14(1):R1. doi: 10.1186/cc8230. [DOI] [PMC free article] [PubMed] [Google Scholar]
- 12.Webb HH, Tierney DF. Experimental Pulmonary Edema due to Intermittent Positive Pressure Ventilation with High Inflation Pressures. Protection by Positive End-Expiratory Pressure 1–4. American Review of Respiratory Disease. 1974;110(5):556–565. doi: 10.1164/arrd.1974.110.5.556. [DOI] [PubMed] [Google Scholar]
- 13.Dreyfuss D, Soler P, Basset G, et al. High inflation pressure pulmonary edema: respective effects of high airway pressure, high tidal volume, and positive end-expiratory pressure. American Review of Respiratory Disease. 1988;137(5):1159–1164. doi: 10.1164/ajrccm/137.5.1159. [DOI] [PubMed] [Google Scholar]
- 14.Needham DM, Yang T, Dinglas VD, et al. Timing of low tidal volume ventilation and intensive care unit mortality in acute respiratory distress syndrome. A prospective cohort study. Am J Respir Crit Care Med. 2015;191(2):177–185. doi: 10.1164/rccm.201409-1598OC. [DOI] [PMC free article] [PubMed] [Google Scholar]
- 15.Futier E, Constantin J-M, Paugam-Burtz C, et al. A trial of intraoperative low-tidal-volume ventilation in abdominal surgery. N Engl J Med. 2013;369(5):428–437. doi: 10.1056/NEJMoa1301082. [DOI] [PubMed] [Google Scholar]
- 16.Mascia L, Pasero D, Slutsky AS, et al. Effect of a lung protective strategy for organ donors on eligibility and availability of lungs for transplantation: a randomized controlled trial. JAMA. 2010;304(23):2620–2627. doi: 10.1001/jama.2010.1796. [DOI] [PubMed] [Google Scholar]
- 17.Fuller BM, Ferguson I, Mohr NM, et al. Lung-protective ventilation initiated in the emergency department (LOV-ED): a study protocol for a quasi-experimental, before-after trial aimed at reducing pulmonary complications. BMJ Open. 2016;6(4):e010991. doi: 10.1136/bmjopen-2015-010991. [DOI] [PMC free article] [PubMed] [Google Scholar]
- 18.Acute respiratory distress syndrome. The ARDS definition task force. JAMA. 2012;307(23):2526–2533. doi: 10.1001/jama.2012.5669. [DOI] [PubMed] [Google Scholar]
- 19.Vincent J, Moreno R, Takala J, et al. The SOFA (Sepsis-related Organ Failure Assessment) score to describe organ dysfunction/failure. Intensive care medicine. 1996;22(7):707–710. doi: 10.1007/BF01709751. [DOI] [PubMed] [Google Scholar]
- 20.Vincent J, De Mendonça A, Cantraine F, et al. Use of the SOFA score to assess the incidence of organ dysfunction/failure in intensive care units: results of a multicenter, prospective study. Critical care medicine. 1998;26(11):1793–1800. doi: 10.1097/00003246-199811000-00016. [DOI] [PubMed] [Google Scholar]
- 21.Vincent J, Angus D, Artigas A, et al. Effects of drotrecogin alfa (activated) on organ dysfunction in the PROWESS trial*. Critical care medicine. 2003;31(3):834–840. doi: 10.1097/01.CCM.0000051515.56179.E1. [DOI] [PubMed] [Google Scholar]
- 22.Bone RC, Balk RA, Cerra FB, et al. Definitions for sepsis and organ failure and guidelines for the use of innovative therapies in sepsis. The ACCP/SCCM Consensus Conference Committee. American College of Chest Physicians/Society of Critical Care Medicine. Chest. 1992;101(6):1644–1655. doi: 10.1378/chest.101.6.1644. [DOI] [PubMed] [Google Scholar]
- 23.Ventilation with lower tidal volumes as compared with traditional tidal volumes for acute lung injury and the acute respiratory distress syndrome. The Acute Respiratory Distress Syndrome Network. N Engl J Med. 2000;342(18):1301–1308. doi: 10.1056/NEJM200005043421801. [DOI] [PubMed] [Google Scholar]
- 24.Haukoos JS, Lewis RJ. The propensity score. JAMA. 2015;314(15):1637–1638. doi: 10.1001/jama.2015.13480. [DOI] [PMC free article] [PubMed] [Google Scholar]
- 25.Kitsios GD, Dahabreh IJ, Callahan S, et al. Can we trust observational studies using propensity scores in the critical care literature? A systematic comparison with randomized clinical trials. Critical care medicine. 2015;43(9):1870–1879. doi: 10.1097/CCM.0000000000001135. [DOI] [PubMed] [Google Scholar]
- 26.Landoni G, Comis M, Conte M, et al. Mortality in Multicenter Critical Care Trials: An Analysis of Interventions With a Significant Effect*. Critical care medicine. 2015;43(8):1559–1568. doi: 10.1097/CCM.0000000000000974. [DOI] [PubMed] [Google Scholar]
- 27.Vincent J-L. We should abandon randomized controlled trials in the intensive care unit. Critical care medicine. 2010;38(10):S534–S538. doi: 10.1097/CCM.0b013e3181f208ac. [DOI] [PubMed] [Google Scholar]
- 28.Kahn JM, Andersson L, Karir V, et al. Low tidal volume ventilation does not increase sedation use in patients with acute lung injury*. Critical care medicine. 2005;33(4):766–771. doi: 10.1097/01.ccm.0000157786.41506.24. [DOI] [PubMed] [Google Scholar]
- 29.Thille AW, Rodriguez P, Cabello B, et al. Patient-ventilator asynchrony during assisted mechanical ventilation. Intensive care medicine. 2006;32(10):1515–1522. doi: 10.1007/s00134-006-0301-8. [DOI] [PubMed] [Google Scholar]
- 30.Girardis M, Busani S, Damiani E, et al. Effect of conservative vs conventional oxygen therapy on mortality among patients in an intensive care unit: The oxygen-icu randomized clinical trial. JAMA. 2016:E1–E7. doi: 10.1001/jama.2016.11993. [DOI] [PubMed] [Google Scholar]
- 31.Gajic O, Dara SI, Mendez JL, et al. Ventilator-associated lung injury in patients without acute lung injury at the onset of mechanical ventilation. Crit Care Med. 2004;32(9):1817–1824. doi: 10.1097/01.ccm.0000133019.52531.30. [DOI] [PubMed] [Google Scholar]
- 32.Gajic O, Frutos-Vivar F, Esteban A, et al. Ventilator settings as a risk factor for acute respiratory distress syndrome in mechanically ventilated patients. Intensive care medicine. 2005;31(7):922–926. doi: 10.1007/s00134-005-2625-1. [DOI] [PubMed] [Google Scholar]
- 33.Jia X, Malhotra A, Saeed M, et al. Risk factors for ARDS in patients receiving mechanical ventilation for> 48 h*. Chest. 2008;133(4):853–861. doi: 10.1378/chest.07-1121. [DOI] [PMC free article] [PubMed] [Google Scholar]
- 34.Mascia L, Zavala E, Bosma K, et al. High tidal volume is associated with the development of acute lung injury after severe brain injury: An international observational study*. Critical care medicine. 2007;35(8):1815–1820. doi: 10.1097/01.CCM.0000275269.77467.DF. [DOI] [PubMed] [Google Scholar]
- 35.Pasero D, Davi A, Guerriero F, et al. High tidal volume as an independent risk factor for acute lung injury after cardiac surgery. Intensive care medicine. 2008;34(Supplement 1):0398. [Google Scholar]
- 36.Yilmaz M, Keegan M, Iscimen R, et al. Toward the prevention of acute lung injury: Protocol-guided limitation of large tidal volume ventilation and inappropriate transfusion*. Critical care medicine. 2007;35(7):1660–1666. doi: 10.1097/01.CCM.0000269037.66955.F0. [DOI] [PubMed] [Google Scholar]
- 37.Jones AE, Kline JA. Use of goal-directed therapy for severe sepsis and septic shock in academic emergency departments. Critical care medicine. 2005;33(8):1888–1889. doi: 10.1097/01.ccm.0000166872.78449.b1. [DOI] [PubMed] [Google Scholar]
- 38.Needham DM, Colantuoni E, Mendez-Tellez PA, et al. Lung protective mechanical ventilation and two year survival in patients with acute lung injury: prospective cohort study. BMJ. 2012;344 doi: 10.1136/bmj.e2124. [DOI] [PMC free article] [PubMed] [Google Scholar]
- 39.Marini JJ, Vincent J-L, Annane D. Critical care evidence—new directions. JAMA. 2015;313(9):893–894. doi: 10.1001/jama.2014.18484. [DOI] [PubMed] [Google Scholar]
- 40.Gong MN, Ferguson ND. Lung-protective ventilation in acute respiratory distress syndrome. How soon is now? Am J Respir Crit Care Med. 2015;191(2):125–126. doi: 10.1164/rccm.201412-2250ED. [DOI] [PubMed] [Google Scholar]
Associated Data
This section collects any data citations, data availability statements, or supplementary materials included in this article.