Abstract
Background
Coinfection with HIV and hepatitis B virus (HBV) substantially alters the course of HBV. Directly acting anti-HBV agents suppress HBV viral levels; however, the kinetics of HBV decline in mono- and coinfected persons have not been evaluated. We investigated the role of baseline CD4+ T-cell counts as a predictor of HBV response to adefovir (ADV) therapy in chronic HBV with and without HIV coinfection.
Methods
We conducted a double-blind, randomized, placebo-controlled study of HIV-infected (n = 12) and uninfected (n = 5) chronic HBV patients treated with ADV. Five HIV uninfected patients received ADV; the HIV+ patients received ADV or placebo for a total of 48 weeks. At the end of 48 weeks, all patients received open-label ADV for an additional 48 weeks. HBV, HIV viral loads, CD4+ T-cell counts, and safety labs were performed on days 0, 1, 3, 5, 7, 10, 14, and 28 and then every 4 weeks.
Results
Lower HBV slopes were observed among coinfected compared to monoin-fected patients (P = .027 at 4 weeks, P = .019 at 24 weeks, and P = .045 at 48 weeks). Using a mixed model analysis, we found a significant difference between the slopes of the 2 groups at 48 weeks (P = .045). Baseline CD4+ T-cell count was the only independent predictor of HBV decline in all patients.
Conclusion
HIV coinfection is associated with slower HBV response to ADV. Baseline CD4+ T-cell count and not IL28B genotype is an independent predictor of HBV decline in all patients, emphasizing the role of immune status on clearance of HBV.
Keywords: CD4, HBV, HIV, viral kinetics
Globally, about 350 million people are living with chronic hepatitis B (CHB), which remains the leading cause of hepatocellular carcinoma and cirrhosis.1 The population of persons with CHB overlaps significantly with persons infected with human immunodeficiency virus-1 (HIV) due to shared routes of transmission, with an estimate of 2 to 4 million coinfected people.2 Furthermore, although use of antiretroviral therapy (ART) is effective in slowing the progression of HIV, prolonged survival increases the risk of liver-related mortality in persons coinfected with HIV-1 and HBV.3 Studies have also demonstrated that individuals with HIV-1 who are exposed to HBV have a greater risk of developing chronicity, a lower rate of spontaneous HBsAg and HBeAg seroconversion, a higher level of HBV DNA, and only modest responses to antiviral treatment.4 Although nucleoside analogs have been shown to suppress HBV replication in vivo to below the level of detection,5 only interferon-alpha (IFN-α) has been associated with the development of HBV-specific protective immunity.6,7 The differential treatment responses observed between immunomodulatory (IFN) and directly acting (nucleoside analogs) HBV drugs suggest that an immune-mediated mechanism directed toward HBV antigens is essential for the clearance of HBV and the development of protective immunity. Presently, IFN is the only immune-based therapeutic agent available to treat HBV; however, it is associated with significant adverse events and poor toler-ance.5 Treatment with nucleoside analogs is well tolerated, but often results in treatment failure, incomplete suppression, and rebound of HBV DNA associated with emergence of resistance. Therefore, determination of the influence of baseline factors on HBV viral decline is an important step toward the development of better management strategies for HBV infection. In this study, we examined the effect of baseline host factors, CD4+ and CD8+ T cell counts, on HBV viral load (VL) decline with treatment with adefovir dipivoxil (ADV) for lamivudine-resistant HBV-infected patients.
METHODS
Patients
Patients who were enrolled in a prospective double-blind randomized control trial were also invited to participate in this substudy. All participants signed informed consent approved by the National Institute of Allergy and Infectious Disease Institutional Review Board, and the Clinical Trial was registered as NCT00023153 at ClinicalTrials.gov. Most participants were referred from outside clinics and were on lamivudine for more than 3 years. All individuals with HBV infection (mono- or coinfected with HIV) had documented YMDD mutations upon entry to the study. HBV and HIV VL levels were checked on days 0, 1, 3, 5, 7, 10, 14, and 28 and every 4 weeks thereafter by Bayer bDNA 3.0 assays. T-cell counts (CD4+, CD8+), and safety labs were performed at baseline and every month after initiation of treatment. Trough and peak concentration of ADV (Gilead Sciences) in 15 patients (2 HBV+/HIV+ receiving placebo, 5 HBV+/HIV- receiving ADV, and 8 HBV+/HIV+ receiving ADV) were determined longitudinally in a blinded fashion as previously described.8
HBV Genotyping
Serum specimens from each individual patient were used for DNA extraction using a commercially available QIAamp DNA blood mini kit (Qiagen GmbH, Hilden, Germany). HBV DNA was amplified and hybridized with INNO-LiPA HBV DR v2/v3 primers according to the manufacturer’s instructions (Innogenetics).
Sequencing
The sequence and mutational analysis was performed using an AB377 sequencer and a BigDye Terminator V3.1 kit (Applied Biosystems, Foster City, CA, USA).
IL28 Genotyping
IL28B genotyping was conducted in a blinded fashion on DNA specimens collected from each individual, using the 5´ nuclease assay with allele-specific TaqMan probes (ABI TaqMan allelic discrimination kit and the ABI7900HT Sequence Detection System; Applied Biosystems, Carlsbad, CA, USA) according to the manufacturer’s instructions.
Statistical Analysis
This pilot study was carried out to evaluate the kinetics of viral decline (slopes) between the 2 main groups of patients (HBV monoinfected and HIV/HBV coinfected) with chronic hepatitis B, summarizing each patient’s viral decline by a slope over time using the Wilcoxon rank sum test as the primary analysis and a mixed model for supporting analysis. To show that CD4+ T-cell count appears to be most significantly associated with HBV VL decline, we initially fit single line relating slopes to baseline CD4+ T-cell count among coinfected and monoinfected patients followed by computation of residuals. Finally, Wilcoxon rank sum test was used to determine differences between coinfected and monoinfected patients in CD4+ T-cell count-adjusted slopes. This nonparametric approach was used as the primary analysis, because it does not require the assumption of a normal distribution for the data, which would have been impossible to verify with such small sample sizes. Nonetheless, parametric methods such as mixed models have greater power than nonparametric methods if their underlying assumptions are correct, and hence they were used as supportive analyses. A Wilcoxon test was used to analyze whether IL28B haplotypes were associated with HBV VL decline at weeks 4, 24, and 48 of treatment with ADV. We also analyzed the early and delayed HBV decay kinetics on ADV as previously described and their relationship with baseline CD4+ T-cell counts.9
RESULTS
Baseline Characteristics
Demographic characteristics and baseline laboratory profiles of all patients who participated in this study are shown in Tables 1 and 2. The 2 groups of patients were statistically similar on most baseline characteristics such as age, gender, HBV VL, ALT and AST levels, and liver fibrosis stage, but differed on baseline CD4+ T-cell counts (Table 2). At baseline, all patients were HBeAg positive and HBeAb negative with one exception. All patients had been receiving lamivudine for at least 3 years at the time of enrollment, with confirmed mutations in the YMDD motif of HBV DNA polymerase. All patients continued to receive lamivudine throughout the study. Most patients had HBV genotype A.
Table 1.
Baseline characteristics of the chronic hepatitis B virus (HBV) patients by HIV infection status
| HBV+/HIV− | HBV+/HIV+ | |
|---|---|---|
| No. | 5 | 12 |
| Median age, years (IQR) | 40 (36 to 46) | 38.5 (36.75 to 47.25) |
| Gender | Male | Female |
| Race, n | ||
| Asian | 2 | 0 |
| African American | 1 | 1 |
| Caucasian | 2 | 11 |
| Median CD4+, cells/mm3 (IQR) | 816 (773 to 918) | 303 (163 to 576) |
| Median plasma HBV DNA, copies/mL (IQR) | 19E+9 (2.16E+7 to 33.7E+8) | 3.88E+7 (53.9E+5 to 26.5E+8) |
| Median plasma HIV-1 RNA, copies/mL (IQR) | <50 | 1,148 (445 to 1,189) |
Table 2.
| A. Baseline and 48-week relevant clinical characteristics of 17 patients including hepatitis B virus (HBV) genotype and baseline mutations
| ||||||||||
|---|---|---|---|---|---|---|---|---|---|---|
| Patient | Age | Race | HIV | Baseline CD4, % |
HBV VL, copies/mL |
HIV VL, copies/ ml |
Liver fibrosis |
HBV genotype |
No. of mutations |
CODONS present and MT or WT |
| A1 | 40 | White | (+) | 163 (16) | 24,200,000 | <50 | 4 | A | 1 | 80 WT, 173 WT, 180/181 MT/WT, 236 WT |
| A3 | 47 | White | (+) | 309 (39) | 26,500,000,000 | 347 | 4 | A/G | 3 | 80 WT, 173 MT, 180/181 MT/WT, 204 MT, 236 WT |
| A4 | 65 | White | (+) | 238 (33) | 1,240,000,000 | 1556 | 4 | A/G | 3 | 80 WT+MT, 173 WT, 180/181 WT + MT/WT, 204 MT, 236 WT |
| N101 | 40 | White | (−) | 918(34) | 252,000,000 | <50 | 1 | A | 3 | 80 WT, 173 WT+MT, 180/181 MT/WT, 204 MT, 236 WT, 184 WT, 194 WT, 202 WT, 250 WT+MT |
| N102 | 30 | Black | (−) | 652 (36) | 82,000,000,000 | <50 | 3 | A | 3 | 80 WT, 173 MT, 180/181 MT/WT, 204 MT, 236 WT |
| N103 | 46 | Asian | (−) | 1169(37) | 19,000,000,000 | <50 | 3 | A | 3 | 80 WT+MT, 173 WT, 180/181 WT + MT/WT, 204 WT+MT, 236 WT |
| N104 | 17 | Asian | (−) | 816(40) | 33,700,000,000 | <50 | 3 | C | 2 | 80 WT+MT, 173 WT, 204 MT, 236 WT |
| N105 | 71 | White | (−) | 773 (38) | 2,160,000,000 | <50 | 3 | A | 2 | 80 WT, 173 WT, 180/181 MT/WT, 204 MT, 236 WT |
| P1 | 35 | White | (+) | 271 (20) | 7,700,000 | <50 | 1 | A/G | 3 | 80 WT, 173 MT, 180/181 MT/WT, 204 MT, 236 WT |
| P10 | 40 | Black | (+) | 396 (23) | 18,200,000,000 | <50 | 0 | A | 2 | 80 WT, 173 WT, 180/181 MT/WT, 204 MT, 236 WT |
| P2 | 37 | White | (+) | 558 (29) | 3,880,000,000 | <50 | 3 | A | 3 | 80 WT, 173 WT, 180/181 MT/WT, 204 MT, 236 WT |
| P3 | 37 | White | (+) | 979 (25) | 114,000,000,000 | <50 | 3 | A | 3 | 80 WT, 173 WT+MT, 180/181 MT/WT, 204 MT, 236 WT |
| P310 | 48 | White | (+) | 163 (16) | 1,260,000,000 | 739 | 4 | G | 3 | 80 WT, 173 WT+MT, 180/181 MT/WT, 204 MT, 236 WT |
| P4 | 37 | White | (+) | 87(5) | 55,300,000,000 | <50 | 1 | A | 3 | 80 WT, 173 WT+MT, 180/181 MT/WT, 204 MT, 236 WT |
| P5 | 32 | White | (+) | 576 (28) | 86,800,000,000 | 1907 | 3 | A | 3 | 80 WT, 173 WT+MT, 180/181 MT/WT, 204 MT, 236 WT |
| P8 | 57 | White | (+) | 775 (28) | 53,900,000 | 152 | 3 | A | 2 | 80 WT, 173 WT, 180/181 MT/WT, 204 MT, 236 WT |
| P9 | 36 | White | (+) | 852 (32) | 7,300,000,000 | <50 | 3 | A | 2 | 80 WT, 173 WT, 180/181 MT/WT, 204 MT, 236 WT |
| B. Hepatitis B virus serology status of all patients before and after treatment
| |||||||||||||||
|---|---|---|---|---|---|---|---|---|---|---|---|---|---|---|---|
| Base line
|
48 Weeks
|
||||||||||||||
| Patient | HBsAg | HBeAg | antiHBe | antiHBs | antiHBc | ALT | AST | HBeAg seroconversion |
ALT | AST | HBsAg | HBeAg | anti HBe | antiHBs | antiHBc |
| N101 | (+) | (+) | (−) | (+) | (+) | 86 | 182 | No | 27 | 16 | (+) | (+) | (−) | (+) | (+) |
| N102 | (+) | (+) | (−) | (−) | (+) | 175 | 374 | Yes | 35 | 40 | (+) | (−) | (+) | QNS | (+) |
| N103 | (+) | (+) | (−) | (+) | (+) | 175 | 220 | No | 41 | 42 | (+) | (+) | (−) | Grayzone | (+) |
| N104 | (+) | (+) | (−) | (−) | (+) | 36 | 58 | No | 37 | 66 | (+) | (+) | (−) | (−) | (+) |
| N105 | (+) | (+) | (−) | (−) | (+) | 116 | 136 | No | 36 | 34 | (+) | (+) | (−) | (−) | (+) |
| P1 | (+) | (+) | (−) | (−) | (+) | 106 | 255 | No | 40 | 53 | (+) | (+) | (−) | (−) | (+) |
| P2 | (+) | (+) | (−) | (−) | (+) | 94 | 80 | No | 111 | 55 | (+) | (+) | (−) | (−) | (+) |
| P3 | (+) | (+) | (−) | (−) | (+) | 139 | 270 | No | 46 | 54 | (+) | (+) | (−) | (−) | (+) |
| P4 | (+) | (+) | (−) | (−) | (+) | 40 | 83 | No | 49 | 82 | (+) | (+) | (−) | (−) | (+) |
| P5 | (+) | (+) | (−) | (−) | (−) | 134 | 208 | No | 42 | 49 | (+) | (+) | (−) | (−) | (+) |
| P8 | (+) | (+) | (−) | (−) | (+) | 54 | 49 | No | 34 | 35 | (+) | (+) | (−) | (−) | (+) |
| P9 | (+) | (+) | (−) | (−) | (+) | 40 | 56 | No | 45 | 64 | (+) | (+) | (−) | (−) | (+) |
| P10 | (+) | (+) | (−) | (−) | (−) | 54 | 80 | No | 39 | 48 | (+) | (+) | (−) | (−) | (+) |
| P310 | (+) | (+) | (+) | (−) | (+) | 124 | 131 | No | 56 | 33 | (+) | (+) | (+/−) | (−) | (+) |
| A1 | (+) | (+) | (−) | (−) | (+) | 56 | 38 | No | 34 | 20 | (+) | (+) | (−) | (−) | (+) |
| A3 | (+) | (+) | (−) | (−) | (+) | 71 | 66 | No | 99 | 85 | (+) | (+) | (−) | (−) | (+) |
| A4 | (+) | (+) | (−) | (−) | (+) | 51 | 28 | Yes | 80 | 40 | (+) | (+) | (+) | (−) | (−) |
Note: Subject A2 (patient 18) died 24 weeks into the study. MT = mutations; VL = viral load; WT = wild type.
Note: Grayzone = equivocal results; QNS = quantity not sufficient.
HBV monoinfected patients have a faster early HBV VL decline than HIV/HBV coinfected patients
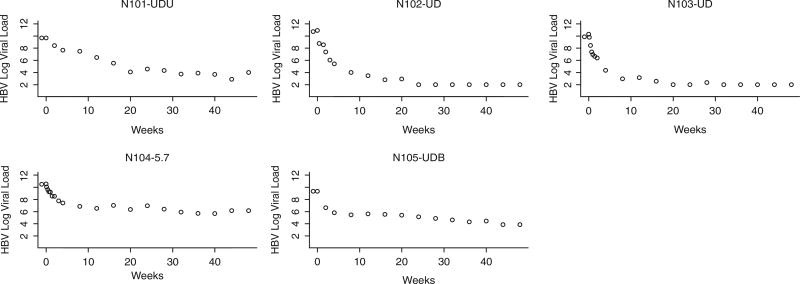
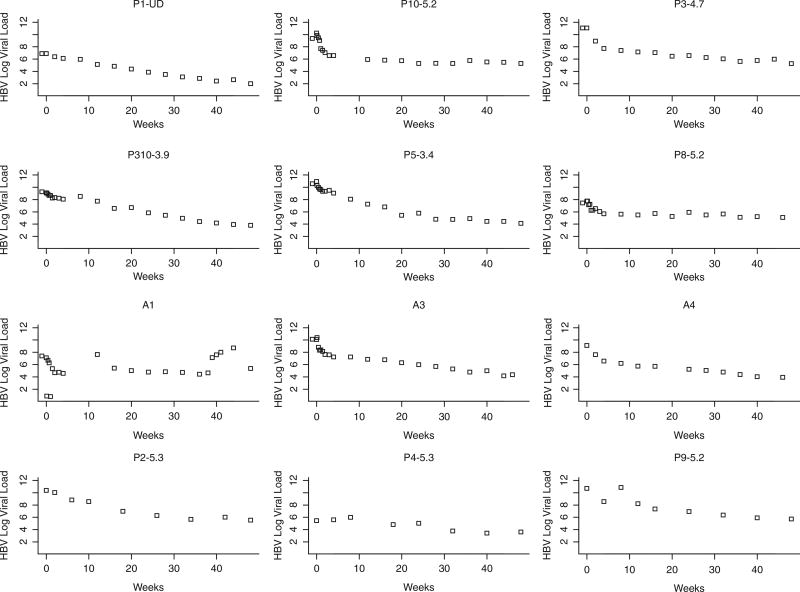
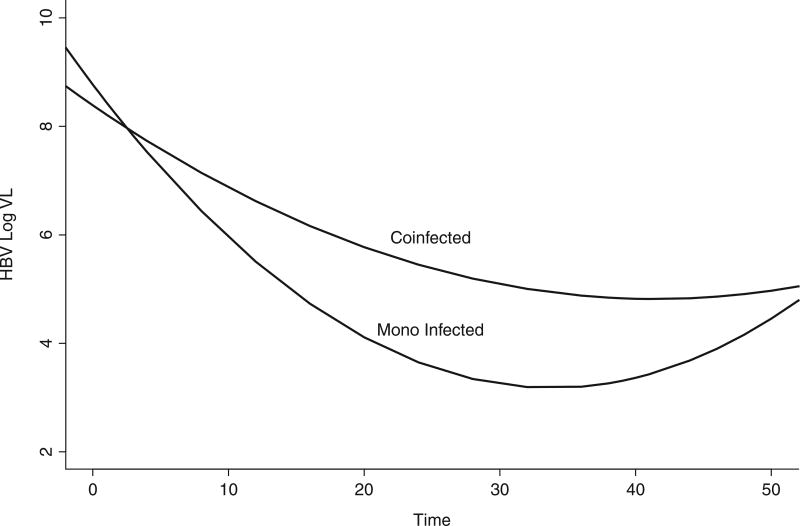
Although HIV+ individuals were well controlled (HIV-1 RNA levels <50 copies or lower than the limit of detection of commercially available assays), the HBV viral decay was clearly faster in the monoinfected individuals than in the HIV/HBV coinfected individuals (Figures 1 and 2, respectively). Statistical analyses confirmed that the slope of viral decay was steeper among HBV monoinfected patients when compared to that of coinfected patients (Figures 1 and 2) over 4 weeks and over 24 weeks (P = .027 and .019, respectively, by Wilcoxon rank sum test). The comparison of slopes over 48 weeks did not reach statistical sig-nificance (P = .082). A mixed model that allowed every single patient to have his/her own slope and intercept was used to test whether the monoin-fected patients had a different mean slope from the coinfected patients (Figure 3). This more sophisticated supportive statistical analysis weights people who have fewer data points less than people with more data points. This mixed model analysis revealed a significant difference between the slopes of mono- and coinfected patients over 48 weeks (P = .045). We then augmented the model by allowing quadratic in addition to linear terms, which allows a curve instead of just a line to be fit to the log VL data over time (Figure 3). The results demonstrate that the pattern of HBV decline over time of the coinfected patients was different than that of the monoinfected patients (P = .001, for comparing these 2 patterns using an approximate chisquare test) (Figure 3). Plasma trough and peak concentration of ADV in mono- and coinfected patients did not differ significantly (Figure 4).
Figure 1.
Hepatitis B virus (HBV) viral decay in 5 HIV-/HBV+ individuals. The figure displays HBV viral load versus time in weeks of treatment. Although there is variation in the slope of the decay, most of it occurs in the first 12 weeks of treatment. With exception of subject 5, a step slope can be clearly seen. The numbers above each graph represent the number at randomization.
Figure 2.
Graphs of the 12 HBV+/HIV+ individuals. Hepatitis B virus (HBV) decay represented by the slope depicts the same trends toward a more rapid/steeper slope in the first 10 to 12 weeks. Subjects 10, 12, 15, and 18 portray similar trends with very linear slope. Subject 2 shows a more erratic trend. The numbers above each graph represent the number at randomization.
Figure 3.
Quadratic and linear terms fit a curve of monoinfected and coinfected subjects’ hepatitis B virus (HBV) decay over time (weeks). The difference between these 2 patterns was statistically significant (P = .001, by approximate chi-square test). VL = viral load.
Figure 4.
Adefovir pharmacokinetics trough (panel A) and peak (panel B) levels of adefovir in plasma. Peak measured after 1 hour of oral dose. BL = baseline; BLQ = below the level of quantification; PLB = placebo.
HBV VL decline is dependent on baseline immune status as determined by the CD4+ T-cell counts
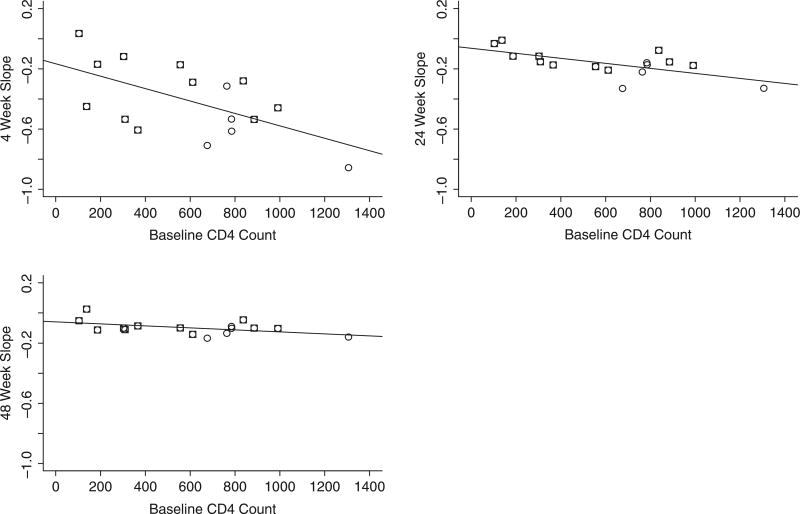
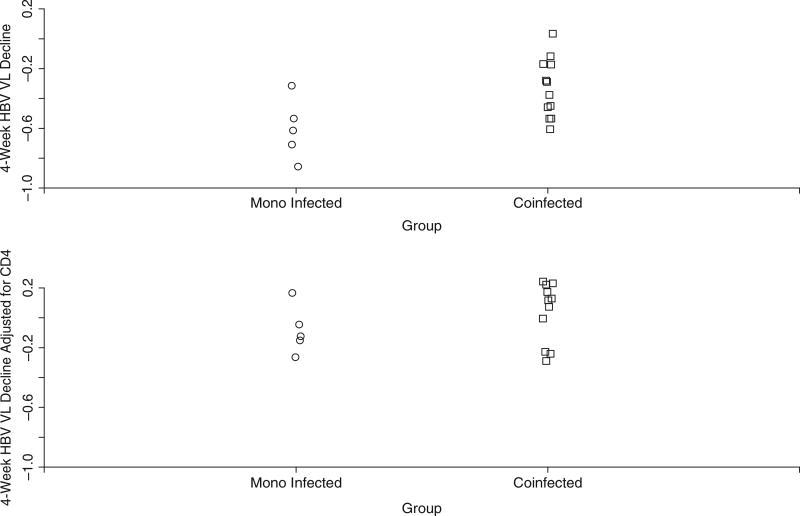
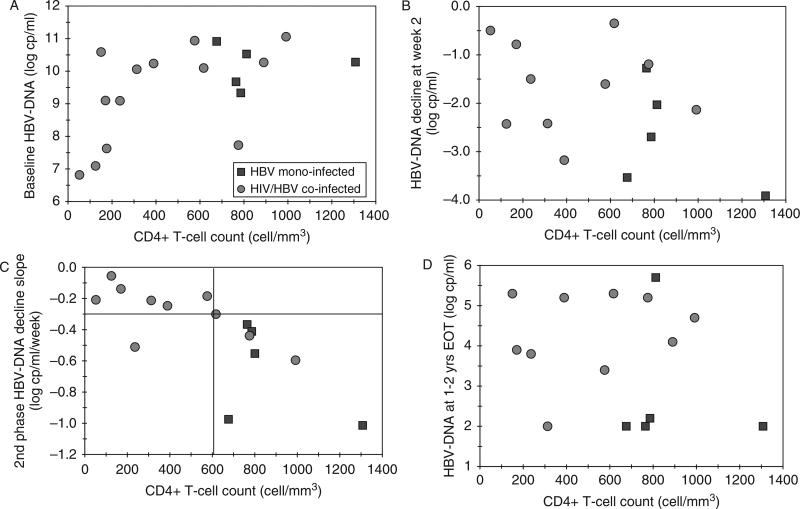
Our earlier analysis demonstrated that the rate of viral decay of HBV was different in HBV monoinfected than in HIV/HBV coinfected individuals, and this difference might be mediated by factors such as baseline CD4+ T-cell count. Baseline CD4+ T-cell count was noted to be higher among HBV monoin-fected patients to a significant degree (P < .05) by the Mann-Whitney U test. CD4+ T-cell count seems to be an independent predictor of HBV decay in plasma. Baseline CD4+ T-cell count was lower in those patients who had a slower HBV viral decay with ADV therapy, which was independent of ADV plasma levels (Figure 4). Figures 5A–C show individual patient slopes of viral decline by baseline CD4+ T-cell count. The fact that a single line appears to fit data from both groups suggests that the difference in viral decline between monoinfected and coinfected patients may be caused by differences in baseline CD4+ T-cell count. Supporting this conclusion is the fact that, although there was a statistically significant difference in HBV VL decline between monoinfected and coinfected patients (Figure 6A), this difference disappeared once we adjusted for baseline CD4+ T-cell count (Figure 6B). When we investigated whether IL28B genotype influenced HBV viral decline, we observed that there were no statistically significant differences in HBV VL declines at every time point we examined in an univariate analysis (Wilcoxon test, P = .09, for week 4). Baseline CD4+ T-cell counts correlated positively with the decline of HBV in all patients (r = 0.8, P < .001), particularly in coinfected patients (r = .65, P < .05) (Figure A1).
Figure 5.
The circles representing monoinfected patients are at the right of the graphs, indicating high CD4+ T-cell counts. Note that patients with higher CD4+ T cell counts had steeper declines in hepatitis B virus (HBV) viral load (P = .016, .006, and .056, for the relationship between CD4+ T-cell count HBV viral decline slope over 4, 24, and 48 weeks, respectively). The squares represent coinfected patients.
Figure 6.
CD4+ T-cell count versus hepatitis B virus (HBV) viral decay in plasma of monoinfected (squares) and coin-fected (circles). The difference in viral decay between monoinfected and coinfected subjects is largely dependent on CD4+ cell counts (top panel), such difference disappears when adjusted by CD4+ T-cell counts (bottom panel).
DISCUSSION
Our results demonstrate that immunodeficiency associated with HIV, as defined by baseline CD4+ T-cell counts, significantly affects HBV viral response to ADV therapy. The underlying mechanisms responsible for lower HBV viral kinetic responses observed in HIV coinfected patients are not due to delayed pharmacokinetic responses, but are due to lower baseline CD4+ T-cell counts. The role of baseline CD4+ T-cell count status on HBV viral response to ADV was apparent even among HBV monoinfected patients, where those with higher CD4+ T-cell counts had a better HBV viro-logic response. These data suggest that baseline CD4+ T-cell count is a major determinant in clearance of HBV with non-immune-mediated therapy using nucleoside analogs.
Several studies have shown that the first phase of HBV decline (1–2 weeks) after initiation of therapy (clearance of circulating HBV DNA) and the second phase of decline of HBV DNA (clearance of HBV from infected hepatocytes) have been correlated to long-term viral suppression.10 In this study, we have demonstrated that high baseline CD4+ T-cell counts are associated with faster HBV decline and lower HBV DNA levels at the end of treatment. More clinically relevant correlations of early HBV viral kinetics would be those with clear end-points, such as HBsAg or HBeAg seroconversion. However, those studies have not yet been performed due to the low rates of seroconversion. Our study demonstrates that early viral kinetics are clinically relevant in predicting long-term HBV DNA suppression in both HBV monoinfected and HIV/HBV coinfected patients. Indeed, HBV treatment responses to ADV were significantly lower among HIV/HBV coinfected patients when compared to those observed with HBV monoinfected patients treated with the same dose and duration of ADV during the first 24 weeks. The exact mechanism for this phenomenon is not understood. An impaired immune status may result in increased HBV replication and mutagenesis influencing therapeutic responses to nucleotide analogs. However, in our study, HBV monoinfected patients had higher baseline HBV VL, suggesting that enhanced HBV replication and mutagenesis are unlikely reasons. The higher VL among HBV monoinfected individuals may have been a direct result of selection bias due to the small sample size. However, this has not influenced the study results, which clearly demonstrate that baseline CD4+ T-cell count and not baseline HBV VL is a better predictor of HBV VL decline in response to ADV in this patient population. These results are consistent with recent studies that have shown that HBV clearance rates of HBsAg-positive and HBeAg-positive HIV-infected patients are decreased compared with persons without HIV infection11 and may be related to the degree of immunosuppression. Furthermore, a recent study demonstrated that HIV-infected men had worse responses to long-term suppressive therapy with nucleos(t)ide analogs, including HBeAg loss in 5 years, compared to the HIV-seronegative men.12 Our study did not show a statistically significant difference in the liver fibrosis staging or peak and trough concentrations of ADV in plasma between HIV/HBV coinfected and HBV monoinfected patients, suggesting that these characteristics do not explain the differences in therapeutic responses observed between the 2 groups.
Conceivably, baseline CD4+ T-cell count may represent overall immune status or could more specifically reflect one’s ability to mount specific immune responses against HBV. Several studies have suggested that long-term suppression of HBV has resulted in reconstitution of HBV-specific immunity in HBV monoinfected but not coinfected patients.13 In this regard, our observations of a clear association between baseline immune status and response to ADV may also explain the lower rates of HBeAg and HBsAg seroconversion observed in HIV/HBV coinfected patients. By comparison in this study, IL28B C/C haplotype, which has been identified as a biomarker for response to treatment in HCV-infected patients, was not associated with ADV treatment response in patients with HBV infection. Likewise genotype of HBV (predominantly of A in this study) and preexisting mutations (2 or more in every subject) did not influence the outcome. Future studies are required to address the influence of baseline immune status on recon-stitution of HBV immunity and HBeAg and HBsAg seroconversion rates. Our study provides another line of evidence that host immune factors are vital in the clearance of HBV and the development of protective immunity. These results provide yet another rationale for treating HIV/HBV coinfected patients with ART earlier than those without HBV to ensure better rates of control for HBV.14,15
We confronted several problems caused by small sample sizes in this study. First, it is challenging to verify assumptions used in parametric analyses, which led us to rely primarily on nonparametric methods. Second, the power to detect differences is low (though this issue would have been more relevant had differences not been found). Nonetheless, alternative statistical analyses led to the same conclusion. In addition, it is difficult to say whether differences between monoinfected and coinfected patients might be explained by other factors, some of which may not have been measured. Although randomized clinical trial data were used, the comparison of interest, monoinfected versus coinfected, was not randomized. Finally, further evaluation of other immunological parameters as well as the results presented here need to be corroborated in a study with larger sample sizes with clinical endpoints such as HBsAg seroconversion. A recent study reported similar HBV viral dynamics in HIV/HBV coinfected individuals in response to treatment with either lamivudine or tenofovir or a combination of both.16 However, there has not been a study that directly compared HBV viral dynamics in HIV/HBV and HBV monoinfected patients simultaneously, which is a major strength of our study.
Acknowledgments
Financial support: This research was supported in part by the Intramural Research Program of the NIH (National Institute of Allergy and Infectious Diseases).
APPENDIX
Figure A1.
Correlation between baseline CD4+ T-cell counts and hepatitis B virus (HBV) DNA decline after initiation of ADV treatment. Data from HIV/HBV coinfected subjects are indicated as circles and data from HBV monoinfected subjects are indicated as squares. (Panel A) Relationship between baseline HBV DNA levels and baseline CD4 T-cell counts. (Panel B) Relationship between HBV DNA decline (0–2 weeks) after initiation of ADV therapy. The early phase of HBV viral decay (0–2 weeks) was faster in the 5 monoinfected individuals (−1.5 to −4.0 log copies/mL), whereas it was variable among the HIV/HBV coinfected (−0.5 to −3.5 log copies/mL). (Panel C) Relationship between HBV DNA decline (after week 2 to week 4) after initiation of ADV therapy. Baseline CD4+ T cell counts correlated positively with slope decline of HBV in all patients (r = 0.8, P < .001), particularly in coinfected patients (r = 0.65, P < .05). Coinfected patients with CD4+ T-cell counts less than 600 cells/mm3 had a much lower HBV viral load decline than those with CD4+ T-cell counts >600 cells/mm3 (P < .04). (Panel D) Relationship between baseline CD4 T-cell counts and HBV DNA levels at 96 weeks. HBV DNA levels at 96 weeks after initiation of therapy were lower in the HBV monoinfected subjects. Subjects with higher baseline CD4 T-cell counts had lower HBV DNA levels regardless of HIV serostatus.
Footnotes
Publisher's Disclaimer: Disclaimer: The content of this publication does not necessarily reflect the views of policies of the Department of Health and Human Services, nor does mention of trade names, commercial products, or organizations imply endorsement by the US Government.
Conflict of interest: None of the authors have any conflicts of interest to report.
References
- 1.Chang MH. Hepatitis B virus and cancer prevention. Recent Results Cancer Res. 2011;188:75–84. doi: 10.1007/978-3-642-10858-7_6. [DOI] [PubMed] [Google Scholar]
- 2.Nikolopoulos GK, Paraskevis D, Hatzitheodorou E, et al. Impact of hepatitis B virus infection on the progression of AIDS and mortality in HIV-infected individuals: A cohort study and meta-analysis. Clin Infect Dis. 2009;48:1763–1771. doi: 10.1086/599110. [DOI] [PubMed] [Google Scholar]
- 3.Konopnicki D, Mocroft A, de Wit S, et al. EuroSIDA Group Hepatitis B and HIV: Prevalence, AIDS progression, response to highly active antiretroviral therapy and increased mortality in the EuroSIDA cohort. AIDS. 2005;19:593–601. doi: 10.1097/01.aids.0000163936.99401.fe. [DOI] [PubMed] [Google Scholar]
- 4.Soriano V, Puoti M, Peters M, Benhamou Y, et al. Care of HIV patients with chronic hepatitis B: Updated recommendations from the HIV-Hepatitis B Virus International Panel. AIDS. 2008;22:1399–1410. doi: 10.1097/QAD.0b013e3282f8b46f. [DOI] [PubMed] [Google Scholar]
- 5.Altfeld M, Rockstroh JK, Addo M, Kupfer B, Pult I, Will H, Spengler U. Reactivation of hepatitis B in a long-term anti-HBs-positive patient with AIDS following lamivudine withdrawal. J Hepatol. 1998;29:306–309. doi: 10.1016/s0168-8278(98)80017-2. [DOI] [PubMed] [Google Scholar]
- 6.Reijnders JG, Perquin MJ, Zhang N, Hansen BE, Janssen HL. Nucleos(t)ide analogues only induce temporary hepatitis B e antigen seroconversion in most patients with chronic hepatitis B. Gastroenterology. 2010;139:491–498. doi: 10.1053/j.gastro.2010.03.059. [DOI] [PubMed] [Google Scholar]
- 7.Marcellin P, Bonino F, Lau GK, et al. Peginterferon alfa-2a in HBeAg-negative Chronic Hepatitis B Study Group Sustained response of hepatitis B e antigen-negative patients 3 years after treatment with peginterferon alpha-2a. Gas-troenterology. 2009;136:2169–2179. doi: 10.1053/j.gastro.2009.03.006. [DOI] [PubMed] [Google Scholar]
- 8.Vela JE, Olson LY, Huang A, Fridland A, Ray AS. Simultaneous quantitation of the nucleotide analog adefovir, its phosphorylated anabolites and 2’-deoxyadenosine triphosphate by ion-pairing LC/MS/MS. J Chromatogr B Analyt Technol Biomed Life Sci. 2007;848:335–433. doi: 10.1016/j.jchromb.2006.10.063. [DOI] [PubMed] [Google Scholar]
- 9.Lau GK, et al. Impact of early viral kinetics on T-cell reactivity during antiviral therapy in chronic hepatitis B. Antivir Ther. 2007;12:705–718. [PubMed] [Google Scholar]
- 10.Lascar RM, Lopes AR, Gilson RJ, et al. Effect of HIV infection and antiretroviral therapy on hepatitis B virus (HBV)-specific T cell responses in patients who have resolved HBV infection. J Infect Dis. 2005;191:1169–1179. doi: 10.1086/428502. [DOI] [PubMed] [Google Scholar]
- 11.Ribeiro RM, Germanidis G, Powers KA, et al. Hepatitis B virus kinetics under antiviral therapy sheds light on differences in hepatitis B e antigen positive and negative infections. J Infect Dis. 2010;202:1309–1318. doi: 10.1086/656528. [DOI] [PMC free article] [PubMed] [Google Scholar]
- 12.Puoti M, Airoldi M, Bruno R, et al. Hepatitis B virus co-infection in human immunodeficiency virus-infected subjects. AIDS Rev. 2002;4:27–35. [PubMed] [Google Scholar]
- 13.Mallet VO, Dhalluin-Venier V, Verkarre V, et al. Reversibility of cirrhosis in HIV/HBV coinfection. Antivir Ther. 2007;12:279–283. [PubMed] [Google Scholar]
- 14.Wang FS, Zhang Z. Host immunity influences disease progression and antiviral efficacy in humans infected with hepatitis B virus. Expert Rev Gastroenterol Hepatol. 2009;3:499–512. doi: 10.1586/egh.09.50. [DOI] [PubMed] [Google Scholar]
- 15.Panel on Antiretroviral Guidelines for Adults and Adolescents. Guidelines for the use of antiretroviral agents in HIV-1–infected adults and adolescents. Department of Health and Human Services; Dec 1, 2009. http://aidsinfo.nih.gov/guidelines. [Google Scholar]
- 16.Lewin SR, Ribeiro RM, Avihingsanon A, et al. Viral dynamics of hepatitis B virus DNA in human immunodeficiency virus-1-hepatitis B virus coinfected individuals: Similar effectiveness of lamivudine, tenofovir, or combination therapy. Hepatology. 2009;49:1113–1121. doi: 10.1002/hep.22754. [DOI] [PMC free article] [PubMed] [Google Scholar]


