

Abstract
Aim
The aim of this trial was to investigate the mechanism of action for body weight loss with semaglutide.
Materials and methods
This randomised, double‐blind, placebo‐controlled, two‐period crossover trial investigated the effects of 12 weeks of treatment with once‐weekly subcutaneous semaglutide, dose‐escalated to 1.0 mg, in 30 subjects with obesity. Ad libitum energy intake, ratings of appetite, thirst, nausea and well‐being, control of eating, food preference, resting metabolic rate, body weight and body composition were assessed.
Results
After a standardised breakfast, semaglutide, compared with placebo, led to a lower ad libitum energy intake during lunch (−1255 kJ; P < .0001) and during the subsequent evening meal (P = .0401) and snacks (P = .0034), resulting in a 24% reduction in total energy intake across all ad libitum meals throughout the day (−3036 kJ; P < .0001). Fasting overall appetite suppression scores were improved with semaglutide vs placebo, while nausea ratings were similar. Semaglutide was associated with less hunger and food cravings, better control of eating and a lower preference for high‐fat foods. Resting metabolic rate, adjusted for lean body mass, did not differ between treatments. Semaglutide led to a reduction from baseline in mean body weight of 5.0 kg, predominantly from body fat mass.
Conclusion
After 12 weeks of treatment, ad libitum energy intake was substantially lower with semaglutide vs placebo with a corresponding loss of body weight observed with semaglutide. In addition to reduced energy intake, likely mechanisms for semaglutide‐induced weight loss included less appetite and food cravings, better control of eating and lower relative preference for fatty, energy‐dense foods.
Keywords: Body composition, Energy regulation, GLP‐1 analogue, Glucagon‐like peptide‐1, Randomised trial, Semaglutide, Type 2 diabetes, Visual analogue scale
1. INTRODUCTION
Glucagon‐like peptide (GLP)‐1, an incretin hormone secreted from the L‐cells in the small intestine, stimulates insulin and inhibits glucagon secretions from the pancreatic islets in a glucose‐dependent fashion, leading to lower blood glucose levels.1, 2 In clinical studies, GLP‐1 has been shown to enhance satiety, reduce hunger and lower energy intake.3, 4 Additionally, research conducted in rats suggests that these effects may be due to GLP‐1 acting directly on receptors in the brain, affecting perceptions of the reward value of food.5
GLP‐1 receptor agonists (RAs) have been shown to reduce body weight and blood glucose levels in people who are overweight or obese, with or without diabetes.6, 7, 8, 9, 10 Furthermore, activation of GLP‐1 receptors in the human brain helps to regulate appetite and food reward.11 Animal studies have shown that a GLP‐1RA, liraglutide, can access specific areas of the brain involved in appetite regulation.11, 12 Combined, these studies indicate a central mechanism for liraglutide‐mediated weight loss due to the direct activation of discrete sites within the hypothalamus.
Semaglutide is a human GLP‐1 analogue currently in development for the treatment of T2D, with a similar structure to liraglutide. Semaglutide has 94% structural homology with native human GLP‐113 with three important modifications: an amino acid substitution at position 8 makes semaglutide less susceptible to degradation by dipeptidyl peptidase‐4; lysine acylation of the peptide backbone with a spacer and C‐18 fatty di‐acid chain at position 26 provides strong, specific binding to albumin; and another amino acid substitution at position 34 prevents C‐18 fatty di‐acid binding at the wrong site.13 These modifications give semaglutide an extended half‐life of approximately one week,13 making it suitable for once‐weekly administration.14, 15 Once‐weekly administration may improve patient compliance and quality of life,16, 17 compared with first‐generation GLP‐1RAs that require once‐/twice‐daily dosing.18 Semaglutide is associated with dose‐dependent reductions in HbA1c and body weight in individuals with diabetes.19 As a GLP‐1RA, the trial of the effect of semaglutide on appetite control may provide additional clarity concerning the role of GLP‐1 receptors in this process.
The primary aim of this trial was to investigate the role of semaglutide compared with placebo on body weight loss in subjects with obesity by evaluating the effect of semaglutide on ad libitum energy intake. In addition, further aspects of homeostatic (ad libitum energy intake after lunch, appetite ratings and energy expenditure) and hedonic (food preference and food cravings) regulation of energy balance were assessed. This trial also evaluated glucose and lipid metabolism, and gastric emptying in the same subjects; these data will be reported elsewhere.
2. MATERIALS AND METHODS
2.1. Trial design
This was a single‐centre, randomised, double‐blind, placebo‐controlled, two‐period crossover trial (NCT02079870, EudraCT number: 2013‐000012‐24) (Figure S1). The trial was conducted in compliance with the International Conference on Harmonisation Good Clinical Practice guidelines20 and the Declaration of Helsinki.21
2.2. Trial population
Eligible subjects were ≥18 years of age, with a body mass index (BMI) of 30 to 45 kg/m2, HbA1c < 6.5% and stable body weight (< 3 kg change during the 3 months prior to screening). Key exclusion criteria were: diagnosis of type 1 or 2 diabetes; history of chronic/idiopathic acute pancreatitis; personal/family history of medullary thyroid carcinoma or multiple endocrine neoplasia syndrome type 2; previous surgical treatment for obesity; smoking or use of any nicotine products; use of any medication that could interfere with trial results; or anticipated change in lifestyle (e.g., eating, exercise or sleeping pattern) during the trial. Written informed consent was obtained from all participants before any trial‐related activities commenced.
2.3. Interventions
The trial consisted of two 12‐week crossover treatment periods, separated by a wash‐out period of 5 to 7 weeks. Eligible subjects were randomised 1:1 to one of two treatment sequences: semaglutide–placebo or placebo–semaglutide. Subjects received either semaglutide (1.34 mg/mL) or matching placebo administered subcutaneously (s.c.) once‐weekly. The starting dose was 0.25 mg (4 weeks), escalating to 0.5 mg (4 weeks) and then 1.0 mg (4 weeks). Subjects received a fifth dose (administered at the clinic) of 1.0 mg at the last visit of each treatment period and assessments were conducted. Subjects attended the clinic for each dose escalation and were reminded, by text message or telephone, to administer the remaining doses at home.
2.4. Endpoints
The primary endpoint was ad libitum energy intake during a lunch meal (5 hours after a standardised breakfast meal) after 12 weeks of treatment. Secondary endpoints included: ad libitum energy intake during a subsequent evening meal and from an evening snack box; total day‐time ad libitum energy intake until midnight; duration of ad libitum lunch; ratings of appetite parameters, thirst, nausea and well‐being before and after a standardised breakfast meal; palatability of ad libitum meals; energy expenditure (resting metabolic rate [RMR] and respiratory quotient [RQ]); control of eating and food cravings over the past week; food preference; body weight; and body composition (fat and fat‐free mass). In addition, the multiple‐dose pharmacokinetics (PK), and safety and tolerability of semaglutide were investigated.
2.5. Assessments
At the end of each 12‐week treatment period, subjects attended an in‐house stay. On Day 1 of their stay, subjects were standardised with regard to meals, physical activity and sleep. The last dose of trial drug was administered in the evening.
On Day 2, a 5‐hour standardised breakfast meal test was performed (macronutrient composition: approximately 30 energy percentage [E%] fat, 15 E% protein, 55 E% carbohydrate); meals were served at ~8:00 am. Following this test, a homogeneous ad libitum lunch was served in excess (Appendix S1) and meal duration was recorded. At ~6:00 pm, subjects were given a self‐served ad libitum evening meal. For both lunch and evening meals, subjects were instructed to eat until pleasantly satiated; food consumption was measured. At ~7:00 pm, subjects received their evening snack box comprised of four food categories (four items of 100 g each: high‐fat and sweet; low‐fat and sweet; high‐fat and non‐sweet; low‐fat and non‐sweet; individualised by preference), which they were allowed to keep until midnight. The consumption of each food category was recorded.
Subjective ratings of appetite parameters (hunger, fullness, satiety, prospective food consumption), thirst, nausea and well‐being were assessed on a 100 mm visual analogue scale (VAS) before and up to 5 hours after the standardised breakfast meal, with the end of each VAS line indicating the most extreme sensation the subject had experienced.22 Overall appetite suppression score was calculated based on the four appetite parameters (Appendix S1).10 Palatability (taste, visual appearance, overall pleasantness) was assessed on a 100 mm VAS after each ad libitum meal.
On Day 3, fasting RMR and RQ were assessed in the morning by indirect calorimetry using a ventilated hood system.23 RMR and RQ were calculated from the volume of oxygen consumed and volume of carbon dioxide produced (Appendix S1). Control of eating and the degree of food cravings were measured using a validated 16‐item short form Control of Eating Questionnaire (COEQ),24, 25 which included questions related to food cravings, control of eating, hunger and fullness. Based on the previous 7 days, subjects were asked to rate 15 questions on a 100 mm VAS. One question was open‐ended.
As well as measuring preferential energy intake from the evening snack box by food categories on Day 2, food preference was assessed in the fasted state at ~8:00 am on Day 3. The Leeds Food Preference Task (LFPT)26, 27 measures components of food preference and reward (explicit liking and implicit wanting). Validation of this method has been described previously.28, 29, 30 Subjects were presented with pictures of food items common in the diet from the same four categories as were included in the evening snack box (Figure S2). The array was either predominantly high (>50 E%) or low (<20 E%) in fat, and sweet or non‐sweet (savoury) in taste, with similar familiarity and palatability. To measure explicit liking, randomised food images were presented individually, and subjects rated the extent to which they liked each food (i.e., how pleasant would it be to taste this food now?) using a 100 mm VAS (Figure S3A). Implicit wanting and relative preference were assessed using a forced choice methodology. Images of each of the four food categories were paired to every other category in 96 combinations. Subjects were instructed to respond as quickly and as accurately as they could to indicate their preference at that time (i.e., which food do you most want to eat now?). For implicit wanting (Figure S3B), reaction times for all responses were covertly recorded and mean response times for each food category (adjusted for frequency of selection) were calculated. A positive rating indicated an immediate response to a given food category, and a negative rating indicated the opposite. The frequency‐weighted algorithm was used to account for both selection and non‐selection, which positively or negatively contributed to the rating, respectively.
Body composition was measured in a fasted state using air displacement plethysmography (Bodpod®, Concord, USA), which has been validated for both normal‐weight adults31 and obese adults.32 Body weight was measured prior to subjects entering the Bodpod and data were automatically transferred into the system. Body composition (including percentage body fat)33 was determined via density measurements (Appendix S1).
PK endpoints (trough values) were assessed for semaglutide in steady state after 4, 8 and 12 weeks of treatment. Additionally, PK endpoints derived from the concentration‐time curves (0‐168 hours) at semaglutide 1.0 mg steady state were assessed after the last dose. Safety assessments included adverse events (AEs), hypoglycaemic events and blood pressure.
2.6. Statistical analysis
Based on a previous trial,10 30 subjects were needed to provide a power of 80% to detect a treatment difference in energy intake of 500 kJ at a significance level of 5%, assuming a dropout rate of about 15%. The primary endpoint was analysed in a linear mixed model on original outcome values, including treatment and period as fixed effects and subject as a random effect. Statistical analysis of the primary endpoint was performed for the full analysis set (FAS; all randomised subjects who were exposed to ≥1 dose of trial product). Energy intake, duration of ad libitum lunch and COEQ endpoints were analysed as per the primary endpoint. The ad libitum evening snack box energy intake also included interaction between treatments, with high‐/low‐fat and sweet/non‐sweet food categories as fixed effects. Furthermore, treatment differences were estimated for the two food categories of high‐fat combined and the two categories of low‐fat combined, using a linear mixed model. Treatment period, and interactions between treatments and high‐/low‐fat food categories were fixed effects; subject was a random effect. A similar approach was used for sweet/non‐sweet food categories. Endpoints for the LFPT28 were analysed in a statistical model similar to that used for energy intake of the evening snack box with the same four food categories. Body weight, body composition and palatability assessments of the ad libitum lunch, evening meal and evening snack box were summarised descriptively. For VAS profiles of appetite, thirst, nausea and well‐being, the fasting rating and mean postprandial increase in rating were analysed as per the main analysis of the primary endpoint. For the mean postprandial increase in ratings, the fasting ratings were added as a covariate. Palatability was analysed post‐hoc using a linear mixed model; treatment and treatment period were fixed effects; subject was a random effect. Treatment difference in RMR was estimated post hoc using a linear mixed model; treatment, treatment period and subject were fixed effects. Treatment difference in RQ was similarly estimated. Treatment difference in RMR was also estimated with lean body mass as a covariate. All statistical analyses were two‐sided and on a 5% significance level. The primary endpoint was controlled for type 1 error. Other analyses were not controlled for multiplicity.
3. RESULTS
3.1. Trial population
Thirty subjects were randomised to once‐weekly semaglutide or placebo, and 28 completed both treatment periods of the trial. Two female subjects took contraceptives during both treatment periods. Two subjects withdrew during treatment period 1 while receiving semaglutide due to gastrointestinal (GI) AEs. Baseline characteristics are shown in Table S1. Mean age, body weight and BMI were 42 years, 101.3 kg and 33.8 kg/m2, respectively. Two‐thirds of subjects were male.
3.2. Ad libitum energy intake and macronutrient composition
Ad libitum energy intake at lunch was approximately 35% lower with semaglutide vs placebo (primary endpoint; estimated treatment difference (ETD) [95% confidence interval (CI)], −1255 kJ [−1707; −804]; P < .0001) (Figure 1A). In addition, ad libitum food intake and meal duration were significantly lower with semaglutide vs placebo (Table 1). Lower ad libitum energy and food intake were also observed at subsequent evening meals and the evening snacks (Figure 1A and Table 1). Total energy intake across all ad libitum meals was approximately 24% lower with semaglutide vs placebo (ETD [95% CI] −3036 kJ [−4209; −1864]; P < .0001) (Figure 1A). Energy intake of food categories in the ad libitum evening snack box showed an approximately 35% lower intake from high‐fat and non‐sweet foods with semaglutide vs placebo (P = .0184) (Figure 1B). Macronutrient compositions of foods consumed in the ad libitum evening meal and evening snack box were similar between treatments.
Figure 1.
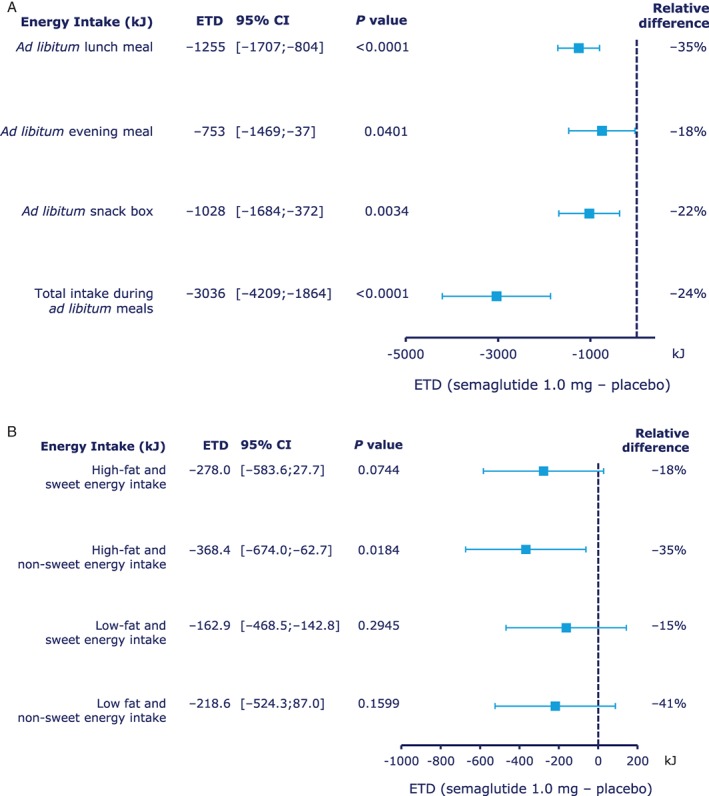
Energy intake during A, ad libitum meals and B, ad libitum snack box, by food group. Abbreviations: CI, confidence interval; ETD, estimated treatment difference. Relative difference: ETD / estimated mean for placebo × 100%.
Table 1.
Energy and food intake during ad libitum meals and duration of ad libitum lunch
| FAS | N | Estimated mean [95% CI] | ETD1 [95% CI] | P value | |
|---|---|---|---|---|---|
| Ad libitum lunch | |||||
| Energy intake (kJ) | |||||
| Placebo | 28 | 28 | 3634 [3132; 4136] | ||
| Semaglutide 1.0 mg | 30 | 28 | 2378 [1876; 2881] | −1255 [−1707; −804] | P < .0001 |
| Food intake (g) | |||||
| Placebo | 28 | 28 | 645 [556; 735] | ||
| Semaglutide 1.0 mg | 30 | 28 | 424 [334; 514] | −221 [−301; −142] | P < .0001 |
| Duration (min) | |||||
| Placebo | 28 | 28 | 12.2 [10.5; 13.9] | ||
| Semaglutide 1.0 mg | 30 | 28 | 10.7 [9.0; 12.4] | −1.5 [−2.4; −0.6] | P = .0018 |
| Ad libitum evening meal | |||||
| Energy intake (kJ) | |||||
| Placebo | 28 | 28 | 4214 [3618; 4809] | ||
| Semaglutide 1.0 mg | 30 | 28 | 3461 [2865; 4057] | −753 [−1469; −36.6] | P = .0401 |
| Food intake (g) | |||||
| Placebo | 28 | 28 | 557 [481; 634] | ||
| Semaglutide 1.0 mg | 30 | 28 | 446 [369; 522] | −112 [−201; −22.3] | P = .0164 |
| Ad libitum evening snack box | |||||
| Energy intake (kJ) | |||||
| Placebo | 28 | 28 | 4573 [3967; 5178] | ||
| Semaglutide 1.0 mg | 30 | 28 | 3545 [2939; 4150] | −1028 [−1684; −372] | P = .0034 |
| Food intake (g) | |||||
| Placebo | 28 | 28 | 257 [223; 290] | ||
| Semaglutide 1.0 mg | 30 | 28 | 200 [166; 233] | −57.3 [−94.0; −20.6] | P = .0035 |
| Total intake during ad libitum meals | |||||
| Energy intake (kJ) | |||||
| Placebo | 28 | 28 | 12421 [11214; 13627] | ||
| Semaglutide 1.0 mg | 30 | 28 | 9384 [8178; 10591] | −3036 [−4209; −1864] | P < .0001 |
| Food intake (g) | |||||
| Placebo | 28 | 28 | 1459 [1315; 1604] | ||
| Semaglutide 1.0 mg | 30 | 28 | 1069 [925; 1213] | −391 [−505; −276] | P < .0001 |
Abbreviation: FAS, full analysis set.
Semaglutide 1.0 mg – placebo.
3.3. Appetite, thirst, nausea and well‐being
At the standardised breakfast meal, the fasting overall appetite suppression score was higher with semaglutide vs placebo, indicating less appetite with semaglutide (P = .0023). Overall appetite suppression scores remained higher at all time‐points with semaglutide, with the difference increasing towards the end of the 5‐hour postprandial period (Figure 2A). In general, VAS ratings of individual appetite parameters indicated less appetite with semaglutide vs placebo (Figure 2B and C). Ratings for thirst, nausea and well‐being were similar between treatments (Figure 2C).
Figure 2.
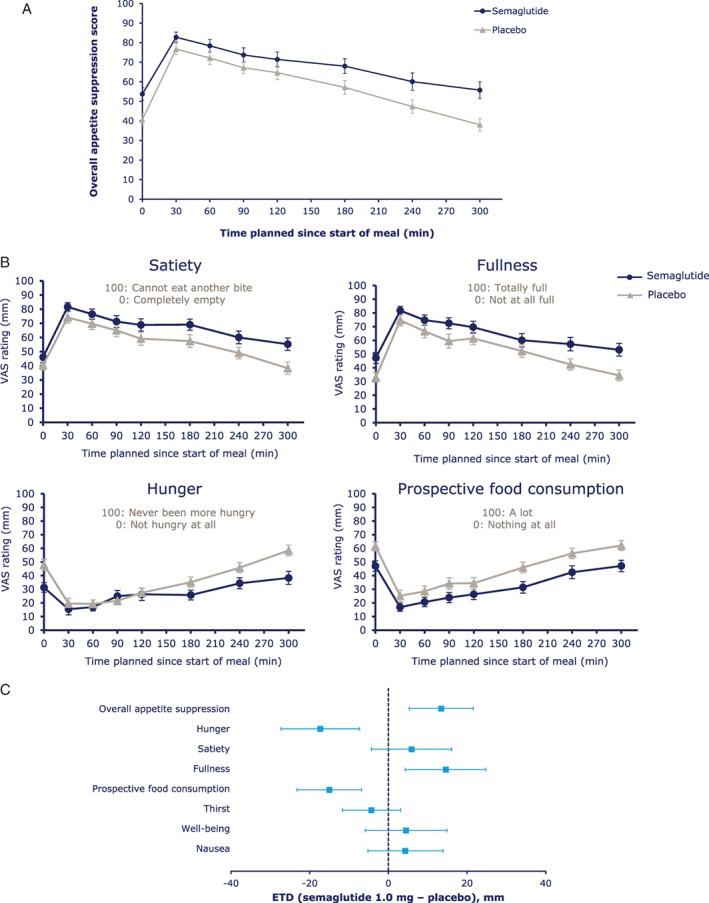
A, Overall appetite suppression score during the standardised breakfast; B, visual analogue scale (VAS) ratings of appetite during a standardised breakfast and C, fasting VAS ratings. Abbreviations: CI, confidence interval; ETD, estimated treatment difference. Overall appetite suppression score = (satiety + fullness + [100 − hunger] + [100 − prospective food consumption]) / 4. 100 indicates less appetite; 0 indicates more appetite. Error bars represent 95% CI.
Postprandial increases from fasting VAS ratings showed greater increases in satiety with semaglutide vs placebo; however, differences in the overall incremental appetite suppression score were not significant (Figure S4). Postprandial increases from fasting ratings in nausea, thirst and well‐being were comparable between treatments.
3.4. Palatability
Palatability ratings were similar between treatments for both ad libitum lunch and evening meal, except for taste of the ad libitum lunch (ETD [95% CI] −8.5 mm [−16.5; −0.4]; P = .0398) and visual appearance of the ad libitum evening meal (ETD [95% CI] −7.4 mm [−14.6; −0.2]; P = .0432). Mean ratings of all parameters were above 50 mm for all meals regardless of treatment.
3.5. Energy expenditure
RMR was lower following 12 weeks of treatment with semaglutide vs placebo (ETD −602 kJ/24h [−959; −245]; P = .0019), while there was no significant difference in RQ (ETD −0.03 [−0.06; 0.00]; P = .0698). When adjusted for lean body mass, the difference in RMR was not significant between treatments (ETD RMR, −508 kJ/24 h [−1061; 46], P = .0704).
3.6. Control of eating and food cravings
The COEQ indicated less hunger, better control of eating and meal portion size, less food cravings, particularly for savoury foods, and lower ratings for the pleasantness of food for semaglutide vs placebo (Figure 3).
Figure 3.
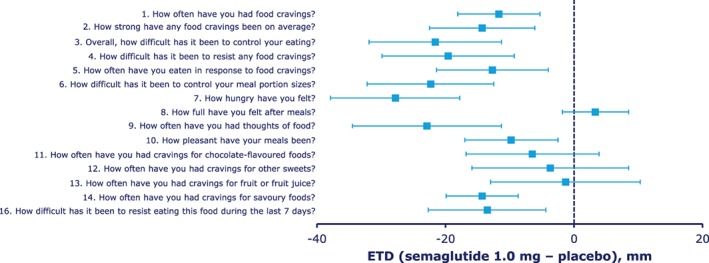
Results of the Control of Eating Questionnaire (COEQ). Abbreviations: CI, confidence interval; ETD, estimated treatment difference. Results for the open‐ended question “Which one food makes it difficult for you to control eating?” (question 15) not shown. Error bars represent 95% CI.
3.7. Food preference
LFPT indicated lower explicit liking for high‐fat and non‐sweet foods with semaglutide vs placebo (P = .0016). Differences between treatments in explicit liking for other food categories were not significant. Ratings of implicit wanting were lower for high‐fat and non‐sweet foods (P = .0203) and higher for low‐fat and sweet foods (P = .0401) with semaglutide vs placebo (Table S2).
3.8. Body weight and body composition
After 12 weeks of treatment with semaglutide, a change from baseline in mean body weight of −5.0 kg was observed, vs +1.0 kg with placebo. A three‐fold greater loss of mean fat over lean body mass was observed with semaglutide vs placebo (Figure 4).
Figure 4.
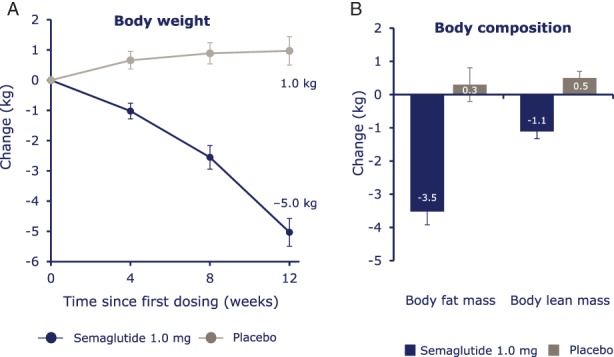
A, Absolute mean body weight change and B, estimated mean change in body composition. Body weight and body composition were measured on distinct days. Error bars represent standard error of the mean.
3.9. PK endpoints
The PK profile for semaglutide was as expected, supporting compliance with the treatment regimen during the trial (mean [coefficient of variation (CV)] AUC0‐168h: 4467 [17.7] nmol × h/L; Cmax: 32.0 [19.1] nmol/L; tmax: 33.2 [59.8] hours). Mean trough values (CV) for individual semaglutide dosages were: 0.25 mg, 4.64 (32.5) nmol/L; 0.5 mg, 10.25 (23.3) nmol/L; 1.0 mg, 19.73 (21.9) nmol/L.
3.10. Safety
AEs were reported more frequently with semaglutide vs placebo. All AEs were mild or moderate in severity; no serious AEs were reported. The most common AEs were GI events. Two AEs led to withdrawal from the trial during semaglutide treatment. No severe or blood glucose‐confirmed symptomatic hypoglycaemic events were reported. Observed systolic and diastolic blood pressure were stable throughout the trial for subjects receiving either treatment; at week 12, observed mean changes from baseline were within 2 mm Hg.
4. DISCUSSION
This trial investigated the mechanism of body weight loss with semaglutide in subjects with obesity. The results suggest that the significantly lower energy intake provides a plausible mechanism to explain the decrease in body weight associated with semaglutide treatment. Not only was energy intake during ad libitum lunch (primary endpoint) substantially lower with semaglutide vs placebo (approximately −35%), the same pattern also held true for subsequent ad libitum evening meal and evening snack box, demonstrating no compensatory effect due to a reduced lunch intake earlier in the day. Total ad libitum energy intake across all meals on the test day was reduced by 24%. A reduction in body weight of approximately 5.0 kg over 12 weeks was observed with semaglutide, consistent with previous findings.19 Energy expenditure appeared to be lower with semaglutide vs placebo, though not statistically significant after correcting for lean body mass, suggesting that semaglutide‐associated weight loss was not attributable to increased energy expenditure.
Given recent findings regarding the association between energy intake and changes in weight,34, 35 it is not possible to ascertain to what degree reductions in energy intake led to the 5.0 kg loss of body weight. Since RMR did not increase with semaglutide, it can be inferred that the whole of the body weight loss was most likely caused by a reduction in energy intake. However, RMR represents only one dimension of energy expenditure and the impact of semaglutide on the thermogenic effect or physical activity is unknown.
It should be noted that the reduction in energy intake was observed during/after body weight loss, despite known counter‐regulatory effects during a period with an energy deficit.36 In terms of body composition, a three‐fold greater reduction in body fat vs lean body mass was observed with semaglutide, indicating no unintentional excess loss of lean body mass.
The effect on energy intake is consistent with previous data from non‐clinical37 and clinical studies with other GLP‐1RAs,38, 39 as well as studies with native GLP‐1,3 with the reduction in energy intake correlating with reduction in body weight.3, 38, 39 However, the effects with semaglutide appear to be greater than those of other GLP‐1RAs, consistent with larger weight reductions observed in larger semaglutide trials of longer duration;40 however, caution is required when drawing an indirect comparison between trials.
Furthermore, by accessing specific areas of the brain relevant for appetite regulation, GLP‐1RAs (e.g., liraglutide) may mediate weight loss via direct activation of discrete sites within the hypothalamus.11 This may help explain how treatment with semaglutide led to reduced appetite and food cravings, and better control of eating. The COEQ, which assessed control of eating and food cravings, demonstrated less hunger, better control of eating and less food cravings, particularly for savoury foods, compared with placebo. These effects probably reflect both direct and indirect effects of semaglutide treatment on body weight and fat mass. The LFPT, which assessed food reward (explicit liking and implicit wanting), showed a relatively lower liking and wanting of high‐fat, non‐sweet foods compared with placebo, consistent with results of the COEQ. The LFPT results also corroborated actual ad libitum energy intake from the same food categories of the evening snack box, suggesting that the lower intake of fatty, energy‐dense food may be the result of semaglutide‐mediated reduction in preference for such foods.
Semaglutide treatment was not associated with significant changes in nausea vs placebo, either in the fasted state or postprandially. Mean palatability ratings of all meals were above 50 mm for both treatments, meaning that meals were generally well liked.
Combined, these results suggest that the lower energy intake and body weight loss with semaglutide was a general effect on both homeostatic and hedonic systems of appetite control, rather than a response caused by nausea or food aversion.
Overall, semaglutide was well tolerated. No new safety concerns were identified, in line with other GLP‐1RAs and longer‐term semaglutide trials.6, 7, 40
By having subjects act as their own control, the crossover design of this trial can be considered a major strength of our overall findings. With regard to changes in weight and body composition, however, this trial could be conversely limited by the crossover design. During the wash‐out period, body weight in subjects receiving semaglutide likely had recovered before crossing over to placebo, but may not have had sufficient time to reach pre‐treatment levels; which might have contributed to the small weight gain observed with placebo.
In conclusion, data after 12 weeks of treatment indicate that semaglutide‐induced weight loss is probably caused by the reduced energy intake associated with reductions in appetite, and is not the result of increased energy expenditure. Other mechanisms include improvements in the control of eating, fewer food cravings and a lower relative preference for fatty, energy‐dense foods. Furthermore, semaglutide‐induced weight loss was associated with proportionally greater losses of body fat than lean body mass.
Supporting information
Appendix S1. Assessments and methods.
Figure S1. Study design.
Figure S2. Typical food array used in the Leeds Food Preference Task (LFPT).
Figure S3. Representative question for the Leeds Food Preference Task (LFPT) for assessment of A, explicit liking and B, implicit wanting.
Figure S4. Postprandial increase from fasting visual analogue scale (VAS) ratings.
Table S1. Baseline characteristics.
Table S2. Food preference Leeds Food Preference Task (LFPT).
ACKNOWLEDGEMENTS
We thank Haydn Liang PhD, and Madeleine Nowak, MSc (both from AXON Communications) for medical writing and editorial assistance.
Conflict of interest
JB and CG received research grants from Novo Nordisk for the current study. JB received personal fees from Novo Nordisk, outside the submitted work. GF declares no relevant conflict of interest. MBA, AF, TK, and JH are employees of Novo Nordisk. MBA, AF, and TK are shareholders of Novo Nordisk.
Author contributions
JB, AF, CG, and JH contributed to the study design; CG, MBA, and JH contributed to the collection or handling of data; all authors contributed to the analysis or interpretation of data; literature searches were conducted by JB and JH; JB, GF, MBA, AF, CG, and JH contributed to the writing, reviewing, and editing of the manuscript.
Blundell J, Finlayson G, Axelsen M, et al. Effects of once‐weekly semaglutide on appetite, energy intake, control of eating, food preference and body weight in subjects with obesity. Diabetes Obes Metab. 2017;19:1242–1251. https://doi.org/10.1111/dom.12932
Funding information This study was funded by Novo Nordisk A/S, Søborg, Denmark.
[Correction added on 25th July 2017, after first online publication: The funding information was previously incorrect and has been amended in this version]
REFERENCES
- 1. Kieffer TJ, Habener JF. The glucagon‐like peptides. Endocr Rev. 1999;20:876‐913. [DOI] [PubMed] [Google Scholar]
- 2. Donath MY, Burcelin R. GLP‐1 effects on islets: hormonal, neuronal, or paracrine? Diabetes Care. 2013;36(suppl 2):S145‐S148. [DOI] [PMC free article] [PubMed] [Google Scholar]
- 3. Flint A, Raben A, Astrup A, Holst JJ. Glucagon‐like peptide 1 promotes satiety and suppresses energy intake in humans. J Clin Invest. 1998;101:515‐520. [DOI] [PMC free article] [PubMed] [Google Scholar]
- 4. Gutzwiller JP, Drewe J, Goke B, et al. Glucagon‐like peptide‐1 promotes satiety and reduces food intake in patients with diabetes mellitus type 2. Am J Physiol. 1999;276:R1541‐R1544. [DOI] [PubMed] [Google Scholar]
- 5. Dickson SL, Shirazi RH, Hansson C, Bergquist F, Nissbrandt H, Skibicka KP. The glucagon‐like peptide 1 (GLP‐1) analogue, exendin‐4, decreases the rewarding value of food: a new role for mesolimbic GLP‐1 receptors. J Neurosci. 2012;32:4812‐4820. [DOI] [PMC free article] [PubMed] [Google Scholar]
- 6. Nauck M, Frid A, Hermansen K, et al. Efficacy and safety comparison of liraglutide, glimepiride, and placebo, all in combination with metformin, in type 2 diabetes: the LEAD (liraglutide effect and action in diabetes)‐2 study. Diabetes Care. 2009;32:84‐90. [DOI] [PMC free article] [PubMed] [Google Scholar]
- 7. Marre M, Shaw J, Brandle M, et al. Liraglutide, a once‐daily human GLP‐1 analogue, added to a sulphonylurea over 26 weeks produces greater improvements in glycaemic and weight control compared with adding rosiglitazone or placebo in subjects with Type 2 diabetes (LEAD‐1 SU). Diabet Med. 2009;26:268‐278. [DOI] [PMC free article] [PubMed] [Google Scholar]
- 8. Van Gaal L, Scheen A. Weight management in type 2 diabetes: current and emerging approaches to treatment. Diabetes Care. 2015;38:1161‐1172. [DOI] [PubMed] [Google Scholar]
- 9. Pi‐Sunyer X, Astrup A, Fujioka K, et al. A randomized, controlled trial of 3.0 mg of liraglutide in weight management. N Engl J Med. 2015;373:11‐22. [DOI] [PubMed] [Google Scholar]
- 10. van Can J, Sloth B, Jensen CB, Flint A, Blaak EE, Saris WH. Effects of the once‐daily GLP‐1 analog liraglutide on gastric emptying, glycemic parameters, appetite and energy metabolism in obese, non‐diabetic adults. Int J Obes (Lond). 2014;38:784‐793. [DOI] [PMC free article] [PubMed] [Google Scholar]
- 11. van Bloemendaal L, IJzerman RG, Ten Kulve JS, et al. GLP‐1 receptor activation modulates appetite‐ and reward‐related brain areas in humans. Diabetes. 2014;63:4186‐4196. [DOI] [PubMed] [Google Scholar]
- 12. Sisley S, Gutierrez‐Aguilar R, Scott M, D'Alessio DA, Sandoval DA, Seeley RJ. Neuronal GLP1R mediates liraglutide's anorectic but not glucose‐lowering effect. J Clin Invest. 2014;124:2456‐2463. [DOI] [PMC free article] [PubMed] [Google Scholar]
- 13. Lau J, Bloch P, Schaffer L, et al. Discovery of the once‐weekly glucagon‐like peptide‐1 (GLP‐1) analogue semaglutide. J Med Chem. 2015;58:7370‐7380. [DOI] [PubMed] [Google Scholar]
- 14. Kapitza C, Nosek L, Jensen L, Hartvig H, Jensen CB, Flint A. Semaglutide, a once‐weekly human GLP‐1 analog, does not reduce the bioavailability of the combined oral contraceptive, ethinylestradiol/levonorgestrel. J Clin Pharmacol. 2015;55:497‐504. [DOI] [PMC free article] [PubMed] [Google Scholar]
- 15. Marbury T, Flint A, Segel S, Lindegaard M, Lasseter K. Pharmacokinetics and tolerability of a single dose of semaglutide, a once‐weekly human GLP‐1 analogue, in subjects with and without renal impairment. Diabetologia. 2014;57(suppl 1):S358. [Google Scholar]
- 16. Saini SD, Schoenfeld P, Kaulback K, Dubinsky MC. Effect of medication dosing frequency on adherence in chronic diseases. Am J Manag Care. 2009;15:e22‐e33. [PubMed] [Google Scholar]
- 17. Polonsky WH, Fisher L, Hessler D, Bruhn D, Best JH. Patient perspectives on once‐weekly medications for diabetes. Diabetes Obes Metab. 2011;13:144‐149. [DOI] [PubMed] [Google Scholar]
- 18. Madsbad S, Kielgast U, Asmar M, Deacon CF, Torekov SS, Holst JJ. An overview of once‐weekly glucagon‐like peptide‐1 receptor agonists–available efficacy and safety data and perspectives for the future. Diabetes Obes Metab. 2011;13:394‐407. [DOI] [PubMed] [Google Scholar]
- 19. Nauck MA, Petrie JR, Sesti G, et al. A phase 2, randomized, dose‐finding study of the novel once‐weekly human GLP‐1 analog, semaglutide, compared with placebo and open‐label liraglutide in patients with type 2 diabetes. Diabetes Care. 2016;39:231‐241. [DOI] [PubMed] [Google Scholar]
- 20. European Agency for the Evaluation of Medicinal Products . International Conference on Harmonisation‐World Health Organization Guideline for Good Clinical Practice [EMEA Web site] ICH Harmonised tripartite guideline good clinical practice . http://www.ema.europa.eu/docs/en_GB/document_library/Scientific_guideline/2009/09/WC500002874.pdf. Accessed January 11, 2016.
- 21. World Medical Association . Declaration of Helsinki ethical principles for medical research involving human subjects. 52nd WMA General Assembly; October 2000; Edinburgh, Scotland: Last amended with Note of Clarification on Paragraph 29 by the WMA General Assembly; Washington, 2002; and Note of Clarification on Paragraph 30 by the WMA General Assembly; Tokyo, 2004. http://www.wma.net/en/30publications/10policies/b3/index.html.pdf. Accessed January 14, 2016. [Google Scholar]
- 22. Flint A, Raben A, Blundell JE, Astrup A. Reproducibility, power and validity of visual analogue scales in assessment of appetite sensations in single test meal studies. Int J Obes Relat Metab Disord. 2000;24:38‐48. [DOI] [PubMed] [Google Scholar]
- 23. Nicholson MJ, Holton J, Bradley AP, Beatty PC, Campbell IT. The performance of a variable‐flow indirect calorimeter. Physiol Meas. 1996;17:43‐55. [DOI] [PubMed] [Google Scholar]
- 24. Hill AJ, Weaver CF, Blundell JE. Food craving, dietary restraint and mood. Appetite. 1991;17:187‐197. [DOI] [PubMed] [Google Scholar]
- 25. Dalton M, Finlayson G, Hill A, Blundell J. Preliminary validation and principal components analysis of the Control of Eating Questionnaire (CoEQ) for the experience of food craving. Eur J Clin Nutr. 2015;69:1313‐1317. [DOI] [PubMed] [Google Scholar]
- 26. Finlayson G, King N, Blundell J. The role of implicit wanting in relation to explicit liking and wanting for food: implications for appetite control. Appetite. 2008;50:120‐127. [DOI] [PubMed] [Google Scholar]
- 27. Finlayson G, Bordes I, Griffioen‐Roose S, de Graaf C, Blundell JE. Susceptibility to overeating affects the impact of savory or sweet drinks on satiation, reward, and food intake in nonobese women. J Nutr. 2012;142:125‐130. [DOI] [PubMed] [Google Scholar]
- 28. Finlayson G, Arlotti A, Dalton M, King N, Blundell JE. Implicit wanting and explicit liking are markers for trait binge eating. A susceptible phenotype for overeating. Appetite. 2011;57:722‐728. [DOI] [PubMed] [Google Scholar]
- 29. Verschoor E, Finlayson G, Blundell J, Markus CR, King NA. Effects of an acute alpha‐lactalbumin manipulation on mood and food hedonics in high‐ and low‐trait anxiety individuals. Br J Nutr. 2010;104:595‐602. [DOI] [PubMed] [Google Scholar]
- 30. Griffioen‐Roose S, Finlayson G, Mars M, Blundell JE, de Graaf C. Measuring food reward and the transfer effect of sensory specific satiety. Appetite. 2010;55:648‐655. [DOI] [PubMed] [Google Scholar]
- 31. Fields DA, Goran MI, McCrory MA. Body‐composition assessment via air‐displacement plethysmography in adults and children: a review. Am J Clin Nutr. 2002;75:453‐467. [DOI] [PubMed] [Google Scholar]
- 32. Ginde SR, Geliebter A, Rubiano F, et al. Air displacement plethysmography: validation in overweight and obese subjects. Obes Res. 2005;13:1232‐1237. [DOI] [PubMed] [Google Scholar]
- 33. Siri W. Body composition from fluid space and density In: Brozek J, Hanschel A, eds. Techniques for Measuring Body Composition. Washington, DC: National Academy of Science; 1961;223‐224. [Google Scholar]
- 34. Hall KD, Sacks G, Chandramohan D, et al. Quantification of the effect of energy imbalance on bodyweight. Lancet. 2011;378:826‐837. [DOI] [PMC free article] [PubMed] [Google Scholar]
- 35. Thomas DM, Martin CK, Lettieri S, et al. Can a weight loss of one pound a week be achieved with a 3500‐kcal deficit? Commentary on a commonly accepted rule. Int J Obes (Lond). 2013;37:1611‐1613. [DOI] [PMC free article] [PubMed] [Google Scholar]
- 36. Sumithran P, Prendergast LA, Delbridge E, et al. Long‐term persistence of hormonal adaptations to weight loss. N Engl J Med. 2011;365:1597‐1604. [DOI] [PubMed] [Google Scholar]
- 37. Rolin B, Larsen MO, Christoffersen BO, Lau J, Knudsen LB. In vivo effect of semaglutide in pigs supports its potential as a long‐acting GLP‐1 analogue for once‐weekly dosing. Diabetes. 2015;64(suppl 1):1119. [Google Scholar]
- 38. Edwards CM, Stanley SA, Davis R, et al. Exendin‐4 reduces fasting and postprandial glucose and decreases energy intake in healthy volunteers. Am J Physiol Endocrinol Metab. 2001;281:E155‐E161. [DOI] [PubMed] [Google Scholar]
- 39. Horowitz M, Flint A, Jones KL, et al. Effect of the once‐daily human GLP‐1 analogue liraglutide on appetite, energy intake, energy expenditure and gastric emptying in type 2 diabetes. Diabetes Res Clin Pract. 2012;97:258‐266. [DOI] [PubMed] [Google Scholar]
- 40. Marso SP, Bain SC, Consoli A, et al. Semaglutide and cardiovascular outcomes in patients with type 2 diabetes. N Engl J Med. 2016;375:1834‐44. [DOI] [PubMed] [Google Scholar]
Associated Data
This section collects any data citations, data availability statements, or supplementary materials included in this article.
Supplementary Materials
Appendix S1. Assessments and methods.
Figure S1. Study design.
Figure S2. Typical food array used in the Leeds Food Preference Task (LFPT).
Figure S3. Representative question for the Leeds Food Preference Task (LFPT) for assessment of A, explicit liking and B, implicit wanting.
Figure S4. Postprandial increase from fasting visual analogue scale (VAS) ratings.
Table S1. Baseline characteristics.
Table S2. Food preference Leeds Food Preference Task (LFPT).