

Abstract
Objective
While tocilizumab (TCZ) is known to increase low‐density lipoprotein (LDL) cholesterol levels, it is unclear whether TCZ increases cardiovascular risk in patients with rheumatoid arthritis (RA). This study was undertaken to compare the cardiovascular risk associated with receiving TCZ versus tumor necrosis factor inhibitors (TNFi).
Methods
To examine comparative cardiovascular safety, we conducted a cohort study of RA patients who newly started TCZ or TNFi using claims data from Medicare, IMS PharMetrics, and MarketScan. All patients were required to have previously used a different TNFi, abatacept, or tofacitinib. The primary outcome measure was a composite cardiovascular end point of hospitalization for myocardial infarction or stroke. TCZ initiators were propensity score matched to TNFi initiators with a variable ratio of 1:3 within each database, controlling for >65 baseline characteristics. A fixed‐effects model combined database‐specific hazard ratios (HRs).
Results
We included 9,218 TCZ initiators propensity score matched to 18,810 TNFi initiators across all 3 databases. The mean age was 72 years in Medicare, 51 in PharMetrics, and 53 in MarketScan. Cardiovascular disease was present at baseline in 14.3% of TCZ initiators and 13.5% of TNFi initiators. During the study period (mean ± SD 0.9 ± 0.7 years; maximum 4.5 years), 125 composite cardiovascular events occurred, resulting in an incidence rate of 0.52 per 100 person‐years for TCZ initiators and 0.59 per 100 person‐years for TNFi initiators. The risk of cardiovascular events associated with TCZ use versus TNFi use was similar across all 3 databases, with a combined HR of 0.84 (95% confidence interval 0.56–1.26).
Conclusion
This multi‐database population‐based cohort study showed no evidence of an increased cardiovascular risk among RA patients who switched from a different biologic drug or tofacitinib to TCZ versus to a TNFi.
Epidemiologic studies of patients with rheumatoid arthritis (RA) have shown a 1.5–2.0 times increased risk of cardiovascular morbidity and mortality 1, 2. This excess cardiovascular risk is thought to be the result of not only traditional cardiovascular risk factors but also RA severity or active systemic inflammation 3, 4. The 2015 American College of Rheumatology guidelines for the treatment of RA recommend a treat‐to‐target strategy to better control disease activity in both early and established RA 5. Use of tumor necrosis factor inhibitors (TNFi) or other biologic agents is recommended for patients who have moderate‐to‐high disease activity while taking a traditional disease‐modifying antirheumatic drug (DMARD) 5. Over the past decade, a number of studies have suggested potential cardiovascular benefits of using DMARDs in patients with RA 6. In particular, a number of cohort studies showed that treatment with TNFi may be associated with a decreased cardiovascular risk, probably related to a reduction in systemic inflammation 7, 8, 9, although some studies did not find a beneficial effect on cardiovascular risk in patients receiving TNFi compared with patients receiving DMARDs 10, 11.
Tocilizumab (TCZ), an interleukin‐6 receptor antagonist, is an effective biologic agent that reduces inflammatory disease activity in RA. In several clinical trials in humans, elevations in serum lipid levels were noted among subjects receiving TCZ 12, 13, 14. In a head‐to‐head randomized controlled trial (RCT) of TCZ monotherapy versus adalimumab monotherapy in 325 patients with RA, TCZ was superior to adalimumab for the reduction of signs and symptoms of RA, but more patients in the TCZ group had increased low‐density lipoprotein (LDL) cholesterol levels than in the adalimumab group 15, 16. Post hoc analyses of clinical trials and extension studies of TCZ suggest that RA disease activity, but not changes in lipid levels during treatment, may be independently associated with cardiovascular risk in RA patients treated with TCZ 17. Nonetheless, whether increases in lipid levels with TCZ treatment compared with treatment with other biologic agents leads to an excess cardiovascular risk has not been determined, although the ENTRACTE trial (ClinicalTrials.gov identifier: NCT01331837), a postmarketing open‐label RCT that has just been completed, focused on evaluating the risk of cardiovascular events with TCZ versus etanercept in RA patients with elevated cardiovascular risk at baseline.
The main objective of this study was to compare the risk of cardiovascular events, including myocardial infarction (MI) and stroke, in patients who newly started TCZ versus those who newly started TNFi in a multi‐database population‐based cohort of RA patients. The secondary aim was to compare the risk of other cardiovascular events, such as coronary revascularization, acute coronary syndrome (ACS), heart failure, and all‐cause deaths, in TCZ initiators compared with TNFi initiators.
PATIENTS AND METHODS
Data sources
We conducted a cohort study using data from 3 large US health care claims databases: Medicare (Parts A/B/D 2010–2013), IMS PharMetrics Plus (2011–2014), and Truven MarketScan (2011–June 2015). Medicare is a federally funded program and provides health care coverage for nearly all legal residents of the US age 65 and older and some disabled patients younger than 65. Briefly, Medicare Part A is generally for inpatient care, Part B for outpatient medical services including some drugs given in a physician's office or clinic, and Part D for outpatient prescription drug coverage 18. The PharMetrics and MarketScan databases contain longitudinal medical and pharmacy claims from a number of different managed care plans and are representative of a national commercially insured population in the US 10, 19, 20. All 3 databases include data from all 50 US states. The Institutional Review Board of the Brigham and Women's Hospital approved the study protocol and privacy precautions. The study protocol is registered at www.encepp.eu (EUPAS11327).
Study cohort and design
Adults age 18 years or older with at least 2 outpatient visits 7–365 days apart, or 1 inpatient visit, coded with the International Classification of Diseases, Ninth Revision, Clinical Modification (ICD‐9‐CM) code 714.x for RA were identified. Of these RA patients, we defined 2 mutually exclusive groups of biologic DMARD initiators, TCZ initiators and TNFi initiators, based on either Healthcare Common Procedure Coding System codes or National Drug Codes. Because TCZ is largely used as a second‐line biologic agent for RA, we required patients in both groups to have previously used at least 1 other biologic agent (i.e., TNFi or abatacept) or targeted synthetic DMARD (i.e., tofacitinib). The cohort entry date (i.e., index date) was defined as the date of starting TCZ or TNFi after ≥365 days of continuous enrollment in the health plan to ensure that we identified study patients with a complete claims history for medical services and prescription dispensing in order to identify new users and control for baseline confounding appropriately. New users of TCZ were defined as those who had not received TCZ within the last 12 months. TNFi initiators had not received a specific TNFi within the last 12 months (Figure 1). At the index date, all of the patients included in this study were required to have had at least 1 inpatient or 2 outpatient visits for RA and at least 2 prescriptions filled for a biologic DMARD or tofacitinib (one for the prior biologic DMARD or tofacitinib and the other for TCZ or TNFi). A previous study showed that RA patients can be accurately identified using a combination of diagnosis codes for RA and any DMARD prescriptions in claims data with a positive predictive value of >86% 21.
Figure 1.

Study design overview. Patients with rheumatoid arthritis (RA) who had not received tocilizumab (TCZ) or tumor necrosis factor inhibitors (TNFi) in the previous 365 days were enrolled in the TCZ cohort or TNFi cohort, respectively. The index date was defined as the date of first TCZ dispensing or the date of switching to a new TNFi after being treated with at least 1 other biologic drug (i.e., abatacept, TNFi, or tofacitinib). Dx = diagnosis; Rx = prescription.
We excluded nursing home residents, patients with HIV/AIDS, patients with malignancy other than nonmelanoma skin cancer, and those who had end‐stage renal disease or had undergone dialysis or renal transplant prior to the index date. Patients who received rituximab were excluded to minimize confounding by indication and misclassification bias since rituximab is often given to patients with malignancy. We further excluded patients with hospitalizations for MI, stroke, ACS, or heart failure in the 90 days prior to the index date.
For the primary as‐treated analysis, follow‐up time started the day after the index date and ended on the day of treatment discontinuation plus 30 days, outcome occurrence, disenrollment, death, or the end of study period, whichever occurred first. For the secondary intent‐to‐treat (ITT 365‐day) analysis, follow‐up time ended on the 365th day of follow‐up, outcome occurrence, disenrollment, death, or the end of study period, whichever occurred first. Patients were only allowed to enter the study cohort once.
Outcome definition
The primary outcome measure was a composite cardiovascular end point of MI and stroke. MI was identified with a hospital discharge diagnosis code of acute MI (ICD‐9 code 410.x excluding 410.x2) in the primary or secondary position. The length of hospitalization for MI was required to be 3–180 days, unless the patient died during the first 3 days of hospitalization 22. Stroke was defined with a hospital discharge diagnosis code of ischemic or hemorrhagic stroke (ICD‐9‐CM 430, 431, 433.x1, 434.x1, and 436) in the principal position. These claims‐based algorithms have been validated and found to have a positive predictive value of >92% 22, 23, 24. The secondary definition of the composite cardiovascular event was based on a hospital discharge diagnosis code of MI in the primary or secondary position for any length of hospitalization or a hospital discharge diagnosis code of ischemic or hemorrhagic stroke in the primary position. This definition also had a positive predictive value of >92% 22.
Other secondary outcomes were the individual cardiovascular end points of MI and stroke, coronary revascularization, hospitalization for ACS, any cardiovascular events including MI, stroke, coronary revascularization, or ACS, and hospitalization for heart failure and all‐cause mortality.
Covariate assessment
During the 12‐month baseline period, we measured >90 predefined variables potentially related to RA severity or activity or development of cardiovascular events in each database. We assessed the cohort entry year, demographic characteristics, regions, comorbid conditions, use of other prescription drugs, and markers of health care utilization intensity. To assess RA‐related covariates for confounding control, we determined patients' history of DMARD use during all available days before the cohort entry date, including both the 365 days prior to the index date and any other available days prior to the pre‐index 365 days. While we did not have information on RA duration or disease activity, we used the previously validated claims‐based index for RA severity 25. We also calculated the combined Comorbidity Score that included 47 conditions 26. Physician orders of outpatient laboratory tests (Table 1 and Supplementary Table 1, available on the Arthritis & Rheumatology web site at http://onlinelibrary.wiley.com/doi/10.1002/art.40084/abstract) were included because these laboratory tests may be selectively ordered depending on patients' risk factors corresponding to current practice patterns and treatment guidelines 27.
Table 1.
Selected characteristics of the RA patients in the 365 days before study entrya
|
Medicare (n = 7,397) |
PharMetrics (n = 8,119) |
MarketScan (n = 12,512) |
||||
|---|---|---|---|---|---|---|
|
TCZ (n = 2,531) |
TNFi (n = 4,866) |
TCZ (n = 2,614) |
TNFi (n = 5,505) |
TCZ (n = 4,073) |
TNFi (n = 8,439) |
|
| Demographic characteristics | ||||||
| Age, mean ± SD years | 72.2 ± 6.2 | 72.0 ± 6.1 | 51.3 ± 11.9 | 51.0 ± 11.5 | 53.2 ± 12.5 | 52.7 ± 12.4 |
| Male | 15.4 | 15.3 | 18.3 | 18.9 | 16.8 | 18.1 |
| Comorbidities | ||||||
| Atrial fibrillation | 10.3 | 9.8 | 2.1 | 1.8 | 2.7 | 2.3 |
| Myocardial infarction | 1.7 | 1.6 | 0.3 | 0.5 | 0.5 | 0.5 |
| Acute/subacute CAD | 5.9 | 5.8 | 1.5 | 1.6 | 1.9 | 1.8 |
| Chronic CAD | 8.3 | 8.3 | 1.4 | 1.5 | 1.3 | 1.1 |
| Atherosclerosis | 24.5 | 24.4 | 6.0 | 5.9 | 6.9 | 6.4 |
| Heart failure | 11.2 | 11.2 | 1.8 | 1.9 | 2.6 | 2.0 |
| Stroke | 3.4 | 3.2 | 1.1 | 0.8 | 0.9 | 0.9 |
| TIA | 3.2 | 2.7 | 1.0 | 0.9 | 1.0 | 0.9 |
| Peripheral vascular disease | 11.2 | 11.8 | 2.1 | 2.1 | 2.5 | 2.4 |
| Hypertension | 83.9 | 83.5 | 50.3 | 49.3 | 47.7 | 46.1 |
| Diabetes | 30.2 | 31.0 | 14.2 | 13.9 | 16.0 | 15.0 |
| Hyperlipidemia | 67.2 | 65.5 | 36.0 | 34.6 | 34.2 | 32.6 |
| Chronic kidney disease | 12.9 | 12.6 | 3.8 | 3.8 | 4.2 | 3.9 |
| Comorbidity Index, mean ± SD | 1.3 ± 2.0 | 1.3 ± 2.0 | 0.4 ± 1.2 | 0.4 ± 1.2 | 0.4 ± 1.2 | 0.4 ± 1.2 |
| CIRAS, mean ± SD | 5.9 ± 1.3 | 5.8 ± 1.3 | 6.7 ± 1.7 | 6.6 ± 1.7 | 6.5 ± 1.9 | 6.5 ± 1.8 |
| RA‐related treatment | ||||||
| No. of prior DMARDs | ||||||
| 1 | 25.8 | 30.9 | 20.1 | 24.3 | 26.6 | 30.8 |
| 2 | 35.8 | 36.7 | 27.7 | 31.9 | 31.6 | 35.1 |
| ≥3 | 38.4 | 32.4 | 52.1 | 43.8 | 41.8 | 34.1 |
| Methotrexate, any use† | 72.1 | 71.6 | 73.1 | 72.9 | 66.2 | 67.2 |
| Steroids, any use† | 74.2 | 72.4 | 71.9 | 71.0 | 67.5 | 67.1 |
| Steroids, recent use‡ | 32.5 | 32.0 | 33.3 | 32.4 | 30.5 | 29.7 |
| NSAIDs | 34.3 | 34.9 | 39.9 | 40.7 | 39.7 | 40.9 |
| COX‐2 inhibitors | 9.7 | 10.2 | 10.2 | 10.1 | 9.3 | 9.2 |
| Opioids | 74.8 | 73.4 | 67.6 | 66.6 | 66.3 | 66.9 |
| Other medications | ||||||
| Nitrates | 6.5 | 6.4 | 1.8 | 1.6 | 2.1 | 2.1 |
| Statins | 45.1 | 44.3 | 21.0 | 20.0 | 22.4 | 22.6 |
| Non‐statin lipid‐lowering drugs | 7.7 | 7.8 | 4.0 | 4.3 | 4.6 | 4.8 |
| Insulin | 6.4 | 6.3 | 3.6 | 3.4 | 4.2 | 3.9 |
| Beta blockers | 39.2 | 38.4 | 16.5 | 15.9 | 18.2 | 18.0 |
| Calcium channel blockers | 28.1 | 28.1 | 10.3 | 10.5 | 12.4 | 12.2 |
| Health care utilization, mean ± SD | ||||||
| No. of lipid tests ordered | 1.5 ± 1.3 | 1.4 ± 1.4 | 1.1 ± 1.4 | 0.9 ± 1.6 | 1.0 ± 1.7 | 0.8 ± 1.6 |
| No. of PCP visits | 5.0 ± 5.1 | 5.0 ± 5.0 | 2.9 ± 5.9 | 2.9 ± 7.6 | 3.1 ± 6.4 | 3.0 ± 5.6 |
| No. of cardiology visits | 0.8 ± 1.8 | 0.8 ± 1.9 | 0.6 ± 1.8 | 0.6 ± 2.0 | 0.7 ± 2.2 | 0.6 ± 2.1 |
| No. of ED visits | 0.6 ± 1.1 | 0.6 ± 1.2 | 0.6 ± 1.2 | 0.6 ± 1.5 | 0.3 ± 1.5 | 0.2 ± 1.6 |
The tocilizumab (TCZ) and tumor necrosis factor inhibitor (TNFi) cohorts were propensity score matched with a 1:3 variable ratio. Except where indicated otherwise, values are the percent of patients. RA = rheumatoid arthritis; CAD = coronary artery disease; TIA = transient ischemic attack; CIRAS = claims‐based index for RA severity; DMARDs = disease‐modifying antirheumatic drugs; NSAIDs = nonsteroidal antiinflammatory drugs; COX‐2 = cyclooxygenase 2; PCP = primary care physician; ED = emergency department.
Any time before the cohort entry date.
In the 30 days before the cohort entry date.
Statistical analysis
For each database, we compared the baseline characteristics of the patients in the TCZ and TNFi groups. To control for >65 potential confounders, including demographics (age, sex, region, race/ethnicity [only available in the Medicare data]), prior DMARD use, cardiovascular comorbidities, other chronic diseases, cardiovascular medications, other long‐term medications, and markers of health care utilization intensity, we used propensity score matching within each database 28. The propensity score was defined as the predicted probability of a patient starting TCZ versus a TNFi given patient characteristics at baseline. For each data set, we estimated the propensity score using multivariable logistic regression that included all of the aforementioned covariates (Table 1) and the cohort entry calendar year. In order to increase study power, we implemented sequential propensity score matching with a variable ratio of up to 1:3 based on a matching caliper of 0.02 on the propensity score scale 29, 30. The propensity score balance achieved within each database was inspected by tabulating all patient characteristics by treatment status and by examining the standardized differences 30, 31.
After propensity score matching, we estimated incidence rates (IRs) of the primary and secondary outcomes in the TCZ group compared with the TNFi group separately in each database. Kaplan‐Meier plots were used to inspect proportionality of hazards, and the follow‐up time between treatment groups was compared in each database. Cox proportional hazards models conditioning on the matching set were fitted to estimate hazard ratios (HRs) and 95% confidence intervals (95% CIs) 32, 33. HRs from the 3 propensity score–matched cohorts were then combined using an inverse variance‐weighted, fixed‐effects model. We also conducted a further analysis to correct variance for potential overlaps in person‐time between the 2 commercial cohorts by 10% or 20% 34.
Protocol‐specified subgroup analyses were performed by age group (i.e., younger than 60 years or 60 years or older), the presence of preexisting cardiovascular disease or diabetes, and concomitant use of methotrexate. In addition, we conducted subgroup analysis according to baseline use of oral steroids and statins. Within each of these subgroups, TCZ and TNFi initiators were propensity score–matched with a variable ratio of 1:3. All analyses, reports, and audit trails were conducted using the Aetion platform including R version 2.1.2. The Medicare data were additionally analyzed with SAS version 9.4, yielding the same results.
RESULTS
Cohort selection
There were 88,375 RA patients who started either TCZ or a TNFi with prior use of biologic agents or targeted synthetic DMARDs in the study databases. After applying exclusion criteria, our study cohort included a total of 40,119 RA patients starting either TCZ (n = 9,917) or TNFi (n = 30,202). After performing propensity score matching with a variable ratio of 1:3, the final cohort comprised a total of 28,028 RA patients, including 9,218 TCZ and 18,810 TNFi initiators (Figure 2). On average, each TCZ initiator was matched to 2 TNFi initiators across the 3 databases.
Figure 2.

Selection of the study cohort. After the inclusion and exclusion criteria were applied, the study cohort included a total of 40,119 patients with rheumatoid arthritis (RA) who started treatment with tocilizumab (TCZ) or a tumor necrosis factor inhibitor (TNFi), including 9,146 from the Medicare database, 12,826 from the PharMetrics database, and 18,147 from the MarketScan database. After propensity score (PS) matching with a variable ratio of up to 1:3, the final cohort consisted of 28,028 patients, including 9,218 TCZ initiators and 18,810 TNFi initiators. Dx = diagnosis.
Patient characteristics
Table 1 shows selected baseline characteristics of the propensity score–matched cohorts in each database. As expected with the difference in the demographic characteristics of enrollees in Medicare versus the commercial health plans, the mean ± SD age was 72 ± 6 years in the Medicare database versus 51 ± 11 years in the PharMetrics database and 53 ± 12 years in the MarketScan database. Similarly, cardiovascular comorbidities were more common in patients enrolled in Medicare than in those enrolled in the commercial health plans. For example, 2% of TCZ or TNFi initiators in the Medicare database had a history of MI at baseline, whereas <1% of TCZ or TNFi initiators in the PharMetrics or MarketScan databases did. Within each database, all of the baseline covariates were well‐balanced between TCZ and TNFi initiators, with a standardized difference of <10% 30. At baseline, 14.3% of TCZ initiators and 13.5% of TNFi initiators had cardiovascular disease.
Baseline characteristics of the study cohort for each database before propensity score matching are presented in Supplementary Table 2, available on the Arthritis & Rheumatology web site at http://onlinelibrary.wiley.com/doi/10.1002/art.40084/abstract. In general, even before propensity score matching, the 2 groups, TCZ and TNFi initiators, were similar with regard to cardiovascular comorbidities, comorbidity index, medication use, and health care utilization patterns. TCZ initiators used a greater number of prior DMARDs and more steroids and opioids at baseline compared with TNFi initiators. Statin use at baseline was also greater in TCZ initiators versus TNFi initiators in the Medicare and PharMetrics databases.
Cardiovascular risk associated with TCZ
During a mean ± SD followup of 0.9 ± 0.7 years and a maximum observational period of 4.5 years for the primary as‐treated analysis, in the 1:3 variable ratio propensity score–matched cohort, a total of 125 composite cardiovascular events of MI or stroke (36 in TCZ initiators and 89 in TNFi initiators) were recorded in the 3 databases (Table 2). The overall IR of composite cardiovascular events was 0.52 per 100 person‐years in the TCZ group and 0.59 per 100 person‐years in the TNFi group. The database‐specific IR ranged from 0.3 per 100 person‐years (MarketScan) to 0.9 per 100 person‐years (Medicare) in the TCZ group and 0.3 per 100 person‐years (MarketScan) to 1.3 per 100 person‐years (Medicare) in the TNFi group. In general, the IR was 2–3 times higher in the older Medicare population compared with the population in the PharMetrics or MarketScan databases.
Table 2.
IRs and HRs of cardiovascular events in RA patients treated with TCZ versus those treated with TNFia
| TCZ | TNFi | |||||||||
|---|---|---|---|---|---|---|---|---|---|---|
| No. of subjects | No. of events | Person‐years | IR (95% CI)† | HR (95% CI) | No. of subjects | No. of events | Person‐years | IR (95% CI)† | HR | |
| As‐treated analysis | ||||||||||
| Composite cardiovascular events | ||||||||||
| Medicare | 2,531 | 17 | 1,841 |
0.92 (0.56–1.44) |
0.70 (0.40–1.24) |
4,866 | 50 | 3,954 |
1.27 (0.95–1.65) |
1.0 |
| PharMetrics | 2,614 | 10 | 2,061 |
0.49 (0.25–0.86) |
1.00 (0.45–2.22) |
5,505 | 20 | 4,465 |
0.45 (0.28–0.68) |
1.0 |
| MarketScan | 4,073 | 9 | 2,999 |
0.30 (0.15–0.55) |
1.03 (0.46–2.34) |
8,439 | 19 | 6,726 |
0.28 (0.18–‐0.43) |
1.0 |
| Combined | 9,218 | 36 | 6,901 |
0.52 (0.37–0.71) |
0.84 (0.56–1.26)‡ |
18,810 | 89 | 15,145 |
0.59 (0.47–0.72) |
1.0 |
| MI requiring hospitalization ≥3 days§ | ||||||||||
| Medicare | 2,531 | NR | NR | NR |
0.64 (0.25–1.65) |
4,866 | 20 | 3,965 |
0.50 (0.32–0.77) |
1.0 |
| PharMetrics | 2,614 | 3 | 2,063 |
0.15 (0.04–0.40) |
0.74 (0.19–2.89) |
5,505 | 9 | 4,472 |
0.20 (0.10–0.37) |
1.0 |
| MarketScan | 4,073 | 4 | 3,001 |
0.13 (0.04–0.32) |
0.77 (0.24–2.44) |
8,439 | 12 | 6,729 |
0.18 (0.10–0.30) |
1.0 |
| Combined | 9,218 | NR | NR | NR |
0.70 (0.37–1.34)‡ |
18,810 | 41 | 15,166 |
0.27 (0.20–0.36) |
1.0 |
| Stroke | ||||||||||
| Medicare | 2,531 | 11 | 1,843 |
0.60 (0.31–1.04) |
0.74 (0.36–1.51) |
4,866 | 30 | 3,964 |
0.76 (0.52–1.07) |
1.0 |
| PharMetrics | 2,614 | 7 | 2,062 |
0.34 (0.15–0.67) |
1.18 (0.43–3.22) |
5,505 | 11 | 4,468 |
0.25 (0.13–‐0.43) |
1.0 |
| MarketScan | 4,073 | 5 | 3,001 |
0.17 (0.06–0.37) |
1.33 (0.41–4.25) |
8,439 | 8 | 6,730 |
0.12 (0.05–0.23) |
1.0 |
| Combined | 9,218 | 23 | 6,906 |
0.33 (0.21–0.49) |
0.94 (0.56–1.59)‡ |
18,810 | 49 | 15,162 |
0.32 (0.24–0.42) |
1.0 |
| Secondary definition of composite cardiovascular events¶ | ||||||||||
| Medicare | 2,531 | 28 | 1,831 |
1.53 (1.04–2.18) |
0.79 (0.51–1.24) |
4,866 | 73 | 3,944 |
1.85 (1.46–2.31) |
1.0 |
| PharMetrics | 2,614 | 12 | 2,060 |
0.58 (0.32–0.99) |
0.79 (0.40–1.58) |
5,505 | 32 | 4,460 |
0.72 (0.50–1.00) |
1.0 |
| MarketScan | 4,073 | 11 | 2,998 |
0.37 (0.19–0.64) |
1.13 (0.53–2.41) |
8,439 | 21 | 6,726 |
0.31 (0.20–0.47) |
1.0 |
| Combined | 9,218 | 51 | 6,889 |
0.74 (0.56–0.97) |
0.85 (0.61–1.19)‡ |
18,810 | 126 | 15,130 |
0.83 (0.70–0.99) |
1.0 |
| Intent‐to‐treat analysis up to 365 days# | ||||||||||
| Composite cardiovascular events | ||||||||||
| Medicare | 2,531 | 21 | 2,009 |
1.05 (0.66–1.57) |
0.72 (0.43–1.21) |
4,866 | 54 | 3,991 |
1.35 (1.03–1.75) |
1.0 |
| PharMetrics | 2,614 | 12 | 2,080 |
0.58 (0.31–0.98) |
0.85 (0.42–1.75) |
5,505 | 23 | 4,338 |
0.53 (0.34–0.78) |
1.0 |
| MarketScan | 4,037 | 10 | 3,147 |
0.32 (0.16–0.57) |
0.79 (0.37–1.66) |
8,439 | 26 | 6,447 |
0.40 (0.27–0.58) |
1.0 |
| Combined | 9,218 | 43 | 7,236 |
0.59 (0.44–0.79) |
0.77 (0.53–1.11)‡ |
18,810 | 103 | 14,776 |
0.70 (0.57–0.84) |
1.0 |
Cohorts were propensity score–matched with a 1:3 variable ratio. Propensity score models included >90 covariates, including demographics, prior disease‐modifying antirheumatic drug use, cardiovascular comorbidities, medications, and health care utilization. IR = incidence rate; HR = hazard ratio; RA = rheumatoid arthritis; TCZ = tocilizumab; TNFi = tumor necrosis factor inhibitors; 95% CI = 95% confidence interval.
Per 100 person‐years.
Combined using an inverse variance‐weighted, fixed‐effects model.
Not reported (NR) for the Medicare population due to the small size (<11) of the data cell and other cells that could indirectly be used to calculate the small cell count based on the data use agreement with the Centers for Medicare & Medicaid Services.
Defined as a discharge diagnosis of myocardial infarction (MI) in the principal position for any length of hospitalization or a hospital discharge diagnosis of ischemic or hemorrhagic stroke in the principal position.
Exposure status at cohort entry was carried forward until day 365 of follow‐up.
The HR for composite cardiovascular events associated with TCZ versus TNFi use was 0.70 (95% CI 0.40–1.24) in the Medicare database, 1.00 (95% CI 0.45–2.22) in the PharMetrics database, and 1.03 (95% CI 0.46–2.34) in the MarketScan database, with a combined HR of 0.84 (95% CI 0.56–1.26, P for heterogeneity = 0.7). After accounting for potential overlap between the PharMetrics and MarketScan populations, the 95% CI for the combined HR for composite cardiovascular events associated with TCZ use versus TNFi became slightly wider (combined HR 0.84 [95% CI 0.56–1.27 for 10% overlap and 0.55–1.28 for 20% overlap]). The Kaplan‐Meier plots confirmed that there were no differences in rates of composite cardiovascular events between the TCZ and TNFi groups (Supplementary Figure 1, available on the Arthritis & Rheumatology web site at http://onlinelibrary.wiley.com/doi/10.1002/art.40084/abstract).
The combined HR (Table 2) for MI associated with TCZ versus TNFi was 0.70 (95% CI 0.37–1.34; P for heterogeneity = 1.0), and the HR for stroke was 0.94 (95% CI 0.56–1.59; P for heterogeneity = 0.6). Using the secondary definition of composite cardiovascular event (i.e., MI in the principal position for any length of hospitalization or a hospital discharge diagnosis code of ischemic or hemorrhagic stroke), there were a total of 177 composite cardiovascular events (51 in TCZ initiators and 126 in TNFi initiators) in the 3 databases (Table 2). The HR for composite cardiovascular events associated with TCZ versus TNFi use was 0.79 (95% CI 0.51–1.24) in Medicare, 0.79 (95% CI 0.40–1.58) in PharMetrics, and 1.13 (95% CI 0.53–2.41) in MarketScan, with a combined HR of 0.85 (95% CI 0.61–1.19; P for heterogeneity = 0.71). With adjustment for potential overlap between the PharMetrics and MarketScan populations, the combined HR for the secondary definition of composite cardiovascular events was 0.84 (combined HR 0.77 [95% CI 0.53–1.12 for 10% overlap and 0.52–1.13 for 20% overlap]).
The secondary ITT 365‐day analysis also showed similar results (Table 2), with a combined HR of 0.77 for composite cardiovascular events associated with TCZ versus TNFi (95% CI 0.53–1.11; P for heterogeneity = 0.9). After accounting for potential overlap between the PharMetrics and MarketScan populations, the 95% CI for the combined HR for composite cardiovascular events became slightly wider, but the inference remained the same (combined HR 0.77 [95% CI 0.53–1.12 for 10% overlap and 0.52–1.13 for 20% overlap]). Results from the as‐treated analysis for the secondary outcomes also showed no increased risk of various individual cardiovascular end points in the TCZ group compared with the TNFi group (Figure 3). The combined HR for all‐cause deaths was 0.84 in the TCZ group versus the TNFi group (95% CI 0.58–1.20; P for heterogeneity = 0.2).
Figure 3.

Secondary end points in a 1:3 variable ratio propensity score–matched as‐treated analysis of rheumatoid arthritis patients starting treatment with tocilizumab (TCZ) or a tumor necrosis factor inhibitor (TNFi). Hazard ratios (HRs) were combined using an inverse variance‐weighted, fixed‐effects model. A “secondary definition of cardiovascular (CV) event” refers to a discharge diagnosis of myocardial infarction in the principal position for any length of hospitalization or a hospital discharge diagnosis of ischemic or hemorrhagic stroke in the principal position. “Any CV event” includes myocardial infarction, stroke, coronary revascularization, or acute coronary syndrome. 95% CI = 95% confidence interval.
Figure 4 summarizes the results from subgroup analyses. TCZ use versus TNFi use was not associated with a greater risk of composite cardiovascular events in a subgroup of patients age <60 years or ≥60 years, or those with baseline cardiovascular disease or diabetes, although the 95% CIs were wide. No association was found between TCZ use and cardiovascular risk in patients who were receiving methotrexate at baseline (combined HR 0.89 [95% CI 0.39–2.03]) or those who were not receiving methotrexate at baseline (combined HR 1.07 [95% CI 0.64–1.78]). The combined HR associated with TCZ versus TNFi was 0.90 (95% CI 0.55–1.47) in patients who were taking oral steroids at baseline and 0.81 (95% CI 0.39–1.67) in those who were not taking oral steroids at baseline. Among patients who were taking statins at baseline, the combined HR associated with TCZ versus TNFi was 0.77 (95% CI 0.42–1.39) for the primary cardiovascular end point, which was similar to the combined HR of 0.83 (95% CI 0.47–1.46) in patients who were not taking statins at baseline.
Figure 4.
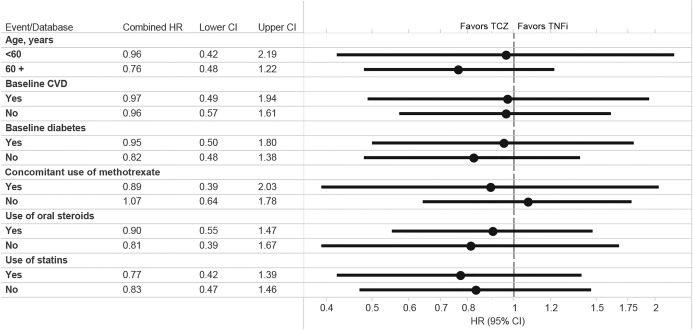
Subgroup analysis in a 1:3 variable ratio propensity score–matched as‐treated analysis of rheumatoid arthritis patients starting treatment with tocilizumab (TCZ) or a tumor necrosis factor inhibitor (TNFi). Hazard ratios (HRs) were combined by an inverse variance‐weighted, fixed‐effects model. For the age <60 subgroup, only PharMetrics and MarketScan data were used since there were no cardiovascular events in the age <60 Medicare population. CVD = cardiovascular disease; 95% CI = 95% confidence interval.
DISCUSSION
In a number of RCTs and observational studies, TCZ has been shown to increase LDL cholesterol levels. However, the effect of TCZ on clinical cardiovascular risk has not been fully understood. Since RA patients have a nearly 2‐fold increased risk of cardiovascular disease and cardiovascular mortality compared with the general population 1, 2, increases in LDL cholesterol levels with TCZ have been a concern. In this large US population‐based multi‐database cohort study of 28,028 patients with RA who had previously received at least 1 biologic drug, we found no increase in the risk of a composite cardiovascular end point of MI or stroke between TCZ initiators and TNFi initiators. In fact, we found a numeric decrease in risk and ruled out a risk increase of >26% based on the upper limit of the 95% CI for the combined HR. We also did not find an increased risk of secondary end points, including the individual end points of MI, stroke, ACS, coronary revascularization, heart failure, and all‐cause mortality, in TCZ initiators compared with TNFi initiators. Furthermore, in patients with a history of cardiovascular disease or diabetes or those who were receiving steroids, statins, or methotrexate at baseline, we consistently found no association of TCZ treatment with increased cardiovascular risk.
This study has important clinical implications. While elevations in lipid levels occur in patients treated with TCZ 12, 13, 14, such increases do not appear to be associated with an increased risk of clinical cardiovascular events. Rao et al reported that the risk of major cardiovascular events in patients with RA who were receiving TCZ was associated with control of RA disease activity but not changes in lipid levels based on post hoc analyses of clinical trials and extension studies of TCZ 17. Several studies demonstrated a similar complex relationship between cholesterol levels, disease activity/systemic inflammation, and cardiovascular risk in patients with RA and showed no clear association between LDL cholesterol levels and cardiovascular risk 35, 36, 37, 38. In patients with active systemic inflammation such as sepsis or RA, LDL levels tend to be low 37. In other words, generally, systemic inflammation has lipid‐lowering effects. Therefore, it may not be surprising to observe elevated levels of total cholesterol or LDL cholesterol with treatment with powerful antiinflammatory biologic drugs such as TCZ. There are also some reports of a significant increase in total cholesterol levels after TNFi treatment, correlating with lower RA disease activity 37, 39. Our finding that there was no increased cardiovascular risk with TCZ versus TNFi use is reassuring, particularly given the potential beneficial cardiovascular effects of TNFi seen in several cohort studies 7, 8, 9.
This population‐based comparative safety study provides much needed data for clinical decision making in the management of RA. Furthermore, a prior cohort study that showed comparative cardiovascular safety of different biologic agents, including TCZ versus abatacept, in patients with RA did not show an elevated risk of incident MI or composite coronary heart disease 40. With the completion of the ENTRACTE study, a postmarketing open‐label RCT that examines the risk of cardiovascular events in RA patients treated with TCZ compared with those treated with etanercept, more head‐to‐head safety data will be available soon.
The main strength of this study is its large size and generalizability, since the study cohort is based on 3 large population‐representative insurance databases in the US. Since TCZ is a relatively new therapy, using multiple databases was necessary to achieve an adequate study size. Combining the results from 3 databases, we were able to include a total of 9,218 TCZ initiators after propensity score matching. This study was planned to have at least 80% power to refute a 30% increase in the risk of the primary end point in TCZ initiators versus TNFi initiators. The upper limit of the 95% confidence interval of HR for the primary end point was 1.26. Unlike enrollees in clinical trials, our study cohort is representative of older adults (Medicare) and the working population and their dependents (PharMetrics and MarketScan) in the US. Detailed longitudinal information on patients' drug use in pharmacy claims data linked to comprehensive medical claims is another advantage of the study data sources.
To yield findings with high validity, this study used rigorous pharmacoepidemiologic approaches, such as the inclusion of study drug initiators (i.e., new user design), specific outcome definition, use of an active comparator, and propensity score matching with a variable ratio to perform appropriate statistical control for a large number of confounders and to minimize confounding by indication and immortal time bias 41, 42. We required a relatively long baseline period to define “new users” of either TCZ or TNFi and assess patients' baseline characteristics for confounding control. Because TCZ is mostly used as a second‐line treatment for RA in routine practice, the requirement of prior biologic or targeted synthetic use in both TCZ and TNFi initiators likely further reduced the degree of confounding by RA duration or severity between the 2 groups. Given known differences in patient demographics and other characteristics across the 3 databases, we used a prespecified analysis plan in each data set separately and combined the results using a meta‐analysis technique. Finally, the null association between TCZ use and cardiovascular risk, compared with TNFi use, was consistently observed in all of the prespecified secondary and subgroup analyses.
This study has several limitations. First, since we relied on claims data, we had no data on RA disease duration or activity, seropositivity, systemic inflammation, lipid levels, blood pressure, family history of cardiovascular disease, use of over‐the‐counter drugs such as aspirin or some nonsteroidal antiinflammatory drugs, smoking, or body mass index, although we captured many proxies of these clinical covariates. Second, while we adjusted for >65 baseline variables potentially related to cardiovascular risk using propensity score matching, residual confounding cannot be ruled out. Third, there is a potential for outcome misclassification since outcomes were identified with claims‐based definitions, although we used validated algorithms with high specificity. Fourth, there is a potential for duplicate person‐years between the PharMetrics and MarketScan databases. While the exact degree of overlap between the 2 data sets is unknown, it does not appear to have a substantial impact on our estimates based on a sensitivity analysis accounting for 10–20% overlap. Finally, since the mean follow‐up was <1 year for the majority of the study population, the long‐term cardiovascular effect of TCZ or TNFi may need to be further examined. However, 7,142 patients (25% of the study cohort) were followed up for >1 year, and 2,271 (8%) were followed up for >2 years in the study. The maximum observational period was 4.5 years in both exposure groups.
In conclusion, this multi‐database population‐representative cohort study showed no evidence of an increased risk of cardiovascular events in patients with RA who switched from a biologic or targeted synthetic DMARD to TCZ compared with those who switched to a different TNFi. Our results were consistent in secondary and clinically important subgroup analyses.
AUTHOR CONTRIBUTIONS
All authors were involved in drafting the article or revising it critically for important intellectual content, and all authors approved the final version to be published. Dr. Kim had full access to all of the data in the study and takes responsibility for the integrity of the data and the accuracy of the data analysis.
Study conception and design
Kim, Solomon, Gale, Klearman, Sarsour, Schneeweiss.
Acquisition of data
Kim, Rogers, Schneeweiss.
Analysis and interpretation of data
Kim, Solomon, Rogers, Gale, Klearman, Sarsour, Schneeweiss.
ROLE OF THE STUDY SPONSOR
This study was funded by Genentech but solely conducted at the Brigham and Women's Hospital. Genentech provided the funding to conduct the study and obtain the study databases but had no role in the analysis. The sponsor was given the opportunity to make nonbinding comments on interpretation of the data and a draft of the manuscript, but the authors retained the right of publication and to determine the final wording.
Supporting information
SupplementaryTable 1. Baseline characteristics of study cohorts in the 365 days before study entry: After 1:3 variable ratio PS matching
Supplementary Table 2. Baseline characteristics of study cohorts in the 365 days before study entry: before PS matching
Supplementary Figure 1. Kaplan‐Meier curves for cardiovascular event‐free survival by treatment: 1:3 variable ratio PS‐matched as‐treated analysis A. Medicare, B. PharMetrics, C. MarketScan
Supported by Genentech.
Dr. Kim has received research funding from Lilly, Genentech, Pfizer, Bristol‐Myers Squibb, and AstraZeneca (grants to Brigham and Women's Hospital). Dr. Solomon has received research funding from Lilly, Pfizer, AstraZeneca, Genentech, Amgen, and the Consortium of Rheumatology Researchers of North America (CORRONA) (grants to Brigham and Women's Hospital). Dr. Schneeweiss is a paid consultant to Whiscon, LLC and Aetion, Inc., a software manufacturer in which he owns equity; he is also principal investigator on research grants to Brigham and Women's Hospital from Genentech and Boehringer Ingelheim.
REFERENCES
- 1. Solomon DH, Karlson EW, Rimm EB, Cannuscio CC, Mandl LA, Manson JE, et al. Cardiovascular morbidity and mortality in women diagnosed with rheumatoid arthritis. Circulation 2003;107:1303–7. [DOI] [PubMed] [Google Scholar]
- 2. Avina‐Zubieta JA, Choi HK, Sadatsafavi M, Etminan M, Esdaile JM, Lacaille D. Risk of cardiovascular mortality in patients with rheumatoid arthritis: a meta‐analysis of observational studies. Arthritis Rheum 2008;59:1690–7. [DOI] [PubMed] [Google Scholar]
- 3. Meissner Y, Zink A, Kekow J, Rockwitz K, Liebhaber A, Zinke S, et al. Impact of disease activity and treatment of comorbidities on the risk of myocardial infarction in rheumatoid arthritis. Arthritis Res Ther 2016;18:183. [DOI] [PMC free article] [PubMed] [Google Scholar]
- 4. Solomon DH, Kremer J, Curtis JR, Hochberg MC, Reed G, Tsao P, et al. Explaining the cardiovascular risk associated with rheumatoid arthritis: traditional risk factors versus markers of rheumatoid arthritis severity. Ann Rheum Dis 2010;69:1920–5. [DOI] [PMC free article] [PubMed] [Google Scholar]
- 5. Singh JA, Saag KG, Bridges SL Jr, Akl EA, Bannuru RR, Sullivan MC, et al. 2015 American College of Rheumatology guideline for the treatment of rheumatoid arthritis. Arthritis Rheumatol 2016;68:1–26. [DOI] [PubMed] [Google Scholar]
- 6. Roubille C, Richer V, Starnino T, McCourt C, McFarlane A, Fleming P, et al. The effects of tumour necrosis factor inhibitors, methotrexate, non‐steroidal anti‐inflammatory drugs and corticosteroids on cardiovascular events in rheumatoid arthritis, psoriasis and psoriatic arthritis: a systematic review and meta‐analysis. Ann Rheum Dis 2015;74:480–9. [DOI] [PMC free article] [PubMed] [Google Scholar]
- 7. Barnabe C, Martin BJ, Ghali WA. Systematic review and meta‐analysis: anti–tumor necrosis factor α therapy and cardiovascular events in rheumatoid arthritis. Arthritis Care Res (Hoboken) 2011;63:522–9. [DOI] [PubMed] [Google Scholar]
- 8. Greenberg JD, Kremer JM, Curtis JR, Hochberg MC, Reed G, Tsao P, et al. Tumour necrosis factor antagonist use and associated risk reduction of cardiovascular events among patients with rheumatoid arthritis. Ann Rheum Dis 2011;70:576–82. [DOI] [PubMed] [Google Scholar]
- 9. Solomon DH, Curtis JR, Saag KG, Lii J, Chen L, Harrold LR, et al. Cardiovascular risk in rheumatoid arthritis: comparing TNF‐α blockade with nonbiologic DMARDs. Am J Med 2013;126:730.e9–17. [DOI] [PMC free article] [PubMed] [Google Scholar]
- 10. Desai RJ, Rao JK, Hansen RA, Fang G, Maciejewski M, Farley J. Tumor necrosis factor‐α inhibitor treatment and the risk of incident cardiovascular events in patients with early rheumatoid arthritis: a nested case‐control study. J Rheumatol 2014;41:2129–36. [DOI] [PubMed] [Google Scholar]
- 11. Dixon WG, Watson KD, Lunt M, Hyrich KL, British Society for Rheumatology Biologics Register Control Centre Consortium , Silman AJ, et al, on behalf of the British Society for Rheumatology Biologics Register. Reduction in the incidence of myocardial infarction in patients with rheumatoid arthritis who respond to anti–tumor necrosis factor α therapy: results from the British Society for Rheumatology Biologics Register. Arthritis Rheum 2007;56:2905–12. [DOI] [PMC free article] [PubMed] [Google Scholar]
- 12. Jones G, Sebba A, Gu J, Lowenstein MB, Calvo A, Gomez‐Reino JJ, et al. Comparison of tocilizumab monotherapy versus methotrexate monotherapy in patients with moderate to severe rheumatoid arthritis: the AMBITION study. Ann Rheum Dis 2010;69:88–96. [DOI] [PMC free article] [PubMed] [Google Scholar]
- 13. Nishimoto N, Yoshizaki K, Miyasaka N, Yamamoto K, Kawai S, Takeuchi T, et al. Treatment of rheumatoid arthritis with humanized anti–interleukin‐6 receptor antibody: a multicenter, double‐blind, placebo‐controlled trial. Arthritis Rheum 2004;50:1761–9. [DOI] [PubMed] [Google Scholar]
- 14. Smolen JS, Beaulieu A, Rubbert‐Roth A, Ramos‐Remus C, Rovensky J, Alecock E, et al. Effect of interleukin‐6 receptor inhibition with tocilizumab in patients with rheumatoid arthritis (OPTION study): a double‐blind, placebo‐controlled, randomised trial. Lancet 2008;371:987–97. [DOI] [PubMed] [Google Scholar]
- 15. Gabay C, McInnes IB, Kavanaugh A, Tuckwell K, Klearman M, Pulley J, et al. Comparison of lipid and lipid‐associated cardiovascular risk marker changes after treatment with tocilizumab or adalimumab in patients with rheumatoid arthritis. Ann Rheum Dis 2016;75:1806–12. [DOI] [PMC free article] [PubMed] [Google Scholar]
- 16. Gabay C, Emery P, van Vollenhoven R, Dikranian A, Alten R, Pavelka K, et al. Tocilizumab monotherapy versus adalimumab monotherapy for treatment of rheumatoid arthritis (ADACTA): a randomised, double‐blind, controlled phase 4 trial. Lancet 2013;381:1541–50. [DOI] [PubMed] [Google Scholar]
- 17. Rao VU, Pavlov A, Klearman M, Musselman D, Giles JT, Bathon JM, et al. An evaluation of risk factors for major adverse cardiovascular events during tocilizumab therapy. Arthritis Rheumatol 2015;67:372–80. [DOI] [PubMed] [Google Scholar]
- 18. Hennessy S, Freeman C, Cunningham F. US government claims databases In: Strom B, Kimmel S, Hennessy S, editors. Pharmacoepidemiology. 5th ed Philadelphia: Wiley‐Blackwell; 2012. p. 209–23. [Google Scholar]
- 19. Kappelman MD, Rifas‐Shiman SL, Kleinman K, Ollendorf D, Bousvaros A, Grand RJ, et al. The prevalence and geographic distribution of Crohn's disease and ulcerative colitis in the United States. Clin Gastroenterol Hepatol 2007;5:1424–9. [DOI] [PubMed] [Google Scholar]
- 20. Quek RG, Fox KM, Wang L, Li L, Gandra SR, Wong ND. A US claims‐based analysis of real‐world lipid‐lowering treatment patterns in patients with high cardiovascular disease risk or a previous coronary event. Am J Cardiol 2016;117:495–500. [DOI] [PubMed] [Google Scholar]
- 21. Kim SY, Servi A, Polinski JM, Mogun H, Weinblatt ME, Katz JN, et al. Validation of rheumatoid arthritis diagnoses in health care utilization data. Arthritis Res Ther 2011;13:R32. [DOI] [PMC free article] [PubMed] [Google Scholar]
- 22. Kiyota Y, Schneeweiss S, Glynn RJ, Cannuscio CC, Avorn J, Solomon DH. Accuracy of Medicare claims‐based diagnosis of acute myocardial infarction: estimating positive predictive value on the basis of review of hospital records. Am Heart J 2004;148:99–104. [DOI] [PubMed] [Google Scholar]
- 23. Andrade SE, Harrold LR, Tjia J, Cutrona SL, Saczynski JS, Dodd KS, et al. A systematic review of validated methods for identifying cerebrovascular accident or transient ischemic attack using administrative data. Pharmacoepidemiol Drug Saf 2012;21 Suppl 1:100–28. [DOI] [PMC free article] [PubMed] [Google Scholar]
- 24. Kumamaru H, Judd SE, Curtis JR, Ramachandran R, Hardy NC, Rhodes JD, et al. Validity of claims‐based stroke algorithms in contemporary Medicare data: reasons for geographic and racial differences in stroke (REGARDS) study linked with Medicare claims. Circ Cardiovasc Qual Outcomes 2014;7:611–9. [DOI] [PMC free article] [PubMed] [Google Scholar]
- 25. Ting G, Schneeweiss S, Scranton R, Katz JN, Weinblatt ME, Young M, et al. Development of a health care utilisation data‐based index for rheumatoid arthritis severity: a preliminary study. Arthritis Res Ther 2008;10:R95. [DOI] [PMC free article] [PubMed] [Google Scholar]
- 26. Gagne JJ, Glynn RJ, Avorn J, Levin R, Schneeweiss S. A combined comorbidity score predicted mortality in elderly patients better than existing scores. J Clin Epidemiol 2011;64:749–59. [DOI] [PMC free article] [PubMed] [Google Scholar]
- 27. Schneeweiss S, Rassen JA, Glynn RJ, Myers J, Daniel GW, Singer J, et al. Supplementing claims data with outpatient laboratory test results to improve confounding adjustment in effectiveness studies of lipid‐lowering treatments. BMC Med Res Methodol 2012;12:180. [DOI] [PMC free article] [PubMed] [Google Scholar]
- 28. Rubin DB. Estimating causal effects from large data sets using propensity scores. Ann Intern Med 1997;127:757–63. [DOI] [PubMed] [Google Scholar]
- 29. Rassen JA, Shelat AA, Myers J, Glynn RJ, Rothman KJ, Schneeweiss S. One‐to‐many propensity score matching in cohort studies. Pharmacoepidemiol Drug Saf 2012;21 Suppl 2:69–80. [DOI] [PubMed] [Google Scholar]
- 30. Austin PC. Optimal caliper widths for propensity‐score matching when estimating differences in means and differences in proportions in observational studies. Pharm Stat 2011;10:150–61. [DOI] [PMC free article] [PubMed] [Google Scholar]
- 31. Franklin JM, Rassen JA, Ackermann D, Bartels DB, Schneeweiss S. Metrics for covariate balance in cohort studies of causal effects. Stat Med 2014;33:1685–99. [DOI] [PubMed] [Google Scholar]
- 32. Cummings P, McKnight B, Weiss NS. Matched‐pair cohort methods in traffic crash research. Accid Anal Prev 2003;35:131–41. [DOI] [PubMed] [Google Scholar]
- 33. Walker AM, Jick H, Hunter JR, Danford A, Watkins RN, Alhadeff L, et al. Vasectomy and non‐fatal myocardial infarction. Lancet 1981;1:13–5. [DOI] [PubMed] [Google Scholar]
- 34. Munder T, Brutsch O, Leonhart R, Gerger H, Barth J. Researcher allegiance in psychotherapy outcome research: an overview of reviews. Clin Psychol Rev 2013;33:501–11. [DOI] [PubMed] [Google Scholar]
- 35. Liao KP, Liu J, Lu B, Solomon DH, Kim SC. Association between lipid levels and major adverse cardiovascular events in rheumatoid arthritis compared to non–rheumatoid arthritis patients. Arthritis Rheumatol 2015;67:2004–10. [DOI] [PMC free article] [PubMed] [Google Scholar]
- 36. Myasoedova E, Crowson CS, Kremers HM, Roger VL, Fitz‐Gibbon PD, Therneau TM, et al. Lipid paradox in rheumatoid arthritis: the impact of serum lipid measures and systemic inflammation on the risk of cardiovascular disease. Ann Rheum Dis 2011;70:482–7. [DOI] [PMC free article] [PubMed] [Google Scholar]
- 37. Robertson J, Peters MJ, McInnes IB, Sattar N. Changes in lipid levels with inflammation and therapy in RA: a maturing paradigm. Nat Rev Rheumatol 2013;9:513–23. [DOI] [PubMed] [Google Scholar]
- 38. Navarro‐Millán I, Yang S, DuVall SL, Chen L, Baddley J, Cannon GW, et al. Association of hyperlipidaemia, inflammation and serological status and coronary heart disease among patients with rheumatoid arthritis: data from the National Veterans Health Administration. Ann Rheum Dis 2016;75:341–7. [DOI] [PMC free article] [PubMed] [Google Scholar]
- 39. Seriolo B, Paolino S, Sulli A, Fasciolo D, Cutolo M. Effects of anti‐TNF‐α treatment on lipid profile in patients with active rheumatoid arthritis. Ann N Y Acad Sci 2006;1069:414–9. [DOI] [PubMed] [Google Scholar]
- 40. Zhang J, Xie F, Yun H, Chen L, Muntner P, Levitan EB, et al. Comparative effects of biologics on cardiovascular risk among older patients with rheumatoid arthritis. Ann Rheum Dis 2016;75:1813–8. [DOI] [PubMed] [Google Scholar]
- 41. Ray WA. Evaluating medication effects outside of clinical trials: new‐user designs. Am J Epidemiol 2003;158:915–20. [DOI] [PubMed] [Google Scholar]
- 42. Yoshida K, Solomon DH, Kim SC. Active‐comparator design and new‐user design in observational studies. Nat Rev Rheumatol 2015;11:437–41. [DOI] [PMC free article] [PubMed] [Google Scholar]
Associated Data
This section collects any data citations, data availability statements, or supplementary materials included in this article.
Supplementary Materials
SupplementaryTable 1. Baseline characteristics of study cohorts in the 365 days before study entry: After 1:3 variable ratio PS matching
Supplementary Table 2. Baseline characteristics of study cohorts in the 365 days before study entry: before PS matching
Supplementary Figure 1. Kaplan‐Meier curves for cardiovascular event‐free survival by treatment: 1:3 variable ratio PS‐matched as‐treated analysis A. Medicare, B. PharMetrics, C. MarketScan