Abstract
This paper details the validation of a non‐conforming arbitrary Lagrangian‐Eulerian fluid‐structure interaction technique using a recently developed experimental 3D fluid‐structure interaction benchmark problem. Numerical experiments for steady and transient test cases of the benchmark were conducted employing an inf‐sup stable and a general Galerkin scheme. The performance of both schemes is assessed. Spatial refinement with three mesh refinement levels and fluid domain truncation with two fluid domain lengths are studied as well as employing a sequence of increasing time step sizes for steady‐state cases. How quickly an approximate steady‐state or periodic steady‐state is reached is investigated and quantified based on error norm computations. Comparison of numerical results with experimental phase‐contrast magnetic resonance imaging data shows very good overall agreement including governing of flow patterns observed in the experiment.
Keywords: ALE, monolithic FSI, non‐conforming, validation, 3D FSI experiment
1. INTRODUCTION
Many industrial and engineering problems, for example, in aeronautics,1 power generation,2 defense,3 and biomedical engineering,4, 5 involve complex multiphysics phenomena, such as the interaction between fluids and solids. In the field of biomedical engineering, collaborative work of researchers, modelers, physicians, medical imaging technicians, and others becomes increasingly important to ultimately provide patient‐specific models6, 7, 8, 9 for therapy planning.
Innumerable mathematical modeling techniques and numerical solution methods for fluid‐structure interaction (FSI) problems have been proposed to date and can be classified based on the nature of the underlying algorithmic approach and solution strategy. Classification based on the nature of underlying meshes distinguishes immersed methods and moving domain methods. Immersed methods employ a fixed background mesh and a Eulerian description for the motion of the fluid over the flow domain, whereas the solid motion and deformation are described within a Lagrangian coordinate frame on an embedded mesh. The presence of the solid is accounted for either via adding a body force term to the fluid equations (immersed boundary method10) to constrain local flow with a similar effect as the no‐slip condition at fluid‐solid boundaries, or by coupling the fluid and solid equations by introducing a Lagrange multiplier at the fluid‐solid interface (ficticious domain method11, 12). Immersed methods are particularly well suited for FSI problems involving large structural deformation or solids moving through flow domains. On the other hand, moving domain methods enable inherent interface‐tracking by using an arbitrary Lagrangian‐Eulerian (ALE) coordinate frame for the fluid domain13 and constraining the fluid and solid equations by requiring equal but opposite tractions and the no‐slip condition at the fluid‐solid interface. Although, the ability of this method to deal with large structural deformation is often noted as a limitation, and remeshing steps might become necessary to maintain mesh quality. On the other hand, Lagrangian meshless methods, such as the study of Idelsohn et al,14 avoid the requirement for remeshing. Fluid‐structure interaction methods can also be classified based on the solution strategy, for example, monolithic/partitioned approach (global assembly and solution of a single matrix system vs solution of fluid and solid subsystems with exchange of boundary values) and explicit/implicit discretization and time integration, where a given choice may impact computational cost, accuracy, and stability.
In this paper, we consider a monolithic ALE FSI technique that is able to use non‐conforming meshes at the interface,5, 15, 16, 17 such that meshes can be designed based on the requirements of the physics of the coupled subsystems leading to improved accuracy and to decreased computational cost (by avoiding underrefinement and overrefinement, respectively). Coupling of subdomain equations is achieved via introduction of an additional coupling domain and enforcing interface constraints by means of a Lagrange multiplier variable. The method has been studied regarding stability and convergence15, 18 and successfully applied to various biomedical engineering problems, such as the simulation of whole‐heart and left ventricular mechanics.15, 16, 17, 19, 20 Previously, the method has been used for coupling the non‐conservative ALE Navier‐Stokes equations and the governing equations for quasi‐static/transient finite elasticity. It has been extended recently to enable modeling of turbulent flow phenomena by a stabilized cG(1)cG(1) scheme21 to extend the use of the method over a larger range of Reynolds numbers. Besides the various biomedical engineering applications,5, 17, 20 the method has been assessed and verified using test problems; however, it was not validated in any previous work. Thus, validation of the method will be the focus of this work as well as validation of using the cG(1)cG(1) scheme within the Lagrange multiplier‐based coupling method. In this work, we focus on the validation of the method as well as the comparative performance of an inf‐sup stable scheme and the cG(1)cG(1) approach.
Verification and validation are important to confirm fidelity and assess the capabilities of established and newly proposed mathematical models and numerical algorithms. Thus, standard numerical benchmark problems22, 23, 24, 25, 26 and FSI experiments27, 28, 29, 30, 31, 32, 33, 34, 35 have been developed over the last decades and found widespread use. In this tradition, a recently developed 3D FSI experiment36, 37 introduces two new challenging benchmark test cases that involve steady and periodic interaction between a moderately viscous incompressible fluid and an incompressible nonlinear solid in a 3D setting.36, 37 With key aspects (for example, flow regime, material parameters, and mechanical properties) of the experiment being in line with those given in typical translational biomedical engineering applications (such as simulation of left ventricular mechanics under support of a left ventricle assist device5), the benchmark is considered in this paper for validation of the non‐conforming monolithic FSI method. An inf‐sup stable (iss) and the cG(1)cG(1) scheme are considered for the fluid model. Numerical predictions of both methods are compared and contrasted with experimental phase‐contrast magnetic resonance imaging (MRI) data. Spatial refinement, fluid domain truncation, and convergence to (periodic) steady‐state are studied in this paper. Further, the employed coupling technique is assessed, and performance of both schemes is investigated regarding computational cost and prediction of steady and dynamic behavior (flow patterns, deformation of solid, summed forces at fluid / solid boundary, and others).
In the following, the numerical solution procedure is based on the use of a non‐conforming monolithic ALE FSI technique. The details of this method are outlined in Section 2. Further, in Section 3, we present results obtained for both benchmark test cases and validate our results via comparison with experimental results. Further, aspects such as spatial refinement and early truncation of the fluid domain are assessed. Finally, we discuss the quality of our numerical results and conclude with possible future improvements in Section 4.
2. METHODOLOGY
In this section, a brief overview of the 3D FSI experiment is given. The model problem and the respective model equations are detailed. The weak form for the FSI problem within a finite element formulation using Lagrange multipliers is given using an inf‐sup stable and stabilized scheme. The section concludes with details about the numerical solution and the definition of error norms for comparison of numerical and experimental data.
2.1. 3D FSI experiment
The flow domain in the relevant section (that is, where FSI phenomena occur) of the experiment features two inlets (diameter 21.9 mm) that merge smoothly into a single outlet (diameter 76.2 mm), with a solid (volume 11 × 2 × 65 mm3) attached to the wall in the merging section (Figure 1). A right‐handed Cartesian coordinate system is used37 with the origin chosen to be at the center of the attachment point of the solid to the wall.
Figure 1.
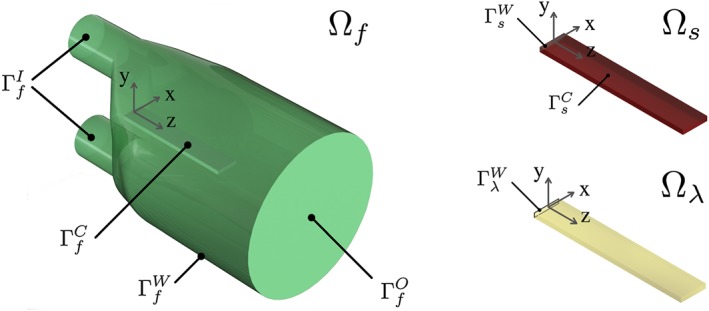
3D FSI benchmark subdomains: flow domain Ωf, solid domain Ωs, and coupling domain Ωλ
The selected pump rates create steady (Phase I) and periodic (Phase II) inflow. This yields steady and time‐dependent periodic interaction between a moderately viscous incompressible fluid (aqueous glycerol solution) and an incompressible nonlinear solid (silicone material).
Experimental data were acquired using MRI techniques and are available for comparison with numerical results. The data include the geometry under zero inflow conditions (for example, the deformed state of the structure with maximum deflection of 29.50 mm and 25.65 mm for Phases I and II, respectively), inflow boundary condition data and time‐resolved flow and deformation fields.
For Phase I, parabolic inflow profiles were defined on with peak value
| (1) |
with a smooth increase over 0.5 s (Figure 2A) for the upper (y > 0) and lower (y < 0) inlet.
Figure 2.
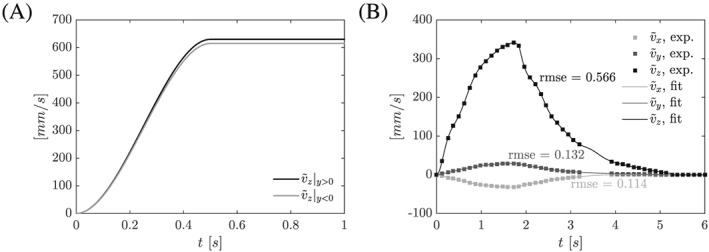
A, Phase I: prescribed peak velocity for parabolic profile with mm/s and mm/s for s (Equation (1)) and . B, Phase II: recorded peak velocity (i∈{x,y,z}) for parabolic inflow and data fit. We note, that 37
For Phase II, parabolic profiles were defined on with peak values fit to the experimental data, see Figure 2B.
Fluid material parameters and solid density are defined in the study of Hessenthaler et al37 and collected in Table 1, which also contains the solid material parameter for an isotropic incompressible Neo‐Hookean material law. It was shown in the study of Hessenthaler et al37 that this solid constitutive model can be used to model the mechanical response of the silicone material and that it is able to represent test data obtained from a uniaxial tensile load‐displacement test. However, the silicone material used in the FSI experiment undergoes a continuous curing process,37 such that the solid material model was calibrated using the zero inflow displacement data recorded for both test cases.
Table 1.
Material parameters
| Material parameter | Phase I | Phase II | Unit |
|---|---|---|---|
| Fluid density ρ f | 1163.3 | 1164.0 | [kg/m3] |
| Dynamic viscosity μ f | 12.50 | 13.37 | [mPa· s] |
| Kinematic viscosity ν f | 10.75 | 11.48 | [mm2/s] |
| Solid density ρ s | 1058.3 | 1058.3 | [kg/m3] |
| Neo‐Hookean parameter μ s | 61 | 74 | [kPa] |
2.2. Reference frames
The 3D FSI domain arising from the definition of the 3D FSI experiment consists of the fluid and solid subdomains, and (with ), and its respective subdomain boundaries, Γf and Γs. The fluid domain boundary is partitioned into inlet , outlet , wall , and coupling interface subdomains, see Figure 1. Similarly, the solid domain boundary is partitioned into subdomains for the wall and the coupling surface . A third coordinate frame on the coupling domain is introduced to enforce coupling of the fluid and solid equations. Further, denotes reference domain i (with respective boundary ), and n i denotes the outward boundary normal.
To relate reference domains, , to moving domains, Ωi(t), bijective mappings are introduced,38, 39
| (2) |
| (3) |
where w f is the fluid domain velocity (referred to as ALE velocity), u i is the deformation of the domain (generally, u i(·,0) ≠ 0 such that and ), and X is the spatial coordinate of a point in the reference domain. More precisely, Equations (2) and (3) denote an ALE mapping for the fluid domain and a Lagrangian mapping for the solid domain, repectively, such that conservation laws can be equivalently formulated on the reference or moving domain. Using the ALE and Lagrangian mapping, we can link a function given on reference domain to its counterpart on the moving domain Ωf, ie,
| (4) |
where x is the spatial coordinate of a point in the moving domain and likewise for functions given on and Ωs. Further, the Jacobian mapping of the domain displacement is given as , where F i = ∇X(u i + X) is the deformation gradient tensor. In the following, the hat notation in Equation (4) will be omitted; ∂ t denotes the temporal derivative with respect to a fixed point in the reference domain (eg, the studies of Nordsletten et al,16, 19 and Formaggia and Nobile40), and ∇x and ∇X are the Eulerian and Lagrangian gradient operators.
2.3. FSI model problem
The non‐conservative ALE Navier‐Stokes equations 19, 38, 40, 41, 42 and the governing equations for finite elasticity43, 44 are employed to model incompressible Newtonian fluid flow on the moving domain Ωf and the deformation of an incompressible nonlinear solid material on Ωs. Dynamic and kinematic interface constraints are used to couple the fluid and solid equations. An anisotropic diffusion model is selected to model the fluid domain deformation by determining the ALE velocity w f in Equation (2). Then, the fluid velocity and pressure variables, v f and p f; the solid velocity, displacement, and pressure variables, v s, u s, and p s; and the ALE velocity w f satisfy
| (5) |
| (6) |
| (7) |
| (8) |
where ρ f and ρ s are the fluid and solid density (Table 1), σ f and σ s are the Cauchy stress tensors of the fluid and solid, Φ = Φ(X) is a diffusion coefficient tensor, and and are Dirichlet and Neumann boundary condition (BC) data. In our case, and are
with given inflow (Section 2.1). To be able to deal with potential reflow on the outflow boundary and prevent backflow divergence, we further introduce outflow stabilization,45
| (9) |
with parameter β = 0.2 as suggested in the study of Moghadam et al.46
The Cauchy stresses in Equations (5) and (6) are written as
| (10) |
where μ f is the dynamic viscosity of the fluid and the silicone material was modeled as an isotropic incompressible Neo‐Hookean material with material parameter μ s(Table 1). Further, a change‐of‐variables (COV) for the pressure variables, p f and p s,
was introduced, where φ f and φ s are the substituted fluid and solid pressure variables and P o is the unknown mean outlet pressure. The COV is introduced to account for the contribution of a gravitational field (with g = [0, − 9.80665,0]T m/s2) to the momentum balance in Equation (5) (and likewise for Equation (6) to ensure compatibility of stresses). Without COV and under zero inflow conditions, a linear pressure gradient along the y‐axis would yield flow in the outlet region due to violation of a zero traction assumption on . On the other hand, the same conditions do not cause flow if a COV is employed.
The real pressure is recovered by reversing the COV with
In general, the shape of the fluid domain changes because of the deforming solid. To extend the deformation of the fluid‐solid boundary (with fixed ) to the interior of the fluid domain, a mesh velocity w f is introduced that satisfies Equation (7). Here, the boundary motion is extended to the interior using the typical harmonic extension augmented with a coefficient tensor, Φ, to preferentially weight motion in the boundary normal direction. Specifically, the tensor Φ was defined as Φ = ∇X ψ T∇X ψ + I with ψ satisfying the Laplacian problem on (with ψ = 0 on and ψ = 80 on Ωλ). As the variable ψ yields a decaying diffusion field from the coupling interface, this introduces anisotropy in Φ preferentially distributing motion faster in the direction of ∇X ψ. The value set for ψ was selected based on simple test problems in three dimensions, illustrating preservation of the mesh quality over time.
2.4. Finite element formulation using Lagrange multipliers
To couple the fluid and solid models, dynamic and kinematic interface constraints are enforced with equal but opposite tractions, t f:= σ f·n f and t s:= σ s·n s, and the no‐slip condition, as detailed in Equation (8). We note that the interface constraints are not influenced by the introduced COV because
yielding an equivalent formulation. On the coupling domain Ωλ, a Lagrange multiplier variable is defined as λ = t f =− t s, maintaining the interface conditions. Within the continuous weak form for both fluid and solid mechanical subsystems, the resulting boundary terms are substituted with λ, constraining the multiplier through the no‐slip interface condition. Finally, the respective fluid and solid models (given in Equations (5) and (6)) and the interface constraints (Equation (8)) are coupled monolithically. Here, we consider an inf‐sup stable scheme and the cG(1)cG(1) scheme21 as a variant of a General Galerkin method. We note, that Equation (7) is partitioned from the main FSI problem and solved in turn.
2.4.1. Spatiotemporal discretization
A first‐order backward Euler scheme is employed for the time discretization, where 0 = t 0 < t 1 < … < t N = T denotes a sequence of discrete time steps with time step size .
The fluid domain Ωf was discretized using tetrahedral elements, whereas hexahedral elements were selected to discretize the solid domain Ωs. The coupling domain Ωλ was discretized using triangular elements that conform with the fluid domain surface elements on . In the following, we use to denote meshes consisting of many, non‐overlapping elements and and to denote current fluid and solid meshes.
2.4.2. Weak formulation I: inf‐sup stable scheme
Finite element discretizations were constructed using inf‐sup stable Taylor‐Hood elements for fluid velocity and pressure, for fluid domain velocity and inf‐sup stable Taylor‐Hood elements for solid displacement and pressure. Further, elements were employed for the Lagrange multiplier variable that was nested into the trace of the richest space on Ωλ, which was on the fluid side. The discrete solution at each step n in time can then be written as follows:
Find and , such that for every and :
where is the first Piola‐Kirchhoff stress tensor, , and the notation Y n + θ = θ Y n + 1 + (1 − θ)Y n.
Following the study of Nordsletten et al,16 we introduce,
defining all k th‐order piecewise continuous polynomials on respective discretized domains (i = f,s), where are the polynomials of degree . Finally, from the spaces,
we select only those functions satisfying the Dirichlet BC or homogeneous BC,
| (11) |
| (12) |
| (13) |
and define the Lagrange multiplier space as,
where is the trace operator on .
2.4.3. Weak formulation II: cG(1)cG(1) scheme
Here, the cG(1)cG(1) scheme as given for the Navier‐Stokes equations in the study of Hoffman et al21 is considered to be able to employ equal‐order interpolation and to govern potential turbulent effects. Finite element discretizations were constructed using Taylor‐Hood elements for fluid velocity and pressure, elements for fluid domain velocity and inf‐sup stable Taylor‐Hood elements for solid displacement and pressure. Further, elements were employed for the Lagrange multiplier variable, that was again nested into the trace of the richest space on Ωλ, which was on the fluid side. The discrete solution at each step n in time can then be written as follows:
Find and , such that for every and :
with the stabilization term,
and stabilization parameters,
where h is the mesh size and v max is the expected peak velocity on . Here, we replace and by and , to use equal‐order interpolation for the fluid model. Then, , , , and are given similarly to Equations (11) and (13).
2.5. Solver strategy
CHeart 47—a multi‐physics software tool based on5, 15, 16, 17 and the matrix solver MUMPS 48 were used to solve the considered problem on compute nodes with 2 x Intel(R) Xeon® CPU E5‐2680 v2 (2.80 GHz) with 10 cores, 256 GB RAM and 4 × 500 GB Samsung SSD (network with 1 x QDR‐Infiniband Interconnect (40 GBit) and 1 × 1 GBit Ethernet).
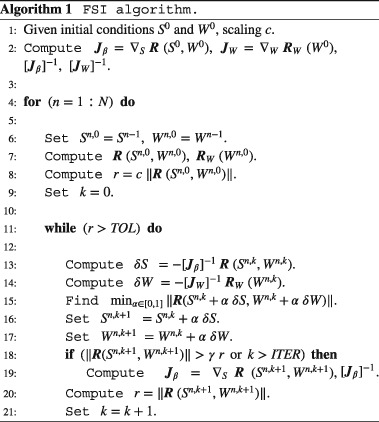
Further, the Shamanskii‐Newton‐Raphson (SNR) method49 was employed to reduce computational cost by re‐using the Jacobian matrix (and its inverse)5, 18 as long as a sufficient decrease in the residual norm was observed. A pseudocode description of the employed algorithm is given in Algorithm 1, where c = 100 is used for scaling the initial residual, γ = 3/4 requires a sufficient residual decrease, and the general notation,
is used to define the current approximate solution and test functions (with basis functions ϕ and ψ). Further, the residuals and Jacobians are denoted by
Because of the iterative nature of the algorithm (Algorithm 1) and the partitioned approach, can be updated from the current solution of v f on .
2.6. Error norms
Numerical results are compared with experimental data at equispaced data point positions at cross sections along the z‐direction with z ∈ {3.5, 13.5, …, 93.5}mm and 5 mm spacing along the x‐ and y‐direction, as specified in the studies of Gaddum et al36 and Hessenthaler et al.37 Further, to directly compare numerical results computed on different meshes with different mesh topology and/or geometry (Section 3.1), simulation results are sampled on a regular grid with points x i, i = 1, …, N: (i) box [ − 40, 40] x [ − 40, 40] x [ − 20, 140] mm3 and spacing 1 mm (in each direction) for the current fluid domain Ωf,h; and (ii) box [ − 5.5, 5.5] x [ − 1, 1] x [0, 65] mm3 and spacing 0.5 mm (in each direction) for the solid domain in the reference configuration. We note that a mask is employed such that only points are considered that exist inside both fluid domains in the current configuration. For example, consider discretized domains Ωi,h(t p) and Ωi,h(t q) at times t p and t q. Then, the mask is given as,
For comparison of results at sampled data points x i, consider an approximation and a reference at times t p and t q with d ∈ {1, 3}. Then, a scalar field is defined at each point x i by computing the Euclidean distance, ∥·∥2, between approximation w and reference v. To detect variation in the fluid and solid variables, we compute the maximum distance,
| (14) |
and the mean distance,
| (15) |
between an approximation and a given reference.
3. 3D FSI BENCHMARK RESULTS AND COMPARISON WITH EXPERIMENTAL DATA
Numerical results for both phases of the 3D FSI benchmark were obtained using the inf‐sup stable (Section 2.4.2) and cG(1)cG(1) (Section 2.4.3) schemes. In this section, we present and compare the numerical results with the experimental data, while studying spatial refinement and studying how quickly steady‐state and periodic steady‐state are reached.
3.1. Mesh construction
For Phase I, meshes were constructed based on undeformed geometries corresponding to a stress‐free state of the coupled FSI system and reference domains , , and were selected accordingly (Figure 3).
Figure 3.
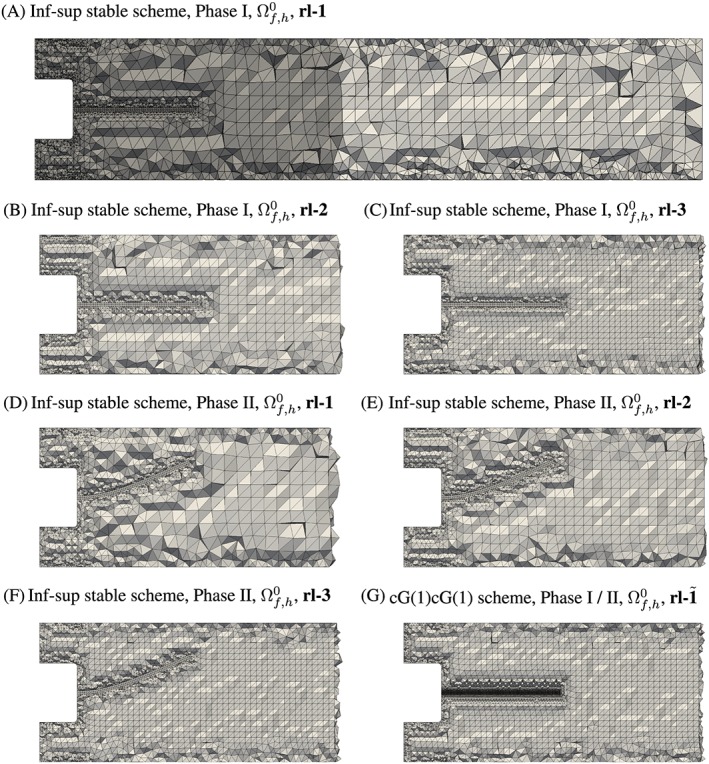
A selection of considered fluid domain discretizations shown in the reference configuration (Section 3.1), for various refinement levels (rl), where the size of the truncated domain is indicated in dark‐gray in A, as compared to the elongated domain. Clipped domains are shown in B,‐G. Mesh details are given in Table 2
For Phase II, the Phase I meshes were deformed based on the coupled FSI system being exposed to gravity loading of 70% strength. Then, fluid and interface domains were remeshed, to counteract deteriorating mesh quality due to large mesh deformations, and the fluid and reference domains redefined to be in this deformed state (Figure 3). Finally, the coupled FSI system was subjected to 100% gravity loading to obtain a deformed state that matches the state during the calibration step of Phase II of the FSI experiments.37
In preliminary numerical experiments, the static deflection of the solid in its hydrostatic equilibrium (with material parameters for Phase II; Table 1) was studied regarding mesh resolution. Buoyancy forces in a surrounding resting fluid were mimicked by applying the net gravity load, specifically (ρ s − ρ f)/ρ s g. Equation (6) was used for the solid model, but the inertial term was neglected (because predictions of a static and transient model are expected to tend to the same asymptotic limit subject to static loading conditions). As expected, because of the high‐aspect ratio of the solid side lengths, the observed maximum deflection of the tip of the solid is predominantly influenced by the mesh size in z‐direction (Figure 4). A similar result is anticipated for dynamic loading cases, such that a fine mesh resolution of 11 × 2 × 65 hexahedral elements seems a good choice for both Phases I and II.
Figure 4.

The graph depicts the position of the center of the solid tip, u y + Y, under static gravity loading depending on mesh resolution, where the number of elements in one coordinate direction is kept fixed and varied in the other coordinate directions
For the model given in Section 2.4.2, the fluid domain boundary Γf was discretized using a fine triangular surface mesh. On the coupling boundary , the triangular mesh was constructed, such that a quadrilateral surface element on would have two triangular surface elements as counterparts on with matching nodes. Aim of selecting a fixed but fine mesh resolution on Γf was to avoid dominant boundary effects while studying spatial refinement in the interior of the domain, where three different mesh refinement levels were considered (referred to as rl‐1, rl‐2, rl‐3), see Figure 3 and Table 2. On the other hand, only one refinement level rl‐ was considered for the model given in Section 2.4.3 (Figure 3G), as we expect similar behavior with respect to spatial refinement. Here, the fluid coupling boundary was discretized using triangle elements, such that a quadrilateral surface element on would have two triangular surface elements as counterparts on .
Table 2.
Mesh details for flow and Lagrange multiplier domains, Ωf and Ωλ
| Refinement | Number of elements | Number of nodes | Avrg. runtime | |||||
|---|---|---|---|---|---|---|---|---|
| Phase | Scheme | level | // | v f | φ f | λ | per time step | Number of cores |
| I | inf‐sup st. | rl‐1 | 127 774 // 3424 | 195 635 | 27 914 | 6875 | 13.89 s | 16 |
| inf‐sup st. | rl‐2 | 158 236 // 3424 | 236 137 | 32 934 | 6875 | 22.10 s | 16 | |
| inf‐sup st. | rl‐3 | 333 048 // 3424 | 469 487 | 62 203 | 6875 | 38.72 s | 16 | |
| cG(1)cG(1) | rl‐ | 673 066 // 54 784 | 133 663 | 133 663 | 27 445 | 21.01 s | 16 | |
| inf‐sup st. | rl‐1‐trunc | 135 352 // 3424 | 207 431 | 29 615 | 6875 | 10.39 s | 16 | |
| inf‐sup st. | rl‐2‐trunc | 152 126 // 3424 | 229 725 | 32 375 | 6875 | 13.04 s | 16 | |
| II | inf‐sup st. | rl‐1 | 131 263 // 3424 | 200 276 | 28 490 | 6875 | 12.60 s | 16 |
| inf‐sup st. | rl‐2 | 166 205 // 3424 | 246 812 | 34 287 | 6875 | 14.86 s | 16 | |
| inf‐sup st. | rl‐3 | 351 221 // 3424 | 493 664 | 65 205 | 6875 | 38.72 s | 16 | |
| cG(1)cG(1) | rl‐ | 673 066 // 54 784 | 133 663 | 133 663 | 27 445 | 50.53 s | 32 | |
| inf‐sup st. | rl‐1‐trunc | 136 955 // 3424 | 209 562 | 29 879 | 6875 | 13.16 s | 16 | |
| inf‐sup st. | rl‐2‐trunc | 160 539 // 3424 | 241 002 | 33 807 | 6875 | 14.61 s | 16 |
The solid domain was discretized using 1430 elements with 15 065 nodes for u s and 2376 nodes for φ s.
We note that the outlet of the computational domain was extended by 250 mm to regularize flow downstream. To study the necessity of such an elongation, a truncated domain (Figure 3A) in combination with the model given in Section 2.4.2 was also considered with two refinement levels (referred to as rl‐1‐trunc and rl‐2‐trunc) for Phases I and II, respectively.
The triangular surface mesh on the fluid domain's coupling boundary was extracted from the mesh discretizing to define the mesh on Ωλ.
3.2. Phase I experiment
Initially, the FSI system is at rest and subject to no body forces (no flow, no displacement). Then, parabolic inflow is prescribed at both inlets as given in Equation (1) (Figure 2A). Simultaneously, gravitational forces are increased according to (24t 3 − 8t 2) · g over 0.5 s and kept constant at 1 · g for t ⩽ 0.5 s. Because a steady‐state is expected,37 an increasing sequence of time step sizes was employed; eg, we simulated 2 s with Δt = 1 ms, 60 s with Δt ′ = 10 ms, and 138 s with Δt″ = 100 ms (such that the total simulated time was T = 200 s).
Because of increased inflow and gravitational forces, the silicone filament moves into the way of the incoming flow jet. The impact causes strong disturbance in the flow field, which is then advected toward the outlet causing reflow regions at the outflow boundary. Here, backflow divergence is avoided effectively by employing outflow stabilization (Equation (9)).
After a short transition phase, the silicone filament reaches a steady position and flow stabilizes. Figure 5 illustrates that the final position of the silicone filament along its centerline is predicted consistently by the inf‐sup stable scheme with a slightly overestimated deflection. On the other hand, the cG(1)cG(1) scheme slightly underestimates the deflection of the silicone filament near the tip. However, agreement with the experimental data is very good considering finite voxel sizes in MRI.37 To investigate how quickly the silicone filament reaches its steady‐state position (where the position predicted by the inf‐sup stable scheme with fluid domain refinement level 3 is assumed as the steady‐state position), we employ Equation (14) to quantify the maximum Euclidean distance to the steady‐state position. Figure 6 shows that the solid reaches its final position quickly irrespective of the fluid domain mesh resolution or employed scheme, such that the fluid domain deformation is negligible after the initial transition phase.
Figure 5.

Phase I: Final position of the centerline of the silicone filament is predicted well by the inf‐sup stable (Section 2.4.2) and cG(1)cG(1) (Section 2.4.3) scheme
Figure 6.

Phase I: The graph depicts the maximum and mean Euclidean distance, d ∞ and (Equations (14) and (15)), where mm is the maximum deflection observed in the experiment and mm/s the recorded maximum inflow.37 Here, we selected as the final state obtained with the inf‐sup stable scheme, rl‐3
Once flow has stabilized and fluctuations become smaller, flow in the v x and v y components is less pronounced (Figure 7) than during the transition phase. Flow mainly occurs in the v z component, and the presence of the silicone filament does not seem to cause significant disturbance or deflection of the flow jets entering from the inlets. In fact, the tip of the silicone filament is positioned just below the upper flow jet. Between the two flow jets, a large recirculation zone is observed, where approximately one third of the outflow boundary is covered by fluid flowing back into the computational domain, see Figure 7C,D. Investigating differences in the flow predictions obtained for various fluid domain refinement levels using both schemes, it becomes clear that an early truncation of the domain can change local flow in the considered region significantly, see Figure 6. Further, flow predictions computed for the elongated fluid domain are consistent for all meshes indicating that rl‐1 provides a sufficient refinement. Similarly to the solid deflection, a steady‐state flow field is obtained quickly (Figure 6), such that the simulated time can be reduced drastically without corrupting the approximation accuracy of the predicted steady‐state. Finally, comparing flow predictions and experimental results at plane z≈ 30 mm shows good qualitative agreement for all velocity components, see Figure 8A‐C.
Figure 7.
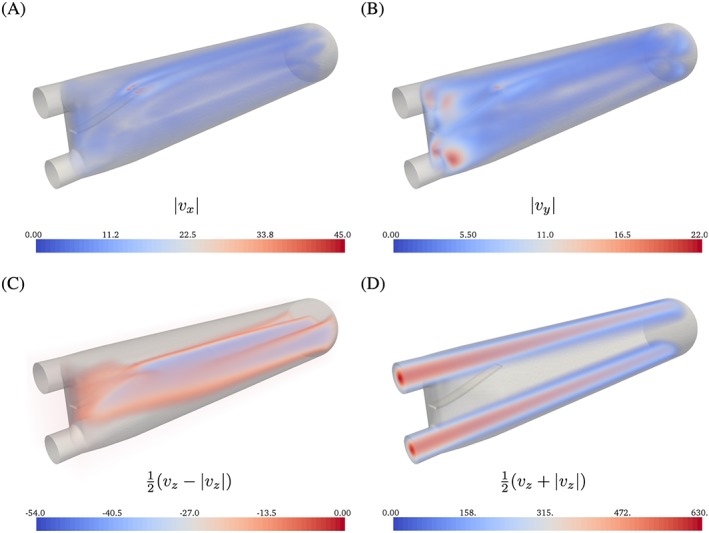
Phase I: Flow in the v x and v y components A, and B, is significantly smaller than in the v z component because of the incoming flow C, and D. Here, opacity for volume rendered flow components ranges from 0 to 1 in A, B, and D, and from 1 to 0 in C
Figure 8.
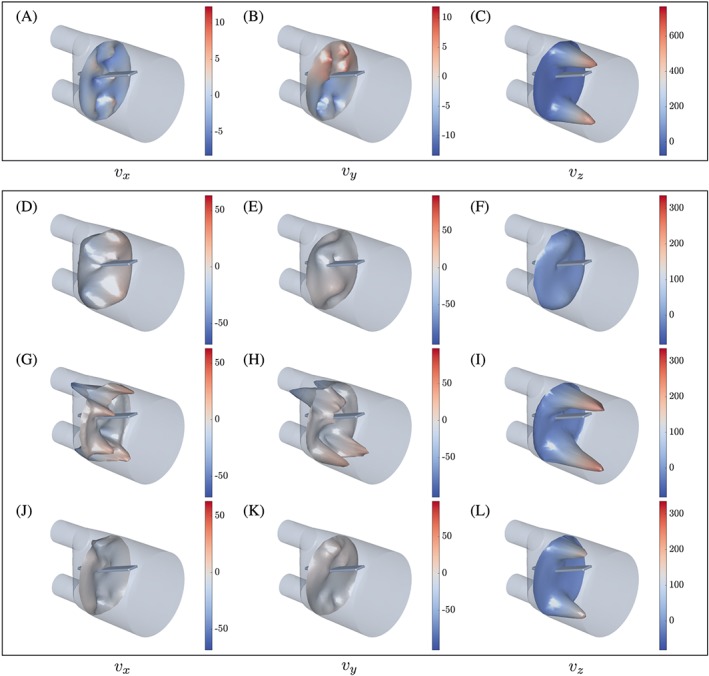
Predicted flow velocity components at z = 30 mm, obtained using the inf‐sup stable scheme, rl‐3. A‐C, Phase I at t = 200 s. Phase II at D‐F, t = 0.72 s; G‐I, t = 1.20 s; J‐L, t = 2.64 s. Flow patterns exhibit significant similarities with those observed in the experiment (see the study of Hessenthaler et al37)
3.3. Phase II experiment
Initially, the FSI system is at rest with the initial configuration corresponding to the hydrostatic equilibrium (that is, solid deformation due to gravitational forces). Parabolic inflow is prescribed at both inlets with peak values fit to experimental data (Figure 2B). A total of K = 10 cycles of the periodic inflow pulse seen in Figure 2B were simulated with time step size 1 ms. In the following, we refer to each cycle individually by using the notation s (with k = 1,2,…,10 and n = 0,1, … ,6000) to simplify comparison of corresponding time steps of two different cycles, eg, cycles k and K with and .
Starting from its initial position at the beginning of each cycle (referred to as resting position), the silicone filament is pushed downwards because of the impacting flow jet entering from the upper inlet (the time‐dependent position of the solid's centerline is given in Figure 9). Once flow decelerates because of decreased inflow, gravitational forces become more dominant, and the silicone filament moves back upwards performing a swing before reaching its resting position. The silicone filament follows the same repeatable deflection pattern as observed in the experiment; however, its resting position coincides with the deflection under zero inflow conditions, which was not found in the experiment. The relative displacement of the silicone filament (Figure 9A) is predicted well. Even though the maximum relative displacement at t ≈ 1.15 s is overestimated by approximately 1.8 mm (on average), the instant when the maximum relative displacement is reached is predicted precisely and the swing at t ≈ 1.59 s governed (however, a short delay is observed). While the deflection pattern is consistently predicted by the inf‐sup stable scheme on all refinement levels (irrespective of fluid domain length), the cG(1)cG(1) scheme yields a slightly different relative displacement pattern with a lagging solid motion, thus the silicone filament reaching its resting position later (Figure 9A). Further, the swing is less pronounced. We note that the numerical results in Figure 9B are Lagrangian positions. On the other hand, the position of the solid under flow conditions was obtained from intersecting the solid's centerline with MRI image planes at Z s ≈ 3 mm + s·10 mm, s = 0, …, 5. Thus, the position of the solid is not available for its entire length. Similarly, the position of the solid under zero inflow conditions was extracted from an MRI image plane at x ≈ 0 mm.
Figure 9.
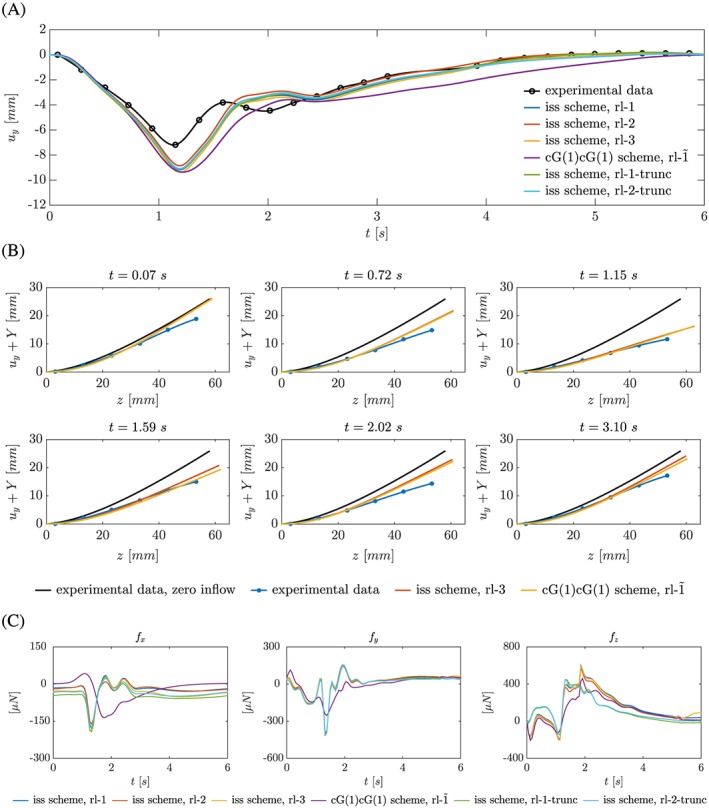
Phase II: A, Graph depicts the recorded relative displacement and predicted relative displacement (cycle 10) of the silicone filament at x = 0 mm, z ≈ 53 mm for all refinement levels and both schemes. The experimental data were approximated using spline interpolation. B, Graph shows snapshots of recorded position and predicted position (cycle 10, inf‐sup stable scheme, rl‐3) of the centerline of the solid at x = 0 mm (graph from the study of Hessenthaler et al37 modified). C, Forces f exerted onto the solid during cycle 10 computed from the Lagrange multiplier variable (Equation (16))
Flow patterns show strong similarities with those observed in the experiment. For example, a double Ω‐shape is observed at flow planes that drifts in negative x‐direction along the v z‐direction (Figure 10A) because of the non‐zero v x‐component at the inflow boundary. Further, the flow dynamics and local flow phenomena are governed well and compare well with the experimental data (compare Figure 8D‐L and the study of Hessenthaler et al37). We note that minor differences in the local flow velocities are observed if the flow domain is truncated as exemplified for the v y‐component in Figure 11B. For example, finer resolution yields a more symmetric prediction of the flow field, and stronger flow in the upward direction is observed at the truncation and near the tip of the silicone filament. However, it does not affect the position of the silicone filament (Figure 9A).
Figure 10.
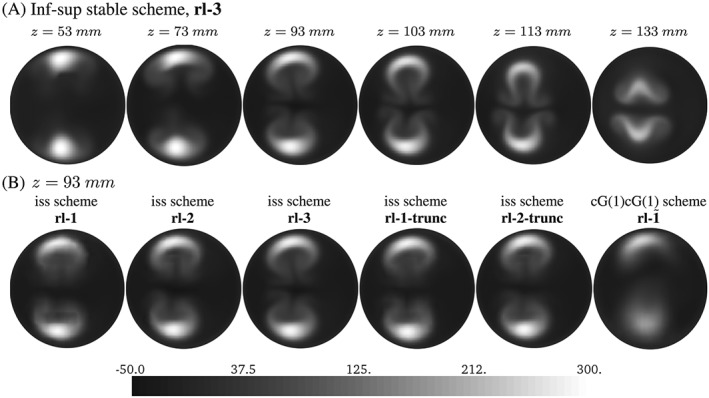
Phase II: Velocity v z at cross sections at t = 2.04 seconds. As was observed in the experiment,37 a double Ω‐shaped flow pattern develops from the two flow jets entering the flow domain, see Figure 11A
Figure 11.

A, MRI measurements37: Velocity v z at t ≈ 2.02 s. B, Phase II: Velocity v y at t = 3.96 s (volume rendered with opacity ranging from 0 to 1) obtained with the inf‐sup stable scheme and the elongated (left; rl‐3) and the truncated computational domain (right; rl‐1). Here, both domains are truncated at z = 160 mm to simplify comparison
Forces exerted onto the solid were computed by integrating the Lagrange multiplier variable (which represents the traction on the coupling boundary Ωλ),
| (16) |
where n λ, t λ, and s λ are linearly independent normal and tangent unit vectors on Ωλ. As Figure 9C illustrates, the f y component is negative for downward motion of the silicone filament and positive when it starts moving upwards after the largest relative displacement. For the f x and f y components, the truncation of the domain does not induce significant differences; however, the maximum force in f z‐direction during cycle 10 is observed earlier. Forces predicted by the cG(1)cG(1) scheme are significantly different; however, match with observations of relative solid motion (for example, the smaller f y force after the largest relative displacement is in good agreement with the silicone filament moving toward its resting position more slowly).
To investigate how quickly the FSI system reaches a periodic steady‐state, we employ Equations (14) and (15) to detect fluctuations in the solid motion and flow (assuming cycle 10 with the inf‐sup stable scheme and rl‐3 as the periodic steady‐state). Here, we consider the inf‐sup stable scheme and refinement levels 1‐3. As Figure 12A illustrates, the solid deformation reaches a periodic steady‐state after a small number of cycles on all refinement levels, and the same holds for the flow field, see Figure 12B,C. Although Figure 12B indicates that a different periodic steady‐state flow field was found on refinement levels 1 and 2, the quite large error is related to insufficient fluid domain refinement in regions of large velocity gradients (for example, note the more diffused appearance of the double Ω‐shape in Figure 10B) such that the error norm given in Equation (15) is a much more suitable measure of error in the predicted flow field (Figure 12C).
Figure 12.
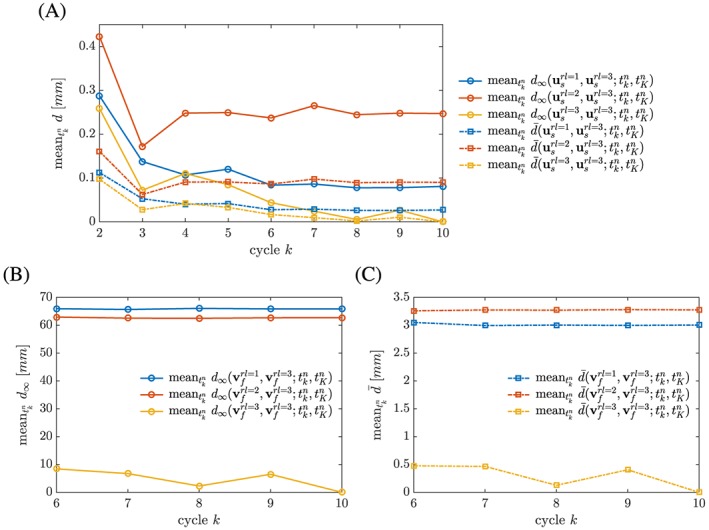
Phase II: The graph quantifies how quickly a periodic steady‐state is obtained for the displacement and flow field, u s and v f, depending on the refinement level in the fluid domain. Displacement and velocity, and , at given fluid domain refinement level for an intermediate cycle k is compared with displacement and velocity, and , at rl‐3 for final cycle K = 10 using error norms given in Equations (14) and (15) and computing the mean for given cycle
An increased average runtime for Phase II was observed for the cG(1)cG(1) scheme (Table 2), which arises from more Newton iterations per solve step. This stems from a general delay in rebuilding the Jacobian matrix (Algorithm 1). However, we note that the SNR solver parameters were tailored for the inf‐sup stable approach and subsequently used for both methods. Runtime would likely improve significantly for the cG(1)cG(1) approach with adaption of SNR solver.
4. DISCUSSION AND CONCLUSION
An inf‐sup stable FSI scheme has been validated and compared with, and a stabilized cG(1)cG(1) scheme (presented in Sections 2.4.2 and 2.4.3) has been validated using benchmark data obtained from a recently developed 3D FSI experiment.37
For the Phase I experiment, numerical results for predicted solid displacement and flow velocity were found to agree exceptionally well with available experimental data with solid deflection slightly overestimated/underestimated by the inf‐sup stable / cG(1)cG(1) scheme. On the other hand, numerical results for the Phase II experiment yield a good prediction of flow patterns (eg, Figure 10A), but it was found that a fine mesh resolution is required to sufficiently resolve flow regions with large velocity gradients (Figure 10B).
Overall, the inf‐sup stable scheme performed better in the considered cases regarding prediction of relative solid displacement or shape of flow patterns. Although, employed mesh resolution for the cG(1)cG(1) can be considered coarse.
It is recommended to simulate Phase I for about 30 seconds and Phase II for at least 5 cycles to reach an approximate (periodic) steady‐state with sufficient accuracy (with respect to initial / boundary conditions and error norms employed in this paper, eg, no significant fluctuations in solid motion and flow are observed; Figures 6 and 12). Results show that an elongation of the computational domain by 250 mm yields significantly better accuracy than an elongation by 50 mm. Further, mesh resolution has to be tuned depending on the phase of the benchmark because dynamic effects need to be governed in Phase II, thus requiring a finer fluid domain discretization as compared to Phase I. However, computational cost depends on the selected spatial mesh refinement of the fluid domain, as can be appreciated in Table 2. We note that the increased average runtime for Phase II in the case of the cG(1)cG(1) scheme stems from an observed increase in the number of Newton iterations. For the cG(1)cG(1) scheme, parameters to trigger rebuilding the Jacobian (see Algorithm 1) were chosen based on the inf‐sup stable scheme, however, delay the rebuild step in the transient test case and have thus to be tuned for better performance. From numerical experiments presented in this paper, we conclude that solid motion is not significantly altered by fluid mesh resolution; however, solid motion is influenced by the selected scheme.
Future investigations on the considered 3D FSI benchmark will include, for example, studying temporal convergence, sensitivity to the selected solid material law, spatial mesh refinement for the cG(1)cG(1) scheme, a second‐order time‐integration scheme, and sensitivity to outflow stabilization (preliminary results with β = 0.02 indicate no dependency on the outflow stabilization; however, final observations are likely to depend on the selected fluid domain length). Further, computational cost can potentially be decreased by optimizing the length of the computational domain, using a coarser solid mesh resolution and making use of the symmetry in the Phase I setup.
ACKNOWLEDGMENTS
D.N. would like to acknowledge funding from the BHF New Horizons program (NH/11/5/29058), the Engineering and Physical Sciences Research Council (EP/N011554/1), support from the Wellcome Trust EPSRC Centre of Excellence in Medical Engineering (WT 088641/Z/09/Z), and the NIHR Biomedical Research Centre at Guy's and St. Thomas' NHS Foundation Trust and KCL. The views expressed are those of the authors and not necessarily those of the NHS, the NIHR, or the DoH. The authors A.H. and O.R. would like to thank the German Research Foundation (DFG) for financial support of the project within the Cluster of Excellence in Simulation Technology (EXC 310/2) at the University of Stuttgart.
Hessenthaler A, Röhrle O, Nordsletten D. Validation of a non‐conforming monolithic fluid‐structure interaction method using phase‐contrast MRI. Int J Numer Meth Biomed Engng. 2017;33:e2845 https://doi.org/10.1002/cnm.2845
Footnotes
REFERENCES
- 1. Bai Y, Sun D, Lin J, Kennedy D, Williams F. Numerical aerodynamic simulations of a NACA airfoil using CFD with block‐iterative coupling and turbulence modelling. Int J Comput Fluid Dyn. 2012;26:119–132. [Google Scholar]
- 2. Bazilevs Y, Hsu M‐C, Kiendl J, Wüchner R, Bletzinger K‐U. 3D simulation of wind turbine rotors at full scale. Part II: fluid–structure interaction modeling with composite blades. Int J Numer Meth Fluids. 2011;65:236–253. [Google Scholar]
- 3. Varas JM, Philippens M, Meijer SR, Van Den Berg AC, Sibma PC Van Bree JLMJ De Vries DVWM . Physics of IED blast shock tube simulations for mTBI research. Traumatic Injuries in the Nervous System. 2011;82. [DOI] [PMC free article] [PubMed] [Google Scholar]
- 4. Medvitz RB, Reddy V, Deutsch S, Manning KB, Paterson EG. Validation of a CFD methodology for positive displacement LVAD analysis using PIV data. J Biomech Eng. 2009;131:11109. [DOI] [PMC free article] [PubMed] [Google Scholar]
- 5. McCormick M, Nordsletten DA, Kay D, Smith NP. Simulating left ventricular fluid‐solid mechanics through the cardiac cycle under LVAD support. J Comput Phys. 2013;244:80–96. [Google Scholar]
- 6. Taylor CA, Figueroa CA. Patient‐specific modeling of cardiovascular mechanics. Ann Rev Biomed Eng. 2009;11:109–134. [DOI] [PMC free article] [PubMed] [Google Scholar]
- 7. Smith N, de Vecchi A, McCormick M, et al. euHeart: personalized and integrated cardiac care using patient‐specific cardiovascular modelling. Interface Focus. 2011;1(3):349–364. [DOI] [PMC free article] [PubMed] [Google Scholar]
- 8. Aguado‐Sierra J, Krishnamurthy A, Villongco C,. et al Patient‐specific modeling of dyssynchronous heart failure: a case study. Prog Biophys Mol Biol. 2011;107:147–155. [DOI] [PMC free article] [PubMed] [Google Scholar]
- 9. Takizawa K, Bazilevs Y, Tezduyar TE. Space–time and ALE‐VMS techniques for patient‐specific cardiovascular fluid–structure interaction modeling. Arch Comput Meth Eng. 2012;19:171–225. [Google Scholar]
- 10. Peskin CS. Flow patterns around heart valves: a numerical method. J Comput Phys. 1972;10:252–271. [Google Scholar]
- 11. Glowinski R, Pan T‐W, Hesla TI, Joseph DD. A distributed Lagrange multiplier/fictitious domain method for particulate flows. Int J Multiphase Flow. 1999;25:755–794. [Google Scholar]
- 12. van Loon R, Anderson PD, van de Vosse FN. A fluid–structure interaction method with solid‐rigid contact for heart valve dynamics. J Comput Phys. 2006;217:806–823. [Google Scholar]
- 13. Donea J, Giuliani S, Halleux JP. An arbitrary Lagrangian‐Eulerian finite element method for transient dynamic fluid‐structure interactions. Comput Meth Appl Mech Eng. 1982;33:689–723. [Google Scholar]
- 14. Idelsohn SR, Onate E, Del Pin F. A Lagrangian meshless finite element method applied to fluid–structure interaction problems. Comput Struct. 2003;81:655–671. [Google Scholar]
- 15. Nordsletten D. Fluid‐Solid Coupling for the Simulation of Left Ventricular Mechanics (Dissertation). Oxford University;Oxford, UK: 2009. [Google Scholar]
- 16. Nordsletten D, Kay D, Smith N. A non‐conforming monolithic finite element method for problems of coupled mechanics. J Comput Phys. 2010;229:7571–7593. [Google Scholar]
- 17. Nordsletten D, McCormick M, Kilner PJ, et al. Fluid‐solid coupling for the investigation of diastolic and systolic human left ventricular function. Int J Numer Meth Biomed Eng. 2011;27:1017–1039. [Google Scholar]
- 18. Hadjicharalambous M, Lee J, Smith NP, Nordsletten D. A displacement‐based finite element formulation for incompressible and nearly‐incompressible cardiac mechanics. Comput Meth App Mech Eng. 2014;274:213–236. [DOI] [PMC free article] [PubMed] [Google Scholar]
- 19. Nordsletten D, Smith N, Kay D. A preconditioner for the finite element approximation to the arbitrary Lagrangian‐Eulerian Navier‐Stokes equations. SIAM J Sci Comput. 2010;32:521–543. [Google Scholar]
- 20. McCormick M, Nordsletten D, Lamata P, Smith NP. Computational analysis of the importance of flow synchrony for cardiac ventricular assist devices. Comput Biol Med. 2014;49:83–94. [DOI] [PMC free article] [PubMed] [Google Scholar]
- 21. Hoffman J, Jansson J, De Abreu RV. Adaptive modeling of turbulent flow with residual based turbulent kinetic energy dissipation. Comput Meth Appl Mech Eng. 2011;200:2758–2767. [Google Scholar]
- 22. Wall W, Ramm E. Fluid‐structure interaction based upon a stabilized (ALE) finite element method. 4th World Congress on Computational Mechanics: New Trends and Applications, CIMNE, Barcelona; 1998. [Google Scholar]
- 23. Wall W. Fluid‐struktur‐interaktion mit stabilisierten Finiten Elementen. Ph.D. Thesis, Institut für Baustatik Universität Stuttgart, 1999.
- 24. Mok DP. Partitionierte lösungsansätze in der Strukturdynamik und der Fluid‐Struktur‐Interaktion. Ph.D. Thesis, Institut für Baustatik Universität Stuttgart, 2001.
- 25. Turek S, Hron J. Proposal for Numerical Benchmarking of Fluid‐Structure Interaction Between an Elastic Object and Laminar Incompressible Flow. Berlin Heidelberg: Springer; 2006. [Google Scholar]
- 26. Hübner B, Walhorn E, Dinkler D. A monolithic approach to fluid–structure interaction using space–time finite elements. Comput Meth Appl Mech Eng. 2004;193:2087–2104. [Google Scholar]
- 27. Gomes JP, Lienhart H. Experimental study on a fluid‐structure interaction reference test case. In: Bungartz H‐J, Schäfer M, eds. Fluid‐structure interaction I –Modelling, Simulation, Optimization, Lecture Notes in Computational Science and Engineering, vol. 53,Berlin, Heidelberg:Springer; 2006:356–370. [Google Scholar]
- 28. Gomes JP, Lienhart H. Experimental benchmark: Self‐excited fluid‐structure interaction test cases In: Bungartz H‐J, Mehl M, Schäfer M, eds. Fluid‐Structure Interaction II – Modelling, Simulation, Optimization, Lecture Notes in Computational Science and Engineering, vol. 73, Berlin, Heidelberg: Springer; 2010:383–411. [Google Scholar]
- 29. Gomes JMP. Fluid‐structure interaction‐induced oscillation of flexible structures in uniform flows. Ph.D. Thesis, Lehrstuhl für Strömungsmechanik, Universität Erlangen‐Nürnberg, 2011.
- 30. Gomes JP, Yigit S, Lienhart H, Schäfer M. Experimental and numerical study on a laminar fluid‐structure interaction reference test case. J Fluids Struct. 2011;27:43–61. [Google Scholar]
- 31. Gomes JP, Lienhart H. Fluid–structure interaction‐induced oscillation of flexible structures in laminar and turbulent flows. J Fluid Mech. 2013;715:537–572. [Google Scholar]
- 32. Kalmbach A, Breuer M. Experimental PIV/v3v measurements of vortex‐induced fluid‐structure interaction in turbulent flow – A new benchmark FSI‐pfs‐2a. J Fluids Struct. 2013;42:369–387. [Google Scholar]
- 33. Kalmbach A, De Nayer G, Breuer M. A new turbulent three‐dimensional FSI Benchmark FSI‐PFS‐3A: definition and measurements. V Int Conf Comput Meth Mar Eng. 2013. [Google Scholar]
- 34. Kalmbach A. Experimental Investigations of Fluid‐Structure Interaction Benchmarks. Ph.D. Thesis, Professur für Strömungsmechanik, Helmut‐Schmidt Universität Hamburg, 2014.
- 35. De Nayer G, Kalmbach A, Breuer M, Sicklinger S, Wüchner R. Flow past a cylinder with a flexible splitter plate: a complementary experimental–numerical investigation and a new FSI test case (FSI‐pfs‐1a). Comput Fluids. 2014;99:18–43. [Google Scholar]
- 36. Gaddum N, Holub O, Hessenthaler A, Sinkus R, Nordsletten D. Benchmark experiment for validation of fluid‐structure interaction algorithms. Proceedings of the 4th International Conference on Computational and Mathematical Biomedical Engineering Paris, France; 2015: 781–784. [Google Scholar]
- 37. Hessenthaler A, Gaddum NR, Holub O, et al. Experiment for validation of fluid‐structure interaction models and algorithms. Int J Numer Meth Biomed Eng. 2016. doi: 10.1002/cnm.2848. [DOI] [PMC free article] [PubMed] [Google Scholar]
- 38. Hughes TJR, Liu WK, Zimmermann TK. Lagrangian‐Eulerian finite element formulation for incompressible viscous flows. Comput Meth Appl Mech Eng. 1981;29:329–349. [Google Scholar]
- 39. Huerta A, Liu WK. Viscous flow with large free surface motion. Comput Meth Appl Mech Eng. 1988;69:277–324. [Google Scholar]
- 40. Formaggia L, Nobile F. Stability analysis of second‐order time accurate schemes for ALE‐FEM. Comput Meth Appl Mech Eng. 2004;193:4097–4116. [Google Scholar]
- 41. Hirt CW, Amsden AA, Cook JL. An arbitrary Lagrangian‐Eulerian computing method for all flow speeds. J Comput Phys. 1974;14:227–253. [Google Scholar]
- 42. Nordsletten DA, Hunter PJ, Smith NP. Conservative and non‐conservative arbitrary Lagrangian–Eulerian forms for ventricular flows. Int J Numer Meth Fluids. 2008;56:1457–1463. [Google Scholar]
- 43. Holzapfel GA. Nonlinear Solid Mechanics. A Continuum Approach for Engineering, vol. 24. Chichester: Wiley; 2000. [Google Scholar]
- 44. Fu YB, Ogden RW. Nonlinear Elasticity: Theory and Applications, vol. 281. Cambridge, UK: Cambridge University Press; 2001. [Google Scholar]
- 45. Bazilevs Y, Gohean JR, Hughes TJR, Moser RD, Zhang Y. Patient‐specific isogeometric fluid–structure interaction analysis of thoracic aortic blood flow due to implantation of the Jarvik 2000 left ventricular assist device. Comput Meth Appl Mech Eng. 2009;198:3534–3550. [Google Scholar]
- 46. Moghadam ME, Bazilevs Y, Hsia TY, Vignon‐Clementel IE, Marsden AL. A comparison of outlet boundary treatments for prevention of backflow divergence with relevance to blood flow simulations. Comput Mech. 2011;48:277–291. [Google Scholar]
- 47. Lee J, Cookson A, Roy I, et al. Multi‐physics computational modeling in Cheart. SIAM J. Sci. Comput. 2016;38(3):C150–C178. [Google Scholar]
- 48. Amestoy PR, Duff IS, L'excellent J‐Y. Multifrontal parallel distributed symmetric and unsymmetric solvers. Comput Meth Appl Mech Eng. 2000;184:501–520. [Google Scholar]
- 49. Shamanskii V. A modification of Newton's method. Ukrainian Math J. 1967;19:118–122. [Google Scholar]


