

Abstract
Purpose
In order to fully benefit from the improved signal‐to‐noise and contrast‐to‐noise ratios at 9.4T, the challenges of inhomogeneity and the long acquisition time of high‐resolution 2D gradient‐recalled echo (GRE) imaging were addressed.
Theory and Methods
Flip angle homogenized excitations were achieved by parallel transmission (pTx) of 3‐spoke pulses, designed by magnitude least‐squares optimization in a slice‐by‐slice fashion; the acquisition time reduction was achieved by simultaneous multislice (SMS) pulses. The slice‐specific spokes complex radiofrequency scaling factors were applied to sinc waveforms on a per‐channel basis and combined with the other pulses in an SMS slice group to form the final SMS‐pTX pulse. Optimal spokes locations were derived from simulations.
Results
Flip angle maps from presaturation TurboFLASH showed improvement of flip angle homogenization with 3‐spoke pulses over CP‐mode excitation (normalized root‐mean‐square error [NRMSE] 0.357) as well as comparable excitation homogeneity across the single‐band (NRMSE 0.119), SMS‐2 (NRMSE 0.137), and SMS‐3 (NRMSE 0.132) 3‐spoke pulses. The application of the 3‐spoke SMS‐3 pulses in a 48‐slice GRE protocol, which has an in‐plane resolution of 0.28 × 0.28 mm, resulted in a 50% reduction of scan duration (total acquisition time 6:52 min including reference scans).
Conclusion
Time‐efficient flip angle homogenized high‐resolution GRE imaging at 9.4T was accomplished by using slice‐specific SMS‐pTx spokes excitations. Magn Reson Med 78:1050–1058, 2017. © 2016 The Authors Magnetic Resonance in Medicine published by Wiley Periodicals, Inc. on behalf of International Society for Magnetic Resonance in Medicine.
Keywords: ultrahigh‐field MR, parallel transmission, magnitude least‐squares, spokes pulses, simultaneous multislice, high‐resolution GRE SMS‐pTX
INTRODUCTION
Ultrahigh field (UHF) MRI presents great opportunities for the acquisition of images at unprecedented spatial resolutions and contrasts 1. To fully benefit from the improved signal‐to‐noise ratio (SNR) and contrast‐to‐noise ratio at UHF 2, 3, 4, 5, the well‐known problem of radiofrequency (RF) transmit ( ) inhomogeneity 6 must be overcome first. Solutions that are currently available include novel RF coil design 7, dielectric pads 8, 9, RF pulse design 10, parallel transmission (pTx) with RF shimming 11, 12, 13, 14, and transmit sensitivity encoding (SENSE) 15, 16, 17.
A previous simulation study at 9.4T has shown that only limited homogenization can be achieved with static RF shims alone 12. For 2D imaging, a class of pTx pulses called “spokes” has shown promising homogenization capability at both 7T 18 and 9.4T 19, 20. Spokes pulses typically consist of slice‐selective RF pulses, such as sinc or Shinnar‐Le Roux pulses 21, which are fully adjustable in both phase and amplitude per transmit channel, played out once or multiple times with interleave gradient blips between the subpulses to provide an effective spatial variation in phase as an extra degree of freedom. Static RF shim can be considered as the special case of one spoke. The phases and amplitudes required for the sinc subpulses can be found using magnitude least‐squares (MLS) optimization 22, while taking into account the subject‐specific B0 field distribution and complex channel‐by‐channel sensitivity maps with the formalism of the spatial domain method 15. For multislice acquisitions, slice‐ or slab‐specific spokes pulses have been shown to be beneficial for the overall achievable homogenization in the imaging region 11, 19, 23, 24, 25.
The method of flip angle homogenization using spokes pulses can be further extended to the case of parallel‐transmit simultaneous multislice (SMS‐pTX) excitations 26, and has been demonstrated for single‐spoke 24 and multispokes SMS‐pTX excitations 27, 28, 29. Simultaneous multislice (SMS) imaging allows the signals from simultaneously excited slices to be separated using parallel imaging techniques 30, 31, 32, 33, 34. SMS has in recent years received considerable attention, especially for its ability to significantly accelerate blood‐oxygen‐level dependent and diffusion‐weighted echo planar imaging acquisitions 35, 36, 37, where SMS and in‐plane accelerations [e.g., SENSE 38 or generalized autocalibrating partially parallel acquisitions (GRAPPA) 39] work in synergy to reduce scan time as well as reduce artifacts such as geometric distortion and T2‐blurring caused by long readout time. The application of SMS is also rapidly extending to the clinical domain for anatomical T2‐ and ‐weighted imaging and below the neck. [For a review of technique and applications, see Barth et al. 40 and Setsompop et al. 41]. SMS is particularly attractive for high‐resolution 2D multislice imaging, which is time‐consuming due to the high number of phase‐encoding lines and slices that need to be acquired. Furthermore, SMS offers an SNR‐per‐unit‐time advantage over within‐slice (in‐plane) undersampling, because the speed‐up is achieved by acquiring additional signal from the simultaneously excited slices rather than by skipping phase encoding lines. As a consequence, the use of SMS only incurs a g‐factor penalty in the reconstruction 30 but no bandwidth penalty due to fewer sampling points. In addition, there may be interslice signal leakage due to residual slice aliasing, which is qualitatively similar to the residual ghosting in SENSE‐ 38 or GRAPPA‐based 39 in‐plane reconstructions, but depends strongly on the choice of SMS reconstruction algorithm. In high‐resolution structural imaging, SMS allows an additional degree of freedom on how the time saved can be exploited: 1) it can be used simply to shorten the acquisition of a fixed number of slices; 2) it can be used to increase the volume coverage by increasing the number of slices acquired in a similar acquisition time as a single‐band protocol; or 3) the shortened acquisition time can be exchanged to improve SNR by acquiring multiple averages.
In this study, we addressed both the inhomogeneity and acquisition time challenges for 2D high‐resolution gradient‐recalled echo (GRE) imaging at 9.4T. Slice‐specific spokes pulses were designed within the framework of a previously demonstrated static field and flip angle homogenization workflow 42 and multiplexed on the scanner to form homogenized SMS excitation pulses. Here, we first provide a brief mathematical description of the pulse design. The number of spokes and the optimal parameters for spokes positions in the pulse design were determined from simulation results. Then, a novel SMS pulse flip angle mapping method based on presaturation TurboFLASH was used to demonstrate the successful design and application of these RF pulses. Finally, 9.4T in vivo 2D GRE images with an in‐plane resolution of 0.28 × 0.28 mm using 3‐spoke SMS (which demonstrates a 50% reduction in scan duration) as well as single band excitations were acquired and evaluated.
THEORY
Here, we briefly introduce the main mathematical formalism used in the spokes pulse design and the nomenclature that is used in Results and Discussion [for further details, see Grissom et al. 15, Setsompop et al. 22, and Sbrizzi et al. 43]. Using small tip‐angle approximation 10, spokes pulses optimization can be represented as a regularized MLS minimization problem through the spatial domain method 15:
| (1) |
where b is a column vector of length N Tx containing the complex RF scaling factors for each of the transmit channels, A is a N vox × N Tx system matrix containing the complex transmit sensitivity from each of the N Tx transmit coils in each of the N vox region of interest voxels with the phase induced from the local B0 offset and the spokes gradient blips, m is a column vector of length N vox representing the transverse magnetization target set in each of the N vox region of interest voxels, and is the Tikhonov regularization parameter as a means to regularize the global RF power. This problem can be solved efficiently by the multishift version of conjugate gradients for least‐squares (mCGLS) algorithm 43 together with the local variable exchange method 22. Using mCGLS, the solutions of a set of can be obtained simultaneously 43. MLS was chosen for this study instead of least‐squares because MLS has been shown to improve the achieved magnitude profile as well as lower the required RF power 22.
For a N spk‐spoke pulse (i.e., N spk > 1), the additional system matrices and the complex RF scaling factors for each of the N spk subpulses can be concatenated in the form
| (2) |
The elements in the system matrix for the k th spokes subpulse can be expressed as 44
| (3) |
where S ij is complex transmit sensitivity of the j th transmit coil in the i th voxel, is the position vector of the i th voxel relative to the gradient's isocenter, and is the excitation k‐space trajectory, which is the product of the gyromagnetic ratio, , and the total gradient moment from the end of the k th subpulse to the end of the pulse train (i.e., ), is the total number of discretized samples of the slice‐selective RF waveform of which the sample at the l th time point is , is the frequency offset in the i th voxel and is the RF dwell time.
To quantify the homogenization quality against the global RF power, we used the l 2‐norm of the complex RF scaling factor (i.e., ). To visualize the trade‐off in the set of solutions obtained by solving Equation [1] with mCGLS simultaneously for a set of values, the values of each solution can be plotted against their normalized root‐mean‐square error (NRMSE) values, yielding the so‐called L‐curves. In this study, the desired trade‐off between homogenization and global RF power was chosen by the point on the L‐curves where curvature is the highest 45.
For multislice acquisitions, the complex RF scaling factors b can be specifically optimized for each slice location by repeating the optimization routine with slice‐specific system matrices A. Once the optimal values of b are known for the whole slice stack, these complex scaling factors for each slice, spokes subpulse, and transmit channel can be taken into account when modulating a single‐band sinc waveform to generate the SMS‐pTX spokes pulses (i.e., the multiband pulses with slice and channel‐specific complex weights on the different frequency bands). The l th time point of the digital multiband waveform discretized in time for the j th transmit coil and the k th spokes subpulse is given by
| (4) |
where N sms is the SMS acceleration factor, is the l th time point of the single band sinc waveform, is the complex RF scaling factor of the j th transmit channel and k th subpulse for the i th slice in the SMS group, G is the amplitude of the slice‐selective gradient, is the RF dwell time, z i is the slice position of the i th slice in the SMS group, and is an extra slice‐dependent phase term that can be used to minimize the peak amplitude of the final multiband waveform 46, 47. When b is determined on a slice‐by‐slice basis, inherently there are interslice phase differences between the different frequency bands that depend on the slice location, the coil's profile, and the target pattern selected for the shim. Therefore, a look‐up table for would not guarantee to minimize the peak amplitude of the final SMS waveform. In this case, the phase factor can be determined with an additional optimization step that takes b into account 28, 48. In this study, Equation [4] is implemented directly into the imaging sequence to generate the SMS waveforms, with a dwell time of 1 µs, for each SMS slice‐group from a set of b input values. Also, the imaging sequence calculates the required gradient blips for traveling between the set spokes locations from a set of input values.
METHODS
Scanner Hardware
All scans were conducted on a 9.4T human MR scanner (Siemens Medical Solutions, Erlangen, Germany) with a head gradient set (AC84‐mk2, maximum amplitude 80 mT/m, maximum slew rate 333 T/m/s, inner diameter 36 cm) and a 16‐channel pTx system (1 kW per channel). A custom‐built 16‐channel dual‐row‐transmit 31‐channel receive array coil 49 was used for all experiments. Online local specific absorption rate (SAR) monitoring was achieved with a vendor‐provided system installed on the transmit chain 50. The SAR matrices used in the online monitoring were derived from an electromagnetic (EM) simulation 12 on an adult male model with a safety margin factor of 2, with limits set according to Hoffmann et al. 51, and compressed according to the virtual observation points (VOPs) method 52. The same VOP‐compressed SAR matrices were used in local SAR estimation during the off‐line spokes pulses optimization. All in vivo experiments were approved by the local ethics committee and were performed in accordance with internal safety guidelines; all participating volunteers gave written informed consent.
B0 and Acquisition
Subject‐specific B0 and maps are required for setting up the system matrices A as shown in Equation [3] in the spokes pulses optimization. The B0 field in a whole brain region of interest was homogenized using all first‐ and second‐order shim coils plus an extra four third‐order coils (Z3, Z2X, Z2Y, ZX2Y2) as described in Tse et al. 42. After shimming, B0 field maps for the pulse calculations were obtained from a dual‐echo 3D GRE sequence (repetition time TR = 30 ms, echo time TE1 = 1.00 ms, TE2 = 3.21 ms, nominal flip angle = 8o, nominal voxel size = 4 mm isotropic, matrix size = 50 × 50 × 44, bandwidth = 1560 Hz/pixel, total scan duration = 1:49 min). The phase difference of the two echoes was unwrapped 53 and scaled, and then fed into Equation [3] as . Complex sensitivity maps from all 16 transmit channels, the S term in Equation (3), were acquired with a transmit phase‐encoded 54, T2‐ and ‐compensated version of DREAM 55 (imaging train repetition time = 6.8 ms, TR = 7.5 s, TE1 = 2.22 ms, TE2 = 4.44 ms, nominal imaging flip angle = 7 °, nominal preparation pulse flip angle = 55.5 °, imaging slice thickness = 4 mm, slice separation = 8 mm, preparation pulse slice thickness = 8 mm, voxel size = 4 mm isotropic, matrix size = 64 × 56 × 12, bandwidth = 690 Hz/pixel, 32 transmit phase‐encoding steps, total scan duration = 4:00 min). A typical set of in vivo B0 and maps from our system is provided in Supporting Figure S1.
Spokes‐Pulse Calculation
The subject‐specific spokes pulses optimization was performed in MATLAB (MathWorks, Natick, Massachusetts, USA) on a separate multicore computer connected to the MR scanner. The target slice positions for the imaging scan were automatically exported from the scanner during the setup of the intended imaging protocol, for example, from the PreSat‐TFL or GRE sequence. In general, for flexibility, and S used in Equation [3] can be interpolated from each subject's B0 and maps to form the system matrices specific for the chosen imaging slice locations when they do not coincide with the slice positions of the maps 29. For the complex value entity S, the interpolations are done separately on amplitude and phase. Interpolations were not required in our experiments because the slice positions of our B0 and maps were aligned to the desired GRE imaging slice positions. The voxels in the region of interest (i.e., the rows in A and m in Eq. [1]) were defined by a brain mask in each of the slices. The brain mask was generated by FSL‐BET 56 from the sum of all magnitude images in the DREAM acquisition. To avoid solutions with voids, which could occur at local minima, a region‐growing algorithm was employed in the optimization process in which b was first solved for a small subregion at the center of the region of interest as defined by the brain mask, before being fed into the next iteration on a bigger subregion as the initial value 57.
For all the imaging experiments, the sinc subpulse in the spokes pulses were set to a bandwidth time product of 2.7 and the subpulses' peak‐to‐peak separation of 3.3 ms. Monopolar (fly‐back) slice‐selective gradient lobes were used in a 3‐spoke configuration with the positions of the spokes in the kx–ky plane (i.e., in Eq. [3]), fixed to , where k = 4.77 m−1 and = −168.8 °. The same values of k and as well as the number of spokes, N spk, were used in all imaging experiments. These values were predetermined from simulations using in vivo B0 and maps of five healthy volunteers. They were picked because they showed in the simulations that they provide the best figures of merit in flip angle homogeneity, global RF power efficiency, and reproducibility across subjects and slice positions. Further details of the simulations are provided in Supporting Figures S2–S6.
SMS Spokes‐Pulse Flip Angle Validation
DREAM provides a fast and B0 inhomogeneity insensitive way of collecting the sensitivity maps from the 16 individual transmit channels; however, its compact RF pulse layout and timing make it less convenient for mapping the flip angle of the computed spokes excitations, especially those with multiple subpulses. Instead, a presaturation TurboFLASH (PreSat‐TFL) sequence 58 was used to verify the flip angle distribution of the designed spokes pulses against the prediction from the optimization routine. The imaging parameters for PreSat‐TFL were: imaging train repetition time = 5.9 ms, TR = 10 s, TE = 2.24 ms, nominal imaging flip angle = 8 °, nominal preparation pulse flip angle = 40 °, imaging slice thickness = 1 mm, preparation pulse slice thickness = 2 mm, in‐plane voxel dimension = 4 × 4 mm, matrix size = 64 × 64 × 12, bandwidth = 690 Hz/pixel, and total scan duration = 20 s. For validating the flip angle distribution of the SMS spokes pulses, Equation [4] was programmed into the PreSat‐TFL to generate the SMS versions of the saturation pulses using the same sinc waveform and the same set of complex RF scaling factors b as in the single band version. The imaging pulse in the sequence was kept as a single band and imaged the slices within an SMS group one by one 29. This meant that the same SMS pulse needed to be played out multiple times in a period of TR. To allow sufficient T1 recovery time within an SMS slice group, the TR in the PreSat‐TFL was increased by a factor equal to the SMS factor when acquiring the saturated set of images.
GRE Acquisition with SMS‐pTX
During the in vivo imaging session, B0 and maps were first acquired as described above. The field map data as well as the position of the selected imaging slices were exported in real time from the scanner host to the pulse calculation computer for full slice‐specific spokes pulses optimization. The entire process, including the B0 and maps reconstructions, takes approximately 2 min. The complex RF scaling factors b were written into text files in the vendor‐defined format and exported directly back to the scanner host. PreSat‐TFL protocols were then run for CP‐mode and 3‐spoke with single‐band, SMS‐2, and SMS‐3 to map the flip angle achieved in the various configurations. The same set of complex RF scaling factors was then used to acquire ‐weighted images in single‐band as well as SMS‐2 and SMS‐3 using a CAIPIRINHA 30 enabled SMS GRE sequence. For GRE, the imaging parameters were TR = 400 ms, TE = 14 ms, flip angle = 17 °, slice thickness = 1 mm, number of slices = 12, in‐plane resolution = 0.28 × 0.28 mm, matrix size = 562 × 562 × 12, bandwidth = 70 Hz/pixel, CAIPIRINHA slice shift by gradient blips = FOV/2 for SMS‐2 and FOV/3 for SMS‐3, no in‐plane GRAPPA acceleration. The total acquisition times for the single‐band, SMS‐2, and SMS‐3 protocols were 3:44, 1:52, and 1:15 min, respectively. The 10‐s averaged maximum local SAR estimated for this protocol using the VOP‐compressed SAR matrices described above were 3.1, 6.3, and 9.5 W/kg for single‐band, SMS‐2, and SMS‐3, respectively. For comparison, the single‐band protocol was repeated with a CP‐mode excitation. The 10‐s averaged maximum local SAR estimated for the CP‐mode protocol was 3.8 W/kg. To demonstrate that an increased volume coverage can be achieved within a reasonable acquisition time by using SMS, the 3‐spoke SMS‐3 protocol was repeated with the number of slices increased to 48. The same 12 sets of slice‐by‐slice complex RF scaling factors were used as before, but they were applied to groups of four neighboring 1‐mm‐thick slices separated by 1‐mm gaps. The TR was increased from 400 to 1550 ms to accommodate the extra slices, leaving a total acquisition time of 4:50 min. The 10‐s averaged maximum local SAR estimated for this protocol was 9.8 W/kg. All SMS‐GRE images were reconstructed in MATLAB using slice‐GRAPPA 33 with a 7 × 6 kernel, using a low‐resolution (matrix size = 64 × 64) single‐band spokes acquisition as reference. The extra acquisition time for the reference and noise scans were 58 s for the 12‐slice protocols and 2:02 min for the 48‐slice protocol.
RESULTS
Figure 1 shows the flip angle maps of the measured CP‐mode (Fig. 1a), the 3‐spoke flip angle prediction from MLS optimization (Fig. 1b), as well as the flip angle maps of the actual single‐band (Fig. 1c), SMS‐2 (Fig. 1d), and SMS‐3 (Fig. 1e) excitations as verified by PreSat‐TFL. Excellent agreement can be observed visually between the predicted and measured flip angle distribution patterns. NRMSE were also estimated from the PreSat‐TFL flip angle maps. The NRMSE for the CP‐mode pulse was 0.357, and 0.119, 0.137 and 0.132 for the single‐band, SMS‐2 and SMS‐3 3‐spoke pulses, respectively. The predicted NRMSE from the MLS optimization for this particular 3‐spoke pulse setting was 0.082.
Figure 1.
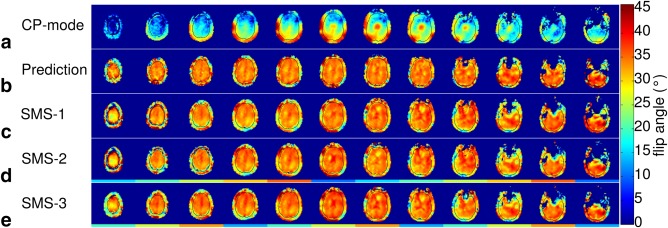
(a) CP‐mode flip angle map measured by PreSat‐TFL. (b) Predicted flip angle distribution from 3‐spoke pulse MLS optimization in a region of interest defined by a brain mask. (c–e) Single‐band (c), SMS‐2 (d), and SMS‐3 (e) 3‐spoke pulse flip angle maps measured by PreSat‐TFL. Horizontal color bars indicate the SMS grouping (i.e., slices with the same color bar are in the same SMS group). The black outlines in the images indicate the brain mask used in the spokes optimization. All the maps were acquired from the same subject within a single scanning session.
The same 3‐spoke pulses were successfully applied in the SMS‐pTX and CAIPIRINHA‐enabled GRE sequence to obtain high‐resolution in vivo ‐weighted images, which are presented in Figures 2, 3, and 4. The impact of inhomogeneous excitation on the GRE images can be seen in Figure 2. Comparing with the images acquired with the 3‐spoke excitation, the CP‐mode images showed unwanted spatial variations in contrast as well as SNR. voids or low‐intensity regions in the CP‐mode images left the finer structures (e.g., blood vessels) in the brain more difficult to observe. Subtle contrast in white matter due to fiber orientation can be seen more clearly in the flip angle homogenized 3‐spoke GRE images. In Figure 3, the images from single‐band, SMS‐2, and SMS‐3 showed highly comparable image quality, as well as their spatial variations, indicating that the multiplexing process described by Equation [4] did not interfere with the effectiveness of the 3‐spoke pulses in flip angle homogenization. This is also supported by the PreSat‐TFL flip angle maps, which show similar NRMSE for the single‐band, SMS‐2, and SMS‐3 (0.119, 0.137, and 0.132, respectively). Figure 4 shows the images from the 3‐spoke SMS‐3 48‐slice protocol. The spatial distributions of the 12 slab‐specific excitation pulses are shown in the far‐right column of Figure 4. Homogenous 3‐spoke SMS‐3 excitations were successfully applied in this protocol. Similar image quality to the 12‐slice protocols can be observed in these images without any noticeable degradation in homogeneity across any four slices that shared the same spokes pulses.
Figure 2.
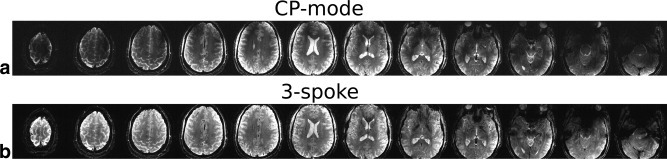
In vivo high‐resolution single‐band GRE images acquired with CP‐mode (a) and 3‐spoke (b) excitations.
Figure 3.
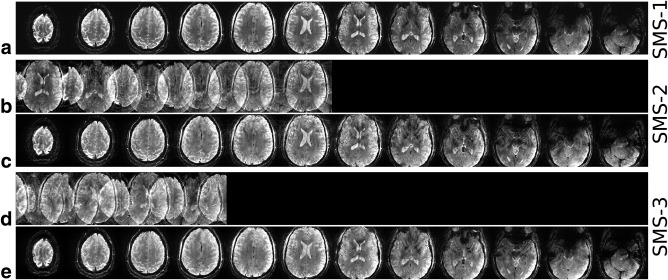
In vivo high‐resolution SMS‐GRE images acquired with 3‐spoke (a) single‐band, (b, c) SMS‐2 and (d, e) SMS‐3 excitations. Rows b and d show the SMS images before slice‐GRAPPA reconstruction.
Figure 4.
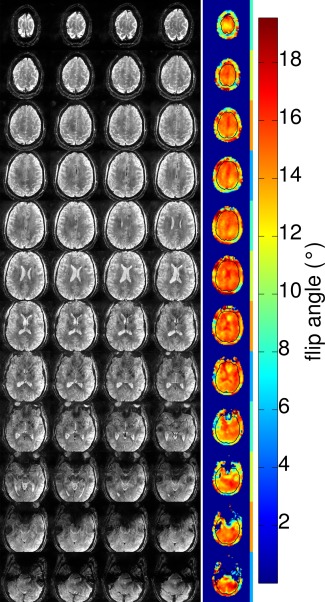
In vivo high‐resolution 3‐spoke SMS‐3 GRE images in a 48‐slice coverage. Each row of the GRE image slices were grouped together to share the same slab‐specific spokes pulses. The far‐right column shows the spatial distribution of the excitation flip angle. The black outlines in the flip angle maps indicate the brain mask used in the spokes optimization. The SMS slice grouping is indicated by the color bar to the right of the flip angle maps.
DISCUSSION
In this study, we demonstrated that high‐quality SMS‐pTX accelerated GRE images can be acquired at different SMS factors without compromising flip angle homogeneity. To our knowledge, this is the first time that multiband slice‐selective pulses with homogenized flip angle distribution was achieved in vivo with multiple spokes in a 16‐channel pTx system at 9.4T. Furthermore, we demonstrated that the absolute flip angle distribution of an SMS slice group can be mapped sequentially with a modified version of the PreSat‐TFL sequence 29. We harnessed the flip angle homogenization properties of spokes pulses in simultaneous multislice imaging with minimal modification in the RF optimization routine. By implementing the SMS waveform generation (Eq. [6]) directly into the MR sequence, the same set of spokes‐pulses solution b can be reused for generating pulses at different SMS factors. This offers the flexibility for on‐the‐fly adjustment of the imaging protocol at the scanner without having to recalculate the SMS‐pTX waveforms offline depending on the desired SMS factor.
At 9.4T, the severe flip angle inhomogeneity over the brain in the CP‐mode (Fig. 2a) necessitates the use of optimized excitations to ameliorate the voids and the unwanted variations in SNR and contrast within the imaging volume (Fig. 2). The remaining signal variations that can be seen in the 3‐spoke GRE images in Figures 2, 3, 4 are due to the receive sensitivity, which is difficult to normalize on systems without an extra transceiver coil, such as the body coil commonly found on clinical MR systems. The NRMSE was used as a metric on the flip angle inhomogeneity. The actual flip angle maps measured by PreSat‐TFL indicated a considerable improvement in homogeneity when using a 3‐spoke pulse over a CP‐mode excitation. This agreed well with the simulation results (see Supporting Figs. S2–S6) and also with previous studies at 9.4T 12, 42.
We observed a good match between the predicted flip angle distribution, and the flip angle maps measured by PreSat‐TFL at each SMS factor (Fig. 1). Nonetheless, a small systematic offset was observed between the predicted NRMSE value and the measured PreSat‐TFL values independent of SMS factor. Several experimental factors can contribute to this difference. First, in the current PreSat‐TFL setting, the imaging train excitation pulses are in CP‐mode and hence with a flip angle distribution profile same as that shown in Figure 1a. Although the CP‐mode profile in the imaging pulse is expected to be removed by dividing the reference image during the flip angle calculation, the SNR of the estimated flip angle is expected to vary spatially, especially in the regions where voids are prominent. Furthermore, other effects that could affect the magnetization phase during the pulse, such as eddy currents 20, were not considered in our implementation of spokes pulses optimization. To minimize the possibility of other phase effects on the spokes pulses, we used a monopolar slice‐selective gradient, despite this resulting in an increased subpulse spacing in comparison to a dual‐polarity excitation.
The number of spokes N spk and their positions in k‐space for the pulse optimization in imaging experiments were determined from simulation results on five sets of previously obtained B0 and maps. When considering N spk, cases of N spk ≥ 4 were not considered, because their overall pulse duration would be greater than 10 ms with the 3.3‐ms subpulse peak‐to‐peak separation setting. Long overall pulse duration reduces the flexibility in setting the TR or the number of slices in the imaging protocols. Also, the T2 relaxation time of gray matter and white matter at 9.4T were estimated to be 35 and 29 ms, respectively 59. Hence, for long overall pulse duration, the effective transverse relaxation needs be considered in the pulse optimization, which is not the case in our current implementation.
The benefits of slice‐ or slab‐specific spokes pulses have been reported previously (11,23–26,29) and also can be seen in our simulation results (Supporting Figs. S2–S6). The individual slice spokes pulses optimization can be performed in parallel on a multicore computer because no communication is required between the calculations of different slices, thus incurring no penalty in the overall optimization time. In this study, the spokes pulses' slice‐specificity was limited to the complex RF scaling factor b only. The same fixed set of spokes positions in k‐space were used for all slices. While slice‐specific optimization of the spokes location may in principle allow marginal additional improvements, this will only work for single‐band excitations. For SMS‐pTX pulses, all the slices within an SMS slice group have to share the same excitation k‐space trajectory, and therefore the spokes positions were fixed for all slices, so that a given set of b can be used to compute pulses for any SMS factor. The deviation from the theoretical optimal NRMSE by having all slices sharing the same excitation k‐space trajectory as well as its non–subject‐specific determination are expected to be small, as indicated by our simulations of five different sets of in vivo B0 and maps at different 12 slice positions. Due to the limitation of the maximum number of RF pulses that can be handled by a pulse sequence, the SMS‐GRE protocol with 48 slices (Fig. 4) was run using a set of 12 slab‐specific 3‐spoke complex RF factors, i.e., groups of 4 neighboring slices (forming a thin slab of 8 mm) shared the same RF pulses. A previous simulation study has demonstrated the validity of this approach 25.
The optimal spokes configuration, namely the number of spokes, N spk, and the spoke positions in the excitation kx‐ky plane, , were predetermined from simulation results of five sets of in vivo B0 and maps. One should be cautious in overinterpreting the meaning of the results from these spokes optimization parameters and extrapolating them to other experimental settings, because the simulations were conducted specifically for this particular field strength, coil design, anatomical region, and slice arrangement. For instance, another study with a different head coil geometry at 7T found that a 3‐spoke pulse brings only marginal benefit over a 2‐spoke pulse 60 [for a more general approach in joint optimization of complex RF scaling factors and k‐space trajectory, see Cao et al. 61 and Dupas et al. 62]. A recent study has shown that by using a more advanced twisted spokes trajectory, the subpulse duration can be further shortened while achieving better slice profile, homogenization, and robustness against off‐resonance 63.
RF exposure to volunteers is a major concern in UHF MR, especially in combination with the use of parallel transmission. Using VOP‐compressed SAR matrices estimated from EM simulation, maximum local SAR was predicted for a particular scan protocol immediately after the pulse optimization step. This allowed scanner operators to readjust scan parameters when the prediction exceeded the 10‐s or 6‐min limits (20 W/kg and 10 W/kg, respectively, according to IEC 60601‐2‐33). As shown above, the maximum local SAR of the SMS‐GRE protocols used here were below these limits because of the low flip angle used. In our current implementation, the global RF power is regularized as described in Equation [1]. The regularization can be extended to local SAR as well by using the VOP‐compressed SAR matrices 64. For other imaging protocols that are more demanding in terms of SAR, local and global SAR‐constrained RF optimizations are recommended 27, 62, 65, 66.
The comparable contrasts and SNR across the single‐band, SMS‐2, and SMS‐3 GRE images in Figure 3 indicate that SMS is a desirable method to reduce acquisition time without excessive penalty on image quality. Because only a short prescan is required for the reference scans, all the SMS protocols saved time compared with the single‐band protocol. For example, the demonstrated SMS‐3 protocol with a 48‐slice near full‐brain coverage (Fig. 4) took 6:52 min including the reference scans, instead of the 14:30 min with a single‐band protocol. The shorter acquisition time can increase subject compliance and reduce potential subject‐induced motion artifacts. One of the main applications of UHF MRI is high‐resolution imaging because of the improved SNR, and the shortened acquisition time is particularly attractive for this type of application. When the acceleration provided by SMS is used to reduce TR, the effect of the shorter TR on T1 weighting should be considered. For small flip angle protocols, such as those in this study, this effect is very small. The maximum reduction in the steady state incoherent signal among all the protocols used here was estimated to be 25% [from single‐band of 0.4s TR to SMS‐3, using a flip angle of 17 ° and 1.4 s and 2.0 s as the T1 values at 9.4T for white matter and gray matter, respectively 59]. In Figure 3, no visible SNR or contrast difference can be seen across the single‐band, SMS‐2, and SMS‐3 images. By taking the g‐factors and the reduction of steady state incoherent signal into account, SNR can be potentially boosted by increasing the number of averaging while keeping the total acquisition time low using SMS protocols.
In conclusion, time‐efficient flip angle homogenized high‐resolution GRE imaging at 9.4T was achieved by using slice‐specific SMS‐pTx spokes excitations. Three‐spoke pulses provided a great improvement in excitation homogeneity over CP‐mode (from NRMSE > 0.35 to NRMSE < 0.14), which ameliorated ‐related artifacts in GRE images. These 3‐spoke pulses were multiplexed for simultaneous multislice imaging without the loss of excitation homogeneity, which allowed a near full‐brain coverage high‐resolution GRE protocol to be run in just under 7 min, which is a clinically acceptable scan duration. The absolute spatial flip angle distributions of these SMS spokes pulses were validated with a modified PreSat‐TFL sequence.
Supporting information
Fig. S1. (a) magnitude maps from each of the transmit channels. (b) phase maps from each of the transmit channels. (c) B0 distribution after shimming. In all the sub‐figures, the left column is the sagittal view, the middle column is the coronal view, and the right column is the transversal view.
Fig. S2. The gradient waveforms and the k‐space trajectories for (a) N spk = 1, (b) N spk = 2, and (c) N spk = 3. Monopolar slice‐selective gradient was used where the sinc or the multiband RF pulses were played out only during the plateau of the negative lobes of the slice‐selective gradient Gz.
Fig. S3. Two‐spoke simulation results mapped against k and . (a) Mean NRMSE. (b) Mean . (c) Standard error of NRMSE. (d) Standard error of . At k = 6.52 m−1 and = 0°, the simulation results have low values for all these four figures of merit.
Fig. S4. 3‐spoke simulation results mapped against k and . (a) Mean NRMSE. (b) Mean . (c) Standard error of NRMSE. (d) Standard error of . At k = 4.77 m−1 and = −168.8°, the simulation results have low values for all these four figures of merit.
Fig. S5. Summary of NRMSE and for N spk = 1, 2, and 3. For N spk = 1, the position of the spoke is located at the center of the kx–ky plane. For N spk = 2 and 3, the results are taken from the optimal spoke positions as found in Supporting Figs. S3 and S4. The spokes are at with k = 6.52 m−1 and = 0° for N spk = 2; and at with k = 4.77 m−1 and = −168.8° for N spk = 3.
Fig. S6. Summary of NRMSE and for various slice group size.
ACKNOWLEDGMENTS
We thank Gunamony Shajan, Jens Hoffman, Christian Mirkes, and MPI Tuebingen for providing the RF coil and its EM simulation; René Finger and Ron Hellenbrand for their support in RF coil maintenance; Alessandro Sbrizzi, Michael Poole, and Daniel Brenner for their codes used in the RF optimization routine; and Andy Stenger for helpful comments on the manuscript. Scan time was supported by Scannexus (development project: dev_b0_b1) and intramural MBIC funding (project: F0006B03).
REFERENCES
- 1. Budde J, Shajan G, Scheffler K, Pohmann R. Ultra‐high resolution imaging of the human brain using acquisition‐weighted imaging at 9.4T. Neuroimage 2014;86:592–598. [DOI] [PubMed] [Google Scholar]
- 2. Duyn JH. The future of ultra‐high field MRI and fMRI for study of the human brain. Neuroimage 2012;62:1241–1248. [DOI] [PMC free article] [PubMed] [Google Scholar]
- 3. Edelstein WA, Glover GH, Hardy CJ, Redington RW. The intrinsic signal‐to‐noise ratio in NMR imaging. Magn Reson Med 1986;3:604–618. [DOI] [PubMed] [Google Scholar]
- 4. Hoult DI, Richards RE. The signal‐to‐noise ratio of the nuclear magnetic resonance experiment. J Magn Reson 1976;24:71–85. [DOI] [PubMed] [Google Scholar]
- 5. Pohmann R, Speck O, Scheffler K. Signal‐to‐noise ratio and MR tissue parameters in human brain imaging at 3, 7, and 9.4 Tesla using current receive coil arrays. Magn Reson Med 2016;75:801–809. [DOI] [PubMed] [Google Scholar]
- 6. Van de Moortele P‐F, Akgun C, Adriany G, Moeller S, Ritter J, Collins CM, Smith MB, Vaughan JT, Ugurbil K. B1 destructive interferences and spatial phase patterns at 7 T with a head transceiver array coil. Magn Reson Med 2005;54:1503–1518. [DOI] [PubMed] [Google Scholar]
- 7. Adriany G, Van de Moortele P‐F, Ritter J, Moeller S, Auerbach EJ, Akgün C, Snyder CJ, Vaughan T, Ugurbil K. A geometrically adjustable 16‐channel transmit/receive transmission line array for improved RF efficiency and parallel imaging performance at 7 Tesla. Magn Reson Med 2008;59:590–597. [DOI] [PubMed] [Google Scholar]
- 8. O'Brien KR, Magill AW, Delacoste J, Marques JP, Kober T, Fautz HP, Lazeyras F, Krueger G. Dielectric pads and low‐ B1 + adiabatic pulses: complementary techniques to optimize structural T1 w whole‐brain MP2RAGE scans at 7 tesla. J Magn Reson Imaging 2014;40:804–812. [DOI] [PubMed] [Google Scholar]
- 9. Teeuwisse WM, Brink WM, Webb AG. Quantitative assessment of the effects of high‐permittivity pads in 7 Tesla MRI of the brain. Magn Reson Med 2012;67:1285–1293. [DOI] [PubMed] [Google Scholar]
- 10. Pauly J, Nishimura D, Macovski A. A k‐space analysis of small‐tip‐angle excitation. J Magn Reson 2011;81:43–56. [DOI] [PubMed] [Google Scholar]
- 11. Curtis AT, Gilbert KM, Klassen LM, Gati JS, Menon RS. Slice‐by‐slice B1 + shimming at 7 T. Magn Reson Med 2012;68:1109–1116. [DOI] [PubMed] [Google Scholar]
- 12. Hoffmann J, Shajan G, Scheffler K, Pohmann R. Numerical and experimental evaluation of RF shimming in the human brain at 9.4 T using a dual‐row transmit array. MAGMA 2014;27:373–386. [DOI] [PubMed] [Google Scholar]
- 13. Mao W, Smith MB, Collins CM. Exploring the limits of RF shimming for high‐field MRI of the human head. Magn Reson Med 2006;56:918–922. [DOI] [PMC free article] [PubMed] [Google Scholar]
- 14. Vaughan T, DelaBarre L, Snyder C, et al. 9.4T human MRI: preliminary results. Magn Reson Med 2006;56:1274–1282. [DOI] [PMC free article] [PubMed] [Google Scholar]
- 15. Grissom W, Yip C‐y, Zhang Z, Stenger VA, Fessler JA, Noll DC. Spatial domain method for the design of RF pulses in multicoil parallel excitation. Magn Reson Med 2006;56:620–629. [DOI] [PubMed] [Google Scholar]
- 16. Katscher U, Börnert P, Leussler C, van den Brink JS. Transmit SENSE. Magn Reson Med 2003;49:144–150. [DOI] [PubMed] [Google Scholar]
- 17. Zhu Y. Parallel excitation with an array of transmit coils. Magn Reson Med 2004;51:775–784. [DOI] [PubMed] [Google Scholar]
- 18. Setsompop K, Alagappan V, Gagoski B, et al. Slice‐selective RF pulses for in vivo B1 + inhomogeneity mitigation at 7 tesla using parallel RF excitation with a 16‐element coil. Magn Reson Med 2008;60:1422–1432. [DOI] [PMC free article] [PubMed] [Google Scholar]
- 19. Tse DHY, Brenner D, Guerin B, Poser BA. High Resolution GRE at 9.4T Using Spokes Pulses. In Proceedings of the 23rd Annual Meeting of ISMRM, Toronto, Canada, 2015. p. 546.
- 20. Wu X, Adriany G, Ugurbil K, Van de Moortele PF. Correcting for strong eddy current induced B0 modulation enables two‐spoke RF pulse design with parallel transmission: demonstration at 9.4T in the human brain. PLoS One 2013;8:e78078. [DOI] [PMC free article] [PubMed] [Google Scholar]
- 21. Pauly J, Le Roux P, Nishimura D, Macovski A. Parameter relations for the Shinnar‐Le Roux selective excitation pulse design algorithm [NMR imaging]. IEEE Trans Med Imaging 1991;10:53–65. [DOI] [PubMed] [Google Scholar]
- 22. Setsompop K, Wald LL, Alagappan V, Gagoski BA, Adalsteinsson E. Magnitude least squares optimization for parallel radio frequency excitation design demonstrated at 7 Tesla with eight channels. Magn Reson Med 2008;59:908–915. [DOI] [PMC free article] [PubMed] [Google Scholar]
- 23. Poser BA, Tse DHY. 2D EPI at 9.4T with Slice‐Specific Spokes Pulse RF Excitation for B1 + Homogenisation. In Proceedings of the 23rd Annual Meeting of ISMRM, Toronto, Canada, 2015. p. 593.
- 24. Wu X, Schmitter S, Auerbach EJ, Moeller S, Ugurbil K, Van de Moortele PF. Simultaneous multislice multiband parallel radiofrequency excitation with independent slice‐specific transmit B1 homogenization. Magn Reson Med 2013;70:630–638. [DOI] [PMC free article] [PubMed] [Google Scholar]
- 25. Wu X, Schmitter S, Auerbach EJ, Ugurbil K, Van de Moortele PF. A generalized slab‐wise framework for parallel transmit multiband RF pulse design. Magn Reson Med 2016;75:1444–1456. [DOI] [PMC free article] [PubMed] [Google Scholar]
- 26. Poser BA, Anderson RJ, Guerin B, Setsompop K, Deng W, Mareyam A, Serano P, Wald LL, Stenger VA. Simultaneous multislice excitation by parallel transmission. Magn Reson Med 2014;71:1416–1427. [DOI] [PMC free article] [PubMed] [Google Scholar]
- 27. Guerin B, Setsompop K, Ye H, Poser BA, Stenger AV, Wald LL. Design of parallel transmission pulses for simultaneous multislice with explicit control for peak power and local specific absorption rate. Magn Reson Med 2015;73:1946–1953. [DOI] [PMC free article] [PubMed] [Google Scholar]
- 28. Sharma A, Bammer R, Stenger VA, Grissom WA. Low peak power multiband spokes pulses for B1 (+) inhomogeneity‐compensated simultaneous multislice excitation in high field MRI. Magn Reson Med 2015;74:747–755. [DOI] [PMC free article] [PubMed] [Google Scholar]
- 29. Tse DHY, Wiggins CJ, Poser BA. High Resolution Simultaneous Multi‐Slice GRE at 9.4T Using 16‐Channel SMS‐pTX Spokes Excitations for Slice‐By‐Slice Flip‐Angle Homogenisation. In Proceedings of the 24th Annual Meeting of ISMRM, Singapore, Singapore, 2016. p. 615.
- 30. Breuer FA, Blaimer M, Heidemann RM, Mueller MF, Griswold MA, Jakob PM. Controlled aliasing in parallel imaging results in higher acceleration (CAIPIRINHA) for multi‐slice imaging. Magn Reson Med 2005;53:684–691. [DOI] [PubMed] [Google Scholar]
- 31. Larkman DJ, Hajnal JV, Herlihy AH, Coutts GA, Young IR, Ehnholm G. Use of multicoil arrays for separation of signal from multiple slices simultaneously excited. J Magn Reson Imaging 2001;13:313–317. [DOI] [PubMed] [Google Scholar]
- 32. Moeller S, Yacoub E, Olman CA, Auerbach E, Strupp J, Harel N, Ugurbil K. Multiband multislice GE‐EPI at 7 tesla, with 16‐fold acceleration using partial parallel imaging with application to high spatial and temporal whole‐brain fMRI. Magn Reson Med 2010;63:1144–1153. [DOI] [PMC free article] [PubMed] [Google Scholar]
- 33. Setsompop K, Gagoski BA, Polimeni JR, Witzel T, Wedeen VJ, Wald LL. Blipped‐controlled aliasing in parallel imaging for simultaneous multislice echo planar imaging with reduced g‐factor penalty. Magn Reson Med 2012;67:1210–1224. [DOI] [PMC free article] [PubMed] [Google Scholar]
- 34. Zahneisen B, Ernst T, Poser BA. SENSE and simultaneous multislice imaging. Magn Reson Med 2015;74:1356–1362. [DOI] [PMC free article] [PubMed] [Google Scholar]
- 35. Feinberg DA, Moeller S, Smith SM, Auerbach E, Ramanna S, Gunther M, Glasser MF, Miller KL, Ugurbil K, Yacoub E. Multiplexed echo planar imaging for sub‐second whole brain FMRI and fast diffusion imaging. PLoS One 2010;5:e15710. [DOI] [PMC free article] [PubMed] [Google Scholar]
- 36. Setsompop K, Kimmlingen R, Eberlein E, et al. Pushing the limits of in vivo diffusion MRI for the Human Connectome Project. Neuroimage 2013;80:220–233. [DOI] [PMC free article] [PubMed] [Google Scholar]
- 37. Ugurbil K, Xu J, Auerbach EJ, et al. Pushing spatial and temporal resolution for functional and diffusion MRI in the Human Connectome Project. Neuroimage 2013;80:80–104. [DOI] [PMC free article] [PubMed] [Google Scholar]
- 38. Pruessmann KP, Weiger M, Scheidegger MB, Boesiger P. SENSE: sensitivity encoding for fast MRI. Magn Reson Med 1999;42:952–962. [PubMed] [Google Scholar]
- 39. Griswold MA, Jakob PM, Heidemann RM, Nittka M, Jellus V, Wang J, Kiefer B, Haase A. Generalized autocalibrating partially parallel acquisitions (GRAPPA). Magn Reson Med 2002;47:1202–1210. [DOI] [PubMed] [Google Scholar]
- 40. Barth M, Breuer F, Koopmans PJ, Norris DG, Poser BA. Simultaneous multislice (SMS) imaging techniques. Magn Reson Med 2016;75:63–81. [DOI] [PMC free article] [PubMed] [Google Scholar]
- 41. Setsompop K, Feinberg DA, Polimeni JR. Rapid brain MRI acquisition techniques at ultra‐high fields. NMR Biomed 2016;29:1198–1221. [DOI] [PMC free article] [PubMed] [Google Scholar]
- 42. Tse DHY, Wiggins CJ, Ivanov D, Brenner D, Hoffmann J, Mirkes C, Shajan G, Scheffler K, Uludag K, Poser BA. Volumetric imaging with homogenised excitation and static field at 9.4 T. MAGMA 2016;29:333–345. [DOI] [PMC free article] [PubMed] [Google Scholar]
- 43. Sbrizzi A, Hoogduin H, Lagendijk JJ, Luijten P, Sleijpen GL, van den Berg CA. Time efficient design of multi dimensional RF pulses: application of a multi shift CGLS algorithm. Magn Reson Med 2011;66:879–885. [DOI] [PubMed] [Google Scholar]
- 44. Grissom WA, Khalighi MM, Sacolick LI, Rutt BK, Vogel MW. Small‐tip‐angle spokes pulse design using interleaved greedy and local optimization methods. Magn Reson Med 2012;68:1553–1562. [DOI] [PMC free article] [PubMed] [Google Scholar]
- 45. Johnston PR, Gulrajani RM. Selecting the corner in the L‐curve approach to Tikhonov regularization. IEEE Trans Biomed Eng 2000;47:1293–1296. [DOI] [PubMed] [Google Scholar]
- 46. Wong E. Optimized Phase Schedules for Minimizing Peak RF Power in Simultaneous Multi‐Slice RF Exicitation Pulses. In Proceedings of the 20th Annual Meeting of ISMRM, Melbourne, Victoria, Australia, 2012. p. 2209.
- 47. Hennig J. Chemical shift imaging with phase‐encoding RF pulses. Magn Reson Med 1992;25:289–298. [DOI] [PubMed] [Google Scholar]
- 48. Sbrizzi A, Poser BA, Tse DHY, Hoogduin H, Luijten PR, van den Berg CA. RF peak power reduction in CAIPIRINHA excitation by interslice phase optimization. NMR Biomed 2015;28:1393–1401. [DOI] [PubMed] [Google Scholar]
- 49. Shajan G, Kozlov M, Hoffmann J, Turner R, Scheffler K, Pohmann R. A 16‐channel dual‐row transmit array in combination with a 31‐element receive array for human brain imaging at 9.4 T. Magn Reson Med 2014;71:870–879. [DOI] [PubMed] [Google Scholar]
- 50. Gumbrecht R, Fontius U, Adolf H, Benner T, Schmitt F, Adalsteinsson E, Wald LL, H.‐P. F . Online Local SAR Supervision for Transmit Arrays at 7T. In Proceedings of the 21st Annual Meeting of ISMRM, Salt Lake City, Utah, USA, 2013. p. 2146.
- 51. Hoffmann J, Henning A, Giapitzakis IA, Scheffler K, Shajan G, Pohmann R, Avdievich NI. Safety testing and operational procedures for self‐developed radiofrequency coils. NMR Biomed 2016;29:1131–1144. [DOI] [PubMed] [Google Scholar]
- 52. Eichfelder G, Gebhardt M. Local specific absorption rate control for parallel transmission by virtual observation points. Magn Reson Med 2011;66:1468–1476. [DOI] [PubMed] [Google Scholar]
- 53. Cusack R, Papadakis N. New robust 3‐D phase unwrapping algorithms: application to magnetic field mapping and undistorting echoplanar images. Neuroimage 2002;16:754–764. [DOI] [PubMed] [Google Scholar]
- 54. Tse DHY, Poole MS, Magill AW, Felder J, Brenner D, Jon Shah N. Encoding methods for B1(+) mapping in parallel transmit systems at ultra high field. J Magn Reson 2014;245:125–132. [DOI] [PubMed] [Google Scholar]
- 55. Nehrke K, Versluis MJ, Webb A, Bornert P. Volumetric B1 (+) mapping of the brain at 7T using DREAM. Magn Reson Med 2014;71:246–256. [DOI] [PubMed] [Google Scholar]
- 56. Smith SM. Fast robust automated brain extraction. Hum Brain Mapp 2002;17:143–155. [DOI] [PMC free article] [PubMed] [Google Scholar]
- 57. Poole MS, Tse DHY, Vahedipour K, Shah NJ. A Region Growing Algorithm for Robust kt‐Points B1 + Homogenisation at 9.4T. In Proceedings of the 22nd Annual Meeting of ISMRM, Milan, Italy, 2014. p. 944.
- 58. Chung S, Kim D, Breton E, Axel L. Rapid B1 + mapping using a preconditioning RF pulse with TurboFLASH readout. Magn Reson Med 2010;64:439–446. [DOI] [PMC free article] [PubMed] [Google Scholar]
- 59. Zhu J, Klarhöfer M, Santini F, Scheffler K, Bieri O. Relaxation Measurements in Brain Tissue at Field Strengths Between 0.35T and 9.4T. In Proceedings of the 22nd Annual Meeting of ISMRM, Milan, Italy, 2014. p. 3208.
- 60. Schmitter S, Wu X, Auerbach EJ, Adriany G, Pfeuffer J, Hamm M, Ugurbil K, van de Moortele PF. Seven‐tesla time‐of‐flight angiography using a 16‐channel parallel transmit system with power‐constrained 3‐dimensional spoke radiofrequency pulse design. Invest Radiol 2014;49:314–325. [DOI] [PMC free article] [PubMed] [Google Scholar]
- 61. Cao Z, Donahue MJ, Ma J, Grissom WA. Joint design of large‐tip‐angle parallel RF pulses and blipped gradient trajectories. Magn Reson Med 2016;75:1198–1208. [DOI] [PMC free article] [PubMed] [Google Scholar]
- 62. Dupas L, Massire A, Amadon A, Vignaud A, Boulant N. Two‐spoke placement optimization under explicit specific absorption rate and power constraints in parallel transmission at ultra‐high field. J Magn Reson 2015;255:59–67. [DOI] [PubMed] [Google Scholar]
- 63. Davids M, Guerin B, Wald L, Schad L B0‐robust slice‐selective excitations for ultra‐high field with flip‐angle mitigation using parallel transmission. In Proceedings of the 24th Annual Meeting of ISMRM, Singapore, Singapore, 2016. p. 1015.
- 64. Sbrizzi A, Hoogduin H, Lagendijk JJ, Luijten P, Sleijpen GL, van den Berg CA. Fast design of local N‐gram‐specific absorption rate?optimized radiofrequency pulses for parallel transmit systems. Magn Reson Med 2012;67:824–834. [DOI] [PubMed] [Google Scholar]
- 65. Hoyos‐Idrobo A, Weiss P, Massire A, Amadon A, Boulant N. On variant strategies to solve the magnitude least squares optimization problem in parallel transmission pulse design and under strict SAR and power constraints. IEEE Trans Med Imaging 2014;33:739–748. [DOI] [PubMed] [Google Scholar]
- 66. Martin A, Schiavi E, Eryaman Y, Herraiz JL, Gagoski B, Adalsteinsson E, Wald LL, Guerin B. Parallel transmission pulse design with explicit control for the specific absorption rate in the presence of radiofrequency errors. 2016;75:2493–2504. [DOI] [PMC free article] [PubMed] [Google Scholar]
Associated Data
This section collects any data citations, data availability statements, or supplementary materials included in this article.
Supplementary Materials
Fig. S1. (a) magnitude maps from each of the transmit channels. (b) phase maps from each of the transmit channels. (c) B0 distribution after shimming. In all the sub‐figures, the left column is the sagittal view, the middle column is the coronal view, and the right column is the transversal view.
Fig. S2. The gradient waveforms and the k‐space trajectories for (a) N spk = 1, (b) N spk = 2, and (c) N spk = 3. Monopolar slice‐selective gradient was used where the sinc or the multiband RF pulses were played out only during the plateau of the negative lobes of the slice‐selective gradient Gz.
Fig. S3. Two‐spoke simulation results mapped against k and . (a) Mean NRMSE. (b) Mean . (c) Standard error of NRMSE. (d) Standard error of . At k = 6.52 m−1 and = 0°, the simulation results have low values for all these four figures of merit.
Fig. S4. 3‐spoke simulation results mapped against k and . (a) Mean NRMSE. (b) Mean . (c) Standard error of NRMSE. (d) Standard error of . At k = 4.77 m−1 and = −168.8°, the simulation results have low values for all these four figures of merit.
Fig. S5. Summary of NRMSE and for N spk = 1, 2, and 3. For N spk = 1, the position of the spoke is located at the center of the kx–ky plane. For N spk = 2 and 3, the results are taken from the optimal spoke positions as found in Supporting Figs. S3 and S4. The spokes are at with k = 6.52 m−1 and = 0° for N spk = 2; and at with k = 4.77 m−1 and = −168.8° for N spk = 3.
Fig. S6. Summary of NRMSE and for various slice group size.