Abstract
Background
Detection of hepatic metastases during EUS is an important component of tumor staging.
Objective
To describe our experience with EUS-guided FNA (EUS-FNA) of solid hepatic masses and derive and validate criteria to help distinguish between benign and malignant hepatic masses.
Design
Retrospective study, survey.
Setting
Single, tertiary-care referral center.
Patients
Medical records were reviewed for all patients undergoing EUS-FNA of solid hepatic masses over a 12-year period.
Interventions
EUS-FNA of solid hepatic masses.
Main Outcome Measurements
Masses were deemed benign or malignant according to predetermined criteria. EUS images from 200 patients were used to create derivation and validation cohorts of 100 cases each, matched by cytopathologic diagnosis. Ten expert endosonographers blindly rated 15 initial endosonographic features of each of the 100 images in the derivation cohort. These data were used to derive an EUS scoring system that was then validated by using the validation cohort by the expert endosonographer with the highest diagnostic accuracy.
Results
A total of 332 patients underwent EUS-FNA of a hepatic mass. Interobserver agreement regarding the initial endosonographic features among the expert endosonographers was fair to moderate, with a mean diagnostic accuracy of 73% (standard deviation 5.6). A scoring system incorporating 7 EUS features was developed to distinguish benign from malignant hepatic masses by using the derivation cohort with an area under the receiver operating curve (AUC) of 0.92; when applied to the validation cohort, performance was similar (AUC 0.86). The combined positive predictive value of both cohorts was 88%.
Limitations
Single center, retrospective, only one expert endosonographer deriving and validating the EUS criteria.
Conclusion
An EUS scoring system was developed that helps distinguish benign from malignant hepatic masses. Further study is required to determine the impact of these EUS criteria among endosonographers of all experience.
Imaging of the liver is an essential component of cancer staging because the liver is an important site of distant metastases for most tumor types.1,2 The resulting impact on prognosis, selection of therapy, and patient outcome is substantially altered in the majority of patients with hepatic metastases.3,4 For most cancers, the finding of hepatic metastasis indicates a noncurative status and poor prognosis with shortened survival.3–7 The liver is most often assessed for metastases by CT or magnetic resonance imaging (MRI). However, the accuracy of these imaging modalities for detecting hepatic masses and distinguishing benign from malignant masses is limited.8–10 Given the impact on patient care and outcome, tissue confirmation of hepatic metastasis often is indicated.
Traditionally, and in many centers even today, percutaneous hepatic biopsy is preferred because of ease of access, reduced cost relative to EUS, and the belief that the liver cannot be well-examined or safely accessed for EUS-guided FNA (EUS-FNA). There are limited data assessing the capability of EUS for use in identifying and safely doing biopsies of hepatic masses and in understanding EUS features that discriminate benign from malignant hepatic masses.
The aim of this study was to derive and validate EUS criteria that can distinguish between benign and malignant solid hepatic masses and to determine the interobserver agreement (IOA) of these EUS features among an internationally recognized group of highly skilled endosonographers. Furthermore, we sought to examine our institutional experience with EUS-FNA of solid hepatic masses and compare EUS detection with noninvasive imaging methods.
METHODS
Patient selection
A prospectively maintained Mayo Clinic, Rochester, EUS database was reviewed to identify consecutive patients who underwent EUS-FNA of hepatic masses from January 1, 2000 through March 30, 2012. The Institutional Review Board granted study approval. Data pertaining to the clinical presentation, noninvasive imaging features, EUS findings, pathology interpretations, treatment, and patient outcomes were collected. Electronically stored images from all EUS examinations were reviewed by M.J.L, who was blinded to all details of patient medical records and did not know which patients had benign or malignant hepatic lesions. Images that corresponded to the sampled hepatic masses, as verified by the presence of an image showing an FNA needle within the mass and/or having identical dimensions to that described in the procedure note, were identified. Patients were excluded whenever the mass from which the biopsy specimen was obtained could not be confirmed and/or the available images were of insufficient quality.
DIAGNOSTIC CRITERION STANDARD
FNA interpretations were compared with a strict diagnostic criterion standard. The hepatic mass was considered malignant if within 3 months of the index EUS examination either of the following were documented: (1) Cytology and/or histology obtained from the mass was interpreted as positive for malignancy, based on material obtained via EUS, percutaneous or surgical routes, or autopsy. (2) There was a new or enlarging radiographic (CT or MRI) hepatic mass that the reporting radiologist interpreted as clearly indicative of metastasis.
The hepatic mass was considered benign when both of the following were present: EUS-FNA was interpreted as benign or negative for malignancy, and any one of the following was true: (1) No imaging before EUS, but radiographic (CT or MRI) imaging 6 months or more after the index EUS-FNA examination was interpreted as classic for a benign hepatic mass or showing no lesion. (2) Radiographic (CT or MRI) imaging before EUS showed an indeterminate hepatic mass, which on repeat radiographic imaging at 6 months or later had resolved or was seen but without enlargement, was benign appearing, and imaging showed no new hepatic masses. (3) The patient was alive, without clinical evidence of malignancy, at least 24 months after the index EUS examination.
When the findings did not satisfy the criteria for a malignant or benign hepatic mass, the results were deemed indeterminate, and the case was excluded from subsequent analysis. The EUS-FNA interpretations were compared with the strict diagnostic criterion standard to determine the number of true positive (TP), false positive, true negative (TN), or false negative results. Selection of EUS cases for the subsequent interobserver study mandated both a verifiable and representative EUS image of the sampled mass and a TP or TN FNA cytology result. The masses with predominantly cystic components were excluded. The remaining images were deidentified and separated into 2 groups consisting of 100 cases each that were matched with regard to the primary tumor site and the percentage of TP and TN results. (Appendix 1, available online at www.giejournal.org).
INTEROBSERVER STUDY OF THE INITIAL ENDOSONOGRAPHIC CHARACTERIZATION
Deidentified EUS images of the first set of 100 hepatic mass images (derivation cohort) were incorporated into a research electronic data capture (REDCap) survey. REDCap is a secure, Web-based application designed to support data capture for research studies.11
The first review of the derivation cohort involved completion of the REDCap survey by 10 expert endosonographers who were blinded to all clinical and cytopathology information, each using a unique password. In addition to rating 15 EUS features of each lesion, the reviewers provided their opinions as to whether the mass was benign or malignant. The 15 questions addressed potentially predictive features that were chosen based on their use when other structures at EUS were being described and based on the clinical experience of endosonographers and sonographers within our institution doing noninvasive procedures.
Each expert endosonographer had performed a lifetime median of 10,000 (range 2000–40,000) upper GI EUS examinations and a median of 875 (range 400–2200) examinations over the previous year.
Derivation and validation of EUS criteria
A summary of the derivation and validation process is found in Figure 1. The IOA for the 15 initial endosonographic characteristics was deemed to be inadequate to derive EUS criteria that helped to distinguish benign from malignant hepatic masses. Therefore, focus shifted to create criteria that were more comprehensive, succinct, and generalizable.
Figure 1.
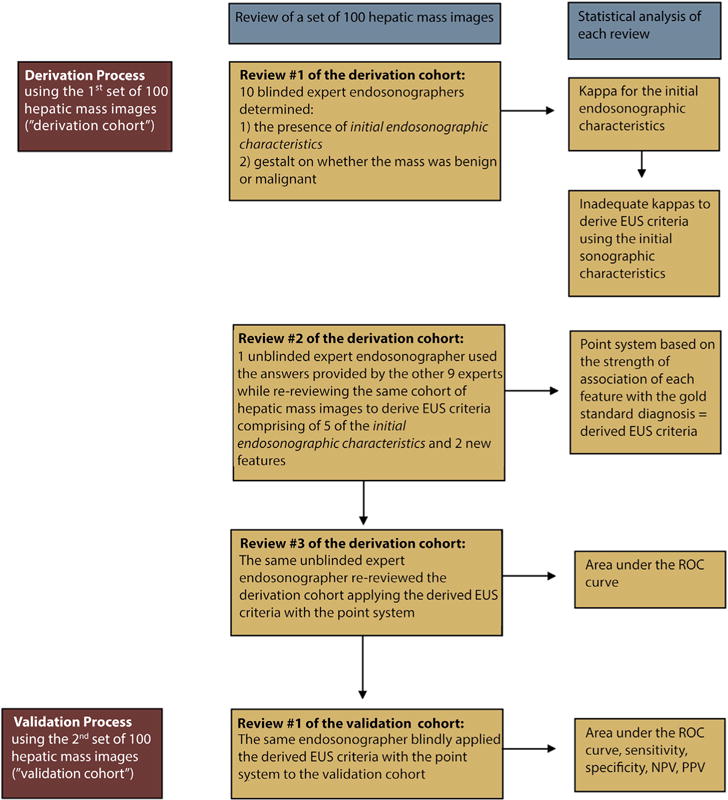
Flow chart of the derivation and validation process. ROC, receiver operating characteristic curve; NPV, negative predictive value; PPV, positive predictive value.
For second review of the derivation cohort, the expert endosonographer (M.J.L) who had the highest diagnostic accuracy was unblinded to the criterion standard diagnosis of each hepatic mass image within the cohort. By using the responses to the questions pertaining to the 15 initial endosonographic characteristics of each image from the other 9 experts, he reevaluated the 100 masses in the derivation cohort, attempting to define more concise EUS features. This repeat review allowed derivation of new EUS features (as highlighted in Appendices 2 and 3, available online at www.giejournal.org) that combined 5 initial endosonographic characteristics with 2 new characteristics that distinguished benign from malignant hepatic masses. Logistic regression analysis was performed on these new EUS features to determine the strength of the association between each feature and malignant versus benign masses, based on the criterion standard diagnosis. Those features significantly associated with outcome (odds ratio [OR] >1 for malignant masses and <1 for benign masses, with 95% confidence intervals not crossing 1) were included in deriving the EUS criteria. These OR estimates were then converted into a point system based on the strength of association with the criterion standard diagnosis, allowing development of EUS criteria that predicted malignant masses. By using the point system, a score of ≥ 3 points was deemed to be the most predictive of malignancy. The derivation cohort was reviewed for a third time by M.J.L to determine the area under the receiver operating characteristic curve (AUC) of this derived EUS criteria.
To validate these criteria, M.J.L then applied the derived predictive EUS features to the second set of 100 masses (validation cohort). During the validation process, the endosonographer was blinded to all clinical and cytopathology data. The performance of the derived EUS criteria was compared between the derivation and validation cohorts by using the AUC, sensitivity, specificity, positive predictive value, and negative predictive value. The Hosmer-Lemeshow test was used to assess the goodness-of-fit of the predictive model.
Statistical analysis
Statistical analysis was performed by using either SAS version 9.2 software (SAS Institute, Cary, NC) or JMP software (version 9.0.1, SAS institute Inc). Continuous variables are reported as either a mean and standard deviation (SD) or median and range. Means were reported unless the data were nonparametric. The t test was used to analyze continuous variables, and a Pearson chi-square analysis was used for categorical variables. Statistical significance was set at a 2-sided P value of .05 or less. A multiple-rater kappa statistic was used to determine the IOA for each of these characteristics. A kappa of 0.21 to 0.4 was considered fair, 0.41 to 0.6 moderate, and 0.61 to 0.8 substantial. The derivation and validation of the EUS criteria were described earlier.
RESULTS
Patient characteristics: all patients
A total of 336 patients (mean [± SD] age 64 ± 12 years; 60% male, 96% white) who underwent EUS-FNA of a solid hepatic mass in the 12-year period were identified. The majority (87%) underwent EUS to evaluate malignancy including pancreatic adenocarcinoma (n = 154, 53%), esophageal adenocarcinoma (n = 40, 14%), neuroendocrine tumor (n = 30, 10%), biliary and/or gallbladder cancer (n = 17, 6%), gastric cancer (n = 13, 5%), colorectal adenocarcinoma (n = 5, 2%), hepatocellular carcinoma (n = 4, 1%), ampullary adenocarcinoma (n = 4, 1%), adenocarcinoma of unknown primary site (n = 4, 1%), and other (n = 17, 7%; including genitourinary cancer, breast or ovarian cancer, melanoma, lung cancer, lymphoma, thyroid cancer, and GI stromal tumor). The indications for EUS included assessment and/or staging of a pancreatic mass in 211 patients (63%), hepatic mass and esophageal mass in 41 patients each (12% each), gastric mass in 14 patients (4%), other cancer staging in 19 patients (6%), and other indications in 10 patients (n = 3%; including gallbladder mass, mesenteric mass, mediastinal lymphadenopathy, and recurrent pancreatitis).
Accuracy, reliability, and safety of EUS-FNA
During EUS, a mean (± SD) of 3 ± 2 hepatic masses were seen in the left lobe (89.3%), right lobe (2.5%), both lobes (5.7%), caudate lobe (0.7%), and hilum (1.8%). The median long axis length was 9 mm (range 1–100 mm), with 22.2% of the lesions being ≤5 mm. A mean of 3.4 ± 1.8 FNA passes were obtained from sampled hepatic masses, of which 95.8% were interpreted as displaying adequate cellularity. Of these, 170 (52.8%) had negative results, 12 (3.7%) had atypical results, 17 (5.3%) had suspicious results, and 123 (38.2%) had results positive for malignancy.
The majority of patients (78.5%) had a CT scan during the evaluation at a median of 6 days before EUS (range 92 days before EUS to 28 days after EUS). CT detected a hepatic mass in the left hepatic lobe of 51% of patients seen by EUS. The masses detected by CT were significantly larger (mean [± SD] 15.3 mm ± 13.1 mm) than those detected by EUS alone (mean 8.8 mm ± 6.2 mm; P < .001) and more often had results positive for malignancy by EUS-FNA than those not detected by CT (56.5% vs 20.7%, respectively; P < .001). TUS was performed in 16.7% of patients at a mean of 2.5 days before EUS (range 30 days before EUS to 22 days after EUS). Similarly, larger lesions were more commonly detected by TUS (mean 16.8 mm ± 14.4 mm vs 7.4 ± 5.3 mm in those detected and not detected; P = .13). Although 30.3% of the masses seen by TUS were positive for malignancy by EUS-FNA, compared with 4.6% of those not seen, this did not reach statistical significance.
When we used the definitions, thresholds, and grading of adverse events advocated by the American Society for Gastrointestinal Endoscopy, serious adverse events requiring hospitalization were reported in 10 patients (2.9%). They included worsening abdominal pain or nausea (n = 5), acute pancreatitis (n = 2), duodenal perforation (n = 2), and atrial fibrillation with rapid ventricular response (n = 1).12 Of the 5 patients with abdominal pain or nausea, 1 patient also underwent an EUS-guided, antegrade, across the anastomosis, stent placement across a strictured pancreaticoduodenostomy, and 1 patient underwent an ERCP and sphincterotomy with biliary stent placement for a malignant stricture, the same day as the index EUS-FNA. Patients spent a median of 1 day (range 1–5 days) in the hospital, with resolution of symptoms by use of conservative medical management. Duodenal perforations occurred in 2 patients with pancreatic cancer, both requiring surgical closure.
PATIENT CHARACTERISTICS: 200 PATIENTS WITH CRITERION STANDARD DIAGNOSIS AND EUS IMAGES
A diagnostic criterion standard was established in 275 patients (81.8%). Among these patients, representative EUS images of the hepatic mass from which biopsy was obtained were available in 228 patients, with 116 (50.9%) and 97 (42.7%) having a TP and TN result, respectively. Those patients with masses that were predominantly cystic were excluded. The remaining patients were divided into the derivation and validation cohorts, matched by their hepatic EUS-FNA cytology results (positive vs non-positive for malignancy) and underlying indication for EUS (adenocarcinoma vs non-adenocarcinoma and location of primary tumor) (Appendix 1, available online at www.giejournal.org).
IOA for initial endosonographic characteristics
The mean (± SD) accuracy of the diagnostic impression of the 10 experts, based on the derivation cohort of EUS images of hepatic masses, was 73.2% ± 5.55; range 68% to 88%; kappa 0.45. There was no statistical difference in the mean diagnostic accuracy between the 48 adenocarcinoma lesions and 52 non-adenocarcinomas or benign lesions (68.7% ± 28.4% for adenocarcinoma and 74% ± 28.1% for non-adenocarcinomas; P = .35).
Overall, the IOA for the 15 initial endosonographic characteristics was fair, with a mean (± SD) kappa statistic of 0.39 ± 0.11 (Table 1). The IOA remained fair even when we focused only on benign lesions (mean 0.32 ± 0.18), malignant lesions (mean 0.34 ± 0.11), adenocarcinomas (mean 0.34 ± 0.12), and non-adenocarcinoma tumors (mean 0.32 ± 0.13) and when we considered only the 4 endosonographers with the highest diagnostic accuracy (mean 0.33 ± 0.12). The kappa statistic was fair or moderate for 8 (53%) and 6 (40%) features, respectively. Only 1 feature (7%, mass echogenicity) provided a substantial kappa statistic.
TABLE 1.
Interobserver agreement among expert endosonographers for initial endosonographic characteristics
| Initial endosonographic feature | Kappa | Range |
|---|---|---|
| One or 2 components | 0.48 | 0.38–0.58 |
| For entire mass (1 component lesion) or central region (2 component lesions) | ||
| Shape (round, oval, irregular) | 0.33 | 0.26–0.39 |
| Echogenicity (hyperechoic, hypoechoic, isoechoic) | 0.66 | 0.58–0.73 |
| Border (regular, irregular) | 0.26 | 0.19–0.34 |
| Homogeneity (homogeneous, inhomogeneous) | 0.33 | 0.24–0.43 |
| For outer halo in 2 component lesions | ||
| Shape | 0.36 | 0.30–0.44 |
| Echogenicity relative to the central lesion | 0.49 | 0.39–0.59 |
| Echogenicity relative to the remainder of the liver | 0.48 | 0.39–0.58 |
| Border | 0.37 | 0.30–0.45 |
| Homogeneity | 0.39 | 0.30–0.46 |
| For mass in its entirety | ||
| Cystic component | 0.43 | 0.05–0.72 |
| Post-acoustic altered echogenicity (shadow, enhancement) | 0.30 | 0.15–0.44 |
| Deform or distort adjacent structures | 0.47 | 0.37–0.56 |
| For surrounding liver | ||
| Fatty liver | 0.22 | 0.15–0.30 |
| Cirrhosis | 0.32 | 0.19–0.45 |
| Professional opinion (benign, malignant) | 0.45 | 0.38–0.53 |
Derivation and validation of EUS criteria
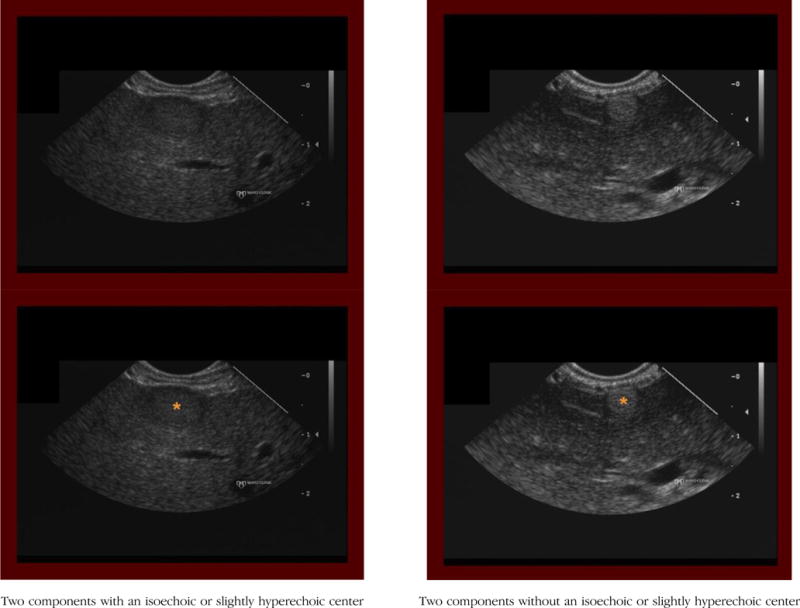
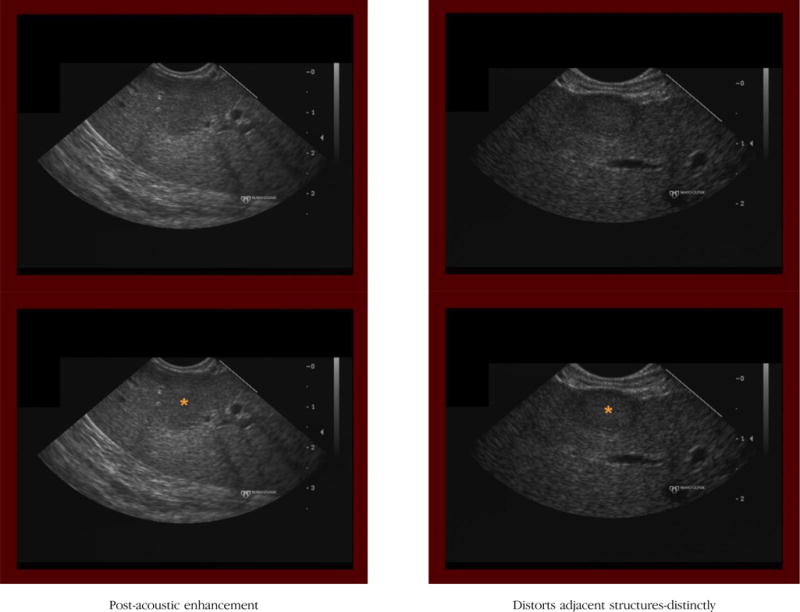
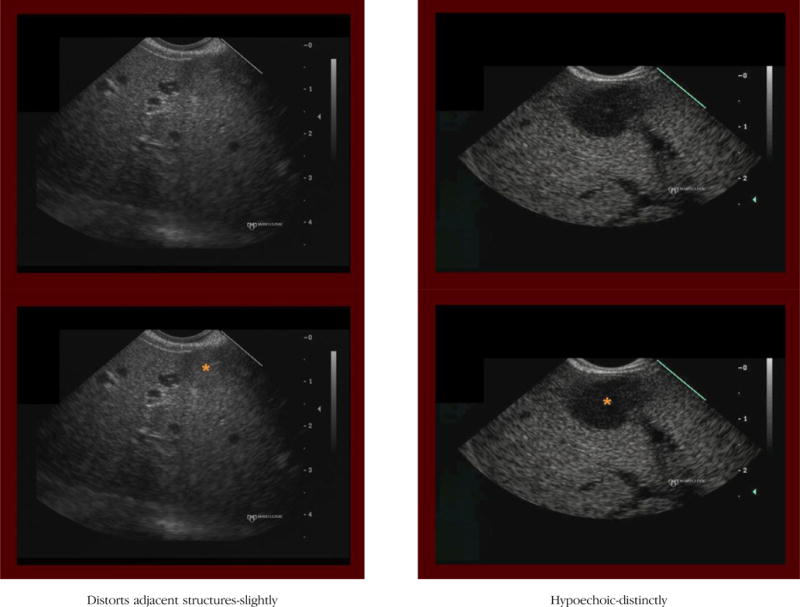
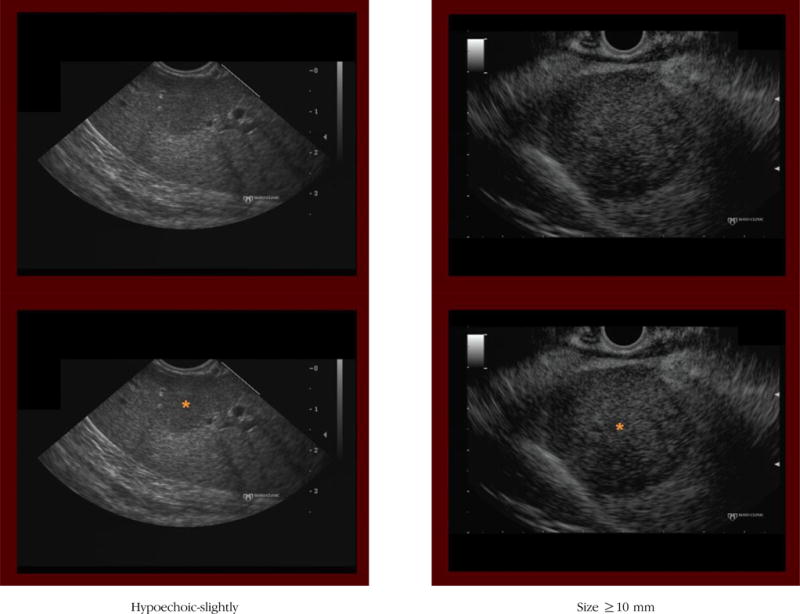
EUS criteria were derived to distinguish benign from malignant hepatic masses, based on the answers from the 10 expert endosonographers regarding the 15 endosonographic features and unblinded repeat review of the derivation cohort. The univariate OR of each EUS feature, reflecting its strength of association with a malignant hepatic lesion, is presented in Table 2. Detailed definitions of these features and guidance for their use are provided in Appendices 2 and 3, available online at www.giejournal.org. In order to develop a simple prediction model, based on the EUS criteria, the univariate OR of individual EUS features was converted into a point system (Fig. 2). To validate these EUS criteria, we applied it to the validation cohort and compared its performance among both cohorts. The AUC from the derivation cohort was 0.92 (Hosmer-Lemeshow goodness-of-fit = X) (Fig. 3A) compared with 0.86 (Hosmer-Lemeshow goodness-of-fit = X) in the validation cohort (Fig. 3B). When both cohorts were combined, the sensitivity, specificity, and positive predictive value (PPV) for a score ≥ 3 in predicting a malignant hepatic mass were 85%, 82%, and 88%, respectively (Fig. 3C).
TABLE 2.
Univariate odds ratio of the derived EUS criteria for predicting malignancy
| EUS criterion | Odds ratio | Range |
|---|---|---|
| Hyperechoic (distinctly) | 0.10 | 0.03–0.31 |
| Geographic shape (distinctly) | 0.11 | 0.01–0.95 |
| Two components | 3.77 | 1.80–7.91 |
| Post-acoustic enhancement | 11.96 | 2.62–54.56 |
| Distorts adjacent structures | 6.15 | 2.61–14.51 |
| Hypoechoic | 1.74 | 1.08–2.80 |
| Size ≥10 mm | 2.62 | 1.10–6.24 |
Figure 2.
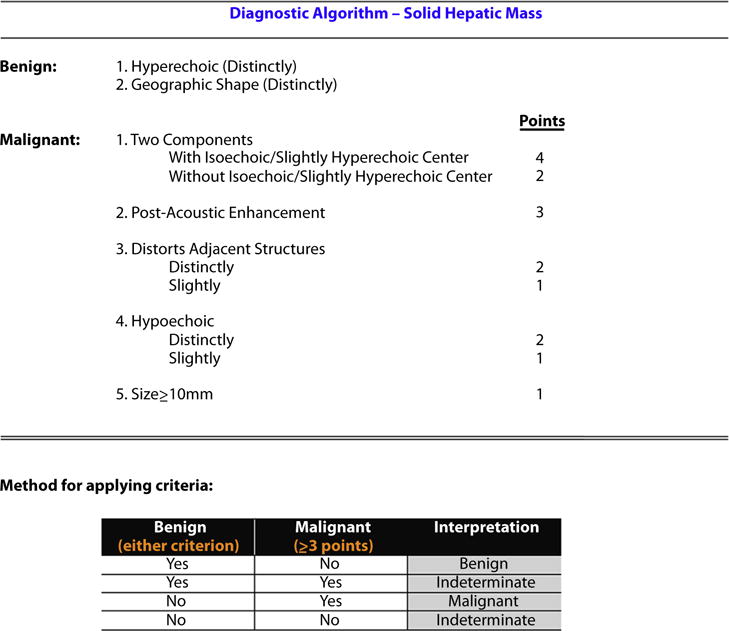
Derived and validated EUS criteria that distinguish benign from malignant hepatic masses.
Figure 3.
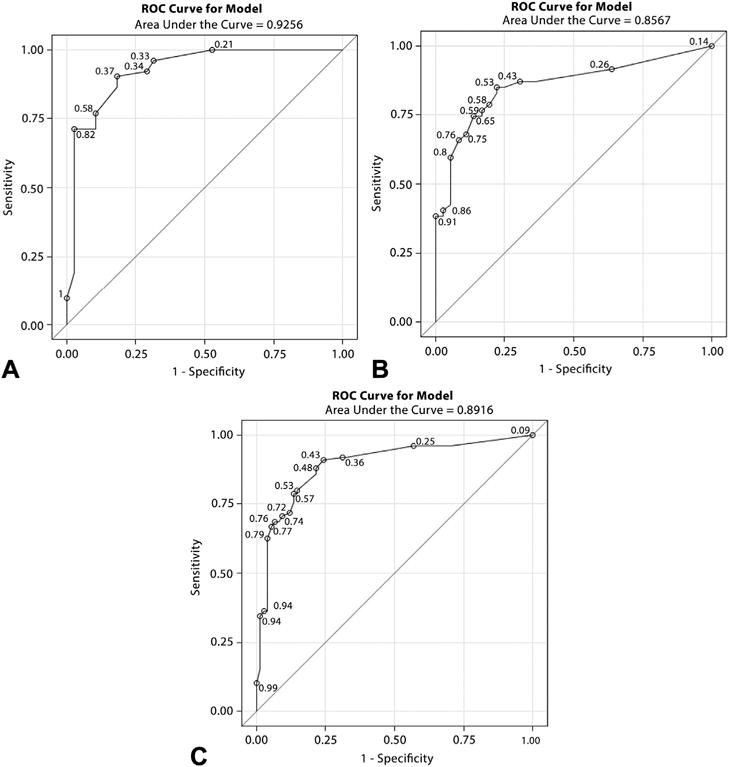
Area under the receiver operator characteristic curve for the derivation and validation of the EUS criteria that distinguish benign from malignant hepatic masses. A, Derivation cohort AUC. B, Validation cohort AUC. C, Combined AUC for all 200 hepatic masses. AUC, area under the curve.
Conclusions
The detection of hepatic metastasis is important for determining prognosis and guiding patient care. In a meta-analysis, the sensitivity of CT and TUS in the detection of hepatic metastasis was 70% and 66%, respectively.8 The sensitivities are likely lower, given the soft criterion standard used in the majority of studies. Smaller lesions are more likely to be missed by noninvasive imaging as shown by Kuszyk et al,13 who demonstrated a CT sensitivity of 81% for all hepatic masses versus 56% for those < 10 mm. Our findings were corroboratory in that radiographically occult hepatic masses identified by EUS only were significantly smaller than those also seen by noninvasive imaging, leading to our view that EUS is complementary to other imaging modalities in patients undergoing cancer staging. In addition, EUS-FNA is an effective technique for tissue acquisition. When compared with our strict diagnostic criterion standard, 93.6% of hepatic mass EUS-FNA resulted in a TP or TN result. This is similar to prior studies that reported a diagnostic yield of 87% to 94% for hepatic EUS-FNA.14–16
Several studies evaluated EUS features that may help distinguish benign from malignant hepatic masses. Nguyen et al16 characterized hepatic masses and noted that all malignant hepatic masses were round with regular borders and lacked an internal Doppler signal. Similarly, another study found that metastatic lesions were more likely to have regular outer margins and have additional hepatic masses.14 In this study, there was no significant difference in echogenicity and size between malignant and nonmalignant masses. Finally, tenBerge et al17 did not find any EUS characteristics that were predictive of malignancy including the size, shape, echogenicity, and border of the lesion.
We were able to derive and validate EUS criteria that may help to distinguish benign from malignant hepatic masses with a PPV of 88%. This information may be helpful for guiding the decision whether to perform hepatic mass EUS-FNA or not and for selecting the ideal lesion when multiple masses are visualized, thereby limiting the number of FNA passes and potentially increasing safety. The IOA between 10 expert endosonographers’ assessment of the individual EUS criteria ranged from fair to substantial. Most features that were eventually incorporated into the diagnostic algorithm with high predictive value for malignancy (2 components—echogenicity and distort adjacent structures) had moderate to substantial IOA. This range in IOA is similar to EUS studies assessing the presence of chronic pancreatitis features,18,19 characteristics of malignant cystic pancreatic lesions,20 and pancreatic features among familial pancreatic cancer kindreds.21 Beyond EUS, endobronchial US in the diagnosis of intrathoracic lymph nodes22 and US in the diagnosis of breast cancer23 and thyroid nodules24 also have a wide range of IOA scores. We speculate that this range of IOA may be improved through education.
As increasing volumes of hepatic mass FNAs are being performed during EUS, it is important to know the risks associated with the procedure. The risk of hepatic EUS-FNA is higher than EUS-FNA of other sites, which was confirmed by a meta-analysis that found hepatic EUS-FNA had the second highest morbidity rate (2.3%) exceeded only by FNA of ascites.25 Six adverse events were reported in a retrospective international questionnaire that involved 167 EUS-FNAs (3.6%), including abdominal pain (n = 2), fever (n = 2), bleeding (n = 1), and death (n = 1).17 Serious adverse events occurred in 2.9% of our patient cohort, which is similar to the rates reported by the meta-analysis.25 Although each of the adverse events was clearly related to the EUS examination and/or accompanying ERCP, it is unlikely that any of them was directly related to the FNA itself.
The main limitation of this study was the use of only 1 endosonographer to derive and validate the EUS criteria on 2 independent cohorts. The decision to limit the number of people for the derivation and validation processes was to minimize the variability and interobserver differences that would prohibit detection of an adequate statistical signal. In addition, even though the images were selected while the endosonographer was blinded to all details of the patient medical records and did not know which lesions were benign or malignant, one cannot absolutely exclude some memory during subsequent review. A potential study limitation is the use of one person and not the expert panel in the validation process. This was the suggested approach from our statisticians, given the high interobserver variability that was seen with the initial derivation cohort among the expert endosonographers. Another limitation of this study was the use of only an individual still image rather than a video clip of the hepatic masses. This may have prohibited full recognition of the more subtle aspects of the hepatic masses and surrounding hepatic parenchyma. Furthermore, clinical data, which is typically incorporated into clinical decision making and influences image interpretation, were not provided to the endosonographers. However, we thought it necessary to withhold this information to more accurately determine the independent performance of EUS in this setting. An additional limitation is the inability of the EUS criteria to capture all features that make a hepatic mass appear benign versus malignant. This limitation partly results from the overlapping appearance that benign and malignant hepatic masses have. If a lesion did not fulfill the EUS criteria for either being clearly benign or malignant, it was considered indeterminate. Also, given that the majority of metastases represented adenocarcinoma, and despite the comparable diagnostic accuracy for adenocarcinoma versus non-adenocarcinoma tumor types, we believe our criteria should be applied solely to patients with suspected adenocarcinoma. Additional work is needed to derive and validate EUS criteria that identify non-adenocarcinoma hepatic masses. Finally, our study included a select patient population in whom study inclusion was based on EUS detection of a hepatic mass. In addition, for the patients found to have a mass on prior imaging, the initial imaging provided a clue to the endosonographer, thereby aiding EUS detection. An accurate comparison of the performance characteristics of EUS-FNA to CT and/or MRI requires prospective evaluation within a consecutive patient cohort that includes all comers.
In summary, EUS criteria that distinguish benign from malignant hepatic masses were derived and validated. Although higher adverse event rates have been reported, given our low adverse event rate, some may favor hepatic FNA regardless of the EUS appearance. The data have altered our practice and may impact clinical decision making elsewhere in the following manner: (1) The EUS appearance can encourage endosonographers who have had reluctance to perform hepatic EUS-FNA to now sample worrisome-appearing hepatic masses while feeling more assured about foregoing biopsy for very benign-appearing lesions. (2) The EUS appearance can help determine the ideal lesion on which to perform FNA. Because patients often have multiple hepatic masses, endosonographers may use the EUS appearance to target the most worrisome-appearing lesions to further minimize risk, decrease the number of biopsies, and secondarily improve examination efficiency. (3) If a lesion appears highly suspicious or very benign based on the criteria, but preliminary in-room interpretations are nondiagnostic, the appearance would likely encourage additional biopsies or limit the number of biopsies, respectively. Further study is needed to determine the impact of these EUS criteria among endosonographers of all levels of experience. The greatest value of this study may be to highlight (1) the need to carefully examine the liver during cancer staging, (2) the ability to detect hepatic masses beyond the left lobe, (3) the ability to detect radiographically occult and often diminutive <5 mm masses, (4) the apparent safety of FNA in this setting, and (5) the high PPV of the derived and validated EUS criteria.
Acknowledgments
This publication was made possible by CTSA grant UL1 TR000135 from the National Center for Advancing Translational Sciences, a component of the National Institutes of Health (NIH). Its contents are solely the responsibility of the authors and do not necessarily represent the official view of the NIH.
Abbreviations
- AUC
area under the receiver operating characteristic curve
- EUS-FNA
EUS-guided FNA
- IOA
interobserver agreement
- MRI
magnetic resonance imaging
- PPV
positive predictive value
- REDCap
research electronic data capture
- TP
true positive
- TN
true negative
- TUS
transabdominal ultrasound
APPENDIX 1 Indication for EUS
| Indication for EUS | Set 1 (n = 100) | Set 2 (n = 100) | ||
|---|---|---|---|---|
| Cytology (+)* | Cytology (−)* | Cytology (+)* | Cytology (−)* | |
| Pancreatic adenocarcinoma | 36 | 10 | 34 | 10 |
| Esophageal adenocarcinoma | 6 | 5 | 6 | 6 |
| Colorectal adenocarcinoma | 1 | 1 | 2 | 0 |
| Gastric adenocarcinoma | 2 | 2 | 1 | 2 |
| Ampullary adenocarcinoma | 0 | 0 | 1 | 1 |
| Cholangiocarcinoma/gallbladder cancer | 3 | 2 | 4 | 2 |
| Adenocarcinoma of unknown primary site | 2 | 0 | 1 | 0 |
| Pancreatic neuroendocrine tumor | 5 | 4 | 6 | 4 |
| Hepatocellular carcinoma | 1 | 0 | 1 | 0 |
| Melanoma | 1 | 0 | 0 | 0 |
| Lymphoma | 0 | 1 | 0 | 1 |
| Other (gynecologic, genitourinary cancers) | 0 | 3 | 0 | 2 |
| Benign lesions | 0 | 15 | 0 | 16 |
| Total | 57 | 43 | 56 | 44 |
(+) and (−) apply to the EUS-guided FNA cytologic result from the liver mass itself.
APPENDIX 2. DEFINITIONS FOR THE EUS CRITERIA TO DISTINGUISH BENIGN FROM MALIGNANT HEPATIC MASSES
Benign criteria
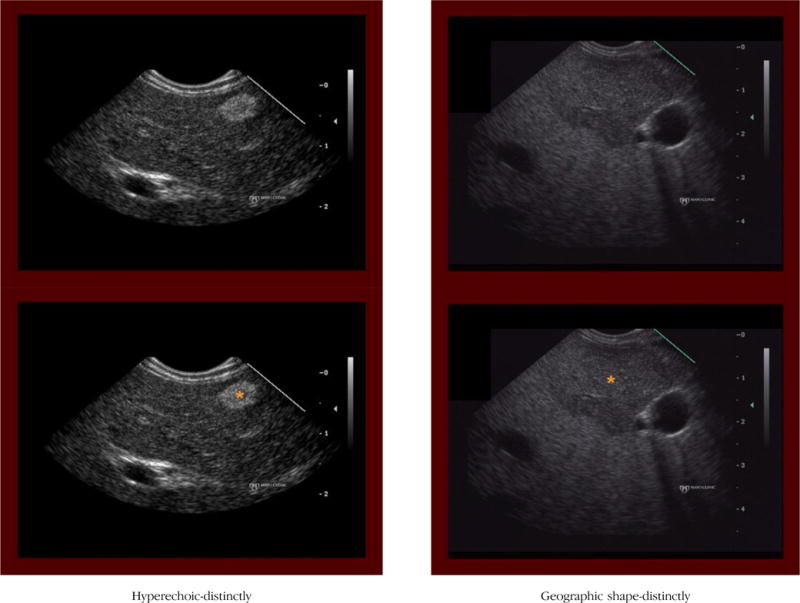
(1) Hyperechoic (distinctly)
Definition: The hepatic mass is distinctly more hyperechoic (brighter) than the surrounding hepatic parenchyma.
Notes/clues: Most often represents a benign mass (eg, hemangioma). However, one must also consider a neuroendocrine tumor in the proper clinical setting.
(2) Geographic shape (distinctly)
Definition: The hepatic mass has a shape other than round or oval. Can include square, rectangular, triangular, more complex shape or described as having a peculiar or vague shape.
Notes/clues: This criterion applies to the shape of the entire lesion and does not apply to the internal topographic features or the border characteristics.
Malignant criteria
(1) Two components
Definition: The hepatic mass contains two components, including a central (inner) and peripheral (outer) component that differ in echogenicity.
Notes/clues: The outer component may be very thin (about 1–2 mm) and is easy to miss, therefore important to examine.
With isoechoic/slightly hyperechoic center
Definition: For hepatic masses with two components, the central (inner) component is isoechoic (or only slightly hyperechoic) relative to the surrounding liver parenchyma.
Notes/Clues: When the outer component is hypoechoic, which is usually the case, it can lead the interpreter to falsely perceive the central component as being more hyperechoic (brighter) than actual. Try to compare the echogenicity of the central component to the liver parenchyma and not to the outer component.
Without isoechoic/slightly hyperechoic center
Definition: For hepatic masses with two components, the central (inner) component is either hypoechoic or distinctly hyperechoic relative to the surrounding liver parenchyma.
(2) Post-acoustic enhancement
Definition: The hepatic parenchyma located deep to the hepatic mass appears more echogenic (brighter) compared with other regions of hepatic parenchyma.
Notes/clues: The presence or absence of post-acoustic enhancement cannot be assessed if the mass abuts the deepest aspect of the liver edge (ie, absence of hepatic parenchyma deep to the mass). In this situation, the criterion is considered absent.
(3) Distort adjacent structures
Definition: The hepatic mass clearly deforms or alters the shape or course of adjacent normal structures (liver border, bile duct, vessels).
Notes/clues: Evaluation of this feature assumes that the mass is in close enough proximity to a normal anatomic structure to potentially distort adjacent structures. If not, this criterion is considered absent.
Distortion, if present, should be scored as either distinctly or slightly.
If the mass protrudes from the edge of the liver (ie, liver parenchyma is seen on only one side of the mass) we score this criterion as being present.
Even if the mass distinctly distorts the liver capsule, if the border of the mass that extends beyond the liver is markedly irregular, then this criterion is considered absent.
(4) Hypoechoic
Definition: The hepatic mass is more hypoechoic (darker) than the surrounding liver parenchyma.
Notes/clues: If present, should be scored as either distinctly or slightly. When considering whether a mass is hypoechoic, it is important to evaluate the gain setting. Use of too much or too little gain alters one’s sense of the relative echogenicity of the mass. For instance, when imaging is performed by using too high a gain setting (entire image appears bright), it tends to result in an underappreciation of how much darker (hypoechoic) the mass is compared with the hepatic parenchyma. Therefore, one may fail to designate the mass as intensely hypoechoic.
On the contrary, if the image was obtained with a low gain setting, then the entire image appears dark (hypoechoic), often leading to an overestimation of how much darker (hypoechoic) the mass is compared with the hepatic parenchyma.
(5) Size ≥ 10 mm
Definition: The hepatic mass is ≥ 10 mm in any axis.
Notes/clues: The markings embedded in the images can be used to estimate the size of the mass.
APPENDIX 3. EXAMPLES OF EACH EUS CRITERION
Footnotes
DISCLOSURE: No other financial relationships relevant to this article were disclosed.
References
- 1.Ceelen WP, Bracke ME. Peritoneal minimal residual disease in colorectal cancer: mechanisms, prevention, and treatment. Lancet Oncol. 2009;10:72–9. doi: 10.1016/S1470-2045(08)70335-8. [DOI] [PubMed] [Google Scholar]
- 2.Lemmens VE, Klaver YL, Verwaal VJ, et al. Predictors and survival of synchronous peritoneal carcinomatosis of colorectal origin: a population-based study. Int J Cancer. 2011;128:2717–25. doi: 10.1002/ijc.25596. [DOI] [PubMed] [Google Scholar]
- 3.Baker ME, Pelley R. Hepatic metastases: basic principles and implications for radiologists. Radiology. 1995;197:329–37. doi: 10.1148/radiology.197.2.7480672. [DOI] [PubMed] [Google Scholar]
- 4.Gore RM, Thakrar KH, Wenzke DR, et al. That liver lesion on MDCT in the oncology patient: Is it important? Cancer Imaging. 2012;12:373–84. doi: 10.1102/1470-7330.2012.9028. [DOI] [PMC free article] [PubMed] [Google Scholar]
- 5.Bengmark S, Hafstrom L. The natural history of primary and secondary malignant tumors of the liver. I. The prognosis for patients with hepatic metastases from colonic and rectal carcinoma by laparotomy. Cancer. 1969;23:198–202. doi: 10.1002/1097-0142(196901)23:1<198::aid-cncr2820230126>3.0.co;2-j. [DOI] [PubMed] [Google Scholar]
- 6.Bengmark S, Hafstrom L. The natural history of primary and secondary malignant tumors of the liver. II. The prognosis for patients with hepatic metastases from gastric carcinoma verified by laparotomy and postmortem examination. Digestion. 1969;2:179–86. doi: 10.1159/000196936. [DOI] [PubMed] [Google Scholar]
- 7.Oxley EM, Ellis H. Prognosis of carcinoma of the large bowel in the presence of liver metastases. Br J Surg. 1969;56:149–52. doi: 10.1002/bjs.1800560217. [DOI] [PubMed] [Google Scholar]
- 8.Kinkel K, Lu Y, Both M, et al. Detection of hepatic metastases from cancers of the gastrointestinal tract by using noninvasive imaging methods (US, CT, MR imaging, PET): a meta-analysis. Radiology. 2002;224:748–56. doi: 10.1148/radiol.2243011362. [DOI] [PubMed] [Google Scholar]
- 9.Xia D, Jing J, Shen H, et al. Value of diffusion-weighted magnetic resonance images for discrimination of focal benign and malignant hepatic lesions: a meta-analysis. J Magn Reson Imaging. 2010;32:130–7. doi: 10.1002/jmri.22211. [DOI] [PubMed] [Google Scholar]
- 10.Scharitzer M, Ba-Ssalamah A, Ringl H, et al. Preoperative evaluation of colorectal liver metastases: comparison between gadoxetic acid-enhanced 3.0-T MRI and contrast-enhanced MDCT with histopathological correlation. Eur Radiol. 2013;23:2187–96. doi: 10.1007/s00330-013-2824-z. [DOI] [PubMed] [Google Scholar]
- 11.Harris PA, Taylor R, Thielke R, et al. Research electronic data capture (REDCap)—a metadata-driven methodology and workflow process for providing translational research informatics support. J Biomed Inform. 2009;42:377–81. doi: 10.1016/j.jbi.2008.08.010. [DOI] [PMC free article] [PubMed] [Google Scholar]
- 12.Cotton PB, Eisen GM, Aabakken L, et al. A lexicon for endoscopic adverse events: report of an ASGE workshop. Gastrointest Endosc. 2010;71:446–54. doi: 10.1016/j.gie.2009.10.027. [DOI] [PubMed] [Google Scholar]
- 13.Kuszyk BS, Bluemke DA, Urban BA, et al. Portal-phase contrast-enhanced helical CT for the detection of malignant hepatic tumors: sensitivity based on comparison with intraoperative and pathologic findings. AJR Am J Roentgenol. 1996;166:91–5. doi: 10.2214/ajr.166.1.8571914. [DOI] [PubMed] [Google Scholar]
- 14.DeWitt J, LeBlanc J, McHenry L, et al. Endoscopic ultrasound-guided fine needle aspiration cytology of solid liver lesions: a large single-center experience. Am J Gastroenterol. 2003;98:1976–81. doi: 10.1111/j.1572-0241.2003.07638.x. [DOI] [PubMed] [Google Scholar]
- 15.Hollerbach S, Willert J, Topalidis T, et al. Endoscopic ultrasound-guided fine-needle aspiration biopsy of liver lesions: histological and cytological assessment. Endoscopy. 2003;35:743–9. doi: 10.1055/s-2003-41593. [DOI] [PubMed] [Google Scholar]
- 16.Nguyen P, Feng JC, Chang KJ. Endoscopic ultrasound (EUS) and EUS-guided fine-needle aspiration (FNA) of liver lesions. Gastrointest Endosc. 1999;50:357–61. doi: 10.1053/ge.1999.v50.97208. [DOI] [PubMed] [Google Scholar]
- 17.tenBerge J, Hoffman BJ, Hawes RH, et al. EUS-guided fine needle aspiration of the liver: indications, yield, and safety based on an international survey of 167 cases. Gastrointest Endosc. 2002;55:859–62. doi: 10.1067/mge.2002.124557. [DOI] [PubMed] [Google Scholar]
- 18.Lieb JG, 2nd, Palma DT, Garvan CW, et al. Intraobserver agreement among endosonographers for endoscopic ultrasound features of chronic pancreatitis: a blinded multicenter study. Pancreas. 2011;40:177–80. doi: 10.1097/MPA.0b013e3182016a25. [DOI] [PubMed] [Google Scholar]
- 19.Wallace MB, Hawes RH, Durkalski V, et al. The reliability of EUS for the diagnosis of chronic pancreatitis: interobserver agreement among experienced endosonographers. Gastrointest Endosc. 2001;53:294–9. doi: 10.1016/s0016-5107(01)70401-4. [DOI] [PubMed] [Google Scholar]
- 20.Ahmad NA, Kochman ML, Brensinger C, et al. Interobserver agreement among endosonographers for the diagnosis of neoplastic versus non-neoplastic pancreatic cystic lesions. Gastrointest Endosc. 2003;58:59–64. doi: 10.1067/mge.2003.298. [DOI] [PubMed] [Google Scholar]
- 21.Topazian M, Enders F, Kimmey M, et al. Interobserver agreement for EUS findings in familial pancreatic-cancer kindreds. Gastrointest Endosc. 2007;66:62–7. doi: 10.1016/j.gie.2006.09.018. [DOI] [PubMed] [Google Scholar]
- 22.Garcia-Olive I, Radua J, Serra P, et al. Intra- and interobserver agreement among bronchial endosonographers for the description of intrathoracic lymph nodes. Ultrasound Med Biol. 2012;38:1163–8. doi: 10.1016/j.ultrasmedbio.2012.03.012. [DOI] [PubMed] [Google Scholar]
- 23.Park CS, Kim SH, Jung NY, et al. Interobserver variability of ultrasound elastography and the ultrasound BI-RADS lexicon of breast lesions. Breast Cancer Epub. 2013 Apr 13; doi: 10.1007/s12282-013-0465-3. [DOI] [PubMed] [Google Scholar]
- 24.Park CS, Kim SH, Jung SL, et al. Observer variability in the sonographic evaluation of thyroid nodules. J Clin Ultrasound. 2010;38:287–93. doi: 10.1002/jcu.20689. [DOI] [PubMed] [Google Scholar]
- 25.Wang KX, Ben QW, Jin ZD, et al. Assessment of morbidity and mortality associated with EUS-guided FNA: a systematic review. Gastrointest Endosc [review] 2011;73:283–90. doi: 10.1016/j.gie.2010.10.045. [DOI] [PubMed] [Google Scholar]


