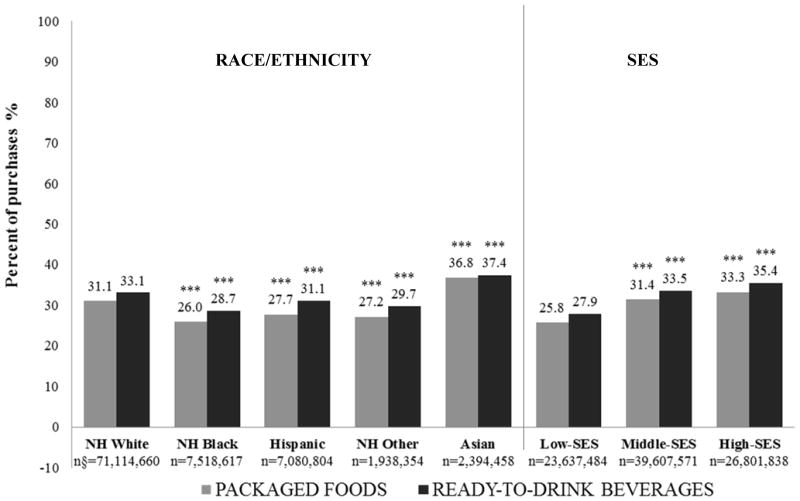
Figure 2. Mean per capita percent of IRI Consumer Network† panel purchases with any price promotion‡ from 2008–2012, by household race/ethnicity and socio-economic status.
NH, non-Hispanic; SES, socio-economic status
† IRI, Chicago, IL
‡ “Any price promotion” defined as all coupons and deals self-reported by households participating in the IRI Consumer Network panel(18) (IRI, Chicago, IL) from 2008–2012
§ n = (number of packaged food purchases) + (number of ready-to-drink beverage purchases) for each race/ethnic and socio-economic group.
*** P <0.001 for race/ethnic group vs. non-Hispanic white and SES group vs. low-SES

