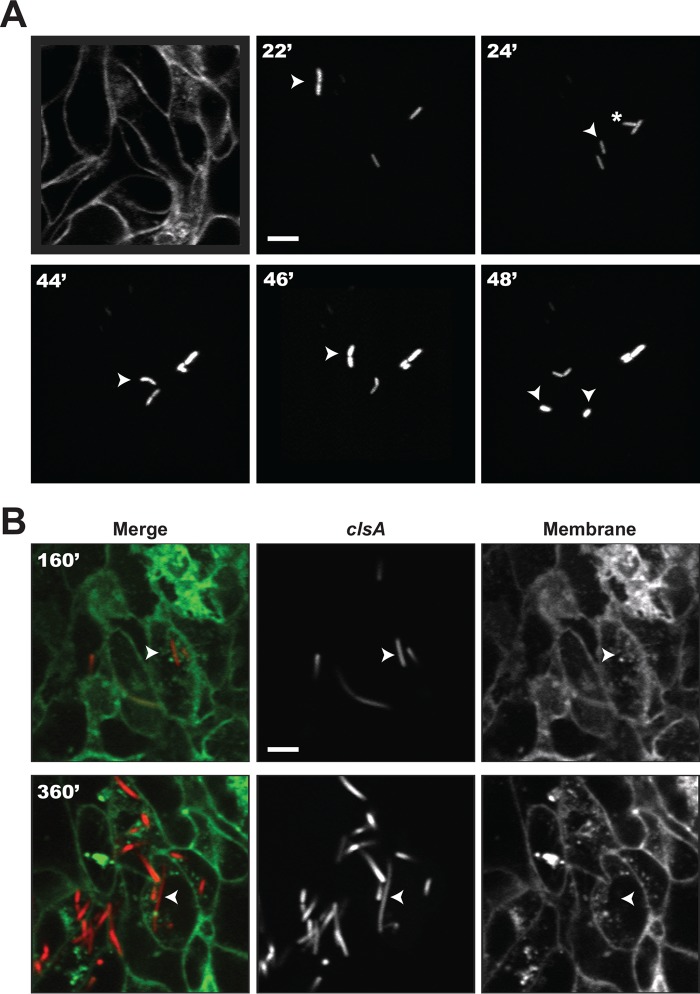
FIG 6 .
Visualization of clsA mutant filamentation in HT-29 cells. (A) Basal Z-section slice of the HT-29 monolayer footprint prior to infection and early infection tracking of a normally growing bacterium. Arrowhead tracking of a bacterium about to divide at 22 min (22′), which gives rise to two bacteria shown at 24 min, indicated by an arrowhead and asterisk. The arrowhead was tracked until the next cell division shown at 48 min. (B) Late infection tracking of one cytosolic filamenting bacterium at 160 and 360 min. Bars = 5 μm.

