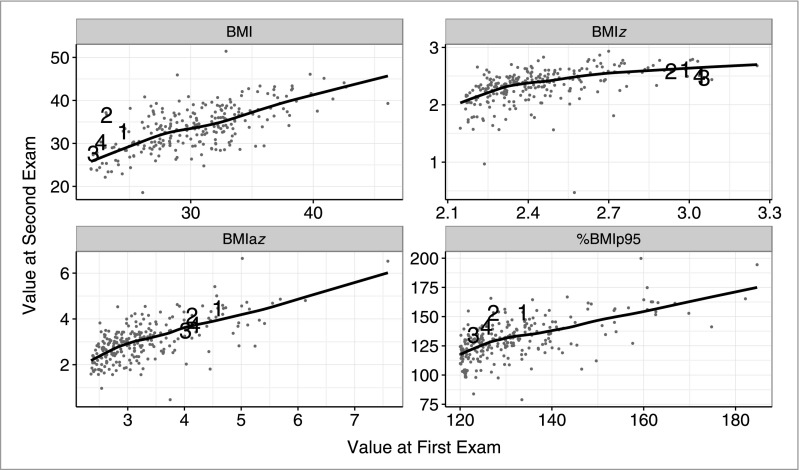
FIGURE 2.
Initial and subsequent levels of BMI, BMIz, BMIaz, and %BMIp95 among children who had severe obesity at the initial examination. The points labeled 1 through 4 represent the children who showed a BMIz decrease of more than 0.33 SDs between examinations but an increase in %BMIp95 of more than 10 U.

