By using the Baby-MONITOR, a composite indicator of NICU quality, the authors of this study examined racial and/or ethnic disparities.
Abstract
BACKGROUND:
Differences in NICU quality of care provided to very low birth weight (<1500 g) infants may contribute to the persistence of racial and/or ethnic disparity. An examination of such disparities in a population-based sample across multiple dimensions of care and outcomes is lacking.
METHODS:
Prospective observational analysis of 18 616 very low birth weight infants in 134 California NICUs between January 1, 2010, and December 31, 2014. We assessed quality of care via the Baby-MONITOR, a composite indicator consisting of 9 process and outcome measures of quality. For each NICU, we calculated a risk-adjusted composite and individual component quality score for each race and/or ethnicity. We standardized each score to the overall population to compare quality of care between and within NICUs.
RESULTS:
We found clinically and statistically significant racial and/or ethnic variation in quality of care between NICUs as well as within NICUs. Composite quality scores ranged by 5.26 standard units (range: −2.30 to 2.96). Adjustment of Baby-MONITOR scores by race and/or ethnicity had only minimal effect on comparative assessments of NICU performance. Among subcomponents of the Baby-MONITOR, non-Hispanic white infants scored higher on measures of process compared with African Americans and Hispanics. Compared with whites, African Americans scored higher on measures of outcome; Hispanics scored lower on 7 of the 9 Baby-MONITOR subcomponents.
CONCLUSIONS:
Significant racial and/or ethnic variation in quality of care exists between and within NICUs. Providing feedback of disparity scores to NICUs could serve as an important starting point for promoting improvement and reducing disparities.
What’s Known on This Subject:
Disparity in quality of care delivery is emerging as an important contributor to differential outcomes among vulnerable neonatal populations.
What This Study Adds:
Wide racial and/or ethnic differences in quality of care delivery do exist between and within NICUs. Stratification, rather than risk adjustment for race and/or ethnicity, appeared to provide more informational content for performance assessment.
Closing the persistent racial and/or ethnic gap in care and outcomes of newborn infants has been a longtime policy priority.1 Disparity in health care delivery has been defined as racial or ethnic differences in the quality of health care that are not because of access-related factors or clinical needs, preferences, and appropriateness of intervention.2 Disparity in quality of care provided in the NICU setting may manifest in 2 ways. First, African American and Hispanic infants may be more likely to receive care in poor-quality NICUs.3,4 Second, in a given NICU, African American and Hispanic infants may receive inferior care. In previous work, we demonstrated NICU-level racial disparities in rates of antenatal steroid and human breast milk feeding at discharge from hospitals in California.5,6 However, a multidimensional assessment of differences in quality of care delivery does not exist. Composite indicators allow for multidimensional measurement of quality by combining 2 or more individual measures into a single score.7 Their primary appeal is that they allow researchers to simplify and summarize otherwise complex issues and to provide global insights and trends about quality of care.
The goal of this population-based study was to provide a multidimensional appraisal of racial and ethnic differences in the quality of NICU care delivery given to very low birth weight (VLBW; <1500 g) infants in California. For this purpose, we used the Baby-MONITOR composite indicator and its subcomponents.8 The Baby-MONITOR aggregates 9 risk-adjusted measures (2 process measures, 6 morbidities, and mortality) that span the birth hospitalization.9–11
Methods
Overview
We performed a retrospective population-based analysis of clinical data obtained from the California Perinatal Quality Care Collaborative (CPQCC) data registry.12 More than 90% of California NICUs are members of the CPQCC, covering more than 95% of all very low birth weight (VLBW) births in the state. We used CPQCC clinical data to compute a Baby-MONITOR score for each NICU. We then aggregated and compared race- and/or ethnicity-specific Baby-MONITOR scores across NICUs.
Sample
This study included data recorded between January 1, 2010, and December 31, 2014. CPQCC assures high data quality through training of local personnel, range and logic checks, and auditing of records with excessive missing data. Data for infants transferred to other CPQCC-member NICUs are linked. We used multiyear analyses because of a small sample in some institutions.
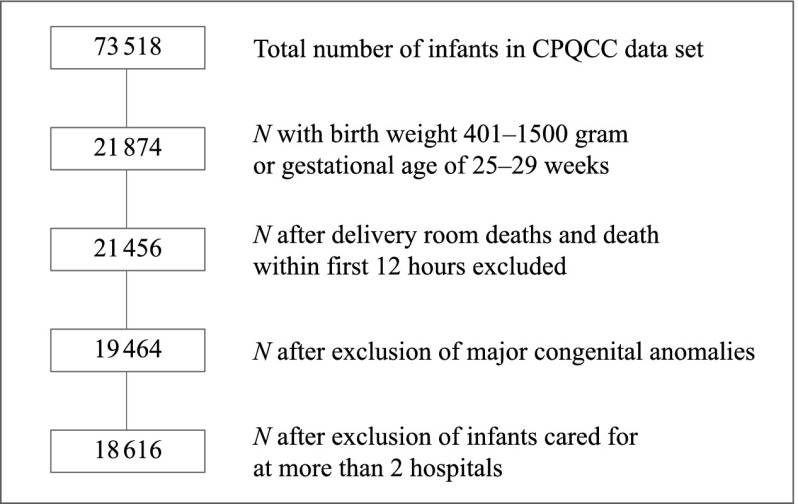
Figure 1 shows a flowchart of our patient sample. A detailed description of the patient-selection criteria has been published elsewhere.9 In brief, our goal was to create a relatively homogenous and unbiased sample of VLBW infants for comparison across NICUs. To ensure that patient outcomes reflected the care of the NICU under observation, we excluded infants who died before 12 hours of life and those with severe congenital anomalies. We also restricted the analysis to infants born after 24 completed weeks of gestation to avoid systematic treatment bias at the threshold of viability.13 For harmonization with Vermont Oxford Network data, minor changes with inconsequential effects on NICU rankings have been made to variable definitions (SAS code available on request).
FIGURE 1.
Study population flowchart.
Patient transfers may bias NICU performance assessments. Therefore, we developed algorithms to minimize undue credit or penalty for care delivered elsewhere (details available on request):
only infants with, at most, 3 admission records from 2 hospitals are included;
if the birth hospital transfers an infant by 3 days of age (day 1 is the day of birth), subsequent relevant outcomes (eg, chronic lung disease) accrue to the receiving hospital (counted as missing for birth hospital); and
if the birth hospital transfers an infant after 3 days of age, subsequent relevant outcomes accrue to the birth hospital (counted as missing for receiving hospital).
Sensitivity analyses have shown these assumptions to be robust to alternative scenarios.8,14
Measures
Outcome Variable
Baby-MONITOR: Measures for the composite were selected via a formal Delphi process11 and affirmed in a clinical sample.10 CPQCC collects clinical data in a prospective fashion by using the standard definitions developed by the Vermont Oxford Network. The measures were expressed as binary variables at the patient level and as proportions at the unit level. They include: (1) any antenatal steroid administration; (2) moderate hypothermia (<36°C) on admission; (3) nonsurgically induced pneumothorax; (4) health care–associated bacterial or fungal infection; (5) chronic lung disease (oxygen requirement at 36 weeks’ gestational age); (6) timely eye examination (retinopathy of prematurity screening at the age recommended by the American Academy of Pediatrics); (7) any human breast milk at discharge from the hospital; (8) mortality during the birth hospitalization, and (9) growth velocity (less or more than the median of 13.1 g/kg per day). Growth velocity was determined according to a logarithmic function.15
Variable of Interest: Racial and Ethnic Background
This variable is reported on the basis of maternal race. The CPQCC race classification scheme (1) includes non-Hispanic white, African American, and Hispanic groups; (2) combines Asian and Pacific Islander groups and American Indian or Alaskan Native groups; and (3) includes a residual “Other” category. For this analysis, we collapsed the American Indian or Alaskan Native group with the Other category. Henceforth, we label these groups as white, African American, Hispanic, and Asian American. The classification scheme allows for only a single choice. Local data collectors are encouraged to retrieve this variable based on the Automated Vital Statistics System, which is used in all birthing hospitals in California to produce paper and electronic birth certificates. The Automated Vital Statistics System collects ethnicity and race data in a manner consistent with new state and federal standards for multiple race reporting. Assigning maternal ethnicity and race on the basis of appearance, language, or other personal attributes or without the direct assistance of the informant is discouraged. If multiple races are recorded in the Automated Vital Statistics System, the race that appears first in the hierarchy is recorded.
Additional Covariates: Clinical Variables
We applied CPQCC standard operational definitions for all variables, including prenatal care, sex, weight for gestational age below the 10th percentile, birth at a different hospital, multiple birth, 5-minute Apgar score and cesarean delivery. Gestational age at birth was categorized into gestation groups of 25 weeks to 27 weeks and 6 days; 28 weeks to 29 weeks and 6 days; and 30 weeks or more on the basis of similar patient numbers among groups. Each Apgar score was categorized as <4, 4 to 6, and >6.
Analyses
Baby-MONITOR Scores
Derivation of Baby-MONITOR scores has been described elsewhere.8 In brief, subcomponents of the composite are individually risk adjusted. Variables are aligned so that a higher value represents a better outcome. Measures are standardized by using the Draper-Gittoes method specifically developed for benchmarking and validity with small sample sizes.16 With this method, a standardized observed minus expected z score is calculated. Each z score is then equally weighted and averaged to derive a Baby-MONITOR score for each NICU. Scores are expressed in standard units. The meaning of a 1-standard-unit change is nonlinear across the distribution; for example, if a NICU raises its standardized score on a component of the Baby-MONITOR from 0 to +1, this NICU would move from the 50th percentile of the NICU distribution to the 84th percentile, whereas a move from +1 to +2 in standard units corresponds to going from the 84th percentile to the 98th percentile. Broadly speaking, an increase of 1 in standardized score is large in clinical terms for any NICU whose standardized score before the move was anywhere from −2 to +2.
Objective 1
The first objective was to calculate the variation in Baby-MONITOR and component scores and the effect of adjustment by race and/or ethnicity on NICU rankings. We computed risk-adjusted scores for the Baby-MONITOR and each of its subcomponents for each racial and/or ethnic group (standardized to the entire sample) and used analysis of variance to assess differences in quality scores. We also evaluated NICU performance with and without adjustment for race and/or ethnicity. Adjustment was done at the individual-measure level by following National Quality Forum recommendations.17 The rationale for this approach is that quality measurement must adequately account for the social risk; without such adjustment, providers who serve high-risk populations would be treated unfairly. We tested whether NICU ranks differed significantly with adjustment for race and/or ethnicity and evaluated the contribution of each race and/or ethnicity to rankings.
Objective 2
The second objective was to measure the racial and/or ethnic disparity at the NICU level. For each NICU, we calculated Baby-MONITOR scores for white, African American, Hispanic, and Asian American infants separately and referenced scores for each subgroup against white infants. Each group’s scores were standardized to the overall California population. With this approach, each NICU’s performance is stratified by each racial and/or ethnic subgroup. Stratification allows performance to be displayed by subgroup without providing a quality assessment benefit to a hospital for serving high-risk populations.
Human Subjects Compliance
This study was approved by the Stanford Institutional Review Board.
Results
Sample Characteristics
This study included 18 616 VLBW infants with 19 661 hospital records (5010 white, 2530 African American, 8191 Hispanic, 2357 Asian American, 474 Other, and 54 of unknown race and/or ethnicity) in 134 NICUs. Of these NICUs, 26 self-designated as Level II, 88 as Level III, and 20 as Level IV.18
Table 1 shows population and NICU characteristics for the combined VLBW sample. Hispanics represent the largest group of infants in California. Hispanic and African American infants are born at significantly lower gestational ages. Most infants, irrespective of race and/or ethnicity, access prenatal care. White infants, and to a lesser degree Asian American infants, are more likely to experience a multiple birth or a birth at advanced maternal age. African Americans had lower Apgar scores. Hispanic infants were most likely to require transfer after birth.
TABLE 1.
Infant Baseline Characteristics
| Characteristics | All Infants (N = 18 616) | White (N = 5010) | African American (N = 2530) | Hispanic (N = 8191) | Asian American (N = 2357) | Other (N = 474) | P | ||||||
|---|---|---|---|---|---|---|---|---|---|---|---|---|---|
| n/N | % | n/N | % | n/N | % | n/N | % | n/N | % | n/N | % | ||
| Birth weight (g) | |||||||||||||
| <751 | 1654/18 616 | 9 | 389/5010 | 8 | 292/2530 | 12 | 749/8191 | 9 | 172/2357 | 7 | 46/474 | 10 | .401 |
| 751–1000 | 4284/18 616 | 23 | 1082/5010 | 22 | 643/2530 | 25 | 1915/8191 | 23 | 511/2357 | 22 | 119/474 | 25 | — |
| 1001–1250 | 5358/18 616 | 29 | 1434/5010 | 29 | 719/2530 | 28 | 2393/8191 | 29 | 668/2357 | 28 | 128/474 | 27 | — |
| 1251–1500 | 7320/18 616 | 39 | 2105/5010 | 42 | 876/2530 | 35 | 3134/8191 | 38 | 1006/2357 | 43 | 181/474 | 38 | — |
| Gestational age (wk) | |||||||||||||
| 25–27 | 5843/18 616 | 31 | 1442/5010 | 29 | 841/2530 | 33 | 2740/8191 | 33 | 640/2357 | 27 | 159/474 | 34 | <.001 |
| 28–29 | 5359/18 616 | 29 | 1485/5010 | 30 | 718/2530 | 28 | 2349/8191 | 29 | 681/2357 | 29 | 112/474 | 24 | — |
| >29 | 7414/18 616 | 40 | 2083/5010 | 42 | 971/2530 | 38 | 3102/8191 | 38 | 1036/2357 | 44 | 203/474 | 43 | — |
| Boy | 9494/18 615 | 51 | 2556/5009 | 51 | 1234/2530 | 49 | 4247/8191 | 52 | 1193/2357 | 51 | 237/474 | 50 | .103 |
| Prenatal care | 17 950/18 566 | 97 | 4820/5004 | 96 | 2382/2522 | 94 | 7912/8160 | 97 | 2322/2354 | 99 | 466/472 | 99 | <.001 |
| Multiple gestation | 5132/18 615 | 28 | 1941/5010 | 39 | 669/2530 | 26 | 1655/8190 | 20 | 726/2357 | 31 | 123/474 | 26 | <.001 |
| Cesarean delivery | 14 163/18 616 | 76 | 3959/5010 | 79 | 1902/2530 | 75 | 6101/8191 | 74 | 1791/2357 | 76 | 368/474 | 78 | <.001 |
| SGA | 4761/18 616 | 26 | 1209/5010 | 24 | 547/2530 | 22 | 2233/8191 | 27 | 642/2357 | 27 | 129/474 | 27 | <.001 |
| Maternal age (y) | |||||||||||||
| <20 | 1374/18 607 | 7 | 202/5004 | 4 | 242/2530 | 10 | 850/8189 | 10 | 53/2357 | 2 | 24/474 | 5 | <.001 |
| 20–29 | 7511/18 607 | 40 | 1816/5004 | 36 | 1233/2530 | 49 | 3700/8189 | 45 | 567/2357 | 24 | 179/474 | 38 | — |
| 30–39 | 8429/18 607 | 45 | 2566/5004 | 51 | 917/2530 | 36 | 3205/8189 | 39 | 1468/2357 | 62 | 245/474 | 52 | — |
| >39 | 1293/18 607 | 7 | 420/5004 | 8 | 138/2530 | 5 | 434/8189 | 5 | 269/2357 | 11 | 26/474 | 5 | — |
| 5-min Apgar score | |||||||||||||
| 0–3 | 618/18 523 | 3 | 150/4992 | 3 | 106/2513 | 4 | 296/8143 | 4 | 49/2352 | 2 | 12/470 | 3 | <.001 |
| 4–6 | 2518/18 523 | 14 | 654/4992 | 13 | 430/2513 | 17 | 1084/8143 | 13 | 285/2352 | 12 | 61/470 | 13 | — |
| 7–10 | 15 387/18 523 | 83 | 4188/4992 | 84 | 1977/2513 | 79 | 6763/8143 | 83 | 2018/2352 | 86 | 397/470 | 84 | — |
| Transferred in | 1621/18 616 | 9 | 466/5010 | 9 | 172/2530 | 7 | 796/8191 | 10 | 115/2357 | 5 | 61/474 | 13 | <.001 |
| Antenatal steroids | 15 517/17 786 | 87 | 4236/4775 | 89 | 2069/2420 | 85 | 6819/7864 | 87 | 1976/2234 | 88 | 376/443 | 85 | <.001 |
| Hypothermia | 1694/18 465 | 9 | 417/4979 | 8 | 255/2508 | 10 | 695/8117 | 9 | 266/2334 | 11 | 57/473 | 12 | <.001 |
| Pneumothorax | 551/18 613 | 3 | 208/5010 | 4 | 52/2529 | 2 | 213/8190 | 3 | 53/2356 | 2 | 24/474 | 5 | <.001 |
| HAI | 1355/18 338 | 7 | 320/4931 | 6 | 186/2490 | 7 | 651/8062 | 8 | 152/2337 | 7 | 41/466 | 9 | .004 |
| CLD | 3408/17 636 | 19 | 898/4756 | 19 | 443/2394 | 19 | 1569/7720 | 20 | 395/2264 | 17 | 94/450 | 21 | .015 |
| Timely eye examination | 12 255/12 896 | 95 | 3259/3401 | 96 | 1663/1766 | 94 | 5495/5809 | 95 | 1508/1571 | 96 | 295/313 | 94 | .011 |
| Any human milk at DC | 12 306/18 612 | 66 | 3543/5010 | 71 | 1301/2530 | 51 | 5295/8187 | 65 | 1818/2357 | 77 | 320/474 | 68 | <.001 |
| In-hospital mortality | 773/18 558 | 4 | 203/4996 | 4 | 110/2523 | 4 | 357/8160 | 4 | 80/2351 | 3 | 20/474 | 4 | .320 |
| High growth velocity | 7851/15 650 | 50 | 2175/4241 | 51 | 1226/2085 | 59 | 3212/6880 | 47 | 1037/2025 | 51 | 192/404 | 48 | <.001 |
CLD, chronic lung disease; DC, discharge; HAI, health care–associated infection; SGA, small for gestational age (<10th Percentile); —, not applicable.
Regarding unadjusted components of quality in the Baby-MONITOR, compared with white infants, African American and Hispanic infants were less likely to receive antenatal steroid therapy, a timely retinopathy examination, or any human breast milk at discharge from the hospital. Both groups were also more likely to acquire a health care–associated infection. On the other hand, African American infants were slightly less likely to suffer a pneumothorax and achieved better growth.
Objective 1: Variation in Baby-MONITOR and Component Scores and the Effect of Adjustment by Race and/or Ethnicity on NICU Rankings
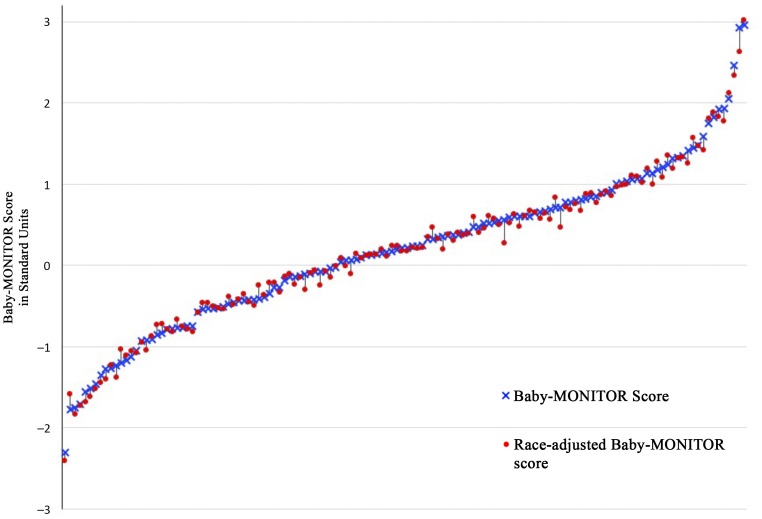
The variation in performance between NICUs is notable, spanning 5.26 (range −2.30 to 2.96) standard units across all NICUs. Individual racial and/or ethnic subgroup scores varied similarly: −1.93 to 2.48 (whites), −1.04 to 1.54 (African Americans), −1.68 to 2.16 (Hispanics), and −0.94 to 1.66 (Asian Americans). Overall unadjusted mean (SD) Baby-MONITOR scores were 0.19 (0.96) standard units and changed little after adjustment (0.17 [0.95]). Figure 2 shows NICU performance on the Baby-MONITOR with and without adjustment for race and/or ethnicity. Scores >0 indicate better than expected performance, and scores <0 indicate worse than expected performance. The Pearson correlation coefficient between adjusted and unadjusted Baby-MONITOR scores was (r = 0.995, P < .001).
FIGURE 2.
Baby-MONITOR scores with and without adjustment for race and/or ethnicity. Baby-Monitor scores are expressed in SD units, unadjusted (o) and adjusted (x) for race and/or ethnicity. NICUs with more than 20 infants during the study periods are shown (120 NICUs). Adjustment for race and/or ethnicity has a minimal effect on NICU rankings (Pearson correlation = 0.995 [P < .0001]).
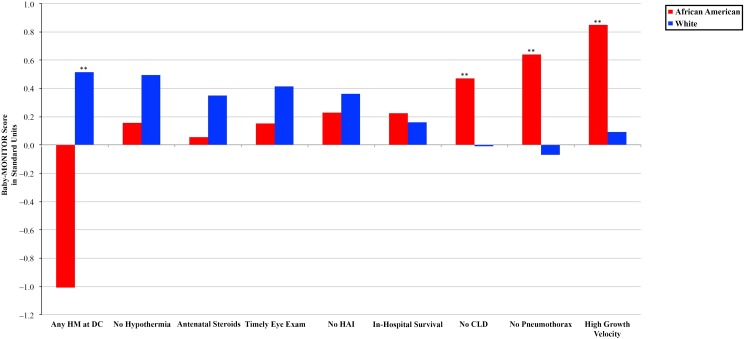
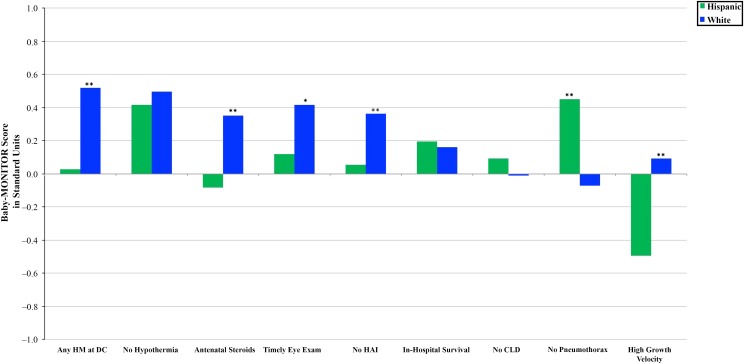
For the overall population, mean Baby-MONITOR scores differed by racial and/or ethnic groups. Compared with whites (0.24 [0.6]), Hispanics (0.09 [0.7]; P < .023), and Other races and/or ethnicities (0.09 (0.4); P < .036) had significantly lower quality scores. Scores for African Americans (0.2 [0.5]; P = .550) and Asian Americans (0.28 [0.5]; P < .556) were not significantly different from those of whites. We also found significant variation among racial and/or ethnic groups across individual subcomponents of the composite. Figures 3 and 4 show subcomponent scores by race and/or ethnicity. These analyses revealed interesting patterns. First, compared with white infants, African American infants had higher chronic lung disease, pneumothorax, and growth velocity scores and lower any-human-milk-at-hospital-discharge scores. In comparison with Hispanic infants, white infants achieved equal or significantly higher scores across all subcomponents except the subcomponent measuring pneumothorax rates. Second, whites generally appeared to score higher on measures of process considered indicative of high-quality care, which should not differ by race and/or ethnicity. These included antenatal steroids, hypothermia on admission (although not significantly different), timely eye examination, health care–associated infections, and any human breast milk at discharge from the hospital (we construe the latter 2 as markers of care process, recognizing that they could be understood as process-intense outcomes). Regarding outcome measures, African Americans tended to score higher than whites. Hispanics’ scores were similar to those of whites, except Hispanics scored significantly higher for pneumothorax rates yet lower for growth velocity (see Supplemental Table 2).
FIGURE 3.
Baby-MONITOR subcomponent score by race and/or ethnicity. Each subcomponent is listed on the x-axis; standardized observed minus expected z scores are shown on the y-axis. Scores >0 indicate better than expected performance. Comparison of African American and white infants. HM, human milk. ** P < .05, * P < .1.
FIGURE 4.
Baby-MONITOR subcomponent score by race and/or ethnicity. Each subcomponent is listed on the x-axis; standardized observed minus expected z scores are shown on the y-axis. Comparison of Hispanic and white infants. CLD, chronic lung disease; DC, discharge; HAI, health care–associated infection; HM, human milk. ** P < .05, * P < .1.
Objective 2: Racial and/or Ethnic Disparity at the NICU Level
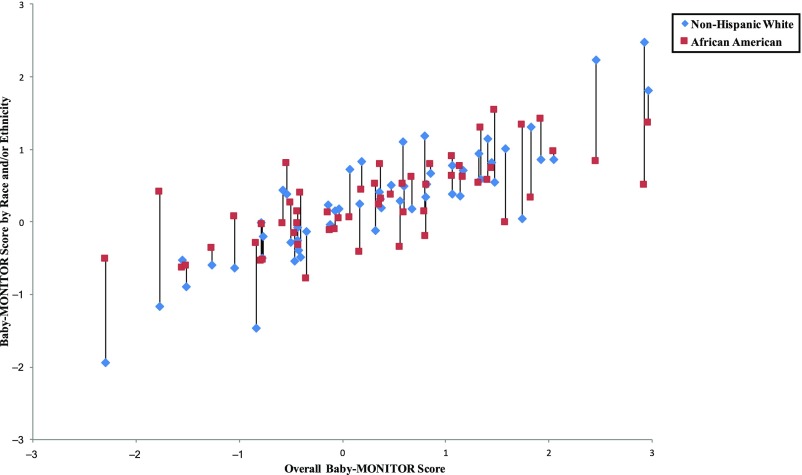
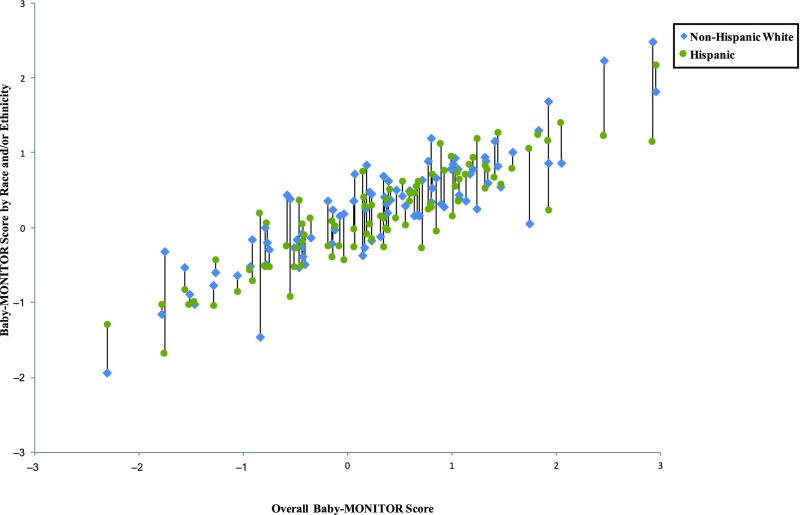
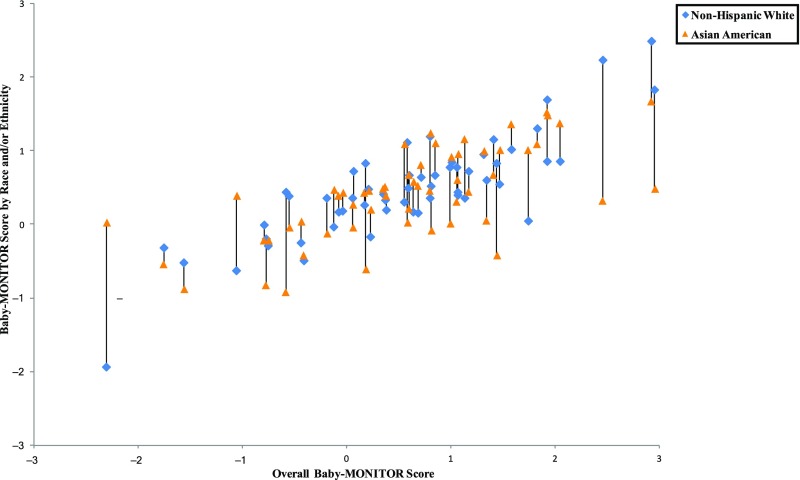
In Figs 5–8, we exhibit composite scores stratified by race and/or ethnicity. Overall Baby-MONITOR scores are recorded on the x-axis, and each NICU’s white, Asian American, African American, or Hispanic infants, respectively, are shown on the y-axis. Ideally, a NICU would fall in the right upper quadrant with high overall scores and little racial and/or ethnic difference between scores. Stratification reveals intriguing insights into the relation between NICU-level disparity and quality. Although we found only small differences between racial and/or ethnic groups in infant-level analyses, wide differences exist at the NICU level. In Fig 5, we show a significant positive correlation between overall and race-specific Baby-MONITOR scores between African American and white infants across NICUs (Pearson, r [white] = 0.88, r [African American] = 0.70, both P = < 0.001; see also Supplemental Fig 9). In NICUs that provide poor overall quality of care, the disparity is small, or even inverted (white infants fare worse than African American infants). As quality scores rise, whites tend to perform better than African Americans. However, African Americans in high-performing NICUs often fare better than African Americans in low-performing NICUs. Figure 6 compares white and Hispanic infants. With some exceptions, white infants appear to fare better than Hispanic infants in most NICUs, irrespective of overall performance (r [Hispanic] = 0.89, P = < .001). In Fig 7, we compare white and Asian American infants and show similar results, although the correlation is not as strong. Even in low-performing NICUs, Asian American infants fare well and often better than white infants. In most NICUs, care for these 2 groups is quite similar (r [Asian American] = 0.69, P = < .001). In Fig 8, we show 40 NICUs with a minimum of 10 infants in each of the 4 racial and/or ethnic groups. Asian Americans and whites predominate in achieving the highest scores across the NICUs.
FIGURE 5.
Baby-MONITOR scores for each NICU by race and/or ethnicity. NICUs with at least 10 infants in each race are shown in the graphs. Race- and/or ethnicity-specific Baby-MONITOR scores standardized against all infants are used (y-axis). The overall composite score (not race- and/or ethnicity-adjusted) is used on x-axis. The correlations with the overall Baby-MONITOR score are as follows: white = 0.88; African American = 0.70; Hispanic = 0.89; Asian American = 0.69; all P < .0001. Overall and white versus African American (n =53).
FIGURE 6.
Baby-MONITOR scores for each NICU by race and/or ethnicity. NICUs with at least 10 infants in each race are shown in the graphs. Race- and/or ethnicity-specific Baby-MONITOR scores standardized against all infants are used (y-axis). The overall composite score (not race- and/or ethnicity-adjusted) is used on x-axis. The correlations with the overall Baby-MONITOR score are as follows: white = 0.88; African American = 0.70; Hispanic = 0.89; Asian American = 0.69; all P < .0001. Overall and white versus Hispanic (n = 88).
FIGURE 7.
Baby-MONITOR scores for each NICU by race and/or ethnicity. NICUs with at least 10 infants in each race are shown in the graphs. Race- and/or ethnicity-specific Baby-MONITOR scores standardized against all infants are used (y-axis). The overall composite score (not race- and/or ethnicity-adjusted) is used on x-axis. The correlations with the overall Baby-MONITOR score are as follows: white = 0.88; African American = 0.70; Hispanic = 0.89; Asian American = 0.69; all P < .0001. Overall and white versus Asian American (n = 53).
FIGURE 8.
Baby-MONITOR scores for each NICU by race and/or ethnicity. NICUs with at least 10 infants in each race are shown in the graphs. Race- and/or ethnicity-specific Baby-MONITOR scores standardized against all infants are used (y-axis). The overall composite score (not race- and/or ethnicity-adjusted) is used on x-axis. The correlations with the overall Baby-MONITOR score are as follows: white = 0.88; African American = 0.70; Hispanic = 0.89; Asian American = 0.69; all P < .0001. Overall and all races and/or ethnicities (n = 40).
Discussion
The main findings from our study are (1) that large racial and/or ethnic differences in quality exist between and within NICUs, (2) that the quality deficit among disadvantaged populations is concentrated on modifiable measures of quality, and (3) that stratification rather than risk adjustment for racial and/or ethnic background appeared more informative for performance assessments of NICUs.
Significant racial and/or ethnic differences in quality between and within NICUs are a troubling finding. Reasons for worse quality scores for disadvantaged populations may arise from a variety of factors, including biologic, social, and organizational considerations. Although it is tempting to attribute these results to social risk, we note that our sample includes NICUs that predominantly serve high-risk populations yet achieve excellent performance.
Although some variation is expected, the difference between highest- and lowest-performing NICUs was extremely large overall (5.26 standard units). This heterogeneity is important because it suggests opportunities for improvement beyond preexisting social risk. Others have noted similar opportunities. Howell et al4 showed that raising the level of quality at minority-serving hospitals may eliminate up to a third of the disparity between African Americans and whites. Morales et al3 found significantly higher risk-adjusted neonatal mortality rates at minority-serving hospitals for both white and African American infants. Others showed that fewer minority infants were born at hospitals that achieved Magnet status and that infants at non-Magnet hospitals had significantly higher rates of morbidity and mortality.19
Another important finding of this article is that some of the disparity among disadvantaged populations is created by inferior performance among modifiable measures of process rather than outcome, suggesting a critical role for quality improvement efforts. Targeted, culturally competent care maybe highly effective in bridging the quality gap for these populations. This is particularly salient because efforts to reduce VLBW birth rates have mostly failed.20 In contrast, through quality improvement efforts, hospitals have demonstrated the ability to decrease disparities: Lee showed that Hispanic mothers were less likely than white mothers to receive antenatal steroids,4 but after a CPQCC collaborative project and efforts by individual NICUs, this difference disappeared.21 The authors of another study showed substantially improved breast milk feeding rates among VLBW infants in an urban NICU.22 Thus, we argue that the disparity in risk that infants of disadvantaged populations acquire during pregnancy should be regarded as a malleable risk to be addressed through robust individualized process engineering.
In measuring both performance and disparity, researchers can motivate improvement efforts by highlighting differences in care and outcomes across hospitals. In our analyses, adjusting measures of quality by race and/or ethnicity did not substantially boost information content. However, with stratification by race and/or ethnicity, we provided NICUs with meaningful information about disparity within their own unit and in comparison with others. For example, several NICUs exhibited large differences in quality between racial and/or ethnic subgroups. And although, in some high-performing NICUs, whites had higher scores than African Americans or Hispanics, those African American and Hispanic infants still out-scored African Americans or Hispanics in lower-performing hospitals. On the other hand, in several low-performing NICUs, African American and Hispanic infants had higher scores than white infants. The reasons for this finding require more study but may include biological vulnerability, unmeasured social risk, or care delivery in settings primarily serving vulnerable populations.
The results of this study must be viewed in light of its design. Although the Baby-MONITOR was developed in a rigorous and explicit fashion and has been shown to be robust and suitable for researchers to use to discern overall quality of care among NICUs,8–11,14,23,24 the measure is still in evolution and requires additional validation. Furthermore, in this study, we relied on local abstractors to follow CPQCC standards in retrieving maternal race and/or ethnicity, and although the CPQCC conducts extensive data training, misclassification cannot be excluded. Other limitations include reliance on a single choice of maternal race and/or ethnicity, which excludes multiracial and/or ethnic births, and nonabstraction of paternal race and/or ethnicity, which may also influence infant outcomes. It is possible that these limitations may have biased our results, although the direction of the bias is unknown. In addition, there are many unmeasured factors (social, maternal, hospital, and infant) that may account for our findings. We are working to better understand these factors in more detail through linkage of state-based data sources. Moreover, in our multiyear study, we do not account for time trends. It is possible that with general improvements in patient care (51 of CPQCC NICUs participated in a collaborative to improve delivery room care),25 disparities across the overall composite or subcomponents may have decreased. Finally, although we only examine NICUs from 1 state in this study, our study reflects population-based results across the nation’s most populous state, which has broad racial and/or ethnic and geographic diversity.
Conclusions
Wide racial and/or ethnic differences in quality of care delivery do exist between and within NICUs. Stratification, rather than risk adjustment for race and/or ethnicity appeared to reveal more informational content for performance assessment.
Acknowledgments
We are deeply grateful to the CPQCC member NICUs for contributing data to this study. Drs Horbar and Edwards were instrumental in providing guidance for harmonization of the Baby-MONITOR with the data structure of the Vermont Oxford Network. We would also like to thank Aloka Patel and the Rush University Medical Center for granting Dr Profit a nonexclusive license to use Rush’s exponential infant growth model for noncommercial research purposes.
Glossary
- CPQCC
California Perinatal Quality Care Collaborative
- VLBW
very low birth weight
Footnotes
Dr Profit had full access to all of the data in the study and takes responsibility for the integrity of the data and the accuracy of the data analysis, acquired funding for this study, conceptualized and designed the study, selected data for inclusion in analyses, analyzed the data, interpreted the results, and drafted the initial manuscript; Drs Gould, Goldstein, Draper, and Phibbs helped design the analysis and interpret the results, and they revised the manuscript; Dr Bennett executed the analysis, helped to interpret the results, and revised the manuscript; Dr Lee helped design the study, assisted with interpretation of the results, and revised the manuscript; and all authors approved the final manuscript as submitted.
The content of this article is solely the responsibility of the authors and does not necessarily represent the official views of the Eunice Kennedy Shriver National Institute of Child Health and Human Development or the National Institutes of Health.
FINANCIAL DISCLOSURE: The authors have indicated they have no financial relationships relevant to this article to disclose.
FUNDING: Drs Profit and Lee are supported by grants from the Eunice Kennedy Shriver National Institute of Child Health and Human Development (R01 HD083368-01 and R01 HD08467-01, Profit; K23HD068400, Lee). Funded by the National Institutes of Health (NIH).
POTENTIAL CONFLICT OF INTEREST: The authors have indicated they have no potential conflicts of interest to disclose.
COMPANION PAPER: A companion to this article can be found online at www.pediatrics.org/cgi/doi/10.1542/peds.2017-2213.
References
- 1.Wise PH. The anatomy of a disparity in infant mortality. Annu Rev Public Health. 2003;24:341–362 [DOI] [PubMed] [Google Scholar]
- 2.Smedley B, Stith A. Unequal Treatment: Confronting Racial and Ethnic Disparities in Health Care. Washington, DC: Institute of Medicine; 2003 [PubMed] [Google Scholar]
- 3.Morales LS, Staiger D, Horbar JD, et al. . Mortality among very low-birthweight infants in hospitals serving minority populations. Am J Public Health. 2005;95(12):2206–2212 [DOI] [PMC free article] [PubMed] [Google Scholar]
- 4.Howell EA, Hebert P, Chatterjee S, Kleinman LC, Chassin MR. Black/white differences in very low birth weight neonatal mortality rates among New York City hospitals. Pediatrics. 2008;121(3). Available at: www.pediatrics.org/cgi/content/full/121/3/e407 [DOI] [PubMed] [Google Scholar]
- 5.Lee HC, Lyndon A, Blumenfeld YJ, Dudley RA, Gould JB. Antenatal steroid administration for premature neonates in California. Obstet Gynecol. 2011;117(3):603–609 [DOI] [PMC free article] [PubMed] [Google Scholar]
- 6.Lee HC, Gould JB. Factors influencing breast milk versus formula feeding at discharge for very low birth weight infants in California. J Pediatr. 2009;155(5):657–62.e1, 2 [DOI] [PubMed] [Google Scholar]
- 7.National Quality Forum Composite measure evaluation framework and national voluntary consensus standards for mortality and safety–composite measures: a consensus report. 2009. Available at: http://www.qualityforum.org/Publications/2009/08/Composite_Measure_Evaluation_Framework_and_National_Voluntary_Consensus_Standards_for_Mortality_and_Safety%E2%80%94Composite_Measures.aspx
- 8.Profit J, Kowalkowski MA, Zupancic JA, et al. . Baby-MONITOR: a composite indicator of NICU quality. Pediatrics. 2014;134(1):74–82 [DOI] [PMC free article] [PubMed] [Google Scholar]
- 9.Profit J, Zupancic JA, Gould JB, et al. . Correlation of neonatal intensive care unit performance across multiple measures of quality of care. JAMA Pediatr. 2013;167(1):47–54 [DOI] [PMC free article] [PubMed] [Google Scholar]
- 10.Kowalkowski M, Gould JB, Bose C, Petersen LA, Profit J. Do practicing clinicians agree with expert ratings of neonatal intensive care unit quality measures? J Perinatol. 2012;32(4):247–252 [DOI] [PMC free article] [PubMed] [Google Scholar]
- 11.Profit J, Gould JB, Zupancic JA, et al. . Formal selection of measures for a composite index of NICU quality of care: Baby-MONITOR. J Perinatol. 2011;31(11):702–710 [DOI] [PMC free article] [PubMed] [Google Scholar]
- 12.Gould JB. The role of regional collaboratives: the California Perinatal Quality Care Collaborative model. Clin Perinatol. 2010;37(1):71–86 [DOI] [PubMed] [Google Scholar]
- 13.Peerzada JM, Richardson DK, Burns JP. Delivery room decision-making at the threshold of viability. J Pediatr. 2004;145(4):492–498 [DOI] [PubMed] [Google Scholar]
- 14.Profit J, Gould JB, Bennett M, et al. . The association of level of care with NICU quality. Pediatrics. 2016;137(3):e20144210. [DOI] [PMC free article] [PubMed] [Google Scholar]
- 15.Patel AL, Engstrom JL, Meier PP, Kimura RE. Accuracy of methods for calculating postnatal growth velocity for extremely low birth weight infants. Pediatrics. 2005;116(6):1466–1473 [DOI] [PubMed] [Google Scholar]
- 16.Draper D, Gittoes M. Statistical analysis of performance indicators in UK higher education. J R Stat Soc Ser A Stat Soc. 2004;167(3):449–474 [Google Scholar]
- 17.National Quality Forum Risk adjustment for socioeconomic status or other sociodemographic factors. 2014. Available at: http://www.qualityforum.org/Publications/2014/08/Risk_Adjustment_for_Socioeconomic_Status_or_Other_Sociodemographic_Factors.aspx.
- 18.Taylor R, Bower A, Girosi F, Bigelow J, Fonkych K, Hillestad R. Promoting health information technology: is there a case for more-aggressive government action? There are sufficient reasons for the federal government to invest now in policies to speed HIT adoption and accelerate its benefits. Health Aff. 2005;24(5):1234–1245 [DOI] [PubMed] [Google Scholar]
- 19.Lake ET, Staiger D, Horbar J, et al. . Association between hospital recognition for nursing excellence and outcomes of very low-birth-weight infants. JAMA. 2012;307(16):1709–1716 [DOI] [PMC free article] [PubMed] [Google Scholar]
- 20.Behrman RE, Stith Butler A, eds. Preterm Birth: Causes, Consequences, and Prevention. Washington, DC: National Academies Press; 2007 [PubMed] [Google Scholar]
- 21.Profit J, Goldstein BA, Tamaresis J, Kan P, Lee HC. Regional variation in antenatal corticosteroid use: a network-level quality improvement study. Pediatrics. 2015;135(2). Available at: www.pediatrics.org/cgi/content/full/135/2/e397 [DOI] [PMC free article] [PubMed] [Google Scholar]
- 22.Dereddy NR, Talati AJ, Smith A, Kudumula R, Dhanireddy R. A multipronged approach is associated with improved breast milk feeding rates in very low birth weight infants of an inner-city hospital. J Hum Lact. 2015;31(1):43–46 [DOI] [PubMed] [Google Scholar]
- 23.Profit J, Gould JB, Draper D, et al. . Variations in definitions of mortality have little influence on neonatal intensive care unit performance ratings. J Pediatr. 2013;162(1):50–55.e2 [DOI] [PMC free article] [PubMed] [Google Scholar]
- 24.Profit J, Typpo KV, Hysong SJ, Woodard LD, Kallen MA, Petersen LA. Improving benchmarking by using an explicit framework for the development of composite indicators: an example using pediatric quality of care. Implement Sci. 2010;5:13. [DOI] [PMC free article] [PubMed] [Google Scholar]
- 25.Lee HC, Powers RJ, Bennett MV, et al. . Implementation methods for delivery room management: a quality improvement comparison study. Pediatrics. 2014;134(5). Available at: www.pediatrics.org/cgi/content/full/134/5/e1378 [DOI] [PMC free article] [PubMed] [Google Scholar]


