

Abstract
Type 2 diabetes (T2D) has many cardiovascular complications, including a thrombotic propensity. Many such chronic, inflammatory diseases are accompanied (and may be exacerbated, and possibly even largely caused) by amyloid fibril formation. Recognising that there are few strong genetic associations underpinning T2D, but that amyloidogenesis of amylin is closely involved, we have been seeking to understand what might trigger the disease. Serum levels of bacterial lipopolysaccharide are raised in T2D, and we recently showed that fibrin(ogen) polymerisation during blood clotting can be affected strongly by LPS. The selectivity was indicated by the regularisation of clotting by lipopolysaccharide-binding protein (LBP). Since coagulopathies are a hallmark of T2D, we wondered whether they might too be caused by LPS (and reversed by LBP). We show here, using SEM and confocal microscopy, that platelet-poor-plasma from subjects with T2D had a much greater propensity for hypercoagulability and for amyloidogenesis, and that these could both be reversed by LBP. These data imply that coagulopathies are an important feature of T2D, and may be driven by ‘hidden’ LPS. Given the prevalence of amyloid formation in the sequelae of diabetes, this opens up novel strategies for both the prevention and treatment of T2D.
Introduction
There is an increasing recognition that many chronic, inflammatory diseases are accompanied (and may be exacerbated, and possibly even largely caused) by amyloid fibril formation1–6. An amyloid fibril (protein) is defined as: “a protein that is deposited as insoluble fibrils, mainly in the extracellular spaces of organs and tissues as a result of sequential changes in protein folding that result in a condition known as amyloidosis”7. The nature and location of the amyloid typically reflects the disease, such that Parkinson’s is accompanied by amyloid forms of α-synuclein in the substantia nigra pars compacta8–10, Alzheimer’s by fibrillar forms of Aβ1-40/42 in many parts of the brain11–13, and type 2 diabetes – a disease with few genome-wide associations14 – by amylin fibrils in the insulin-producing cells of the pancreas15–25.
One characteristic of these kinds of fibril is their diameter, which is typically in the range 10–20 nm. By contrast, another type of protein fibre is represented by the fibrin produced during blood clotting. Under normal conditions, the fibres forming the clot have an appearance in a scanning electron microscope like cooked spaghetti, and the fibres have diameters of the order of 80–110 nm26–30. We and others have observed that this diameter can be decreased to something closer to 40 nm in various vascular and inflammatory diseases, including stroke27 and diabetes31–33. This is accompanied by many other changes in overall clot morphology and properties (e.g. for diabetes31, 33–39).
Fibrin is produced by the polymerisation of the protein fibrinogen under the action of thrombin, that removes two fibrinopeptides, thereby allowing the fibrinogen to self-assemble via a ‘knobs and holes’ mechanism into fibres (e.g. refs 40–44), but with no particularly marked changes in secondary structure40, 45–48. A final, transglutaminase-based crosslinking step49 ensures the stability of the clot.
One hallmark of amyloid proteins is the formation of a rich β-sheet structure, perpendicular to the fibres with a characteristic spacing (observable in X-ray reflections) of 4.7–4.8 Å (e.g. refs 4, 50–53, while another is the strong fluorescence observable (when excited ca 440 nm) when thioflavin T is bound to them (e.g. refs 54–59). Normal amyloidosis is rather slow, so needs some kind of ‘trigger’.
Although fibrin too is an insoluble fibre, fibrinogen has generally not been considered as amyloidogenic, nor fibrin as an amyloid protein (although it can become so in the presence of a rare mutation in the fibrinogen a chain60–63). However, as part of an extensive study of anomalous blood clotting (e.g. refs 29, 30, 33, 64–68), we recently found48, 68–70 that the anomalous clotting was in fact amyloid in nature. The fact that it could be caused by tiny amounts of lipopolysaccharide was seen as consistent with a role for dormant bacteria in the aetiology of such diseases71–78. A particularly strong pointer was the fact that the amyloid formation was abolished when the LPS was administered together with a stoichiometric excess of human lipopolysaccharide binding protein (LBP)68.
There are also strong indications that both iron dysregulation64, 79, 80 and coagulopathies30, 67 accompany a variety of inflammatory diseases. Certainly, too, the amount of LPS is raised in diabetics81–83, and this can contribute to insulin resistance84. Thus, the question then arose as to whether the extent of fibrin-type amyloid in blood varies between type 2 diabetics and suitably matched controls, and whether the removal of any LPS using LBP affected this in any way. The present paper shows that the answers to both these questions are strongly in the affirmative.
Materials and Methods
Ethical statement
This study was approved by the Ethical Committee of the University of Pretoria (South Africa): ethics clearance number: 298/2016. A written form of informed consent was obtained from all donors (available on request). The methods were carried out in accordance with the approved guidelines. Blood was collected and methods were carried out in accordance with the relevant guidelines of the ethics committee. We adhered strictly to the Declaration of Helsinki.
Sample population
26 healthy individuals and 25 type 2 diabetes (T2D) individuals were included in the study. We have discussed the changes in clots of healthy individuals in the presence of LPS and LBP extensively in a recent publication68. The present healthy population therefore confirms repeatability of our previous results. Exclusion criteria for the healthy population were known inflammatory conditions such as asthma, human immunodeficiency virus (HIV) or tuberculosis, and risk factors associated with metabolic syndrome (including obesity/high BMI), smoking, and if female, being on contraceptive or hormone replacement treatment. This population did not take any anti-inflammatory medication. As our healthy population were aged between 22 and 91 with BMI < 24.9, we classify them as apparently healthy. We specifically chose not to include controls with increased BMI levels, as literature suggests that an increased BMI is associated with increased levels of inflammation, which may indeed be linked to amyloid formation; furthermore, obesity is also associated with increased endotoxin levels. As there are several levels of increased BMI, from only overweight to morbidly obese, the effect of BMI on clot structure, warrants a separate study.
T2D individuals were voluntarily recruited by their medical practitioner, from a Diabetic Clinic at the Steve Biko academic hospital, Pretoria, South Africa. Demographic data including age, gender, glucose level at time of sample collection, hemoglobin A1c (HbA1c) measures and medication used for typical comorbidities of T2D were recorded. Inclusion criteria consisted of both male and female participants, aged between 40 and 81 (oldest individual), with a diagnosis of T2D for more than 3 months prior to screening and without any signs of infection. Diabetic individuals were diagnosed per the Society for Endocrinology, Metabolism and Diabetes of South Africa (SEMSDA) guidelines. These guidelines follow the American Diabetes Association (ADA) criteria to define T2D. See Table 1 for medication usage. All the T2D individuals had a history of cardiovascular disease, and although a full history of co-morbidities including both macrovascular and microvascular co-morbidities are available in their patient records, we did not record the specific detail for the purposes of this study. All T2D had BMI’s of >25. Exclusion criteria for the T2D were conditions such as previously diagnosed cancer, asthma, human immunodeficiency virus (HIV) or tuberculosis, smoking, and if female, being on contraceptive or hormone replacement treatment. Ethical clearance was obtained from the Human Ethics Committee of the University of Pretoria. Whole blood of the participants was obtained in citrate tubes and platelet poor plasma (PPP) was used for confocal and SEM experiments.
Table 1.
Demographics for the healthy and the T2D individuals.
| HEALTHY INDIVIDUALS (n=26) (BMI: Normal: < 24.9) | ||||||
|---|---|---|---|---|---|---|
| Gender | Age | |||||
| Median; STD; % | F: 69%; M:31% | 59 (± 25) | ||||
| TYPE 2 DIABETES INDIVIDUALS (n=25) (BMI: Overweight: >25) | ||||||
| Gender | Age | HbA1c | Chol | HT | AC | |
| Median; STD; % | F: 56%; M: 44% | 61 (± 11) | 8.3 (± 2.19) | 88% | 84% | 80% |
HbA1c (%): (levels that are >7% are too high); Cholesterol medication (Chol): Simvastatin, Atorvastatin. Hypertension medication (HT): Coversyl, Amlodopin, Carvedilol, Adalat. Anticoagulant medication (AC): Aspirin or Disprin.
LPS and LPS-binding protein
The LPS used was from E. coli O111:B4 (Sigma, L2630). A final LPS exposure concentration of 0.2 ng.L−1 and a final LPS-binding protein (LBP) exposure concentration of 2 ng.L−1 LBP was used.
Airyscan and scanning electron microscopy: healthy plasma samples: addition of LPS and LBP with thrombin to plasma
PPP was also incubated for 10 minutes, with either LPS (LPS exposure concentration: 0.2 ng.L−1) or LBP (final exposure concentration of 2 ng.L−1). Also, samples were prepared where PPP was incubated with LPS (10 minutes), followed by addition of LBP (incubated for 10 minutes). Adding thrombin to either naïve PPP or PPP with the various added products, in the ratio 1:2, created extensive fibrin networks. For Airyscan preparation, before the thrombin addition, we added Thioflavin T (ThT) at a final concentration of 5 μM to 200 μL of various prepared PPP samples (incubated for one minute, and protected from light). For Airyscan samples, a coverslip was placed over the prepared clot, while the clots were washed, fixed in 4% formaldehyde and prepared for SEM according to known SEM preparation methods. Samples were viewed using a Zeiss LSM 510 META confocal microscope with a Plan-Apochromat 163 and 100×/1.4 Oil DIC objective. Excitation was at 488 nm and emitted light was measured at 505–550 nm. A Zeiss cross beam electron microscope was used to study fibrin fibres.
Airyscan and scanning electron microscopy: type 2 diabetes samples: addition of LBP with thrombin to plasma
Extensive fibrin networks were created by adding thrombin to naïve T2D PPP in the ratio 1:2. PPP was also incubated for 10 minutes with LBP (final exposure concentration of 2 ng.L−1). SEM and Airyscan samples were prepared and viewed as for healthy samples.
Statistical analysis
The non-parametric Mann–Whitney U test (between controls and T2D samples) and the parametric T-test was performed (within samples) using the STATSDIRECT software.
Results
Table 1 shows demographics for the healthy and the T2D groups, including HbA1c levels of T2D and their medication usage. The healthy individuals were on no medication and did not suffer from any inflammatory condition. Our diabetes population contains patients that are mostly on a plethora of medications for cardiovascular co-morbidities e.g. hyperlipidaemia, hypertension and they have high HbA1c levels. We used the definition and the diagnostic criteria used in defining “diabetes” according to the Society for Endocrinology, Metabolism and Diabetes of South Africa (SEMSDA) guidelines. These guidelines follow the American Diabetes Association (ADA) criteria to define T2D (https://diabetes.medicinematters.com/guidelines/diagnosis/what-is-new-in-the-2017-american-diabetes-association-standards-/11932360).
Airyscan results are shown in Figs 1, 2, 3 and 4 for the healthy and T2D population.
Figure 1.

Representative micrographs of PPP clots prepared from blood of two healthy individuals. (A and B) Micrographs were taken with a Zeiss LSM 510 META confocal microscope with a Plan-Apochromat 63x/1.4 Oil DIC objective. PPP was exposed to thioflavin T (ThT) (5 μM exposure concentration) followed by adding thrombin to create extensive fibrin clots.
Figure 2.

(A and B) Low magnification micrographs of healthy PPP with added 0.2 ng.L−1 LPS Micrographs were taken with a Zeiss LSM 510 META confocal microscope with a Plan-Apochromat 63x/1.4 Oil DIC objective. All PPP was exposed to thioflavin T (ThT) (5 μM) followed by adding thrombin to create extensive fibrin clots. Areas of increased fluorescence are seen in the great majority of the clot area.
Figure 3.
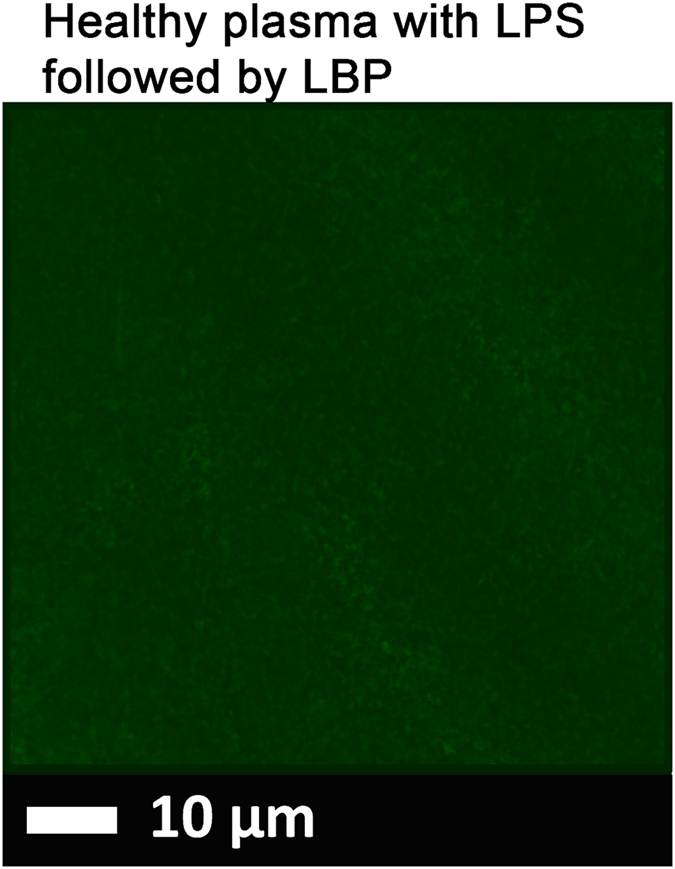
(A) A representative micrograph showing healthy PPP with added 0.2 ng.L−1 LPS (10 minutes exposure) followed by 2 ng.L−1 LPS-binding protein and thrombin. PPP with LPS and LBP was then exposed to thioflavin T (ThT) (5 μM exposure concentration) followed by adding thrombin to create extensive clot. Micrographs were taken with a Zeiss LSM 510 META confocal microscope with a Plan-Apochromatt 63x/1.4 Oil DIC objective. Nearly no fluorescence is visible.
Figure 4.

(A and C) Micrographs of PPP with added thrombin to form extensive fibrin fibres from 2 individuals with type 2 diabetes; (B and D) PPP from same individuals, but exposed to 2 ng.L−1 LPS-binding protein followed by addition of thrombin. Thioflavin T (ThT) (5 μM) was added before thrombin. Micrographs were taken with a Zeiss LSM 510 META confocal microscope with a Plan-Apochromat 63x/1.4 Oil DIC objective. LBP dramatically reduced the fluorescence seen in samples from patients with T2D.
Airyscan super-resolution microscopy
Healthy plasma with added LPS and LBP (Figs 1, 2 and 3).
In healthy PPP, in the presence of ThT, little to no fluorescence was noted, although (as in Fig. 1) there were occasional very small patches of fluorescence. However, when LPS had been added to the mixture prior to thrombin, fluorescence was greatly enhanced, suggesting increased binding of ThT to β-sheet-rich areas on the fibrin(ogen) (Fig. 2). Previously, we concluded that LPS binding causes the fibrinogen to polymerise into a form with a greatly increased amount of ß-sheet (in the presence of thrombin), reflecting amyloid formation68. This results in a strong fluorescence observable (when excited ca 440 nm) in the presence of ThT (see e.g. refs 56, 57). Here we also showed that even if we add LBP after LPS exposure, less ThT binding (fluorescence) is observed (Fig. 3). This suggests that LBP protects the fibres from LPS damage by binding to the pre-added LPS in the PPP, before clot formation is induced with thrombin.
Airyscan super-resolution microscopy
Naïve type 2 diabetes with and without added LBP (Fig. 4).
Extensive fluorescence was noted in all our T2D samples after incubation with ThT (examples in Fig. 4A,C). However, when PPPs from T2D patients was incubated with LBP, very little to no fluorescence was observed (Fig. 4B,D). This suggests that the added LBP binds to something, removing its effect, and here we suggest (i) that it is LPS that is present in the naïve T2D, which is known, and (ii) that it is this presence of the LPS that is in part responsible for the anomalous clotting in T2D plasma.
We also looked at the clot structure of plasma from healthy and T2D individuals, with added thrombin, using scanning electron microscopy (SEM). Previously we reported, and we confirm here, that LPS causes healthy plasma to from denser and more hypercoagulable clots (confirmed by using PPP form healthy individuals and purified fibrinogen, using thromboelastography, confocal microscopy, SEM and we also tested whether LPS would bind to fibrinogen directly, using isothermal calorimetry). In this paper, we also showed that added LBP has the capability to reverse the damage of the LPS. We suggested that LPS causes anomalous clotting that is actually amyloid protein48, 68.
Here, Fig. 5A shows a representative airyscan micrograph of a typical clot from a healthy individual and Fig. 5B shows a clot where LBP was incubated with plasma before clot formation. In our hands, LBP on its own does not change clot structure significantly. Figure 5C shows a clot formed when plasma had been pre-incubated with LPS, while Fig. 5D shows a clot that was formed with plasma, also pre-incubated with LPS, but followed by addition of LBP, and both with added thrombin. Raw data, extensive SOPs for airyscan and SEM, including micrographs can be accessed at https://1drv.ms/f/s!AgoCOmY3bkKHhHp9zfDsIR_0g9_f and on EP’s researchgate profile, https://www.researchgate.net/profile/Etheresia_Pretorius.
Figure 5.

(A) Representative clot structure from a healthy individual; (B) same PPP sample with added LBP; (C) same PPP sample with added LPS; (D) same PPP sample with added LPS, followed by LBP. All clots were created by adding thrombin to PPP.
SEM micrographs show that clots created from T2D PPP (Figs 6 and 7) have a structure similar to those from healthy PPP with added LPS. However, when LBP is added to PPP followed by thrombin, the structure is reverted to that of healthy PPP with added thrombin: see 5 k machine magnification micrographs of clots from T2D (Fig. 6A to D) and with added LBP (Fig. 6E to H). Figure 7A to F show micrographs with higher SEM magnifications (35 k machine magnification). Consequently, in this paper, we show that LBP added to naïve T2D plasma, followed by the addition of thrombin, led to a fibrin fibre structure similar to that of healthy PPP. The fluorescence (Airyscan) results were therefore confirmed by SEM.
Figure 6.

(A to D) PPP with added thrombin from 4 naïve type 2 diabetes samples (5 k machine magnification); (E to H) Same samples (5 k machine magnification) with added LBP (incubated for 10 minutes).
Figure 7.

(A to C) PPP with added thrombin from 3 naïve type 2 diabetes samples (35 k machine magnification); (D to F) same samples (35 k machine magnification), with added LBP (incubated for 10 minutes).
For a schematic model of a ‘healthy’ clot structure (i.e. a clot formed from the PPP of a healthy individual), and that found in T2D, see Fig. 8A,B. A typical clot is created by adding thrombin to PPP, and this is spread out onto a glass coverslip. The coagulum (clot) is then processed by fixation and dehydration. Such processed clots consist of three layers. These layers vary in thickness and structure depending upon whether the plasma was from a healthy individual or an individual with inflammation. A clot from a healthy individual consists of a bottom layer, which is caused by contact activation of the coagulum and the glass substrate. The second layer is the “true” clot, consisting of a fibrin fibre network of elongated fibres. Sometimes, the contact activation layer is visible through the spaghetti-like fibres. Depending on the preparation procedures, a third, top layer may form on the spaghetti-like fibres. This layer typically washes away during the fixing and dehydration process. However, it may sometimes be visible as patches of coagulum, similar to that of the contact activation layer at the bottom (see Fig. 8A). In T2D, the bottom contact activation layer is not easily distinguishable from the middle “true” clot area, and sparse spaghetti-like fibres are fused into the contact activation layer. This fused layer of matted fibrin may consist of thin branching individual fibres, with very small openings between the individual fibres, giving the impression of a matted plate. In previous publications, we have also referred to this complex and hypercoagulable clot structure as “dense matted deposits” (DMDs) (e.g. refs 48, 65, 68, 85). In T2D, a top netted layer is frequently observed. It mostly does not wash away during the various fixing and dehydration steps, and it forms nearly instantaneously when mixing thrombin with plasma to create the clot. This is due to the hypercoagulable nature of the plasma (see Fig. 8B). During confocal clot preparation, a wet clot is studied. The PPP and thrombin are mixed on a microscope slide and covered after 30 second with a coverslip. Although contact activation happens directly on the glass microscope slide, we therefore look at the fibrous part, which is similar to the middle “true clot” layers of the SEM clots in clots from healthy individuals.
Figure 8.

(A) Model of a fibrin clot formed from plasma from a healthy individual. (B) Model of a clot made using PPP taken from an individual with type 2 diabetes. A typical clot consists of 3 layers, fast coagulating top layer, middle fibrous layer and bottom, contact activation layer. The thickness and presence of these 3 layers vary between clots from healthy individuals and inflammatory clots.
Although Airyscan and SEM analysis are both typically used only as qualitative methods, we aimed to quantify the changes in clot structure. By inspection (see figures above) the control samples without LPS showed much more variance between light and dark pixels, while the samples forming dense matted deposits were more uniformly grey. It thus seemed logical to use this to seek to quantify and discriminate the images. We therefore used the coefficient of variation (CV) as our metric. Thus, while recognising that the pixel intensity data were not normally distributed, we used ImageJ to calculate the mean and standard deviation of the intensity of the pixels in the images of the clot, using the histogram function, followed by the calculation of the coefficient of variation (i.e. SD/mean) of the intensity of the clot structure. Figure 9A to D show examples of representative histograms of the 8-bit intensity for a typical SEM and confocal clot with and without LBP of a patient with T2D. Within-sample analysis was done with the paired T-test and between-samples analysis was done using the Mann-Whitney test. Table 2 shows statistical analysis of the difference in the coefficients of variation (CV) of the pixel intensities in the images of the different clots studied using SEM and Airyscan technology and Fig. 10 shows boxplots of the data.
Figure 9.

(A and B) Representative histograms of the 8-bit intensity for a typical SEM clot from PPP of an individual with type 2 diabetes (T2D) (A) and after addition of LBP (B). (C and D) Representative histograms of the 8-bit intensity for a typical Airyscan clot from PPP of an individual with T2D (C) and after addition of LBP.
Table 2.
Scanning electron microscopy data for type 2 diabetes and healthy individuals showing the coefficients of variation (CV) of the intensity of the pixels in the clot images and statistical analysis of the difference in the CV of the pixel intensities in the images of different clots studied using scanning electron microscopy and Airyscan technology.
| Type 2 Diabetes Sem Data Coefficient of Variation | Healthy Individual SEM data Coefficient of variation | |||||
|---|---|---|---|---|---|---|
| Naïve T2D | T2D treated with LBP | Naïve controls | Controls treated with LPS | Controls treated with LBP | Controls treated with LPS followed by LBP | |
| MEDIAN AND STD | 0.41 (± 0.10) | 0.63 (± 0.14) | 0.70 (± 0.12) | 0.41(± 0.09) | 0.75 (± 0.16) | 0.65 (± 0.19) |
| Scanning Electron Microscopy | ||||||
| Choice of Samples | Test Used | P-value | ||||
| Analysis between naïve T2D and naïve controls | Mann-Whitney | Two sided P < 0.0001 | ||||
| Analysis between naïve controls and controls treated with LPS | Paired T-test | Two sided P < 0.0001 | ||||
| Analysis between naïve T2D and T2D treated with LBP | Paired T-test | Two sided P < 0.0001 | ||||
| Analysis between naïve controls and controls treated with LBP | Paired T-test | Two sided P = 0.20 | ||||
| Analysis between naïve controls and controls treated with LPS followed by LBP | Paired T-test | Two sided P = 0.22 | ||||
| Analysis between controls treated with LPS and naïve T2D | Mann-Whitney | Two-sided P = 0.82 | ||||
| Analysis between T2D treated with LBP and naïve controls | Mann-Whitney | Two-sided P = 0.07 | ||||
| Analysis between T2D treated with LBP and controls treated with LPS followed by LBP | Mann-Whitney | Two sided P = 0.4 | ||||
| Analysis between controls treated with LBP and T2D treated with LBP | Mann-Whitney | Two sided P = 0.13 | ||||
| Airyscan Technology | ||||||
| Choice of Samples | Test Used | P-value | ||||
| Analysis between naïve T2D and naïve controls | Mann-Whitney | Two sided P = 0.001 | ||||
| Analysis between naïve controls and controls treated with LPS | Paired T-test | Two sided P = 0.009 | ||||
| Analysis between naïve T2D and T2D treated with LBP | Paired T-test | Two sided P < 0.0001 | ||||
| Analysis between naïve controls and controls treated with LPS followed by LBP | Paired T-test | Two sided P = 0.27 | ||||
| Analysis between controls treated with LPS and naïve T2D | Mann-Whitney | Two sided P = 0.80 | ||||
| Analysis between T2D treated with LBP and naïve controls | Mann-Whitney | Two sided P = 0.41 | ||||
| Analysis between T2D treated with LBP and controls treated with LPS followed by LBP | Mann-Whitney | Two sided P = 0.48 | ||||
Figure 10.

Boxplots of the distribution of the coefficients of variation (CV) of the pixel intensities of the SEM clot images from the different sample classes analysed (median CV for each group is above boxplots). Note that that the CVs of the clot structures of PPP from naïve T2D and that of healthy individuals with added LPS are both 0.41.
As shown in our stored raw data, our controls included 7 young controls (≤30 years). We used the paired t-test to compare SEM data from our younger group to our older group. No significant difference was seen between them (P = 0.1388), suggesting that, in this population, age did not affect clot structure.
Discussion
Notwithstanding the difficulty of defining its ‘concentration’ in serum73, as most of it is bound to macromolecules, it is known that in type 1 diabetes the serum load of endotoxin (LPS) is raised relative to that of controls86, and that this is associated with disease progression87. There can also be an association between LPS levels in the serum and T2D81–83, though the direction of causality (if any) is seemingly not known. It is also known that T2D is accompanied by various kinds of coagulopathies (with both hypercoagulability, e.g. refs 88–95 and hypofibrinolysis31, 36, 37, 39, 89, 92, 94, 96–101 being observable.
A question that can arise is why we did not measure the amount of LPS in the plasma. LPS is typically not a molecularly defined substance, and its activity is sometimes reported in ‘endotoxin units’ (EU); this is based on a standard taken from an E. coli O55:B5 strain; an approximate relationship is that 1 ng endotoxin ~10 EU73, 102. The only assay currently available is the Limulus amoebocyte lysate assay; however, its use in the estimation of LPS in blood is not considered especially reliable103–107.
Certainly, some of the fibrin(ogen) changes we see in this paper may be due to glycation of fibrinogen by the raised glucose levels38, 108–112, as well as the increased levels of fibrinogen itself (e.g. refs 35, 112–115). However, because we had recently shown the extreme sensitivity of the form of the fibrin structure to tiny amounts of (free) LPS, including the formation of amyloid48, 68, it was of interest to enquire as to whether diabetic subjects were more likely to produce an amyloid form of clot.
Although we have seen anomalous clotting structures in diabetes before32, 33, 116, this is the first time that we have shown them to be amyloid in character. This is entirely consistent with the fact that at least some of the amyloidogenesis must be catalysed by fibrinogen-bound LPS, given too, as we show here, that it could be removed, and the amyloidogenesis largely reversed, by LBP. Interestingly, fibrin deposition has also previously been noted in term placentas from diabetic mothers117.
As well as for islets16, 18–20, 118–122, amyloid deposition in diabetes is known in kidney123–125, as is the deposition of serum amyloid A126, 127 (which may have prognostic value128). We also note the various comorbidities between T2D and CVD129–132; one interpretation is a common cause. In our T2D sample, most of the individuals suffer from hypertension and increased cholesterol and take anticoagulant medication. These co-morbidities are also common in CVD, and T2D is well known as a major cardiovascular risk factor133. Both T2D and CVD are known to have vascular pathology134, and this is directly associated with coagulation pathology116. We also looked to see it there are any relationships been our newly determined blood parameters and e.g. fasting glucose, but we could not discern any.
Endotoxin levels in T2D have previously been found to be, in part, the cause for hypercoagulation and that T2D patients treated with e.g. the anti-glycemic agent, rosiglitazone showed significantly lower endotoxin levels81. Our sample did not use this medication. Besides medication for glucose control, our T2D group also includes individuals on medication for dyslipidaemia and hypertension, while some are taking anticoagulants (see Table 1). Anticoagulants (e.g. aspirin/disprin) increase fibrin clot porosity and susceptibility to lysis135, 136 (i.e. the exact opposite effect from that noted here with LPS/LBP; Pretorius et al. 2013, 2015); they also have an antiplatelet effect136–139 and are known to reduce the risk of thrombosis140–144. Such products are also inhibitors of both cyclooxygenase COX-1 and COX-2145. We could not find evidence in the literature that LBP acts as an anti-coagulant.
Concluding remarks
T2D is accompanied by long-term inflammation, and this inflammation is mediated in part by increased fibrinogen levels, as well as a changed cytokine profile that is driven, at least in part, by dysregulated glucose and insulin function. The origin of this inflammation is mostly unclear and remains unresolved in diabetes. It is known that gut dysbioses and atopobioses71 (colloquially referred to as ‘leaky gut’) are a well-known contributor to the pathogenesis of many metabolic diseases, including obesity146, T1D147, 148, T2D146, 149, 150, and CVD151. We have previously suggested that there is a fundamental link between gut dysbioses, the presence of a (dormant) blood microbiome and the presence of the highly inflammatory LPS71–73. As discussed in the introduction and shown recently, LPS is known to cause hypercoagulability and anomalous blood clotting, even at very low concentrations48, 68. We have also shown that LPS may directly bind to fibrinogen monomers68. Anomalous clotting is well-known in T2D31, 33–39, and here we show that LBP added to PPP from individuals with T2D changes fibrin structure to resemble that of healthy fibrin. We confirmed our results with healthy PPP, adding LPS and mopping it up again with added LBP. It is known that LBP is an acutely induced plasma protein that binds avidly to LPS aggregates, and delivers them to CD1473, 152, 153. Our results therefore suggest that, at least in part, the anomalous blood clotting seen in T2D is due to the presence of the potent inflammagen LPS, that can be removed by LBP. A future study could additionally investigate the effect of glucose addition to healthy PPP, with and without the addition of LPS. This will give insights regarding amyloidogenesis and the effects of glucose on such a process. It now seems no coincidence that most of the more serious sequelae of diabetes are accompanied by amyloid formation (e.g. retinopathy154–156, nephropathy123, 157–160, neuropathy161, and cardiovascular problems162, 163). It is well-known that all of these macro- and microvascular complications that form part of the T2D comorbidities cause hypercoagulation and are associated with an upregulated inflammatory profile. A follow-up study should investigate the specific influences of comorbidities like a history of macrovascular (cardiovascular diseases such as coronary artery disease, ischemic stroke, and peripheral artery disease), and microvascular (retinopathy, nephropathy, and neuropathy). This will give further insight with regards to the exact role that these comorbidities play in hypercoagulation.
Thus, the recognition from the present work that amyloid formation is a strong function of the presence of cryptic LPS in type 2 diabetes might have important applications in both the treatment of inflammation in T2D, and the progression of the condition generally. The fundamental question that now remains is how to translate these results into clinical practice.
Acknowledgements
We thank the Biotechnology and Biological Sciences Research Council (grant BB/L025752/1) as well as the National Research Foundation (NRF) and the Medical Research Council of South Africa (MRC) for supporting this collaboration. The authors thank Dr Prashilla Soma: Diabetes Clinician. Biotechnology and Biological Sciences Research Council (grant BB/L025752/1). National Research Foundation (NRF) of South Africa (91548: Competitive Program) and Medical Research Council (MRC) of South Africa (Self-Initiated Research Program: A0X331). Grant holder: E Pretorius.
Author Contributions
E.P. is the study leader, analysed all samples, prepared all figures, co-wrote paper; S.M.: technical assistance with SEM preparation; D.B.K. is the study co-leader, and co-wrote and edited the paper. All authors reviewed the manuscript.
Competing Interests
The authors declare that they have no competing interests.
Footnotes
Publisher's note: Springer Nature remains neutral with regard to jurisdictional claims in published maps and institutional affiliations.
Contributor Information
Etheresia Pretorius, Email: resiap@sun.ac.za.
Douglas B. Kell, Email: dbk@manchester.ac.uk
References
- 1.Chiti F, Dobson CM. Protein misfolding, functional amyloid, and human disease. Annu Rev Biochem. 2006;75:333–366. doi: 10.1146/annurev.biochem.75.101304.123901. [DOI] [PubMed] [Google Scholar]
- 2.Herczenik E, Gebbink MFBG. Molecular and cellular aspects of protein misfolding and disease. FASEB J. 2008;22:2115–2133. doi: 10.1096/fj.07-099671. [DOI] [PubMed] [Google Scholar]
- 3.Rambaran RN, Serpell LC. Amyloid fibrils: abnormal protein assembly. Prion. 2008;2:112–117. doi: 10.4161/pri.2.3.7488. [DOI] [PMC free article] [PubMed] [Google Scholar]
- 4.Eisenberg D, Jucker M. The amyloid state of proteins in human diseases. Cell. 2012;148:1188–1203. doi: 10.1016/j.cell.2012.02.022. [DOI] [PMC free article] [PubMed] [Google Scholar]
- 5.Knowles TPJ, Vendruscolo M, Dobson CM. The amyloid state and its association with protein misfolding diseases. Nat Rev Mol Cell Biol. 2014;15:384–396. doi: 10.1038/nrm3810. [DOI] [PubMed] [Google Scholar]
- 6.Tipping KW, van Oosten-Hawle P, Hewitt EW, Radford SE. Amyloid Fibres: Inert End-Stage Aggregates or Key Players in Disease? Trends Biochem Sci. 2015;40:719–727. doi: 10.1016/j.tibs.2015.10.002. [DOI] [PMC free article] [PubMed] [Google Scholar]
- 7.Sipe JD, et al. Nomenclature 2014: Amyloid fibril proteins and clinical classification of the amyloidosis. Amyloid. 2014;21:221–224. doi: 10.3109/13506129.2014.964858. [DOI] [PubMed] [Google Scholar]
- 8.Olanow CW, Brundin P. Parkinson's disease and alpha synuclein: is Parkinson's disease a prion-like disorder? Mov Disord. 2013;28:31–40. doi: 10.1002/mds.25373. [DOI] [PubMed] [Google Scholar]
- 9.Uversky VN, Li J, Fink AL. Metal-triggered structural transformations, aggregation, and fibrillation of human alpha-synuclein. A possible molecular link between Parkinson's disease and heavy metal exposure. J Biol Chem. 2001;276:44284–44296. doi: 10.1074/jbc.M105343200. [DOI] [PubMed] [Google Scholar]
- 10.Vilar M, et al. The fold of alpha-synuclein fibrils. Proc Natl Acad Sci U S A. 2008;105:8637–8642. doi: 10.1073/pnas.0712179105. [DOI] [PMC free article] [PubMed] [Google Scholar]
- 11.Fändrich M, Meinhardt J, Grigorieff N. Structural polymorphism of Alzheimer Abeta and other amyloid fibrils. Prion. 2009;3:89–93. doi: 10.4161/pri.3.2.8859. [DOI] [PMC free article] [PubMed] [Google Scholar]
- 12.Petkova AT, et al. Self-propagating, molecular-level polymorphism in Alzheimer's beta-amyloid fibrils. Science. 2005;307:262–265. doi: 10.1126/science.1105850. [DOI] [PubMed] [Google Scholar]
- 13.Serpell LC. Alzheimer's amyloid fibrils: structure and assembly. Biochim Biophys Acta. 2000;1502:16–30. doi: 10.1016/S0925-4439(00)00029-6. [DOI] [PubMed] [Google Scholar]
- 14.Fuchsberger C, et al. The genetic architecture of type 2 diabetes. Nature. 2016;536:41–47. doi: 10.1038/nature18642. [DOI] [PMC free article] [PubMed] [Google Scholar]
- 15.Cooper GJS, et al. Purification and characterization of a peptide from amyloid-rich pancreases of type 2 diabetic patients. Proc Natl Acad Sci USA. 1987;84:8628–8632. doi: 10.1073/pnas.84.23.8628. [DOI] [PMC free article] [PubMed] [Google Scholar]
- 16.Cooper GJS, et al. Amylin Found in Amyloid Deposits in Human Type-2 Diabetes-Mellitus May Be a Hormone That Regulates Glycogen-Metabolism in Skeletal-Muscle. Proc Natl Acad Sci. 1988;85:7763–7766. doi: 10.1073/pnas.85.20.7763. [DOI] [PMC free article] [PubMed] [Google Scholar]
- 17.Lorenzo A, Razzaboni B, Weir GC, Yankner BA. Pancreatic islet cell toxicity of amylin associated with type-2 diabetes mellitus. Nature. 1994;368:756–760. doi: 10.1038/368756a0. [DOI] [PubMed] [Google Scholar]
- 18.Jaikaran ETAS, Clark A. Islet amyloid and type 2 diabetes: from molecular misfolding to islet pathophysiology. Biochim Biophys Acta. 2001;1537:179–203. doi: 10.1016/S0925-4439(01)00078-3. [DOI] [PubMed] [Google Scholar]
- 19.Loomes KM. Survival of an islet beta-cell in type-2 diabetes: curbing the effects of amyloid cytotoxicity. Islets. 2011;3:38–39. doi: 10.4161/isl.3.1.14258. [DOI] [PubMed] [Google Scholar]
- 20.Höppener JWM, Lips CJM. Role of islet amyloid in type 2 diabetes mellitus. Int J Biochem Cell Biol. 2006;38:726–736. doi: 10.1016/j.biocel.2005.12.009. [DOI] [PubMed] [Google Scholar]
- 21.Pillay K, Govender P. Amylin uncovered: a review on the polypeptide responsible for type II diabetes. Biomed Res Int. 2013;2013 doi: 10.1155/2013/826706. [DOI] [PMC free article] [PubMed] [Google Scholar]
- 22.Zhang S, et al. The pathogenic mechanism of diabetes varies with the degree of overexpression and oligomerization of human amylin in the pancreatic islet beta cells. FASEB J. 2014;28:5083–5096. doi: 10.1096/fj.14-251744. [DOI] [PubMed] [Google Scholar]
- 23.Gurlo T, et al. beta Cell-specific increased expression of calpastatin prevents diabetes induced by islet amyloid polypeptide toxicity. JCI Insight. 2016;1 doi: 10.1172/jci.insight.89590. [DOI] [PMC free article] [PubMed] [Google Scholar]
- 24.Janson J, Ashley RH, Harrison D, McIntyre S, Butler PC. The mechanism of islet amyloid polypeptide toxicity is membrane disruption by intermediate-sized toxic amyloid particles. Diabetes. 1999;48:491–498. doi: 10.2337/diabetes.48.3.491. [DOI] [PubMed] [Google Scholar]
- 25.Daval M, et al. The effect of curcumin on human islet amyloid polypeptide misfolding and toxicity. Amyloid. 2010;17:118–128. doi: 10.3109/13506129.2010.530008. [DOI] [PMC free article] [PubMed] [Google Scholar]
- 26.Campbell RA, Aleman M, Gray LD, Falvo MR, Wolberg AS. Flow profoundly influences fibrin network structure: implications for fibrin formation and clot stability in haemostasis. Thromb Haemost. 2010;104:1281–1284. doi: 10.1160/TH10-07-0442. [DOI] [PMC free article] [PubMed] [Google Scholar]
- 27.Pretorius E, Steyn H, Engelbrecht M, Swanepoel AC, Oberholzer HM. Differences in fibrin fiber diameters in healthy individuals and thromboembolic ischemic stroke patients. Blood Coagul Fibrinolysis. 2011;22:696–700. doi: 10.1097/MBC.0b013e32834bdb32. [DOI] [PubMed] [Google Scholar]
- 28.Weigandt KM, et al. Fibrin clot structure and mechanics associated with specific oxidation of methionine residues in fibrinogen. Biophys J. 2012;103:2399–2407. doi: 10.1016/j.bpj.2012.10.036. [DOI] [PMC free article] [PubMed] [Google Scholar]
- 29.Bester J, Soma P, Kell DB, Pretorius E. Viscoelastic and ultrastructural characteristics of whole blood and plasma in Alzheimer-type dementia, and the possible role of bacterial lipopolysaccharides (LPS) Oncotarget Gerontology. 2015;6:35284–35303. doi: 10.18632/oncotarget.6074. [DOI] [PMC free article] [PubMed] [Google Scholar]
- 30.Kell DB, Pretorius E. The simultaneous occurrence of both hypercoagulability and hypofibrinolysis in blood and serum during systemic inflammation, and the roles of iron and fibrin(ogen) Integr Biol. 2015;7:24–52. doi: 10.1039/C4IB00173G. [DOI] [PubMed] [Google Scholar]
- 31.Alzahrani SH, Ajjan RA. Coagulation and fibrinolysis in diabetes. Diabet Vasc Dis Res. 2010;7:260–273. doi: 10.1177/1479164110383723. [DOI] [PubMed] [Google Scholar]
- 32.Pretorius E, Oberholzer HM, van der Spuy WJ, Swanepoel AC, Soma P. Qualitative scanning electron microscopy analysis of fibrin networks and platelet abnormalities in diabetes. Blood Coagul Fibrinol. 2011;22:463–467. doi: 10.1097/MBC.0b013e3283468a0d. [DOI] [PubMed] [Google Scholar]
- 33.Pretorius E, et al. Poorly controlled type 2 diabetes is accompanied by significant morphological and ultrastructural changes in both erythrocytes and in thrombin-generated fibrin: implications for diagnostics. Cardiovasc Diabetol. 2015;13 doi: 10.1186/s12933-015-0192-5. [DOI] [PMC free article] [PubMed] [Google Scholar]
- 34.Jörneskog G, et al. Altered properties of the fibrin gel structure in patients with IDDM. Diabetologia. 1996;39:1519–1523. doi: 10.1007/s001250050607. [DOI] [PubMed] [Google Scholar]
- 35.Dunn EJ, Ariëns RAS. Fibrinogen and fibrin clot structure in diabetes. Herz. 2004;29:470–479. doi: 10.1007/s00059-004-2607-z. [DOI] [PubMed] [Google Scholar]
- 36.Dunn EJ, Ariëns RAS, Grant PJ. The influence of type 2 diabetes on fibrin structure and function. Diabetologia. 2005;48:1198–1206. doi: 10.1007/s00125-005-1742-2. [DOI] [PubMed] [Google Scholar]
- 37.Dunn EJ, Philippou H, Ariëns RAS, Grant PJ. Molecular mechanisms involved in the resistance of fibrin to clot lysis by plasmin in subjects with type 2 diabetes mellitus. Diabetologia. 2006;49:1071–1080. doi: 10.1007/s00125-006-0197-4. [DOI] [PubMed] [Google Scholar]
- 38.Pieters M, et al. The effect of glycaemic control on fibrin network structure of type 2 diabetic subjects. Thromb Haemost. 2006;96:623–629. [PubMed] [Google Scholar]
- 39.Alzahrani SH, et al. Gender-specific alterations in fibrin structure function in type 2 diabetes: associations with cardiometabolic and vascular markers. J Clin Endocrinol Metab. 2012;97:E2282–2287. doi: 10.1210/jc.2012-2128. [DOI] [PubMed] [Google Scholar]
- 40.Weisel JW. Fibrinogen and fibrin. Adv Protein Chem. 2005;70:247–299. doi: 10.1016/S0065-3233(05)70008-5. [DOI] [PubMed] [Google Scholar]
- 41.Wolberg AS. Thrombin generation and fibrin clot structure. Blood Rev. 2007;21:131–142. doi: 10.1016/j.blre.2006.11.001. [DOI] [PubMed] [Google Scholar]
- 42.C L Corte AL, Philippou H, Ariëns RAS. Role of fibrin structure in thrombosis and vascular disease. Adv Protein Chem Struct Biol. 2011;83:75–127. doi: 10.1016/B978-0-12-381262-9.00003-3. [DOI] [PubMed] [Google Scholar]
- 43.Undas A, Ariëns RAS. Fibrin clot structure and function: a role in the pathophysiology of arterial and venous thromboembolic diseases. Arterioscler Thromb Vasc Biol. 2011;31:e88–99. doi: 10.1161/ATVBAHA.111.230631. [DOI] [PubMed] [Google Scholar]
- 44.Wolberg AS. Determinants of fibrin formation, structure, and function. Curr Opin Hematol. 2012;19:349–356. doi: 10.1097/MOH.0b013e32835673c2. [DOI] [PubMed] [Google Scholar]
- 45.Averett LE, et al. Complexity of "A-a" knob-hole fibrin interaction revealed by atomic force spectroscopy. Langmuir. 2008;24:4979–4988. doi: 10.1021/la703264x. [DOI] [PubMed] [Google Scholar]
- 46.Yermolenko IS, Lishko VK, Ugarova TP, Magonov SN. High-resolution visualization of fibrinogen molecules and fibrin fibers with atomic force microscopy. Biomacromolecules. 2011;12:370–379. doi: 10.1021/bm101122g. [DOI] [PubMed] [Google Scholar]
- 47.Protopopova AD, et al. Visualization of fibrinogen alphaC regions and their arrangement during fibrin network formation by high-resolution AFM. J Thromb Haemost. 2015;13:570–579. doi: 10.1111/jth.12785. [DOI] [PubMed] [Google Scholar]
- 48.Kell DB, Pretorius E. Proteins behaving badly. Substoichiometric molecular control and amplification of the initiation and nature of amyloid fibril formation: lessons from and for blood clotting. Progr Biophys Mol Biol. 2017;123:16–41. doi: 10.1016/j.pbiomolbio.2016.08.006. [DOI] [PubMed] [Google Scholar]
- 49.Dickneite G, et al. Coagulation factor XIII: a multifunctional transglutaminase with clinical potential in a range of conditions. Thromb Haemost. 2015;113:686–697. doi: 10.1160/TH14-07-0625. [DOI] [PubMed] [Google Scholar]
- 50.Maji SK, Wang L, Greenwald J, Riek R. Structure-activity relationship of amyloid fibrils. FEBS Lett. 2009;583:2610–2617. doi: 10.1016/j.febslet.2009.07.003. [DOI] [PubMed] [Google Scholar]
- 51.Morris KL, Serpell LC. X-ray fibre diffraction studies of amyloid fibrils. Methods Mol Biol. 2012;849:121–135. doi: 10.1007/978-1-61779-551-0_9. [DOI] [PubMed] [Google Scholar]
- 52.Tycko R, Wickner RB. Molecular structures of amyloid and prion fibrils: consensus versus controversy. Acc Chem Res. 2013;46:1487–1496. doi: 10.1021/ar300282r. [DOI] [PMC free article] [PubMed] [Google Scholar]
- 53.Langkilde AE, Morris KL, Serpell LC, Svergun DI, Vestergaard B. The architecture of amyloid-like peptide fibrils revealed by X-ray scattering, diffraction and electron microscopy. Acta Crystallogr D Biol Crystallogr. 2015;71:882–895. doi: 10.1107/S1399004715001674. [DOI] [PMC free article] [PubMed] [Google Scholar]
- 54.LeVine H., 3rd Quantification of beta-sheet amyloid fibril structures with thioflavin T. Methods Enzymol. 1999;309:274–284. doi: 10.1016/S0076-6879(99)09020-5. [DOI] [PubMed] [Google Scholar]
- 55.Biancalana M, Makabe K, Koide A, Koide S. Molecular mechanism of thioflavin-T binding to the surface of beta-rich peptide self-assemblies. J Mol Biol. 2009;385:1052–1063. doi: 10.1016/j.jmb.2008.11.006. [DOI] [PMC free article] [PubMed] [Google Scholar]
- 56.Biancalana M, Koide S. Molecular mechanism of Thioflavin-T binding to amyloid fibrils. Biochim Biophys Acta. 2010;1804:1405–1412. doi: 10.1016/j.bbapap.2010.04.001. [DOI] [PMC free article] [PubMed] [Google Scholar]
- 57.Groenning M. Binding mode of Thioflavin T and other molecular probes in the context of amyloid fibrils-current status. J Chem Biol. 2010;3:1–18. doi: 10.1007/s12154-009-0027-5. [DOI] [PMC free article] [PubMed] [Google Scholar]
- 58.Sulatskaya AI, Kuznetsova IM, Turoverov KK. Interaction of thioflavin T with amyloid fibrils: stoichiometry and affinity of dye binding, absorption spectra of bound dye. J Phys Chem B. 2011;115:11519–11524. doi: 10.1021/jp207118x. [DOI] [PubMed] [Google Scholar]
- 59.Freire S, de Araujo MH, Al-Soufi W, Novo M. Photophysical study of Thioflavin T as fluorescence marker of amyloid fibrils. Dyes and Pigments. 2014;110:97–105. doi: 10.1016/j.dyepig.2014.05.004. [DOI] [Google Scholar]
- 60.Serpell LC, Benson M, Liepnieks JJ, Fraser PE. Structural analyses of fibrinogen amyloid fibrils. Amyloid. 2007;14:199–203. doi: 10.1080/13506120701461111. [DOI] [PubMed] [Google Scholar]
- 61.Picken MM. Fibrinogen amyloidosis: the clot thickens! Blood. 2010;115:2985–2986. doi: 10.1182/blood-2009-12-236810. [DOI] [PubMed] [Google Scholar]
- 62.Stangou AJ, et al. Hereditary fibrinogen A alpha-chain amyloidosis: phenotypic characterization of a systemic disease and the role of liver transplantation. Blood. 2010;115:2998–3007. doi: 10.1182/blood-2009-06-223792. [DOI] [PubMed] [Google Scholar]
- 63.Haidinger M, et al. Hereditary amyloidosis caused by R554L fibrinogen Aalpha-chain mutation in a Spanish family and review of the literature. Amyloid. 2013;20:72–79. doi: 10.3109/13506129.2013.781998. [DOI] [PubMed] [Google Scholar]
- 64.Kell DB, Pretorius E. Serum ferritin is an important disease marker, and is mainly a leakage product from damaged cells. Metallomics. 2014;6:748–773. doi: 10.1039/C3MT00347G. [DOI] [PubMed] [Google Scholar]
- 65.Pretorius E, Vermeulen N, Bester J, Lipinski B, Kell DB. A novel method for assessing the role of iron and its functional chelation in fibrin fibril formation: the use of scanning electron microscopy. Toxicol Mech Methods. 2013;23:352–359. doi: 10.3109/15376516.2012.762082. [DOI] [PubMed] [Google Scholar]
- 66.Pretorius E, et al. Profound morphological changes in the erythrocytes and fibrin networks of patients with hemochromatosis or with hyperferritinemia, and their normalization by iron chelators and other agents. PLoS One. 2014;9 doi: 10.1371/journal.pone.0085271. [DOI] [PMC free article] [PubMed] [Google Scholar]
- 67.Pretorius E, Kell DB. Diagnostic morphology: biophysical indicators for iron-driven inflammatory diseases. Integrative Biol. 2014;6:486–510. doi: 10.1039/C4IB00025K. [DOI] [PubMed] [Google Scholar]
- 68.Pretorius E, Mbotwe S, Bester J, Robinson CJ, Kell DB. Acute induction of anomalous and amyloidogenic blood clotting by molecular amplification of highly substoichiometric levels of bacterial lipopolysaccharide. J R Soc Interface. 2016;123 doi: 10.1098/rsif.2016.0539. [DOI] [PMC free article] [PubMed] [Google Scholar]
- 69.Pretorius, E., Mbotwe, S., Bester, J., Robinson, C. & Kell, D. B. Acute induction of anomalous blood clotting by highly substoichiometric levels of bacterial lipopolysaccharide (LPS). bioRxiv, 2016-053538v053531, doi:10.1101/053538 (2016). [DOI] [PMC free article] [PubMed]
- 70.Kell, D. B. & Pretorius, E. Substoichiometric molecular control and amplification of the initiation and nature of amyloid fibril formation: lessons from and for blood clotting. bioRxiv preprint. bioRxiv, 054734, doi:10.1101/054734 (2016). [DOI] [PubMed]
- 71.Potgieter M, Bester J, Kell DB, Pretorius E. The dormant blood microbiome in chronic, inflammatory diseases. FEMS Microbiol Rev. 2015;39:567–591. doi: 10.1093/femsre/fuv013. [DOI] [PMC free article] [PubMed] [Google Scholar]
- 72.Kell DB, Potgieter M, Pretorius E. Individuality, phenotypic differentiation, dormancy and ‘persistence’ in culturable bacterial systems: commonalities shared by environmental, laboratory, and clinical microbiology. F1000Research. 2015;4 doi: 10.12688/f1000research.6709.1. [DOI] [PMC free article] [PubMed] [Google Scholar]
- 73.Kell DB, Pretorius E. On the translocation of bacteria and their lipopolysaccharides between blood and peripheral locations in chronic, inflammatory diseases: the central roles of LPS and LPS-induced cell death. Integr Biol. 2015;7:1339–1377. doi: 10.1039/C5IB00158G. [DOI] [PubMed] [Google Scholar]
- 74.Itzhaki RF, et al. Microbes and Alzheimer's Disease. J Alzheimers Dis. 2016;51:979–984. doi: 10.3233/JAD-160152. [DOI] [PMC free article] [PubMed] [Google Scholar]
- 75.Kell, D. B. & Kenny, L. C. A dormant microbial component in the development of pre-eclampsia. BioRxiv preprint. bioRxiv, 057356 (2016). [DOI] [PMC free article] [PubMed]
- 76.Kell, D. B. & Pretorius, E. To what extent are the terminal stages of sepsis, septic shock, SIRS, and multiple organ dysfunction syndrome actually driven by a toxic prion/amyloid form of fibrin? bioRxiv preprint. bioRxiv, 057851, doi:10.1101/057851 (2016). [DOI] [PMC free article] [PubMed]
- 77.Pretorius, E., Akeredolu, O.-O., Soma, P. & Kell, D. B. Major involvement of bacterial components in rheumatoid arthritis and its accompanying oxidative stress, systemic inflammation and hypercoagulability. Exp Biol Med, in press (2016). [DOI] [PMC free article] [PubMed]
- 78.Pretorius E, Bester J, Kell DB. A bacterial component to Alzheimer-type dementia seen via a systems biology approach that links iron dysregulation and inflammagen shedding to disease. J Alzheimers Dis. 2016;53:1237–1256. doi: 10.3233/JAD-160318. [DOI] [PMC free article] [PubMed] [Google Scholar]
- 79.Kell DB. Iron behaving badly: inappropriate iron chelation as a major contributor to the aetiology of vascular and other progressive inflammatory and degenerative diseases. BMC Med Genomics. 2008;2 doi: 10.1186/1755-8794-2-2. [DOI] [PMC free article] [PubMed] [Google Scholar]
- 80.Kell DB. Towards a unifying, systems biology understanding of large-scale cellular death and destruction caused by poorly liganded iron: Parkinson’s, Huntington’s, Alzheimer’s, prions, bactericides, chemical toxicology and others as examples. Arch Toxicol. 2010;577:825–889. doi: 10.1007/s00204-010-0577-x. [DOI] [PMC free article] [PubMed] [Google Scholar]
- 81.Al-Attas OS, et al. Changes in endotoxin levels in T2DM subjects on anti-diabetic therapies. Cardiovasc Diabetol. 2009;8 doi: 10.1186/1475-2840-8-20. [DOI] [PMC free article] [PubMed] [Google Scholar]
- 82.Hawkesworth S, et al. Evidence for metabolic endotoxemia in obese and diabetic Gambian women. Nutr Diabetes. 2013;3 doi: 10.1038/nutd.2013.24. [DOI] [PMC free article] [PubMed] [Google Scholar]
- 83.Zaman GS, Zaman F. Relationship between postprandial endotoxemia in nonobese postmenopausal women and diabetic nonobese postmenopausal women. J Nat Sci Biol Med. 2015;6:89–93. doi: 10.4103/0976-9668.149098. [DOI] [PMC free article] [PubMed] [Google Scholar]
- 84.Liang H, Hussey SE, Sanchez-Avila A, Tantiwong P, Musi N. Effect of lipopolysaccharide on inflammation and insulin action in human muscle. PLoS One. 2013;8 doi: 10.1371/journal.pone.0063983. [DOI] [PMC free article] [PubMed] [Google Scholar]
- 85.Lipinski B, Pretorius E, Oberholzer HM, Van Der Spuy WJ. Iron enhances generation of fibrin fibers in human blood: Implications for pathogenesis of stroke. Microsc Res Tech. 2012;75:1185–1190. doi: 10.1002/jemt.22047. [DOI] [PubMed] [Google Scholar]
- 86.Lassenius MI, et al. Bacterial endotoxin activity in human serum is associated with dyslipidemia, insulin resistance, obesity, and chronic inflammation. Diabetes Care. 2011;34:1809–1815. doi: 10.2337/dc10-2197. [DOI] [PMC free article] [PubMed] [Google Scholar]
- 87.Nymark M, et al. Serum lipopolysaccharide activity is associated with the progression of kidney disease in finnish patients with type 1 diabetes. Diabetes Care. 2009;32:1689–1693. doi: 10.2337/dc09-0467. [DOI] [PMC free article] [PubMed] [Google Scholar]
- 88.Carr ME. Diabetes mellitus: a hypercoagulable state. J Diabet Complic. 2001;15:44–54. doi: 10.1016/S1056-8727(00)00132-X. [DOI] [PubMed] [Google Scholar]
- 89.Banga JD. Coagulation and fibrinolysis in diabetes. Semin Vasc Med. 2002;2:75–86. doi: 10.1055/s-2002-23098. [DOI] [PubMed] [Google Scholar]
- 90.Thor M, Yu A, Swedenborg J. Markers of inflammation and hypercoagulability in diabetic and nondiabetic patients with lower extremity ischemia. Thromb Res. 2002;105:379–383. doi: 10.1016/S0049-3848(02)00037-3. [DOI] [PubMed] [Google Scholar]
- 91.Aras R, Sowers JR, Arora R. The proinflammatory and hypercoagulable state of diabetes mellitus. Rev Cardiovasc Med. 2005;6:84–97. [PubMed] [Google Scholar]
- 92.Grant PJ. Diabetes mellitus as a prothrombotic condition. J Intern Med. 2007;262:157–172. doi: 10.1111/j.1365-2796.2007.01824.x. [DOI] [PubMed] [Google Scholar]
- 93.Tripodi A, et al. Hypercoagulability in patients with type 2 diabetes mellitus detected by a thrombin generation assay. J Thromb Thrombolysis. 2011;31:165–172. doi: 10.1007/s11239-010-0506-0. [DOI] [PubMed] [Google Scholar]
- 94.Ye Y, Perez-Polo JR, Aguilar D, Birnbaum Y. The potential effects of anti-diabetic medications on myocardial ischemia-reperfusion injury. Basic Res Cardiol. 2011;106:925–952. doi: 10.1007/s00395-011-0216-6. [DOI] [PubMed] [Google Scholar]
- 95.Beijers HJBH, et al. Impaired glucose metabolism and type 2 diabetes are associated with hypercoagulability: potential role of central adiposity and low-grade inflammation–the Hoorn Study. Thromb Res. 2012;129:557–562. doi: 10.1016/j.thromres.2011.07.033. [DOI] [PubMed] [Google Scholar]
- 96.Cucuianu M, Fekete T, Marcusiu C, Mosler R, Dutu A. Fibrinolysis in diabetes mellitus. Role of overweight and hypertriglyceridemia. Medecine interne. 1984;22:171–177. [PubMed] [Google Scholar]
- 97.Yano Y, et al. Increased plasma thrombin-activatable fibrinolysis inhibitor levels in normotensive type 2 diabetic patients with microalbuminuria. The Journal of clinical endocrinology and metabolism. 2003;88:736–741. doi: 10.1210/jc.2002-020691. [DOI] [PubMed] [Google Scholar]
- 98.Hess K, et al. A novel mechanism for hypofibrinolysis in diabetes: the role of complement C3. Diabetologia. 2012;55:1103–1113. doi: 10.1007/s00125-011-2301-7. [DOI] [PubMed] [Google Scholar]
- 99.Walus-Miarka M, et al. Altered fibrin-clot properties are associated with retinopathy in type 2 diabetes mellitus. Diabetes & Metabolism. 2012;38:462–465. doi: 10.1016/j.diabet.2012.03.007. [DOI] [PubMed] [Google Scholar]
- 100.Bochenek M, Zalewski J, Sadowski J, Undas A. Type 2 diabetes as a modifier of fibrin clot properties in patients with coronary artery disease. J Thromb Thrombolysis. 2013;35:264–270. doi: 10.1007/s11239-012-0821-8. [DOI] [PMC free article] [PubMed] [Google Scholar]
- 101.Konieczynska M, Fil K, Bazanek M, Undas A. Prolonged duration of type 2 diabetes is associated with increased thrombin generation, prothrombotic fibrin clot phenotype and impaired fibrinolysis. Thromb Haemost. 2014;111:685–693. doi: 10.1160/TH13-07-0566. [DOI] [PubMed] [Google Scholar]
- 102.Pearson FC, et al. Comparison of several control standard endotoxins to the National Reference Standard Endotoxin–an HIMA collaborative study. Appl Environ Microbiol. 1985;50:91–93. doi: 10.1128/aem.50.1.91-93.1985. [DOI] [PMC free article] [PubMed] [Google Scholar]
- 103.Andrä J, et al. Biophysical characterization of the interaction of Limulus polyphemus endotoxin neutralizing protein with lipopolysaccharide. Eur J Biochem. 2004;271:2037–2046. doi: 10.1111/j.1432-1033.2004.04134.x. [DOI] [PubMed] [Google Scholar]
- 104.Ketchum PA, Novitsky TJ. Assay of endotoxin by limulus amebocyte lysate. Methods Mol Med. 2000;36:3–12. doi: 10.1385/1-59259-216-3:3. [DOI] [PubMed] [Google Scholar]
- 105.Mattsby-Baltzer I, Lindgren K, Lindholm B, Edebo L. Endotoxin shedding by enterobacteria: free and cell-bound endotoxin differ in Limulus activity. Infect Immun. 1991;59:689–695. doi: 10.1128/iai.59.2.689-695.1991. [DOI] [PMC free article] [PubMed] [Google Scholar]
- 106.Novitsky TJ. Limitations of the Limulus amebocyte lysate test in demonstrating circulating lipopolysaccharides. Ann N Y Acad Sci. 1998;851:416–421. doi: 10.1111/j.1749-6632.1998.tb09018.x. [DOI] [PubMed] [Google Scholar]
- 107.Novitsky, T. J. Biomedical Applications of Limulus Amebocyte Lysate. Biology and Conservation of Horseshoe Crabs, 315–329, doi:10.1007/978-0-387-89959-6_20 (2009).
- 108.Brownlee M, Vlassara H, Cerami A. Nonenzymatic glycosylation reduces the susceptibility of fibrin to degradation by plasmin. Diabetes. 1983;32:680–684. doi: 10.2337/diab.32.7.680. [DOI] [PubMed] [Google Scholar]
- 109.Pieters M, et al. Glycaemic control improves fibrin network characteristics in type 2 diabetes - a purified fibrinogen model. Thromb Haemost. 2008;99:691–700. doi: 10.1160/TH07-11-0699. [DOI] [PMC free article] [PubMed] [Google Scholar]
- 110.Howard SC, Algra A, Rothwell PM. Effect of age and glycaemic control on the association between fibrinogen and risk of acute coronary events after transient ischaemic attack or stroke. Cerebrovasc Dis. 2008;25:136–143. doi: 10.1159/000112324. [DOI] [PubMed] [Google Scholar]
- 111.Svensson J, et al. Acetylation and glycation of fibrinogen in vitro occur at specific lysine residues in a concentration dependent manner: a mass spectrometric and isotope labeling study. Biochem Biophys Res Commun. 2012;421:335–342. doi: 10.1016/j.bbrc.2012.03.154. [DOI] [PubMed] [Google Scholar]
- 112.Fan, N. K., Keegan, P. M., Platt, M. O. & Averett, R. D. Experimental and imaging techniques for examining fibrin clot structures in normal and diseased states. J Vis Exp, e52019, doi:10.3791/52019 (2015). [DOI] [PMC free article] [PubMed]
- 113.Bembde AS. A study of plasma fibrinogen level in type-2 diabetes mellitus and its relation to glycemic control. Indian J Hematol Blood Transfus. 2012;28:105–108. doi: 10.1007/s12288-011-0116-9. [DOI] [PMC free article] [PubMed] [Google Scholar]
- 114.McBane RD, 2nd, Hardison RM, Sobel BE. Comparison of plasminogen activator inhibitor-1, tissue type plasminogen activator antigen, fibrinogen, and D-dimer levels in various age decades in patients with type 2 diabetes mellitus and stable coronary artery disease (from the BARI 2D trial) Am J Cardiol. 2010;105:17–24. doi: 10.1016/j.amjcard.2009.08.643. [DOI] [PMC free article] [PubMed] [Google Scholar]
- 115.Ariëns RAS. Fibrin(ogen) and thrombotic disease. J Thromb Haemost. 2013;11(Suppl 1):294–305. doi: 10.1111/jth.12229. [DOI] [PubMed] [Google Scholar]
- 116.Soma P, Pretorius E. Interplay between ultrastructural findings and atherothrombotic complications in type 2 diabetes mellitus. Cardiovasc Diabetol. 2015;14 doi: 10.1186/s12933-015-0261-9. [DOI] [PMC free article] [PubMed] [Google Scholar]
- 117.Mayhew TM, Sampson C. Maternal diabetes mellitus is associated with altered deposition of fibrin-type fibrinoid at the villous surface in term placentae. Placenta. 2003;24:524–531. doi: 10.1053/plac.2002.0953. [DOI] [PubMed] [Google Scholar]
- 118.Cooper GJS, et al. Amylin and the amylin gene: structure, function and relationship to islet amyloid and to diabetes mellitus. Biochim Biophys Acta. 1989;1014:247–258. doi: 10.1016/0167-4889(89)90220-6. [DOI] [PubMed] [Google Scholar]
- 119.Marzban L, Park K, Verchere CB. Islet amyloid polypeptide and type 2 diabetes. Exp Gerontol. 2003;38:347–351. doi: 10.1016/S0531-5565(03)00004-4. [DOI] [PubMed] [Google Scholar]
- 120.Miklossy J, et al. Beta amyloid and hyperphosphorylated tau deposits in the pancreas in type 2 diabetes. Neurobiol Aging. 2010;31:1503–1515. doi: 10.1016/j.neurobiolaging.2008.08.019. [DOI] [PMC free article] [PubMed] [Google Scholar]
- 121.Westermark P, Andersson A, Westermark GT. Islet amyloid polypeptide, islet amyloid, and diabetes mellitus. Physiol Rev. 2011;91:795–826. doi: 10.1152/physrev.00042.2009. [DOI] [PubMed] [Google Scholar]
- 122.Westermark GT, Westermark P. Islet amyloid polypeptide and diabetes. Curr Protein Pept Sci. 2013;14:330–337. doi: 10.2174/13892037113149990050. [DOI] [PubMed] [Google Scholar]
- 123.Díez R, Madero M, Gamba G, Soriano J, Soto V. Renal AA Amyloidosis in Patients with Type 2 Diabetes Mellitus. Nephron Extra. 2014;4:119–126. doi: 10.1159/000363625. [DOI] [PMC free article] [PubMed] [Google Scholar]
- 124.Anderberg RJ, et al. Serum amyloid A and inflammation in diabetic kidney disease and podocytes. Lab Invest. 2015;95:250–262. doi: 10.1038/labinvest.2014.163. [DOI] [PMC free article] [PubMed] [Google Scholar]
- 125.Dieter, B. P. et al. Serum amyloid a and risk of death and end-stage renal disease in diabetic kidney disease. J Diabetes Complications, doi:10.1016/j.jdiacomp.2016.07.018 (2016). [DOI] [PMC free article] [PubMed]
- 126.Kumon Y, Suehiro T, Itahara T, Ikeda Y, Hashimoto K. Serum amyloid A protein in patients with non-insulin-dependent diabetes mellitus. Clin Biochem. 1994;27:469–473. doi: 10.1016/0009-9120(94)00044-V. [DOI] [PubMed] [Google Scholar]
- 127.Eren MA, et al. Association of serum amyloid A with subclinical atherosclerosis in women with gestational diabetes. Gynecol Endocrinol. 2012;28:1010–1013. doi: 10.3109/09513590.2012.705371. [DOI] [PubMed] [Google Scholar]
- 128.Marzi C, et al. Acute-phase serum amyloid A protein and its implication in the development of type 2 diabetes in the KORA S4/F4 study. Diabetes Care. 2013;36:1321–1326. doi: 10.2337/dc12-1514. [DOI] [PMC free article] [PubMed] [Google Scholar]
- 129.Reusch JE. Diabetes, microvascular complications, and cardiovascular complications: what is it about glucose? J Clin Invest. 2003;112:986–988. doi: 10.1172/JCI200319902. [DOI] [PMC free article] [PubMed] [Google Scholar]
- 130.Targher G, et al. Prevalence of nonalcoholic fatty liver disease and its association with cardiovascular disease among type 2 diabetic patients. Diabetes Care. 2007;30:1212–1218. doi: 10.2337/dc06-2247. [DOI] [PubMed] [Google Scholar]
- 131.Singh GM, et al. The age-specific quantitative effects of metabolic risk factors on cardiovascular diseases and diabetes: a pooled analysis. PloS one. 2013;8 doi: 10.1371/journal.pone.0065174. [DOI] [PMC free article] [PubMed] [Google Scholar]
- 132.Basuli D, Stevens RG, Torti FM, Torti SV. Epidemiological associations between iron and cardiovascular disease and diabetes. Front Pharmacol. 2014;5 doi: 10.3389/fphar.2014.00117. [DOI] [PMC free article] [PubMed] [Google Scholar]
- 133.Bertoni AG, Kramer H, Watson K, Post WS. Diabetes and Clinical and Subclinical CVD. Glob Heart. 2016;11:337–342. doi: 10.1016/j.gheart.2016.07.005. [DOI] [PMC free article] [PubMed] [Google Scholar]
- 134.Di Pino A, Urbano F, Piro S, Purrello F, Rabuazzo AM. Update on pre-diabetes: Focus on diagnostic criteria and cardiovascular risk. World J Diabetes. 2016;7:423–432. doi: 10.4239/wjd.v7.i18.423. [DOI] [PMC free article] [PubMed] [Google Scholar]
- 135.Undas A, Celinska-Lowenhoff M, Lowenhoff T, Szczeklik A. Statins, fenofibrate, and quinapril increase clot permeability and enhance fibrinolysis in patients with coronary artery disease. J Thromb Haemost. 2006;4:1029–1036. doi: 10.1111/j.1538-7836.2006.01882.x. [DOI] [PubMed] [Google Scholar]
- 136.Undas A, Brummel-Ziedins KE, Mann KG. Antithrombotic properties of aspirin and resistance to aspirin: beyond strictly antiplatelet actions. Blood. 2007;109:2285–2292. doi: 10.1182/blood-2006-01-010645. [DOI] [PMC free article] [PubMed] [Google Scholar]
- 137.Knapp M, Lisowska A, Knapp P, Baranowski M. Dose-dependent effect of aspirin on the level of sphingolipids in human blood. Adv Med Sci. 2013;58:274–281. doi: 10.2478/ams-2013-0021. [DOI] [PubMed] [Google Scholar]
- 138.Manolis AS, Manolis TA, Papadimitriou P, Koulouris S, Melita H. Combined antiplatelet therapy: still a sweeping combination in cardiology. Cardiovasc Hematol Agents Med Chem. 2013;11:136–167. doi: 10.2174/1871525711311020009. [DOI] [PubMed] [Google Scholar]
- 139.Mehta SR. Aspirin for prevention and treatment of cardiovascular disease. Ann Intern Med. 2009;150:414–416. doi: 10.7326/0003-4819-150-6-200903170-00011. [DOI] [PubMed] [Google Scholar]
- 140.Angiolillo DJ, Ferreiro JL. Antiplatelet and anticoagulant therapy for atherothrombotic disease: the role of current and emerging agents. Am J Cardiovasc Drugs. 2013;13:233–250. doi: 10.1007/s40256-013-0022-7. [DOI] [PubMed] [Google Scholar]
- 141.Elblbesy MA, Hereba AR, Shawki MM. Effects of aspirin on rheological properties of erythrocytes in vitro. Int J Biomed Sci. 2012;8:188–193. [PMC free article] [PubMed] [Google Scholar]
- 142.Gasparyan AY, Ayvazyan L, Pretorius E, Kitas GD. Platelets in rheumatic diseases: friend or foe? Curr Pharm Des. 2014;20:552–566. doi: 10.2174/138161282004140213143843. [DOI] [PubMed] [Google Scholar]
- 143.Santos MT, et al. Residual platelet thromboxane A2 and prothrombotic effects of erythrocytes are important determinants of aspirin resistance in patients with vascular disease. J Thromb Haemost. 2008;6:615–621. doi: 10.1111/j.1538-7836.2008.02915.x. [DOI] [PubMed] [Google Scholar]
- 144.Sostres C, Gargallo CJ, Lanas A. Aspirin, cyclooxygenase inhibition and colorectal cancer. World J Gastrointest Pharmacol Ther. 2014;5:40–49. doi: 10.4292/wjgpt.v5.i1.40. [DOI] [PMC free article] [PubMed] [Google Scholar]
- 145.Berk M, et al. Aspirin: a review of its neurobiological properties and therapeutic potential for mental illness. BMC Med. 2013;11 doi: 10.1186/1741-7015-11-74. [DOI] [PMC free article] [PubMed] [Google Scholar]
- 146.Slyepchenko, A. et al. Intestinal dysbiosis, gut hyperpermeability and bacterial translocation: missing links between depression, obesity and type 2 diabetes? Curr Pharm Des (2016). [DOI] [PubMed]
- 147.Li X, Atkinson MA. The role for gut permeability in the pathogenesis of type 1 diabetes - a solid or leaky concept? Pediatr Diabetes. 2015;16:485–492. doi: 10.1111/pedi.12305. [DOI] [PMC free article] [PubMed] [Google Scholar]
- 148.Vaarala O, Atkinson MA, Neu J. The "perfect storm" for type 1 diabetes: the complex interplay between intestinal microbiota, gut permeability, and mucosal immunity. Diabetes. 2008;57:2555–2562. doi: 10.2337/db08-0331. [DOI] [PMC free article] [PubMed] [Google Scholar]
- 149.de Kort S, Keszthelyi D, Masclee AA. Leaky gut and diabetes mellitus: what is the link? Obes Rev. 2011;12:449–458. doi: 10.1111/j.1467-789X.2010.00845.x. [DOI] [PubMed] [Google Scholar]
- 150.Delzenne NM, Cani PD, Everard A, Neyrinck AM, Bindels LB. Gut microorganisms as promising targets for the management of type 2 diabetes. Diabetologia. 2015;58:2206–2217. doi: 10.1007/s00125-015-3712-7. [DOI] [PubMed] [Google Scholar]
- 151.Schicho R, Marsche G, Storr M. Cardiovascular complications in inflammatory bowel disease. Curr Drug Targets. 2015;16:181–188. doi: 10.2174/1389450116666150202161500. [DOI] [PMC free article] [PubMed] [Google Scholar]
- 152.Kitchens RL, Thompson PA. Impact of sepsis-induced changes in plasma on LPS interactions with monocytes and plasma lipoproteins: roles of soluble CD14, LBP, and acute phase lipoproteins. J Endotoxin Res. 2003;9:113–118. doi: 10.1177/09680519030090020701. [DOI] [PubMed] [Google Scholar]
- 153.Kopp F, Kupsch S, Schromm AB. Lipopolysaccharide-binding protein is bound and internalized by host cells and colocalizes with LPS in the cytoplasm: Implications for a role of LBP in intracellular LPS-signaling. Biochim Biophys Acta. 2016;1863:660–672. doi: 10.1016/j.bbamcr.2016.01.015. [DOI] [PubMed] [Google Scholar]
- 154.Kam, J. H., Lenassi, E. & Jeffery, G. Viewing Ageing Eyes: Diverse Sites of Amyloid Beta Accumulation in the Ageing Mouse Retina and the Up-Regulation of Macrophages. Plos One5, doi:10.1371/journal.pone.0013127 (2010). [DOI] [PMC free article] [PubMed]
- 155.Ma Y, Tao Y, Lu Q, Jiang YR. Intraocular expression of serum amyloid a and interleukin-6 in proliferative diabetic retinopathy. Am J Ophthalmol. 2011;152:678–685 e672. doi: 10.1016/j.ajo.2011.03.007. [DOI] [PubMed] [Google Scholar]
- 156.Yoneda S, et al. Vitreous fluid levels of beta-amyloid((1-42)) and tau in patients with retinal diseases. Jpn J Ophthalmol. 2005;49:106–108. doi: 10.1007/s10384-004-0156-x. [DOI] [PubMed] [Google Scholar]
- 157.Gong W, et al. Amylin deposition in the kidney of patients with diabetic nephropathy. Kidney Int. 2007;72:213–218. doi: 10.1038/sj.ki.5002305. [DOI] [PubMed] [Google Scholar]
- 158.Stettler C, et al. Serum amyloid A, C-reactive protein, and retinal microvascular changes in hypertensive diabetic and nondiabetic individuals: an Anglo-Scandinavian Cardiac Outcomes Trial (ASCOT) substudy. Diabetes Care. 2009;32:1098–1100. doi: 10.2337/dc08-2137. [DOI] [PMC free article] [PubMed] [Google Scholar]
- 159.Khalighi MA, Dean Wallace W, Palma-Diaz MF. Amyloid nephropathy. Clin Kidney J. 2014;7:97–106. doi: 10.1093/ckj/sfu021. [DOI] [PMC free article] [PubMed] [Google Scholar]
- 160.Huang F, et al. Valsartan inhibits amylin-induced podocyte damage. Microvasc Res. 2016;106:101–109. doi: 10.1016/j.mvr.2016.04.007. [DOI] [PubMed] [Google Scholar]
- 161.Shin SC, Robinson-Papp J. Amyloid Neuropathies. Mount Sinai Journal of Medicine. 2012;79:733–748. doi: 10.1002/msj.21352. [DOI] [PMC free article] [PubMed] [Google Scholar]
- 162.Guan J, Mishra S, Falk RH, Liao R. Current perspectives on cardiac amyloidosis. Am J Physiol Heart Circ Physiol. 2012;302:H544–552. doi: 10.1152/ajpheart.00815.2011. [DOI] [PMC free article] [PubMed] [Google Scholar]
- 163.Perfetto F, et al. Cardiac amyloidosis: the heart of the matter. Intern Emerg Med. 2013;8:191–203. doi: 10.1007/s11739-011-0647-y. [DOI] [PubMed] [Google Scholar]