

Summary
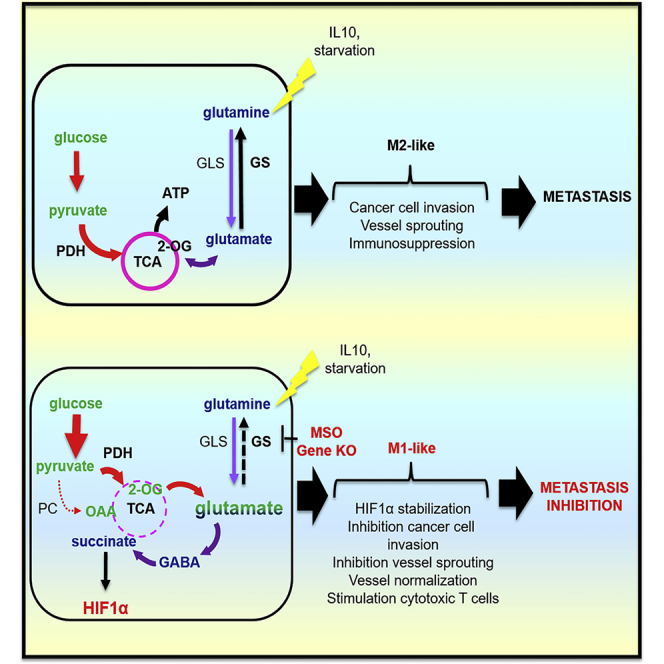
Glutamine-synthetase (GS), the glutamine-synthesizing enzyme from glutamate, controls important events, including the release of inflammatory mediators, mammalian target of rapamycin (mTOR) activation, and autophagy. However, its role in macrophages remains elusive. We report that pharmacologic inhibition of GS skews M2-polarized macrophages toward the M1-like phenotype, characterized by reduced intracellular glutamine and increased succinate with enhanced glucose flux through glycolysis, which could be partly related to HIF1α activation. As a result of these metabolic changes and HIF1α accumulation, GS-inhibited macrophages display an increased capacity to induce T cell recruitment, reduced T cell suppressive potential, and an impaired ability to foster endothelial cell branching or cancer cell motility. Genetic deletion of macrophagic GS in tumor-bearing mice promotes tumor vessel pruning, vascular normalization, accumulation of cytotoxic T cells, and metastasis inhibition. These data identify GS activity as mediator of the proangiogenic, immunosuppressive, and pro-metastatic function of M2-like macrophages and highlight the possibility of targeting this enzyme in the treatment of cancer metastasis.
Keywords: glutamine, glutamine synthetase, macrophages, succinate, HIF1α, metastasis, IL-10, starvation, metabolic rewiring
Graphical Abstract
Highlights
-
•
GS expression and activity are induced by M2 stimuli, especially under starvation
-
•
Inhibition of GS activity skews M2 macrophages toward an M1-like phenotype
-
•
Metabolic rewiring by GS loss favors immunostimulatory and antiangiogenic features
-
•
GS ablation in macrophages blocks vessels, immunosuppression, and metastasis
Palmieri et al. show that inhibiting glutamine synthetase activity in M2 macrophages skews their polarization toward an HIF1α-mediated M1 state, which impairs cytotoxic T cell recruitment and angiogenesis. As a consequence of a more pronounced immunostimulatory and antiangiogenic effect, GS ablation in macrophages translates into prevention of metastasis.
Introduction
Macrophages are able to display different activation states in response to specific stimuli. Quiescent macrophages (M0) can be activated by interferon-γ (IFNγ) and Toll-like receptor (TLR) agonists toward an inflammatory (M1-like) phenotype, thus developing pro-inflammatory microbicidal and tumoricidal properties. However, under interleukin-4 (IL-4), IL-13, and IL-10 (M2-like activation), macrophages suppress inflammatory and adaptive Th1 responses by producing anti-inflammatory factors (IL-10, transforming growth factor β [TGF-β], and IL-1 receptor antagonist [IL-1Rα]), scavenging debris and promoting angiogenesis, tissue remodeling, and repair (Locati et al., 2013, Martinez et al., 2006). Lately, it has become evident that this phenotypic response to their microenvironment is transcriptionally and metabolically regulated (McGettrick and O’Neill, 2013, O’Neill and Hardie, 2013). Specific metabolic features have been associated with M1-like macrophages displaying enhanced glycolysis and reduced oxidative phosphorylation in contrast with more oxidative M2-like macrophages (Biswas and Mantovani, 2010). However, the functional valorization of these different metabolic reactions is far from being completed. Elucidation of these critical pathways might be significant in tumor-associated macrophages (TAMs), which can acquire pro-metastatic and angiogenic properties at the tumor site. Recent studies point to the role of environmental factors in primary tumors and how the targeting of these signals can suppress the immunosuppressive, pro-angiogenic, and pro-metastatic functions of TAMs (Casazza et al., 2013, Colegio et al., 2014, Wenes et al., 2016).
Glutamine synthetase (GS) is a key enzyme involved in nitrogen metabolism, acid-base homeostasis, and cell signaling across multiple species of prokaryotes and eukaryotes (Eisenberg et al., 2000). One of the main roles of GS in vertebrates is to produce glutamine from glutamate and ammonia, which are toxic to the CNS (Butterworth, 2003, Liu et al., 2013, Olney, 1990). Moreover, a continuous supply of glutamine is required for several physiological processes, including synthesis of glutamate and gamma-aminobutyric acid (GABA), synthesis of proteins, and osmoregulation (Norenberg et al., 2007). Expression of GS has been noted in different tumor cells, macrophages, and adipocytes (Chrétien et al., 2002, Hadden et al., 1997, Kocher et al., 2000, Kung et al., 2011). Interestingly the glutamine-producing activity of GS has recently been associated with important signaling mechanisms. GS activity inhibits the mammalian target of rapamycin (mTOR) pathway and induces autophagy in B cells (van der Vos et al., 2012). We have recently found that GS is expressed at later stages of adipocyte differentiation in a glucocorticoid-independent manner and desensitizes mature adipocytes to proinflammatory insults by raising intracellular glutamine levels, demonstrating a mechanism by which GS, through glutamine production, controls adipocyte response to pro-inflammatory stimuli (Palmieri et al., 2014). In murine microglia, GS activity controls the response to lipopolysaccharide (LPS) (Palmieri et al., 2017). GS is also capable of promoting T cells with high Foxp3 expression and regulatory properties in regulatory T cells (Tregs) (Metzler et al., 2016), whereas glutaminolysis induces an inflammatory anti-tumor (Th1) response in effector T cells and represses the formation of Treg cells (Klysz et al., 2015). Finally, glutamine consumption is increased during classical macrophage activation (Curi et al., 2007, Murphy and Newsholme, 1998).
In the present study, we characterize the role of GS in modulating macrophage skewing toward the M2 phenotype. We show that GS expression primes primary human monocytes into M2 macrophages, whereas GS inhibition switches their phenotype toward a more M1-like phenotype through a specific metabolic rewiring involving succinate accumulation. The enhanced production of succinate is a critical regulator of the pro-inflammatory response, both through the inhibition of anti-inflammatory gene expression and via hypoxia inducible factor (HIF)-1α stabilization (Mills et al., 2016). Consistently, GS inhibition in macrophages translates into a strong functional impairment in terms of in vitro T cell recruitment and angiogenesis. Macrophage-specific knockout of GS results in a marked reduction in metastasis formation in mice. These findings establish GS as a main metabolic regulator of inflammation by modulating glutamine levels. Furthermore, selective targeting of GS in macrophages might effectively contrast metastatic processes, increasing the survival of malignant cancer patients.
Results
GS Is Expressed in Alternatively Activated (M2-like) Macrophages
To evaluate the role of GS in the polarization of blood-derived human macrophages, we first tested GS protein expression in primary human resting macrophages (M0/resting), those with a proinflammatory phenotype (M1) induced by LPS/IFNγ, and with the alternatively activated phenotype (M2) elicited with IL-4 and IL-10, alone or in combination, or otherwise with a combination of the anti-inflammatory cytokines IL-4 and IL-13 with an overlapping function (Huang et al., 2015).
We found that GS protein was barely detected in M1 cells and more expressed in M2 cells (Figures 1A and 1B), particularly in IL-10-stimulated cells over all other anti-inflammatory stimuli, as detected through western blotting (Figure 1A). We then evaluated GS gene expression and activity levels during IL-10 stimulation of (M0) monocyte-derived macrophages (IL-10 macrophages in short). Two hours before stimulation with IL-10, cells were primed (or not) with the GS inhibitor methionine sulfoximine (MSO) at a concentration of 1 mM (MSO/IL-10 macrophages in short). Importantly, MSO is not toxic up to 5 mM (Figure S1). GS expression was increased in IL-10 and MSO/IL-10 compared with M0 cells (Figure 1C). Following GS expression, GS activity was also increased in IL-10-stimulated compared with M1 cells (Figure 1D). In line with this finding, intracellular glutamine levels were significantly higher in IL-10-derived M2 compared with M0 macrophages at 24 and 48 hr (Figure 1E). Treatment with the GS inhibitor MSO reduced intracellular glutamine levels at all times (Figure 1E). This indicates that the effect of GS inhibition is linked to the decrease in the intracellular levels of glutamine in IL-10 macrophages.
Figure 1.

IL-10 Macrophages Display GS Expression and Activity
(A and B) GS and β-actin immunoblot (A) and densitometric levels (B) in human CD14−, CD14+ cells (monocytes), resting (M0, macrophage colony stimulating factor [MCSF]), and differently polarized monocytes-derived macrophages (LPS/IFNγ, IL-4, IL-10, IL-13, and a combination of those, with M-CSF) following 24 hr of activation (n = 3).
(C) GS expression levels in resting M0, IL-10, and MSO/IL-10 macrophages following 16 hr of activation with and without 2 hr of pre-incubation with MSO (n = 3).
(D) GS protein activity levels in resting (M0), LPS/IFNγ, and IL-10 macrophages following 24 hr of activation (n = 4).
(E) LC-MS/MS quantification of intracellular glutamine in resting (M0), IL-10, and MSO-treated IL-10 6, 24, and 48 hr after treatment (n = 4).
Data are means ± SEM. Western blots are representative of 3 independent experiments. ∗p < 0.05, ∗∗p < 0.001, ∗∗∗p < 0.0001.
MSO Treatment of M2 Macrophages Promotes Succinate Accumulation and Glucose-Dependent Metabolism
Having established that GS is enriched in IL-10 macrophages, we aimed to characterize metabolism in IL-10-treated macrophages and the consequences of GS inhibition on these metabolic features (O’Neill and Pearce, 2016). Metabolites, together with 13C incorporation levels from [U-13C]-glutamine or [U-13C]-glucose, were measured in LPS/IFNγ, IL-10, and MSO/IL-10 macrophages.
MSO treatment of IL-10 macrophages induces a significant rewiring of macrophage metabolism. As expected, MSO/IL-10 macrophages displayed much higher levels of glutamate compared with IL-10-treated macrophages. This was accompanied by a significant increase in the levels of succinate (Figure 2A), but not of other tricarboxylic acid (TCA) cycle intermediates (data not shown), and GABA, similar to LPS/IFNγ macrophages (Figure 2A). Interestingly, 13C labeling experiments revealed that MSO treatment causes a significant shift from glutamine to glucose utilization for glutamate and TCA intermediate synthesis (Figures 2B–2F), as demonstrated by the consistent drop in 13C labeling from glutamine and the increase in 13C labeling from glucose in TCA cycle intermediates, with the exception of succinate (Figure 2G), in which there is a significant enrichment from 13C glutamine. However, glutamine uptake is not reduced, as also suggested by upregulation of the glutamine transporter LAT1 in MSO/IL-10 compared with IL-10 macrophages (Figure 2H), but is sustained and rerouted to succinate synthesis, probably through the GABA shunt. Additionally, the slight 13C enrichment in M+3 malate and citrate from glucose (Figure S2) clearly points to a small but significant reprogramming of pyruvate metabolism toward oxaloacetate through pyruvic carboxylase (PC) (Fan et al., 2010, Le et al., 2012).
Figure 2.

GS Inhibition Modifies Metabolite Levels in IL-10 versus LPS/IFNγ Macrophages
(A) Evaluation of glutamate, GABA, and succinate in IL-10, MSO/IL-10, and LPS/IFNγ versus resting (ctrl, 100%) macrophages (n = 6) following 24 hr of activation.
(B–G) Evaluation of the [U-13C]-glutamine-derived (right) and [U-13C]-glucose-derived (left) carbon incorporation levels into the TCA intermediates citrate (B), glutamate (C), 2 oxoglutarate (D), malate (E), fumarate (F), and succinate (G) in resting (M0), IL-10, and MSO-treated IL-10 versus LPS/IFNγ macrophages following 24 hr of activation (n = 4).
(H) LAT1 expression levels in resting M0, IL-10, and MSO/IL-10 macrophages following 16 hr of activation with and without previous MSO addition (n = 3).
Data are means ± SEM. ∗p < 0.05, ∗∗p < 0.001, ∗∗∗p < 0.0001.
GS Inhibition Blocks M2-like Skewing and Promotes an M1-like Phenotype
Because succinate accumulation, increased glucose utilization, and PC activation are all features typical of classically activated macrophages, we investigated the functional consequences of GS inhibition on the differentiation state of primary human monocyte-derived macrophages primed in culture toward an anti-inflammatory phenotype. As expected, the M2 macrophage marker CD163 was strongly induced and pronouncedly expressed on the surface of macrophages by IL-10 (Figure 3A). GS inhibition strongly reduced IL-10-mediated upregulation of CD163 in macrophages (Figures 3A–3C). In IL-10-stimulated cells, expression of the costimulatory molecule CD80 was almost absent (Figure 3A) compared with expression of the same marker in endotoxin-stimulated cells (M1) (Figures 3A and 3B). Treatment with IL-10 in the presence of MSO induced the M1 phenotype in macrophages, as indicated by the strong appearance and upregulation of CD80 concomitant with disappearance of CD163 (Figure 3D).
Figure 3.

GS Inhibition Modifies Polarization of IL-10 Macrophages
(A) Flow cytometric quantification of the percentage of CD80+ and CD163+ cells after IL-10 treatment in the absence or presence of MSO versus LPS/IFNγ treatment following 24 hr of activation (n = 4).
(B and C) FACS quantification of CD80 (B) and CD163 (C) levels in IL-10 and MSO-treated IL-10 versus LPS/IFNγ macrophages as above.
(D) FACS dot plots depicting CD80 and CD163 modulation following MSO treatment in IL-10 macrophages.
(E) qRT-PCR quantification of M1 or M2 markers in macrophages. Top: fold increase of TNF-α, CXCL9, CXCL10, and NOS2 mRNA in IL-10 and MSO-treated IL-10 (n = 3). Bottom: fold reduction of MSR1, MRC1, CCL17, and CCL18 mRNA in IL-10 and MSO-treated IL-10 macrophages following 24 hr of activation with and without previous MSO addition (n = 3).
(F) qRT-PCR quantification of M1 markers in macrophages with DMG. Shown is the fold increase of CD86, TNF-α, CD80, and CXCL10 mRNA in IL-10 macrophages with and without 2 hr of pre-incubation with 5 mM DMG.
Data are means ± SEM. ∗p < 0.05. ∗∗∗p < 0.0001.
Based on these results, we assessed the influence of GS on genes that are differentially expressed in M1 and M2 macrophages. GS inhibition in IL-10-stimulated macrophages upregulated the expression of genes preferentially found in M1 macrophages, such as TNF-α and NOS2 and, to a higher extent, CXCL9 and CXCL10 (Figure 3E; Figure S1B). MSO strongly prevented the induction of M2-specific markers upon IL-10 stimulation, such as MSR1 (CD204) and MRC1 (CD206), CCL17, and CCL18 (Figure 3E; Figure S1B). These data indicate that GS plays a positive role in M2 macrophage polarization and that GS blockade hinders the expression of M2 markers, whereas it promotes M1 markers.
To ascertain whether glutamate accumulation alone could be responsible for programming expression of specific markers of M1 macrophages, we treated IL-10 macrophages with the permeable dimethylglutamate (DMG). As shown in Figure 3F, incubation with 5 mM DMG in M2 macrophages is sufficient to induce a marked increase in M1 markers (Figure 3F) without influencing M2 markers (data not shown).
GS Inhibition Leads to HIF1α Activation
Having established that GS inhibition promotes an M1-like phenotype in macrophages in which the levels of succinate are increased, we then investigated the molecular mechanisms behind this functional reprogramming. Because succinate is known to stabilize HIF1α activity (Tannahill et al., 2013), we speculated that GS inhibition (and succinate accumulation) might promote a classical M1 phenotype through HIF1α activation (Takeda et al., 2010).
First of all, we assessed HIF1α transcriptional activity by expressing an inducible HIF-responsive firefly luciferase reporter in LPS/IFNγ, IL-10, and MSO/IL-10 macrophages. Luciferase activity was maximal in LPS/IFNγ, as expected, and very low in IL-10-treated macrophages (Figure 4A). MSO treatment completely reversed this activity in IL-10 macrophages because these cells exhibited luciferase signals comparable with LPS/IFNγ macrophages. Inhibition of HIF1α activity in LPS/IFNγ and MSO/IL-10 cells through acriflavine treatment lowered the luciferase reporter signal to the levels of resting (M0) and IL-10 macrophages (Figure 4A). In line with this finding, the HIF1α protein levels in MSO/IL-10 and LPS/IFNγ were higher compared with IL-10 macrophages (Figure 4B).
Figure 4.

GS Inhibition Stabilizes HIF1α Activity
(A) Evaluation of HIF1α transcriptional activity in resting (M0) and IL-10 versus LPS/IFNγ macrophages after 16 hr of stimulation with and/or without previous MSO and acriflavine (ACF) addition (n = 3).
(B) Western blotting and densitometric analysis of HIF1α protein in M0, IL-10, and MSO-treated IL-10 versus LPS/IFNγ macrophages after 16 hr of stimulation (n = 3).
(C) qRT-PCR quantification of M1 or M2 markers in macrophages following HIF1α inhibition. Top: fold change of TNF-α, NOS2, and CXCL10 mRNA in IL-10 stimulated macrophages with and/or without previous MSO and ACF addition (n = 3). Bottom: fold change of MSR1, MRC1, CCL17, and CCL18 mRNA levels in macrophages as above (n = 3).
Data are means ± SEM. ∗p < 0.05, ∗∗∗p < 0.0001.
Additionally, HIF1α inhibition by acriflavine treatment in MSO/IL-10 macrophages rescued the M2- to M1-like phenotype switching, as demonstrated by the decreased expression of markers typically expressed in classically activated macrophages, such as TNF-α, CXCL10, and inducible nitric oxide synthase (NOS2) (Figure 4C), and the concomitant increase of markers expressed in IL-10 macrophages, such as CCL17, MRS1, CCL18, and MRC1 (Figure 4C). Overall, these data support the idea that GS inhibition blocks the M2 skew by IL-10 and promotes an M1 phenotype, at least in part, via HIF1α, which can be possibly stabilized by succinate accumulation (Mills et al., 2016).
Starvation of M2 Macrophages Increases GS Expression
Since GS is known to respond to conditions of nutrient deprivation (van der Vos et al., 2012), we wanted to ascertain whether this was the case in macrophages. As starvation enhanced GS expression in both M0 and IL-10 macrophages (Figure 5A), we hypothesized that starvation could promote M2 polarization by promoting GS expression irrespective of IL-10 treatment. With this aim, we cultured M0 macrophages in regular rich medium (2 mM glutamine and 11 mM glucose) or in deprived medium (2 mM glucose and 0.3 mM glutamine) without any additional stimulus and measured M2 and M1 markers. Expression of M2 markers was enhanced in starved compared with normally grown M0 macrophages (Figure 5B) without any change in M1 markers (data not shown). To shed light on the role of GS expression under starved conditions, we measured the levels of extracellular glutamine in starved M0 compared with LPS/IFNγ macrophages. In rich medium, glutamate uptake in M0 macrophages parallels that displayed by LPS/IFNγ, whereas extracellular glutamine levels displays differences in M0 compared with LPS/IFNγ macrophages, which reached statistical significance at 72 hr (Figure 5C). Under starved conditions, extracellular levels of glutamate markedly decreased under both conditions, whereas, under starvation, glutamine levels significantly increased at 48 hr and even more at 72 hr in M0 compared with LPS/IFNγ macrophages, in which glutamine levels did not change (Figure 5C). This suggests that glutamine produced by the activity of GS in M0 macrophages might be secreted into spent medium, and this is also corroborated by the increased expression levels of the cellular glutamine transporters ASCT2 and LAT1 (Figure 5D).
Figure 5.

Starvation Enhances GS Expression in IL-10-Polarized Macrophages
(A) Western blotting and densitometric analysis of GS in resting (M0) and IL-10-treated macrophages in rich and starved medium after 60 hr of culture. Shown are representative lanes of the same western blot run and exposure. Data are means ± SEM. ∗p < 0.05, ∗∗p < 0.001 versus M0.
(B) qRT-PCR quantification of M2 markers under starved conditions. Shown are fold changes of MSR1, MRC1, CD209, CD163, and CCL18 mRNA in M0 macrophages in rich versus starved medium after 36 hr of culture (n = 3).
(C) Extracellular levels of glutamate and glutamine in rich and starved medium. Shown is quantification of glutamate and glutamine at 24, 48, and 72 hr of starvation (n = 3). Data are means ± SEM. ∗p < 0.05, ∗∗p < 0.001, ∗∗∗p < 0.0001 in 72-hr- compared with 24-hr-starved cells. #p < 0.05 in M0 versus LPS/IFNγ-treated cells.
(D) qRT-PCR quantification of GS and the glutamine transporters under rich and starved conditions. Shown are fold changes of GS, ASCT2, and LAT1 mRNA in M0 macrophages in rich versus starved medium after 36 hr of culture (n = 3).
Where not indicated otherwise, data are means ± SEM. ∗p < 0.05, ∗∗p < 0.001.
GS-Inhibited Macrophages Induce Lymphocyte Recruitment and Inhibit T Cell Suppression, Endothelial Cell (EC) Capillary Formation, and Cancer Cell Motility
Macrophages in their altered form are one of the major players to cause systemic fault of effector T cell functions (Kreider et al., 2007). We then tested the relevance of GS inhibition in M2 macrophages for T cell suppression and migration. After MSO was washed out, resting M2 and M2/MSO macrophages were co-cultured with autologous CD4+ and CD8+ T cells. IL-10-derived M2 macrophages stimulated for 24 hr had the highest ability to suppress the proliferation of cocultured CD4+ and CD8+ T cells (Figures 6A and 6B). Priming with MSO blunted the T cell-suppressive phenotype of M2 macrophages because CD4+ and CD8+ T cell proliferation was partly rescued; however, this rescue was statistically significant with CD8+ T cells only (Figures 6A and 6B). Nevertheless, the proliferation index (PI, the number of divisions divided by the number of cells that underwent division) significantly increased in both CD4+ and CD8+ cells when cultured with MSO/IL-10 versus IL-10 macrophages (Figure S3). We also evaluated the activation marker CD69 in T cell populations after coculture. We show that MSO/IL-10 macrophages induced a significant upregulation of CD69 expression on the surface of both CD4+ and CD8+ T cells compared with IL-10-stimulated macrophages and M0 resting cells (Figures 6C and 6D).
Figure 6.

GS Targeting in Macrophages Prevents T Cell Suppression and Inhibits Endothelial Capillary Network Formation
(A and B) T cells labeled with cell trace violet (CTV) were stimulated with or without autologous macrophages in different ways. Five days later, the percentage of CTV-low cells, measured by flow cytometry, was used as a measure of CD4+ (A) and CD8+ (B) proliferation (n = 4).
(C and D) Evaluation of CD69 protein, expressed as mean fluorescence intensity (MFI), was determined by flow cytometry on the surface of responder CD4+ (C) and CD8+ T cells (D) after coculture with or without macrophages (n = 3).
(E) CD8+ T cell recruitment by IL-10 and MSO-treated IL-10 macrophages versus LPS/IFNγ macrophages; the migration of T cells cultured without macrophages (−) in the presence of CXCL10 was used as a positive ctrl (n = 2).
(F) Quantification of the endothelial capillary network in the presence of macrophages pretreated for 24 hr with IL-10 or MSO/IL-10 after 4 hr of incubation with HUVEC cells (n = 8).
(G) Evaluation of cancer cell migration through a Matrigel-coated micropore filter in the absence (−) or presence of LPS/IFNγ, IL-10, and MSO/IL-10 prestimulated macrophages after 24 hr of incubation (n = 6).
Data are means ± SEM. ∗p < 0.05, ∗∗p < 0.001, ∗∗∗p < 0.0001 versus IL-10.
To evaluate the extent of adhesion and chemotaxis of T cells, CD8+ lymphocytes were cultured either alone or with, respectively, LPS/IFNγ, IL-10, and MSO/IL-10 macrophages and stimulated with the chemoattractant CXCL10. The presence of the chemokine or of M1 macrophages elicited their chemotaxis through a 5-μm pore membrane, at variance with IL-10-treated macrophages and the condition without macrophages (−) (Figure 6E). Upon MSO treatment, IL-10 macrophages regained the ability to promote migration and recruitment of T cells (Figure 6E).
Based on the previous findings, we next assessed the network of capillary formation promoted by M2 macrophages under conditions of GS inhibition. Compared with IL-10 macrophages, MSO/IL-10 cells displayed a reduced ability to promote capillary formation, indicating that the MSO treatment is able to reduce the angiogenic phenotype of IL-10 macrophages (Figure 6F). Given the ability of M2 macrophages to sustain cancer cell motility (Joyce and Pollard, 2009), we set up a system where we assessed cancer migration trough 8-μm pores in the presence of IL-10 versus MSO/IL-10 macrophages. Consistent with the observation that GS inhibition prevents M2 features, cancer cell migration in the presence of MSO/IL-10 macrophages was 56% inhibited compared with the condition where IL-10-stimulated M2-like macrophages were present on the Transwell (Figure 6G). In line with a more M1-like phenotype, MSO/IL-10 macrophages behaved similarly to LPS/IFNγ macrophages (Figure 6G).
Hence, GS activity in IL-10-stimulated, M2-like macrophages is required to suppress CD4+ and CD8+ T cell proliferation and limit CD8+ cell migration, whereas it promotes EC and cancer cell migration.
GS Deficiency in Tumor-Associated Macrophages Prevents Metastasis
To translate our findings in vivo, we specifically knocked out GS in macrophages upon administration of tamoxifen in GS-floxed mice expressing a tamoxifen-induced Cre under the macrophage promoter Csf1r, thus obtaining GS conditional knockout (cKO) mice (Experimental Procedures). After checking for macrophage-specific GS deletion (Figure 7A) and their metabolic features under stimulation (Figure S4), we implanted Lewis lung carcinoma (LLC) cells subcutaneously and monitored tumor growth. Although the tumor volumes and weights were always similar (Figures 7B and 7C), metastases in GS cKO versus GS wild-type (WT) mice were decreased 2-fold (Figure 7D). We then evaluated the features of the TAM infiltrate by fluorescence-activated cell sorting (FACS) and analyzed the expression of the M1-like marker major histocompatibility complex class II (MHC class II) and the M2-like marker CD206 (MRC1) on the cell membrane of F4/80+ cells (Laoui et al., 2014). Despite the overall macrophage abundance, in the tumor being comparable in both genotypes (Figure 7E; Figures S5A and S5B), we confirmed that GS cKO TAMs were prevalently MHC class IIhigh and CD206low (M1-like) compared with the WT controls that displayed mostly an MHC class IIlow and CD206high (M2-like) phenotype (Figures 7F and 7G). Furthermore, GS cKO TAMs displayed higher levels of intracellular glutamate and succinate but lower levels of glutamine, as shown by MSO/IL-10-treated macrophages (Figures 7H–7J). Finally, reduced expression of the M2-specific markers Arg1, Mrc1, Ccl17, and Ccl22 further confirmed that GS KO TAMs were skewed away from the M2-like phenotype (Figures 7K–7N).
Figure 7.

Genetic Deletion of GS in TAMs Induces an M1-like Phenotype and CTL Accumulation, Inhibits Metastasis, and Induces Vessel Normalization
(A) Efficiency and specificity of genetic deletion in cKO mice measured by qRT-PCR on GS mRNA in F4/80+ macrophages and F4/80− splenocytes, freshly sorted after 5-day in vivo treatment with tamoxifen (n = 3).
(B and C) Subcutaneous LLC tumor growth over time (B) and end-stage tumor weight (C) in wild-type (WT) and macrophage-specific knockout (cKO) mice (pool of 3 independent experiments, total n = 25).
(D) Number of lung metastases and lung metastatic index (the number of lung metastatic nodules divided by the corresponding tumor weight) in WT and macrophage-specific knockout (cKO) mice (pool of 3 independent experiments, total n = 25).
(E–G) FACS quantification of total F4/80+ TAMs (E), M1-like MHC class IIhigh TAMs (F), and CD206-positive TAMs (G) in WT and macrophage-specific knockout (cKO) mice (n = 4).
(H–J) Evaluation of glutamine (H), glutamate (I), and succinate (J) in WT and macrophage-specific knockout (cKO) mice (n = 4).
(K–N) qRT-PCR quantification of CCL17 (K), CCL22 (L), MRC1 (M), AND ARG1 (N) in WT and macrophage-specific knockout (cKO) mice (n = 4).
(O) FACS quantification of CD8+ cytotoxic T cells in WT and macrophage-specific knockout (cKO) mice (n = 4).
(P and Q) Quantification (P) and representative images (Q) of the CD31+ tumor vessel area in WT and macrophage-specific knockout (cKO) mice (n = 8). The vessel area was calculated by the percentage of CD31 area per field.
(R and S) Quantification (R) and representative images (S) of pimonidazole (PIMO)+ tumor hypoxic areas in WT and macrophage-specific knockout (cKO) mice (n = 8).
(T and U) Quantification (T) and representative images (U) of leaky vessels in WT and macrophage-specific knockout (cKO) mice, measured as the percentage of endoglin/CD105+ vessels surrounded by lakes of TER119+ red blood cells over the total number of vessels (n = 8). In each immunofluorescence quantification, n represents the number of animals. Six images per tumor were analyzed.
Scale bars, 100 μm. All graphs show mean ± SEM. ∗p < 0.05 versus the WT. See also Figures S1 and S2.
To validate our in vitro observation that GS inhibition leads to a less immunosuppressive phenotype, we quantified intratumoral T cells in GS cKO versus WT mice. Although CD4+ T cells were comparable in both genotypes (Figure S5C), cytotoxic CD8+ T cells were increased by 75% upon GS deletion in TAMs (Figure 7O).
We also studied the tumor vasculature, and, according to the shift in macrophage phenotype, we found a decrease in CD31 staining in tumors from GS cKO versus WT mice (Figures 7P and 7Q). However, tumor vessels in GS cKO mice displayed increased functionality and vascular integrity, as indicated, respectively, by reduced tumor hypoxia and decreased accumulation of leaked red blood cells in the perivascular space (Figures 7R–7U). To exclude any artifacts derived from the expression of Cre in KO TAMs only, we compared GS cKO mice with heterozygous controls (carrying the Cre transgene as well) and confirmed all of the key features described above (Figure S6). Altogether, these data demonstrate that the inhibition of GS in TAMs hinders their angiogenic, immunosuppressive, and pro-metastatic potential.
Discussion
TAMs are known to actively participate in the metastatic process by contributing to different steps in the metastatic cascade (Pollard, 2004). Indeed, TAMs do not only allow the tumor to escape the immune system but also promote angiogenic and lymphangiogenic sprouting, allowing cancer cells to escape through the vascular and lymphatic system, and, importantly, contribute to the formation of discontinuous, poorly covered, and leaky blood vessels that, because of their poor functionality, will not be able to restore oxygenation (Casazza et al., 2013, Condeelis and Pollard, 2006, Rolny et al., 2011). The lack of oxygen (hypoxia) and transient vascular permeability ultimately favor metastasis (Casanovas et al., 2005, Kerbel, 2005, Mazzone et al., 2009). It follows that antibodies blocking CSF1R, the receptor for the most relevant macrophage growth factor, CSF1, reduces circulating cancer cells and metastasis (Ries et al., 2014, Wyckoff et al., 2004).
Recently, metabolism has been highlighted as an important mediator of macrophage function through the discovery of the mechanisms that, behind these metabolic changes, strongly affect immune function (Galván-Peña and O’Neill, 2014), potentially modulating cancer development and metastasis formation. Here we identify a metabolic mechanism in macrophages that promotes protumoral and metastatic activities. GS activity and increased glutamine production provide metabolic conditions leading to the accumulation of M2-like, pro-metastatic macrophages (Figure S7). Besides its channeling into the TCA cycle, glutamine contributes to nucleotide and uridine diphosphate N-acetylglucosamine (UDP-GlcNAc) synthesis for support of protein folding and trafficking (Wellen and Thompson, 2012). In M2 macrophages, the glutamine route toward UDP-GlcNAc is particularly enhanced (Jha et al., 2015) because the molecule represents a building block for the synthesis of glycosylation moieties of lectin/mannose receptors, which, in their highly glycosylated form, are among the most typical M2 polarization markers (Sica and Mantovani, 2012). GS may then be crucial to sustain the M2 phenotype.
The relevance of GS in IL-10-stimulated macrophages is evident from the profound metabolic changes following GS inhibition and the subsequent functional deviation. Indeed, MSO treatment in IL-10 macrophages produces a strong intracellular accumulation of glutamate, which is probably a result of the cell’s inability to synthesize glutamine and remove ammonia. We show that abnormal glutamate alone is capable of skewing IL-10 macrophages toward a proinflammatory phenotype. However, MSO-inhibited macrophages display all the typical features of M1-like macrophages in which HIF1α is stabilized, such as enhanced glycolysis and increased M1 marker expression and typical functional behavior (Corcoran and O’Neill, 2016). Our results support a role of succinate as a pro-inflammatory metabolite that accumulates from glutamine through the GABA shunt. Because succinate is a critical regulator of the pro-inflammatory response, both through the inhibition of anti-inflammatory gene expression and via HIF1α stabilization (Mills et al., 2016); accumulation of this metabolite under conditions of GS inhibition might conceivably relate to the measured increased HIF1α activity. However, given the spectrum of metabolic changes described here, other HIF1-independent mechanisms can underline this phenotypic change in GS-inhibited macrophages.
The in vitro data are confirmed in an in vivo murine model of conditional GS deletion in TAMs in which metastasis formation is significantly reduced compared with control mice. Although restricted to a single tumor type, these results strongly support the idea that GS activity is important for the proangiogenic, immunosuppressive, and pro-metastatic function of M2-like macrophages. Accumulation of MHC class IIhigh CD206low M1-like macrophages following genetic deletion of GS is associated with a reduced metastatic burden (Figure 7) without altering the size of the primary tumor. This phenomenon can be explained by the contribution of TAMs to promoting distant cancer cell dissemination more than their relevance to tumor growth (Qian et al., 2015). However, such an effect on metastasis can be also indirect and, because of tumor vascular normalization, linked to reduced hypoxia and vessel permeability, in line with our previous reports (Leite de Oliveira et al., 2012, Mazzone et al., 2009, Rolny et al., 2011). Obviously, increased immunosurveillance as suggested by augmented CD8+ cytotoxic T-lymphocyte (CTL) cells can also hinder metastatic outgrowth, as previously shown by others (Eyles et al., 2010). What is certain is that the inhibition of metastasis observed in our mouse model can be ascribed to several factors and functions derived by GS-deficient, M1-repolarized TAMs (Pollard, 2004, Rolny et al., 2011).
It is worth noting that GS expression significantly senses nutrient deprivation because its expression level is under the control of FOXO3A (van der Vos et al., 2012). We confirm that M2-polarized macrophages under conditions of glutamine starvation enhance GS expression compared with those grown in high-nutrient medium, as already described for other cellular models (van der Vos et al., 2012). M0 macrophages (which weakly express GS) significantly increase GS protein levels following starvation, and this event is sufficient to skew cells toward an M2-like phenotype without any further cytokine treatment, in line with the role of nutrient deprivation in modifying the phenotype of macrophages, as described previously (O’Neill and Hardie, 2013). More interestingly, starvation in M0 macrophages promotes glutamine secretion, which is sustained by the upregulation of the cellular glutamine transporters. This clearly suggests that GS expression (which is enhanced under starved conditions) not only induces an M2-like polarization of macrophages but may also promote glutamine secretion for use by other cells.
In conclusion, our data suggest a functional role of glutamate-to-glutamine conversion in M2 macrophages that is relevant for the promotion of their immunosuppressive and proangiogenic state, which is ultimately relevant for metastasis formation. The present work highlights the role of metabolism rewiring as a way to manipulate macrophage functions, suggesting the importance of metabolic immunotherapeutic strategies in the fight against cancer.
Experimental Procedures
More detailed methods are described in the Supplemental Experimental Procedures.
Animals
Experiments with control and GS cKO mice were obtained from about 8-week-old gender- and age-matched C57BL/6 littermates raised in a strictly controlled environment. Colony-stimulating factor receptor 1 (CSF1R)-CreERT transgenic mice (CSF1R-CreERTTg/WT), provided by J. Pollard (University of Edinburgh, UK), in which a tamoxifen-induced Cre is under the transcriptional control of the human CSF1R promoter, were crossed with GS-floxed mice (GSL/L). The colony was bred by intercrossing GSL/L;CSF1R-CreERTTg/WT with GSL/L;CSF1R-CreERTWT/WT mice or GSL/L;CSF1R-CreERTTg/WT with GSL/WT;CSF1R-CreERTTg/WT mice. All mice were treated with intraperitoneally (i.p.) injected tamoxifen (1 mg/mouse/day) for 5 days before subcutaneous implantation of LLC cancer cells. Tamoxifen-treated GSL/L;CSF1R-CreERTTg/WT mice were designated GS cKO mice, whereas GSL/L;CSF1R-CreERTWT/WT mice or GSL/WT;CSF1R-CreERTTg/WT mice were used as control mice and denoted as WT or heterozygous (HET), respectively. Construction of targeting vectors and pup genotyping were performed as reported previously (He et al., 2010). 1 × 10⁶ LLC adherent growing murine cells were injected subcutaneously. Volumes were measured three times a week using the formula V = π × d2 × D/6, where d is the minor tumor axis and D is the major tumor axis. At the end stage, tumor weight was registered, and lung metastasis nodules were counted after intratracheal injection of 15% India ink solution (Finisguerra et al., 2015). Housing and all experimental animal procedures were approved by the Institutional Animal Care and Research Advisory Committee of the KU Leuven.
Cell Isolation and Culture
Human monocytes were obtained from healthy blood donor buffy coats under an institutional review board-approved protocol and isolated with CD14 MicroBeads (Miltenyi Biotec) as described previously (Palmieri et al., 2015). After differentiation, macrophages were stimulated with LPS/IFNγ (for M1 polarization), IL-4, IL-10, or a combination of both IL-4 and IL-10 (for M2 polarization). Experiments of inhibition were performed using 1 mM MSO, an irreversible inhibitor of GS, 1 hr before adding cytokines for activation. When starved, macrophages were transferred, for the last 36 hr of their differentiation, into RPMI medium containing 2 mM glucose and 0.3 mM glutamine. Cells were then stimulated with cytokines at the indicated times.
RNA and Protein Expression Analysis
RNA isolation and subsequent qRT-PCR analysis as well as protein extraction and western blot analysis were performed as described before (Menga et al., 2015, Palmieri et al., 2014, Prosniak et al., 2013). Glutamine quantification by liquid chromatography-tandem mass spectrometry (LC-MS/MS) was achieved as described previously (Palmieri et al., 2014), whereas GS enzymatic activity was measured as indicated (Castegna et al., 2011).
13C Tracing Experiments
For metabolite analysis using mass spectrometry, cells were cultured for 24 hr in glucose- and glutamine-free DMEM with dialyzed fetal bovine serum (FBS), and the appropriate tracer was added. [U-13C]-glutamine and [U-13C]-glucose were from Sigma-Aldrich and Cambridge Isotopes Laboratories, respectively. Samples were extracted and analyzed as described in the Supplemental Experimental Procedures.
HIF1α-Responsive Luciferase Reported Expression
To express an inducible HIF-responsive firefly luciferase reporter, a pRRL-H3RO (Leite de Oliveira et al., 2012) plasmid vector was used. Human macrophages (4 × 10⁴) were seeded in a 96-well plate in RPMI and 10% FBS as described before and transfected on day 7 of differentiation After 24 hr, cells were stimulated with LPS/IFNγ or IL-10 with and/or without 2 hr of pre-incubation with 1 mM MSO and 5 μM acriflavine (ACF). After 16 hr, the same amount of protein extract was read in a luminometer (Takeda et al., 2011).
CD4+ and CD8+ T Cell Purification and Expansion and CD8+ Transmigration Assay
CD4+ and CD8+ cells were purified by magnetic assisted cell sorting (MACS) as described elsewhere (Barik et al., 2013), activated, expanded, and co-cultured with M2 and M2 plus MSO. Proliferation was measured, and suppression was calculated as in the Supplemental Experimental Procedures.
Migration of CD8+ cells in response to macrophage-secreted factors was assessed by using Transwell permeable supports with a 5-μm porous polycarbonate membrane (Costar). LPS/IFNγ and IL-10 stimulated macrophages with or without MSO and CD8+ cells were incubated for 3 hr at 37°C, and migrated cells were collected and counted under a microscope (Finisguerra et al., 2015) as described in the Supplemental Experimental Procedures.
EC Capillary Formation
2 × 10⁵ human differentiated macrophages were embedded in Matrigel (BD Biosciences). After 4 hr of preconditioning, 1 × 10⁴ human umbilical vein endothelial cell (HUVEC) fluorescently labeled with PKH-26 (Sigma-Aldrich) were added to the Matrigel. After 4 hr, HUVEC capillary formation was analyzed by measuring the number and length of branches using ImageJ software.
Statistical Analysis
Data entry and all analyses were performed in a blinded fashion. Results are shown as means ± SEM. Statistical significance was calculated by two-tailed unpaired t test or ANOVA test with Tukey post hoc test and considered statistically significant as follows: ∗p < 0.05, ∗∗p < 0.001, ∗∗∗p < 0.0001.
Author Contributions
A.C. and M.M. designed the research. E.M.P., R.M.P., A.M., G.D.T., A.Q., C.R.D., and B.G. performed the research. D.C.H., A.G., W.H.L., and D.W.M. provided expertises and contributed reagents. E.M.P., R.M., A.M., and G.D.T. analyzed the data. A.C. and M.M. wrote the manuscript.
Acknowledgments
The authors are very grateful to J. Pollard for providing the CSF1R-CreERTTg/WT mouse. B.G. was hosted by the University of Bari as a visiting scientist. A.C. is supported by grants from the University of Bari. M.M. is supported by an ERC starting grant (OxyMO, 308459) and by the following Belgian funding: FWO (G066515N) and STK (2014-197). R.M.P. and C.R.D. are supported by FWO postdoctoral and Ph.D. fellowships (12N4915N and 1108917N, respectively). E.M.P. and A.M. were both short-term EMBO fellows at the University of Leuven. The authors would also like to thank J. Subleski (from The Cancer and Inflammation Program, National Cancer Institute-Frederick, Frederick, MD 21702, USA) for technical assistance. The content of this paper does not necessarily reflect the views or policies of the Department of Health and Human Services USA, nor does mention of trade names, commercial products, or organizations imply endorsement by the US government. This work was funded, in part, by the Intramural Program of the National Institutes of Health, National Cancer Institute.
Published: August 15, 2017
Footnotes
Supplemental Information includes Supplemental Experimental Procedures and seven figures and can be found with this article online at http://dx.doi.org/10.1016/j.celrep.2017.07.054.
Contributor Information
Massimiliano Mazzone, Email: massimiliano.mazzone@vib-kuleuven.be.
Alessandra Castegna, Email: alessandra.castegna@uniba.it.
Supplemental Information
References
- Barik S., Banerjee S., Mallick A., Goswami K.K., Roy S., Bose A., Baral R. Normalization of tumor microenvironment by neem leaf glycoprotein potentiates effector T cell functions and therapeutically intervenes in the growth of mouse sarcoma. PLoS ONE. 2013;8:e66501. doi: 10.1371/journal.pone.0066501. [DOI] [PMC free article] [PubMed] [Google Scholar]
- Biswas S.K., Mantovani A. Macrophage plasticity and interaction with lymphocyte subsets: cancer as a paradigm. Nat. Immunol. 2010;11:889–896. doi: 10.1038/ni.1937. [DOI] [PubMed] [Google Scholar]
- Butterworth R.F. Hepatic encephalopathy. Alcohol Res. Health. 2003;27:240–246. [PMC free article] [PubMed] [Google Scholar]
- Casanovas O., Hicklin D.J., Bergers G., Hanahan D. Drug resistance by evasion of antiangiogenic targeting of VEGF signaling in late-stage pancreatic islet tumors. Cancer Cell. 2005;8:299–309. doi: 10.1016/j.ccr.2005.09.005. [DOI] [PubMed] [Google Scholar]
- Casazza A., Laoui D., Wenes M., Rizzolio S., Bassani N., Mambretti M., Deschoemaeker S., Van Ginderachter J.A., Tamagnone L., Mazzone M. Impeding macrophage entry into hypoxic tumor areas by Sema3A/Nrp1 signaling blockade inhibits angiogenesis and restores antitumor immunity. Cancer Cell. 2013;24:695–709. doi: 10.1016/j.ccr.2013.11.007. [DOI] [PubMed] [Google Scholar]
- Castegna A., Palmieri L., Spera I., Porcelli V., Palmieri F., Fabis-Pedrini M.J., Kean R.B., Barkhouse D.A., Curtis M.T., Hooper D.C. Oxidative stress and reduced glutamine synthetase activity in the absence of inflammation in the cortex of mice with experimental allergic encephalomyelitis. Neuroscience. 2011;185:97–105. doi: 10.1016/j.neuroscience.2011.04.041. [DOI] [PubMed] [Google Scholar]
- Chrétien F., Vallat-Decouvelaere A.V., Bossuet C., Rimaniol A.C., Le Grand R., Le Pavec G., Créminon C., Dormont D., Gray F., Gras G. Expression of excitatory amino acid transporter-2 (EAAT-2) and glutamine synthetase (GS) in brain macrophages and microglia of SIVmac251-infected macaques. Neuropathol. Appl. Neurobiol. 2002;28:410–417. doi: 10.1046/j.1365-2990.2002.00426.x. [DOI] [PubMed] [Google Scholar]
- Colegio O.R., Chu N.-Q., Szabo A.L., Chu T., Rhebergen A.M., Jairam V., Cyrus N., Brokowski C.E., Eisenbarth S.C., Phillips G.M. Functional polarization of tumour-associated macrophages by tumour-derived lactic acid. Nature. 2014;513:559–563. doi: 10.1038/nature13490. [DOI] [PMC free article] [PubMed] [Google Scholar]
- Condeelis J., Pollard J.W. Macrophages: obligate partners for tumor cell migration, invasion, and metastasis. Cell. 2006;124:263–266. doi: 10.1016/j.cell.2006.01.007. [DOI] [PubMed] [Google Scholar]
- Corcoran S.E., O’Neill L.A.J. HIF1α and metabolic reprogramming in inflammation. J. Clin. Invest. 2016;126:3699–3707. doi: 10.1172/JCI84431. [DOI] [PMC free article] [PubMed] [Google Scholar]
- Curi R., Newsholme P., Procopio J., Lagranha C., Gorjão R., Pithon-Curi T.C. Glutamine, gene expression, and cell function. Front. Biosci. 2007;12:344–357. doi: 10.2741/2068. [DOI] [PubMed] [Google Scholar]
- Eisenberg D., Gill H.S., Pfluegl G.M., Rotstein S.H. Structure-function relationships of glutamine synthetases. Biochim. Biophys. Acta. 2000;1477:122–145. doi: 10.1016/s0167-4838(99)00270-8. [DOI] [PubMed] [Google Scholar]
- Eyles J., Puaux A.-L., Wang X., Toh B., Prakash C., Hong M., Tan T.G., Zheng L., Ong L.C., Jin Y. Tumor cells disseminate early, but immunosurveillance limits metastatic outgrowth, in a mouse model of melanoma. J. Clin. Invest. 2010;120:2030–2039. doi: 10.1172/JCI42002. [DOI] [PMC free article] [PubMed] [Google Scholar]
- Fan T.W., Yuan P., Lane A.N., Higashi R.M., Wang Y., Hamidi A.B., Zhou R., Guitart X., Chen G., Manji H.K., Kaddurah-Daouk R. Stable isotope-resolved metabolomic analysis of lithium effects on glial-neuronal metabolism and interactions. Metabolomics. 2010;6:165–179. doi: 10.1007/s11306-010-0208-9. [DOI] [PMC free article] [PubMed] [Google Scholar]
- Finisguerra V., Di Conza G., Di Matteo M., Serneels J., Costa S., Thompson A.A.R., Wauters E., Walmsley S., Prenen H., Granot Z. MET is required for the recruitment of anti-tumoural neutrophils. Nature. 2015;522:349–353. doi: 10.1038/nature14407. [DOI] [PMC free article] [PubMed] [Google Scholar]
- Galván-Peña S., O’Neill L.A.J. Metabolic reprograming in macrophage polarization. Front. Immunol. 2014;5:420. doi: 10.3389/fimmu.2014.00420. [DOI] [PMC free article] [PubMed] [Google Scholar]
- Hadden T.J., Ryou C., Miller R.E. Elements in the distal 5′-flanking sequence and the first intron function cooperatively to regulate glutamine synthetase transcription during adipocyte differentiation. Nucleic Acids Res. 1997;25:3930–3936. doi: 10.1093/nar/25.19.3930. [DOI] [PMC free article] [PubMed] [Google Scholar]
- He Y., Hakvoort T.B.M., Vermeulen J.L.M., Labruyère W.T., De Waart D.R., Van Der Hel W.S., Ruijter J.M., Uylings H.B.M., Lamers W.H. Glutamine synthetase deficiency in murine astrocytes results in neonatal death. Glia. 2010;58:741–754. doi: 10.1002/glia.20960. [DOI] [PubMed] [Google Scholar]
- Huang X.-L., Wang Y.-J., Yan J.-W., Wan Y.-N., Chen B., Li B.-Z., Yang G.-J., Wang J. Role of anti-inflammatory cytokines IL-4 and IL-13 in systemic sclerosis. Inflamm. Res. 2015;64:151–159. doi: 10.1007/s00011-015-0806-0. [DOI] [PubMed] [Google Scholar]
- Jha A.K., Huang S.C.-C., Sergushichev A., Lampropoulou V., Ivanova Y., Loginicheva E., Chmielewski K., Stewart K.M., Ashall J., Everts B. Network integration of parallel metabolic and transcriptional data reveals metabolic modules that regulate macrophage polarization. Immunity. 2015;42:419–430. doi: 10.1016/j.immuni.2015.02.005. [DOI] [PubMed] [Google Scholar]
- Joyce J.A., Pollard J.W. Microenvironmental regulation of metastasis. Nat. Rev. Cancer. 2009;9:239–252. doi: 10.1038/nrc2618. [DOI] [PMC free article] [PubMed] [Google Scholar]
- Kerbel R.S. Therapeutic implications of intrinsic or induced angiogenic growth factor redundancy in tumors revealed. Cancer Cell. 2005;8:269–271. doi: 10.1016/j.ccr.2005.09.016. [DOI] [PubMed] [Google Scholar]
- Klysz D., Tai X., Robert P.A., Craveiro M., Cretenet G., Oburoglu L., Mongellaz C., Floess S., Fritz V., Matias M.I. Glutamine-dependent α-ketoglutarate production regulates the balance between T helper 1 cell and regulatory T cell generation. Sci. Signal. 2015;8:ra97. doi: 10.1126/scisignal.aab2610. [DOI] [PubMed] [Google Scholar]
- Kocher T., Schraml P., Spagnoli G.C., Harder F., Heberer M. Identification of genes differentially expressed in melanoma sublines derived from a single surgical specimen characterised by different sensitivity to cytotoxic T-lymphocyte activity. Schweiz. Med. Wochenschr. 2000;130:617–624. [PubMed] [Google Scholar]
- Kreider T., Anthony R.M., Urban J.F., Jr., Gause W.C. Alternatively activated macrophages in helminth infections. Curr. Opin. Immunol. 2007;19:448–453. doi: 10.1016/j.coi.2007.07.002. [DOI] [PMC free article] [PubMed] [Google Scholar]
- Kung H.N., Marks J.R., Chi J.T. Glutamine synthetase is a genetic determinant of cell type-specific glutamine independence in breast epithelia. PLoS Genet. 2011;7:e1002229. doi: 10.1371/journal.pgen.1002229. [DOI] [PMC free article] [PubMed] [Google Scholar]
- Laoui D., Van Overmeire E., Di Conza G., Aldeni C., Keirsse J., Morias Y., Movahedi K., Houbracken I., Schouppe E., Elkrim Y. Tumor hypoxia does not drive differentiation of tumor-associated macrophages but rather fine-tunes the M2-like macrophage population. Cancer Res. 2014;74:24–30. doi: 10.1158/0008-5472.CAN-13-1196. [DOI] [PubMed] [Google Scholar]
- Le A., Lane A.N., Hamaker M., Bose S., Gouw A., Barbi J., Tsukamoto T., Rojas C.J., Slusher B.S., Zhang H. Glucose-independent glutamine metabolism via TCA cycling for proliferation and survival in B cells. Cell Metab. 2012;15:110–121. doi: 10.1016/j.cmet.2011.12.009. [DOI] [PMC free article] [PubMed] [Google Scholar]
- Leite de Oliveira R., Deschoemaeker S., Henze A.-T., Debackere K., Finisguerra V., Takeda Y., Roncal C., Dettori D., Tack E., Jönsson Y. Gene-targeting of Phd2 improves tumor response to chemotherapy and prevents side-toxicity. Cancer Cell. 2012;22:263–277. doi: 10.1016/j.ccr.2012.06.028. [DOI] [PubMed] [Google Scholar]
- Liu C., Wu W., Zhang B., Xiang J., Zou J. Temporospatial expression and cellular localization of glutamine synthetase following traumatic spinal cord injury in adult rats. Mol. Med. Rep. 2013;7:1431–1436. doi: 10.3892/mmr.2013.1383. [DOI] [PubMed] [Google Scholar]
- Locati M., Mantovani A., Sica A. Macrophage activation and polarization as an adaptive component of innate immunity. Adv. Immunol. 2013;120:163–184. doi: 10.1016/B978-0-12-417028-5.00006-5. [DOI] [PubMed] [Google Scholar]
- Martinez F.O., Gordon S., Locati M., Mantovani A. Transcriptional profiling of the human monocyte-to-macrophage differentiation and polarization: new molecules and patterns of gene expression. J. Immunol. 2006;177:7303–7311. doi: 10.4049/jimmunol.177.10.7303. [DOI] [PubMed] [Google Scholar]
- Mazzone M., Dettori D., de Oliveira R.L., Loges S., Schmidt T., Jonckx B., Tian Y.-M., Lanahan A.A., Pollard P., de Almodovar C.R. Heterozygous deficiency of PHD2 restores tumor oxygenation and inhibits metastasis via endothelial normalization. Cell. 2009;136:839–851. doi: 10.1016/j.cell.2009.01.020. [DOI] [PMC free article] [PubMed] [Google Scholar]
- McGettrick A.F., O’Neill L.A.J. How metabolism generates signals during innate immunity and inflammation. J. Biol. Chem. 2013;288:22893–22898. doi: 10.1074/jbc.R113.486464. [DOI] [PMC free article] [PubMed] [Google Scholar]
- Menga A., Iacobazzi V., Infantino V., Avantaggiati M.L., Palmieri F. The mitochondrial aspartate/glutamate carrier isoform 1 gene expression is regulated by CREB in neuronal cells. Int. J. Biochem. Cell Biol. 2015;60:157–166. doi: 10.1016/j.biocel.2015.01.004. [DOI] [PMC free article] [PubMed] [Google Scholar]
- Metzler B., Gfeller P., Guinet E. Restricting glutamine or glutamine-dependent purine and pyrimidine syntheses promotes human T cells with high FOXP3 expression and regulatory properties. J. Immunol. 2016;196:3618–3630. doi: 10.4049/jimmunol.1501756. [DOI] [PubMed] [Google Scholar]
- Mills E.L., Kelly B., Logan A., Costa A.S.H., Varma M., Bryant C.E., Tourlomousis P., Däbritz J.H.M., Gottlieb E., Latorre I. Succinate dehydrogenase supports metabolic repurposing of mitochondria to drive inflammatory macrophages. Cell. 2016;167:457–470.e13. doi: 10.1016/j.cell.2016.08.064. [DOI] [PMC free article] [PubMed] [Google Scholar]
- Murphy C., Newsholme P. Importance of glutamine metabolism in murine macrophages and human monocytes to L-arginine biosynthesis and rates of nitrite or urea production. Clin. Sci. 1998;95:397–407. [PubMed] [Google Scholar]
- Norenberg M.D., Jayakumar A.R., Rama Rao K.V., Panickar K.S. New concepts in the mechanism of ammonia-induced astrocyte swelling. Metab. Brain Dis. 2007;22:219–234. doi: 10.1007/s11011-007-9062-5. [DOI] [PubMed] [Google Scholar]
- O’Neill L.A., Hardie D.G. Metabolism of inflammation limited by AMPK and pseudo-starvation. Nature. 2013;493:346–355. doi: 10.1038/nature11862. [DOI] [PubMed] [Google Scholar]
- O’Neill L.A.J., Pearce E.J. Immunometabolism governs dendritic cell and macrophage function. J. Exp. Med. 2016;213:15–23. doi: 10.1084/jem.20151570. [DOI] [PMC free article] [PubMed] [Google Scholar]
- Olney J.W. Excitotoxicity: an overview. Can. Dis. Wkly. Rep. 1990;16(Suppl 1E):47–57. discussion 57–58. [PubMed] [Google Scholar]
- Palmieri E.M., Spera I., Menga A., Infantino V., Iacobazzi V., Castegna A. Glutamine synthetase desensitizes differentiated adipocytes to proinflammatory stimuli by raising intracellular glutamine levels. FEBS Lett. 2014;588:4807–4814. doi: 10.1016/j.febslet.2014.11.015. [DOI] [PubMed] [Google Scholar]
- Palmieri E.M., Spera I., Menga A., Infantino V., Porcelli V., Iacobazzi V., Pierri C.L., Hooper D.C., Palmieri F., Castegna A. Acetylation of human mitochondrial citrate carrier modulates mitochondrial citrate/malate exchange activity to sustain NADPH production during macrophage activation. Biochim. Biophys. Acta. 2015;1847:729–738. doi: 10.1016/j.bbabio.2015.04.009. [DOI] [PubMed] [Google Scholar]
- Palmieri E.M., Menga A., Lebrun A., Hooper D.C., Butterfield D.A., Mazzone M., Castegna A. Blockade of glutamine synthetase enhances inflammatory response in microglial cells. Antioxid. Redox Signal. 2017;26:351–363. doi: 10.1089/ars.2016.6715. [DOI] [PMC free article] [PubMed] [Google Scholar]
- Pollard J.W. Tumour-educated macrophages promote tumour progression and metastasis. Nat. Rev. Cancer. 2004;4:71–78. doi: 10.1038/nrc1256. [DOI] [PubMed] [Google Scholar]
- Prosniak M., Harshyne L.A., Andrews D.W., Kenyon L.C., Bedelbaeva K., Apanasovich T.V., Heber-Katz E., Curtis M.T., Cotzia P., Hooper D.C. Glioma grade is associated with the accumulation and activity of cells bearing M2 monocyte markers. Clin. Cancer Res. 2013;19:3776–3786. doi: 10.1158/1078-0432.CCR-12-1940. [DOI] [PubMed] [Google Scholar]
- Qian B.-Z., Zhang H., Li J., He T., Yeo E.-J., Soong D.Y.H., Carragher N.O., Munro A., Chang A., Bresnick A.R. FLT1 signaling in metastasis-associated macrophages activates an inflammatory signature that promotes breast cancer metastasis. J. Exp. Med. 2015;212:1433–1448. doi: 10.1084/jem.20141555. [DOI] [PMC free article] [PubMed] [Google Scholar]
- Ries C.H., Cannarile M.A., Hoves S., Benz J., Wartha K., Runza V., Rey-Giraud F., Pradel L.P., Feuerhake F., Klaman I. Targeting tumor-associated macrophages with anti-CSF-1R antibody reveals a strategy for cancer therapy. Cancer Cell. 2014;25:846–859. doi: 10.1016/j.ccr.2014.05.016. [DOI] [PubMed] [Google Scholar]
- Rolny C., Mazzone M., Tugues S., Laoui D., Johansson I., Coulon C., Squadrito M.L., Segura I., Li X., Knevels E. HRG inhibits tumor growth and metastasis by inducing macrophage polarization and vessel normalization through downregulation of PlGF. Cancer Cell. 2011;19:31–44. doi: 10.1016/j.ccr.2010.11.009. [DOI] [PubMed] [Google Scholar]
- Sica A., Mantovani A. Macrophage plasticity and polarization: in vivo veritas. J. Clin. Invest. 2012;122:787–795. doi: 10.1172/JCI59643. [DOI] [PMC free article] [PubMed] [Google Scholar]
- Takeda N., O’Dea E.L., Doedens A., Kim J.W., Weidemann A., Stockmann C., Asagiri M., Simon M.C., Hoffmann A., Johnson R.S. Differential activation and antagonistic function of HIF-alpha isoforms in macrophages are essential for NO homeostasis. Genes Dev. 2010;24:491–501. doi: 10.1101/gad.1881410. [DOI] [PMC free article] [PubMed] [Google Scholar]
- Takeda Y., Costa S., Delamarre E., Roncal C., Leite de Oliveira R., Squadrito M.L., Finisguerra V., Deschoemaeker S., Bruyère F., Wenes M. Macrophage skewing by Phd2 haplodeficiency prevents ischaemia by inducing arteriogenesis. Nature. 2011;479:122–126. doi: 10.1038/nature10507. [DOI] [PMC free article] [PubMed] [Google Scholar]
- Tannahill G.M., Curtis A.M., Adamik J., Palsson-McDermott E.M., McGettrick A.F., Goel G., Frezza C., Bernard N.J., Kelly B., Foley N.H. Succinate is an inflammatory signal that induces IL-1β through HIF-1α. Nature. 2013;496:238–242. doi: 10.1038/nature11986. [DOI] [PMC free article] [PubMed] [Google Scholar]
- van der Vos K.E., Eliasson P., Proikas-Cezanne T., Vervoort S.J., van Boxtel R., Putker M., van Zutphen I.J., Mauthe M., Zellmer S., Pals C. Modulation of glutamine metabolism by the PI(3)K-PKB-FOXO network regulates autophagy. Nat. Cell Biol. 2012;14:829–837. doi: 10.1038/ncb2536. [DOI] [PubMed] [Google Scholar]
- Wellen K.E., Thompson C.B. A two-way street: reciprocal regulation of metabolism and signalling. Nat. Rev. Mol. Cell Biol. 2012;13:270–276. doi: 10.1038/nrm3305. [DOI] [PubMed] [Google Scholar]
- Wenes M., Shang M., Di Matteo M., Goveia J., Martín-Pérez R., Serneels J., Prenen H., Ghesquière B., Carmeliet P., Mazzone M. Macrophage metabolism controls tumor blood vessel morphogenesis and metastasis. Cell Metab. 2016;24:701–715. doi: 10.1016/j.cmet.2016.09.008. [DOI] [PubMed] [Google Scholar]
- Wyckoff J., Wang W., Lin E.Y., Wang Y., Pixley F., Stanley E.R., Graf T., Pollard J.W., Segall J., Condeelis J. A paracrine loop between tumor cells and macrophages is required for tumor cell migration in mammary tumors. Cancer Res. 2004;64:7022–7029. doi: 10.1158/0008-5472.CAN-04-1449. [DOI] [PubMed] [Google Scholar]
Associated Data
This section collects any data citations, data availability statements, or supplementary materials included in this article.