
Figure 5.
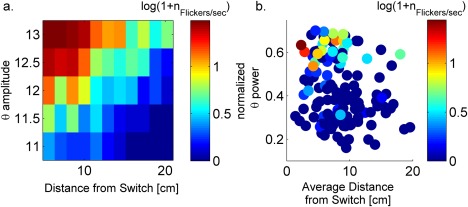
Flickering depends on theta power and animal position after the switch in environment. (a) The number of flickering events ( ) increases with theta amplitude and decreases with distance from switch position ‐ model. Each square shows the number of flickering events during 5s after the switch (color coded), from a simulation with different theta amplitude ( ) and virtual animal speed (constant during the simulation), which results in a different average distance from the switch position during 5 s following the switch. (b) Data: Each dot represents the number of flickering event per seconds in a time window of 5s after the switch of sensory cues (color coded,) from a single trial, characterized by (i) The average distance of the animal position in the time window (ii) Normalized theta power around the switch. Partial correlation coefficient between theta power and was 0.44 with p value < 0.001. Partial correlation coefficient between V and n Flickers was −0.15 with p value<0.05 (see methods) [Color figure can be viewed at wileyonlinelibrary.com]