Abstract
The microbial transfer of electrons to extracellularly located solid compounds, termed extracellular electron transport (EET), is critical for microbial electrode catalysis. Although the components of the EET pathway in the outer membrane (OM) have been identified, the role of electron/cation coupling in EET kinetics is poorly understood. We studied the dynamics of proton transport associated with EET in an OM flavocytochrome complex in Shewanella oneidensis MR‐1. Using a whole‐cell electrochemical assay, a significant kinetic isotope effect (KIE) was observed following the addition of deuterated water (D2O). The removal of a flavin cofactor or key components of the OM flavocytochrome complex significantly increased the KIE in the presence of D2O to values that were significantly larger than those reported for proton channels and ATP synthase, thus indicating that proton transport by OM flavocytochrome complexes limits the rate of EET.
Keywords: ATP synthases, cytochromes, whole-cell electrochemistry, kinetic isotope effect, proton motive force
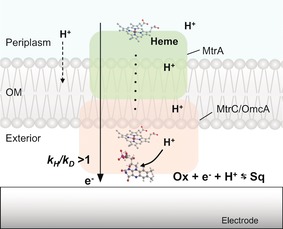
The iron‐reducing bacterium Shewanella oneidensis MR‐1 is capable of moving electrons from the respiratory chain to the cell exterior through a process called extracellular electron transport (EET).1 Respiratory electrons are transported from the periplasm to the outside of the cell by c‐type cytochromes located in the outer membrane (OM Cyts c),2 which contain dozens of heme iron centers and act as biological electron conduits.3 Direct interfacial electron transport to extracellular solids is terminated either by a covalent heme center in OM Cyts c or a non‐covalently bound flavin cofactor with OM Cyts c (Figure 1).4 In contrast to microbial respiration with soluble substrates, EET is potentially not limited by the diffusion kinetics of intra‐ or inter‐cellular metabolites,4c, 5 thus making the EET of iron‐reducing bacteria important for iron and manganese circulation in nature1 and for microbial technologies such as microbial fuel cells6 and electrode biosynthesis.7
Figure 1.

Schematic illustration of extracellular electron transport by the outer‐membrane flavocytochrome complex in S. oneidensis MR‐1 and the non‐covalent flavin cofactor that is involved in a rate‐limiting proton transport. Ox and Sq represent fully oxidized flavin and semiquinone, respectively.
Although the pathways and kinetics of electron flow during EET have been studied over the past three decades,4a–4c, 5a little attention has been given to the alternative roles of counter cations, other than that of a proton motive force (PMF). Therefore, protons have been primarily considered to promote chemiosmotic ATP production.8 In this study, we examined the kinetics of proton transport associated with EET by an OM Cyt c complex and PMF generation during EET by using whole‐cell electrochemical measurements in wild‐type (WT) and mutant strains of S. oneidensis MR‐1. Our data revealed that the role of protons is not to promote the chemiosmotic formation of ATP but to regulate the rate of electron transport by the OM Cyt c.
To test for a possible role of proton transfer in the kinetics of EET, we examined the deuterium kinetic isotope effect (KIE) for EET, one of the most critical ways to study the contribution of proton transfer on the kinetics of electron transport, by using a 3‐electrode electrochemical system with a molecularly homogeneous spattered indium tin‐doped oxide (ITO) electrode. To utilize the KIE to examine whether proton transport determines the rate of EET by OM Cyts c in in vivo measurements, the rate of EET by the OM Cyts c must limit or reflect the catalytic current (Ic) production. For this reason, the experiments were conducted in an electrochemical system containing sufficient lactate as an electron donor and under pH and temperature conditions that support oxidative lactate metabolism, thereby limiting the Ic to EET by OM Cyts c, as confirmed in previous reports.4c,4d, 9 The measurements were conducted following the electrochemical cultivation of MR‐1 as a monolayer biofilm on an ITO electrode, poised at +0.4 V [vs. the standard hydrogen electrode (SHE)]. The supernatant solution in the electrochemical cell was refreshed before the addition of deuterated water (D2O) to maximize the cellular metabolic activity for lactate oxidation and to minimize the involvement of motile bacteria.
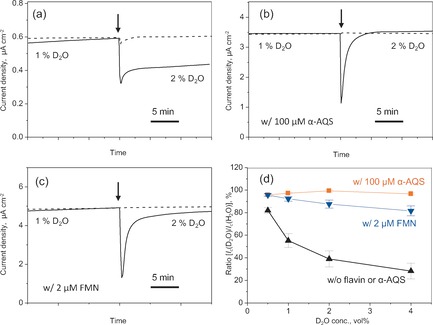
Upon the addition of D2O to the electrochemical system, the Ic value sharply decreased within 10 s; further addition of D2O, up to a final concentration of 4 %, resulted in a further decrease in the Ic, whereas almost no reduction in the Ic was observed following the addition of H2O (Figure 2 a and d). To confirm that the large current reduction was not attributable to slower reactions upstream of OM Cyt c due to the presence of deuterium ions, we examined the effect of D2O on Ic in the presence of anthraquinone‐1‐sulfonate (α‐AQS), which functions as a shuttling mediator for the transport of both electrons and protons that are in the electron‐transport chain and are located in the inner membrane or periplasm.10 In the presence of 100 μm α‐AQS, the Ic was limited by diffusion (Figure S1 in the Supporting Information) and the addition of D2O had minimal impact on the Ic (Figure 2 b and d), thus indicating that the potential delay of upstream reactions by deuterium ions did not cause the large KIE. Based on these results, the large KIE could be attributed to the EET process by OM Cyts c.
Figure 2.

Time versus current production (Ic) for a monolayer biofilm of S. oneidensis MR‐1 in an electrochemical system containing 10 mm lactate (a), and additionally 100 μm anthraquinone‐1‐sulfonate (α‐AQS; b), or 2 μm flavin mononucleotide (FMN; c). The arrow indicates the time of the addition of D2O (solid line) or H2O (dotted line). The data corresponding to the dotted line were normalized to the data point just prior to the addition of D2O in the solid‐line data. d) The ratio of Ic before and 10 min after the addition of D2O versus the D2O concentration up to 4 % (v/v). The data are shown as the mean±standard error of the mean (n>3).
The observation that proton transport limits the rate of EET is in accordance with the acceleration of EET by OM Cyts c in the presence of riboflavin (RF) or flavin mononucleotide (FMN) molecules. These non‐covalently bound cofactors of semiquinone (Sq) in OM Cyts c 4c–4e have an unfavorable energy level for accepting electrons from heme redox centers. Because the bound Sq cofactor has a more negative redox potential than heme cofactors in OM Cyts c, the rate of electron transport should not be enhanced compared with the highly efficient electron transport circuit of hemes in the OM Cyts c complex. Therefore, it is likely that the association of flavins with OM Cyt c, that is, the formation of an OM flavocytochrome complex, enhances the rate of proton but not electron transport, thus resulting in an apparent enhancement in the rate of EET.
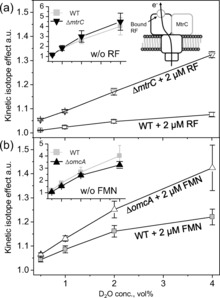
To directly test the hypothesis that flavin‐bound OM Cyts c operate with a rate‐limiting proton pathway, we compared the KIE for EET by the MR‐1 strain in the presence and absence of flavins because the extent of the KIE reflects the molecular characteristics of a rate‐limiting proton transfer pathway. In contrast to the effects of α‐AQS, in the presence of 2 μm FMN, the Ic was significantly reduced following the addition of D2O, but the KIE in the presence of FMN was largely reduced compared with that in the absence of FMN (Figure 2 c and d), thus indicating that the binding of FMN by OM Cyts c altered the rate‐limiting proton transport pathway. Since the reduction of the bound FMN (Ox/Sq) is coupled with protonation at physiological pH,11 the protonation of bound FMN might alter the proton‐transport kinetics associated with EET. Furthermore, we examined the mutant MR‐1 strains ΔmtrC and ΔomcA, which lack key multiheme protein components of the OM Cyt c complex, but while this complex still retains the capacity to bind RF and FMN, respectively, there is potentially an altered hydrogen‐bonding network structure. ΔmtrC and ΔomcA displayed a two‐fold greater reduction in the Ic upon the addition of D2O than did the WT cells in the presence of RF and FMN, respectively (Figure S2 and Figure 3), thus indicating that the proton‐transport pathway is significantly influenced by a lack of the multiheme protein components in the OM Cyt c complex. These results suggest that OM Cyts c with bound flavins function as primary proton‐transport pathways, limiting the rate of EET.
Figure 3.

Effect of mutation of the MtrC or OmcA multiheme protein (strains ΔmtrC and ΔomcA, respectively) on the KIE values. The KIE was estimated as the reciprocal of the ratio of Ic before and after the addition of D2O. The Ic was monitored before and after the addition of D2O at concentrations up to 4 % (v/v) in systems containing WT, ΔmtrC, or ΔomcA cells in the presence 2 μm riboflavin (RF; a) or flavin mononucleotide (FMN; b). The data are presented as the mean±standard error of the mean (n>3). The inset panels and figure show the KIE data obtained in the absence of flavins with the same range of D2O concentrations and a schematic illustration of EET by the RF‐bound OM Cyt c complex.
Although the KIE values clearly differed between the WT and ΔmtrC and ΔomcA strains in the presence of flavins, the KIE was nearly identical among the three strains in the absence of flavins (Figure 3, insets), thus indicating that the OM Cyt c complex without the bound flavin cofactor mediates only electron transport and not rate‐limiting proton transport.
Because the OM Cyt c complex without the flavin cofactor is inactive for proton transport, the large KIE in the absence of flavin may be assignable to other proteins that couple proton transport with EET to maintain charge neutrality in the periplasm. Although the OM of Gram‐negative bacteria is considered to be permeable to ions, the same number of cations and electrons must be removed from the periplasm to prevent charge accumulation once the rate of electron transport exceeds that of proton diffusion across the OM. Therefore, a significant KIE on EET by the OM Cyt c complex may indicate that the rate of proton removal from the periplasm limits the rate of EET. This idea is in accordance with previous experiments that compared the rate of EET in whole‐cell systems with that of purified OM Cyt c complexes.12 The in vivo EET rate per OM Cyt c complex is at least 10‐fold lower (102–103 electrons s−1) than that in a purified system.13 Given that the electron‐transport rate in a purified system is nearly equal to the theoretical value estimated from the interheme distance in the crystal structure of MtrF14 and based on an interheme electron‐hopping model15 (ca. 104 electrons s−1), the lower EET rate that was observed in vivo for the MR‐1 strain may be attributable to the slower removal of protons from the periplasm.
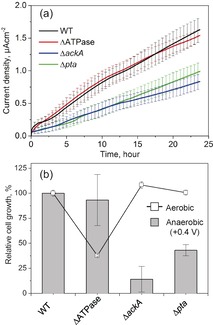
Although EET is considered to be coupled to the generation of PMF, the removal of protons from the periplasm during EET may hamper PMF accumulation and, therefore, the energy‐conservation mechanism, aside from chemiosmotic ATP formation. To test such a possibility, we examined the growth and Ic coupled with lactate oxidation in the WT strain and a mutant strain of S. oneidensis MR‐1 that lacks a sole F‐type ATP synthase (ATPase). Nearly identical Ic values were obtained for the WT and ΔATPase strains at +0.4 V (Figure 4 a), thus suggesting that proton uptake by ATPase is not involved in the kinetics of EET. Protein quantification assays performed before and after the Ic measurements indicated that the significant anaerobic growth of the ΔATPase strain was nearly identical to that of the WT strain (Figure 4 b and Table S1), whereas the aerobic growth rate of MR‐1 was greatly reduced by the lack of ATPase. These results suggest that the EET process is not associated with the formation of PMF under our experimental conditions.
Figure 4.

a) Current production (Ic) from lactate oxidation in wild‐type (WT) and mutant strains of S. oneidensis MR‐1 lacking F‐type ATP synthase (ΔATPase), acetate kinase (ΔackA), or phosphotransacetylase (Δpta) measured at +0.4 V versus SHE in the presence of 10 mm lactate. b) The cell growth on the electrode was estimated by the difference in protein content before and 24 h after the electrode inoculation. The Ic and growth data are presented as the mean±standard error of the mean (n=5 and >2, respectively).
We further confirmed that EET decouples chemiosmotic ATP synthesis by ATPase and instead promotes substrate‐level ATP synthesis as an alternative path to ATP formation, which has been previously suggested for the anaerobic reduction of fumarate located in the periplasm of MR‐1.16 Under the present current‐producing conditions, we monitored the growth of MR‐1 and mutant strains lacking either the acetate kinase (ackA) or phosphotransacetylase (pta) genes, which are required for acetate production and substrate‐level ATP production, respectively. Both the ΔackA and Δpta mutants exhibited significantly lower Ic and growth rate than those of the WT strain, thus suggesting slower growth or the suppression of NADH or formate production from lactate oxidation (Figure 4). In addition, because the concentration of formate had no impact on either the Ic or cell growth of the WT strain (Figure S3), EET appeared to enhance the regeneration of NAD+ to oxidize lactate and sustain substrate‐level ATP production. These findings indicate that the role of protons is not to generate a PMF but rather to regulate the flow of respiratory electrons, thus supporting the hypothesis that the removal of protons from the periplasm limits the rate of EET.
Given that F‐ATPase was not functional and did not participate in the EET kinetics, rate‐limiting proton transport in the absence of flavin could be either to the cytoplasm or to the extracellular environment across the OM through certain proton channels. However, the large KIE observed in the absence of flavins is distinct from that of active and passive transporters.17 These results imply the presence of unexplored proton‐exporting proteins with a large KIE (Figure S4 a). Alternatively, the importance of charge neutrality in the periplasm for rapid EET kinetics also suggests that the flavin‐bound OM Cyt c complex exports protons to the cell exterior across the OM (Figure S4 b). This possibility should be further explored in a proteoliposomal system12 or by a quantum chemical approach14 once the crystal structure of flavin‐bound OM Cyt c is obtained. If true, the EET process may represent a novel form of respiratory metabolism, in which rapid electron outflow associated with proton export across the OM sustains the regeneration of NAD+ to promote substrate‐level phosphorylation, unlike fermentation processes, which expel protons in the form of hydrogen or reduced organic species for ATP formation.
In conclusion, we investigated the solvent KIE of deuterium in whole‐cell electrochemical assays and demonstrated that proton transport in flavin‐bound OM Cyts c limits the rate of EET in S. oneidensis MR‐1. Given that the removal of a flavin cofactor or key components of the OM flavocytochrome complex significantly altered the KIE, the mechanism for the rate enhancement by the binding of flavin to the OM Cyt c complex is likely due to a change in the proton‐transport pathway. We anticipate that this novel proton‐coupling property will expand the available strategies to control the kinetics of EET in iron‐reducing bacteria and make the OM Cyt c complex a model system for studying biological proton‐coupled electron‐transfer reactions in vivo.18 Additionally, considering that EET is observed in other microbial strains and consortia, the idea of cation transport and charge balancing may have major implications for microbial respiration in anaerobic iron corrosion19 and methane‐oxidation processes.20 The bioredox chemistry underlying bacterial energy management using protons appears to be more flexible than previously thought.
Conflict of interest
The authors declare no conflict of interest.
Supporting information
As a service to our authors and readers, this journal provides supporting information supplied by the authors. Such materials are peer reviewed and may be re‐organized for online delivery, but are not copy‐edited or typeset. Technical support issues arising from supporting information (other than missing files) should be addressed to the authors.
Supplementary
Acknowledgements
We thank Prof. Kenneth H. Nealson, Prof. Kohei Uosaki, and Prof. Hiroyuki Noji for their advices, and Prof. Jeffery A. Gralnick at the University of Minnesota for providing the ΔATPase, ΔackA, and Δpta mutants. This work was financially supported by the Japan Society for Promotion of Science (JSPS) KAKENHI Grant Number 24000010 to K.H. and 17H04969 to A.O., and the US Office of Naval Research Global (N62909‐17‐1‐2038) to A.O.
A. Okamoto, Y. Tokunou, S. Kalathil, K. Hashimoto, Angew. Chem. Int. Ed. 2017, 56, 9082.
References
- 1. Nealson K. H., Saffarini D., Annu. Rev. Microbiol. 1994, 48, 311–343. [DOI] [PubMed] [Google Scholar]
- 2. Hartshorne R. S., Reardon C. L., Ross D., Nuester J., Clarke T. A., Gates A. J., Mills P. C., Fredrickson J. K., Zachara J. M., Shi L., Beliaev A. S., Marshall M. J., Tien M., Brantley S., Butt J. N., Richardson D. J., Proc. Natl. Acad. Sci. USA 2009, 106, 22169–22174. [DOI] [PMC free article] [PubMed] [Google Scholar]
- 3. Xiong Y. J., Shi L., Chen B. W., Mayer M. U., Lower B. H., Londer Y., Bose S., Hochella M. F., Fredrickson J. K., Squier T. C., J. Am. Chem. Soc. 2006, 128, 13978–13979. [DOI] [PubMed] [Google Scholar]
- 4.
- 4a. von Canstein H., Ogawa J., Shimizu S., Lloyd J. R., Appl. Environ. Microbiol. 2008, 74, 615–623; [DOI] [PMC free article] [PubMed] [Google Scholar]
- 4b. Marsili E., Baron D. B., Shikhare I. D., Coursolle D., Gralnick J. A., Bond D. R., Proc. Natl. Acad. Sci. USA 2008, 105, 3968–3973; [DOI] [PMC free article] [PubMed] [Google Scholar]
- 4c. Okamoto A., Hashimoto K., Nealson K. H., Nakamura R., Proc. Natl. Acad. Sci. USA 2013, 110, 7856–7861; [DOI] [PMC free article] [PubMed] [Google Scholar]
- 4d. Okamoto A., Kalathil S., Deng X., Hashimoto K., Nakamura R., Nealson K. H., Sci. Rep. 2014, 4, 5628; [DOI] [PMC free article] [PubMed] [Google Scholar]
- 4e. Edwards M. J., White G. F., Norman M., Tome-Fernandez A., Ainsworth E., Shi L., Fredrickson J. K., Zachara J. M., Butt J. N., Richardson D. J., Clarke T. A., Sci. Rep. 2015, 5, 11677; [DOI] [PMC free article] [PubMed] [Google Scholar]
- 4f. Hong G. Y., Pachter R., J. Phys. Chem. B 2016, 120, 5617–5624. [DOI] [PubMed] [Google Scholar]
- 5.
- 5a. Clarke T. A., Edwards M. J., Gates A. J., Hall A., White G. F., Bradley J., Reardon C. L., Shi L., Beliaev A. S., Marshall M. J., Wang Z. M., Watmough N. J., Fredrickson J. K., Zachara J. M., Butt J. N., Richardson D. J., Proc. Natl. Acad. Sci. USA 2011, 108, 9384–9389; [DOI] [PMC free article] [PubMed] [Google Scholar]
- 5b. Breuer M., Zarzycki P., Blumberger J., Rosso K. M., J. Am. Chem. Soc. 2012, 134, 9868–9871. [DOI] [PubMed] [Google Scholar]
- 6. Schröder U., Nießsen J., Scholz F., Angew. Chem. Int. Ed. 2003, 42, 2880–2883; [DOI] [PubMed] [Google Scholar]; Angew. Chem. 2003, 115, 2986–2989. [Google Scholar]
- 7. Rabaey K., Rozendal R. A., Nat. Rev. Microbiol. 2010, 8, 706–716. [DOI] [PubMed] [Google Scholar]
- 8.
- 8a. Myers C. R., Nealson K. H., J. Bacteriol. 1990, 172, 6232–6238; [DOI] [PMC free article] [PubMed] [Google Scholar]
- 8b. Tokunou Y., Hashimoto K., Okamoto A., Bull. Chem. Soc. Jpn. 2015, 88, 690–692. [Google Scholar]
- 9. Junki Saito K. H., Okmaoto A., Electrochim. Acta 2016, 216, 261–265. [Google Scholar]
- 10. Guo J. B., Lian J., Xu Z. F., Xi Z. H., Yang J. L., Jefferson W., Liu C., Li Z. X., Yue L., Bioresour. Technol. 2012, 123, 713–716. [DOI] [PubMed] [Google Scholar]
- 11. Draper R. D., Ingraham L. L., Arch. Biochem. Biophys. 1968, 125, 802–808. [DOI] [PubMed] [Google Scholar]
- 12. White G. F., Shi Z., Shi L., Wang Z., Dohnalkova A. C., Marshall M. J., Fredrickson J. K., Zachara J. M., Butt J. N., Richardson D. J., Clarke T. A., Proc. Natl. Acad. Sci. USA 2013, 110, 6346–6351. [DOI] [PMC free article] [PubMed] [Google Scholar]
- 13.
- 13a. Okamoto A., Tokunou Y., Saito J., Biophys. Physicobiol. 2016, 13, 71–76; [DOI] [PMC free article] [PubMed] [Google Scholar]
- 13b. Liu H. A., Newton G. J., Nakamura R., Hashimoto K., Nakanishi S., Angew. Chem. Int. Ed. 2010, 49, 6596–6599; [DOI] [PubMed] [Google Scholar]; Angew. Chem. 2010, 122, 6746–6749; [Google Scholar]
- 13c. Okamoto A., Nakamura R., Hashimoto K., Electrochim. Acta 2011, 56, 5526–5531; [Google Scholar]
- 13d. Lower B. H., Shi L., Yongsunthon R., Droubay T. C., McCready D. E., Lower S. K., J. Bacteriol. 2007, 189, 4944–4952. [DOI] [PMC free article] [PubMed] [Google Scholar]
- 14. Breuer M., Rosso K. M., Blumberger J., Proc. Natl. Acad. Sci. USA 2014, 111, 611–616. [DOI] [PMC free article] [PubMed] [Google Scholar]
- 15. Polizzi N. F., Skourtis S. S., Beratan D. N., Faraday Discuss. 2012, 155, 43–62. [DOI] [PMC free article] [PubMed] [Google Scholar]
- 16. Hunt K. A., Flynn J. M., Naranjo B., Shikhare I. D., Gralnick J. A., J. Bacteriol. 2010, 192, 3345–3351. [DOI] [PMC free article] [PubMed] [Google Scholar]
- 17.
- 17a. Althoff G., Lill H., Junge W., J. Membr. Biol. 1989, 108, 263–271; [Google Scholar]
- 17b. Nikaido H., Microbiol. Mol. Biol. Rev. 2003, 67, 593–656; [DOI] [PMC free article] [PubMed] [Google Scholar]
- 17c. Hirakura Y., Sugiyama T., Takeda M., Ikeda M., Yoshioka T., Biochim. Biophys. Acta Gen. Subj. 2011, 1810, 218–225; [DOI] [PubMed] [Google Scholar]
- 17d. Elsing C., Hirlinger A., Renner E. L., Lauterburg B. H., Meier P. J., Reichen J., Biochem. J. 1995, 307, 175–181; [DOI] [PMC free article] [PubMed] [Google Scholar]
- 17e. Vasdev S., Gupta I. P., Sampson C. A., Longerich L., Parai S., Can. J. Cardiol. 1993, 9, 802–808; [PubMed] [Google Scholar]
- 17f. Vasdev S., Prabhakaran V. M., Whelan M., Ford C. A., Longerich L., Parai S., Artery 1994, 21, 124–147. [PubMed] [Google Scholar]
- 18. Huynh M. H. V., Meyer T. J., Chem. Rev. 2007, 107, 5004–5064. [DOI] [PMC free article] [PubMed] [Google Scholar]
- 19. Dinh H. T., Kuever J., Mussmann M., Hassel A. W., Stratmann M., Widdel F., Nature 2004, 427, 829–832. [DOI] [PubMed] [Google Scholar]
- 20. Stams A. J. M., Plugge C. M., Nat. Rev. Microbiol. 2009, 7, 568–577. [DOI] [PubMed] [Google Scholar]
Associated Data
This section collects any data citations, data availability statements, or supplementary materials included in this article.
Supplementary Materials
As a service to our authors and readers, this journal provides supporting information supplied by the authors. Such materials are peer reviewed and may be re‐organized for online delivery, but are not copy‐edited or typeset. Technical support issues arising from supporting information (other than missing files) should be addressed to the authors.
Supplementary


