

Abstract
Diabetic nephropathy (DN) is a major cause of end-stage renal disease, and therapeutic options for preventing its progression are limited. To identify novel therapeutic strategies, we studied protective factors for DN using proteomics on glomeruli from individuals with extreme duration of diabetes (≥50 years) without DN and those with histologic signs of DN. Enzymes in the glycolytic, sorbitol, methylglyoxal and mitochondrial pathways were elevated in individuals without DN. In particular, pyruvate kinase M2 (PKM2) expression and activity were upregulated. Mechanistically, we showed that hyperglycemia and diabetes decreased PKM2 tetramer formation and activity by sulfenylation in mouse glomeruli and cultured podocytes. Pkm-knockdown immortalized mouse podocytes had higher levels of toxic glucose metabolites, mitochondrial dysfunction and apoptosis. Podocyte-specific Pkm2-knockout (KO) mice with diabetes developed worse albuminuria and glomerular pathology. Conversely, we found that pharmacological activation of PKM2 by a small-molecule PKM2 activator, TEPP-46, reversed hyperglycemia-induced elevation in toxic glucose metabolites and mitochondrial dysfunction, partially by increasing glycolytic flux and PGC-1a mRNA in cultured podocytes. In intervention studies using DBA2/J and Nos3 (eNos) KO mouse models of diabetes, TEPP-46 treatment reversed metabolic abnormalities, mitochondrial dysfunction and kidney pathology. Thus, PKM2 activation may protect against DN by increasing glucose metabolic flux, inhibiting the production of toxic glucose metabolites and inducing mitochondrial biogenesis to restore mitochondrial function.
DN is the leading cause of end-stage renal disease1–3. Hyperglycemia is known to play a crucial part in the pathogenesis of DN. High glucose levels induce metabolic abnormalities in several glucose metabolic pathways and induce mitochondrial dysfunction, with subsequent overproduction of reactive oxygen species (ROS). These may in turn contribute to the development of the various microvascular pathologies observed in diabetes4,5. Elevated intracellular glucose leads to accumulation of the toxic glucose metabolites sorbitol, methylglyoxal (MG) and diacylglycerol (DAG), which have been proposed to contribute to DN development6–9. Furthermore, it has been proposed that mitochondrial dysfunction and ROS production induced by hyperglycemia may be irreversible owing to the persistence of epigenetic reprogramming (namely, metabolic memory)10,11.
Hyperglycemia and its toxic end products can lead to marked glomerular abnormalities, a key component of DN. Podocytes, an important component of the glomerular filtration barrier, can become abnormal after chronic exposure to hyperglycemia. The loss of podocytes is one of the earliest glomerular morphologic changes and has important roles in DN progression10,12,13.
In the hyperglycemic state, increased glycolytic flux has been postulated to induce mitochondrial dysfunction, increase flux through the polyol pathway and enhance synthesis of DAG and MG, which subsequently causes a variety of transcriptional and translational changes that lead to microvascular pathology, including DN. However, it is unclear whether increased flux through the tricarboxylic acid (TCA) cycle and the sorbitol, MG and DAG pathways are responsible for hyperglycemia-induced vascular pathology. Neither pharmacological agents that inhibit these pathways nor antioxidants have shown clinical success against DN or diabetic retinopathy (DR)14–17.
Recent efforts to understand the pathogenesis of diabetic vascular complications have shifted from the identification of risk factors to uncovering endogenous protective factors that might neutralize the adverse effects of hyperglycemia that cause DN or DR. The impetus for the identification of protective factors has been derived from characterization of clinical cohorts that seem to be protected from the development of DN or DR, even with chronic exposure to hyperglycemia. One such study is the Joslin Medalist Study, a longitudinal study of more than 1,000 individuals with type 1 diabetes (T1DM) for more than 50 years, referred to as Medalists. Only 12% of these patients have substantial DN18,19. In the Joslin Medalist Study, neither the presence of DN nor proliferative DR was correlated with glycemic control, which implies that endogenous protective factors may exist to protect individuals from the consequences of chronic hyperglycemia18,19. Thus, the Medalists represent a survival cohort, enriched for individuals who are protected from the development of DN. Indeed, protected individuals within this cohort display only mild renal pathology, despite >50 years of having diabetes. To uncover the mechanism mediating the protection observed in Medalists, we undertook an unbiased approach through proteomic analysis of postmortem glomeruli isolated from the kidneys of Medalists with and without DN. We identified a proteomic signature suggesting that enhanced glycolytic flux might protect glomeruli from the toxic effects of hyperglycemia. The present study tested this hypothesis by increasing glycolytic flux through the use of PKM2 activation in podocytes, and in two interventional rodent models of diabetes.
RESULTS
Elevation of glucose metabolic enzymes in glomeruli from individuals with diabetes but no DN
Proteomics analysis was performed on glomeruli isolated from Medalists by comparing the protected group (no or mild DN; DN class 0–I) to the nonprotected group (severe DN; DN class IIb–III). The renal pathology of each DN class was well correlated with estimated glomerular filtration rate (eGFR) (Supplementary Fig. 1a). Hemoglobin A1c (HbA1c) was not different between the two groups, in keeping with our previous findings in the Medalist cohort18,19 (Supplementary Tables 1 and 2). Our interrogation of the 88 proteins that were significantly upregulated in the protected group (fold change ≥1.5 cutoff; P ≤ 0.05; Supplementary Tables 3 and 4) by gene-ontology analysis indicated that 7 out of the 12 top-ranked enriched pathways were related to glucose metabolism and glycolysis (Fig. 1a and Supplementary Table 5).
Figure 1.
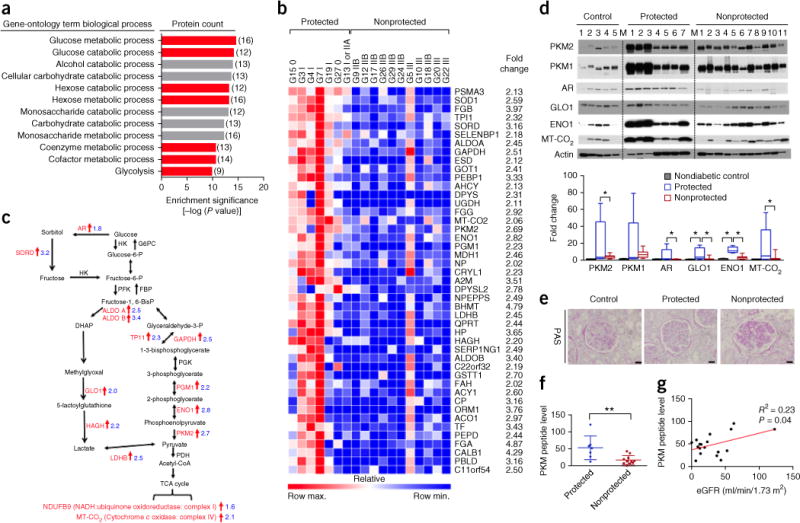
Elevation of glucose metabolic enzymes in glomeruli from individual with diabetes, but without DN. (a) Enrichment pathways from proteomics analysis on glomeruli from protected (n = 7) and nonprotected (n = 11) groups, using gene-ontology annotations and modified Fisher’s exact test. The numbers in parentheses indicate the number of proteins in each gene-ontology term biological process. (b) Heat map of top 45 proteins in the glomeruli from protected (n = 7) and nonprotected (n = 11) Medalists. Peptide levels from proteomics analysis. P < 0.05 and fold change ≥2 cutoff in order of P value, analyzed by Mann–Whitney U test. (c) Schema illustrating the significant alterations of glucose-metabolism and glycolysis pathway proteins from protected (n = 7) and nonprotected (n = 11) individuals. AR, aldose reductase; HK, hexokinase; G6PC, glucose-6-phosphatase, catalytic subunit; GPI, glucose phosphate isomerase; SORD, sorbitol dehydrogenase; PFK, phosphofructokinase; FBP, fructose-1,6-diphosphatase; aldo A/B, aldolase A and B; DAG, diglyceride; GAPDH, glyceraldehyde 3-phosphate dehydrogenase; TPI1, triosephosphate isomerase 1; PGK, phosphoglycerate kinase; PGM1, phosphoglucomutase-1; ENO1, enolase 1; PKM, pyruvate kinase isoenzyme type M2; PDH, pyruvate dehydrogenase; LDHB, lactate dehydrogenase; HAGH, hydroxyacyl glutathione hydrolase; GLO1, glyoxalase 1. PHGDH, 3-phosphoglycerate dehydrogenase. (d) Representative blot images from human glomeruli. All proteins were normalized to actin. Nondiabetic controls, n = 5; protected, n = 7; nonprotected, n = 11. M, molecular-weight marker lane. Box plots, center lines represent the median; limits represent quartiles; whiskers represent minimum and maximum values. Comparisons among groups were conducted using analysis of variance (ANOVA). When overall F tests were significant (P < 0.05), post hoc comparisons using Tukey’s method of adjustment were conducted to determine the location of any significant pairwise differences. *P < 0.05. (e) Representative periodic acid Schiff (PAS) images (mean number of glomeruli evaluated = 226; range = 105–421) of kidney samples from aged-matched controls without diabetes (n = 5) and protected (n = 7) and nonprotected (n = 11) individuals. Scale bars, 32 μm. (f) PKM peptide levels from glomeruli of protected (n = 7) and nonprotected (n = 11) individuals by proteomic analysis. All values are means ± s.d. and analyzed by unpaired Student’s t-test. **P < 0.01. (g) Pearson correlation; protected, n = 7; nonprotected, n = 11.
Two distinct differential landscapes were observed in the heat map. Protected individuals exhibited higher levels of proteins related to glucose metabolism and antioxidation than nonprotected individuals (Fig. 1b). Analysis of the upregulated glucose metabolism proteins showed 14 enzymes involved in the processing of free intracellular glucose, including 12 involved in glycolysis and 2 in the TCA cycle. In particular, enzymes from the polyol (AR, aldose reductase; SORD, sorbitol dehydrogenase) and MG (GLO1, glyoxalase 1; hydroxyacyl glutathione hydrolase, HAGH) pathways were upregulated in the protected group (all P < 0.05; Fig. 1c). Although the glyoxalase system protects cells by eliminating MG, a toxic side product of glycolysis, activation of the sorbitol pathway is surprising because it has been postulated to cause many vascular complications of diabetes, including DN8,15. Taken together, these data show that upregulation of proteins related to glucose metabolism in glomeruli is associated with protection against DN.
The functional effects of the upregulation of these pathways were further elucidated by plasma metabolomic analysis of kidney donors and a living group of Medalists. These two groups share similar characteristics, but exhibit a significant difference in HbA1c (P < 0.0001; Supplementary Table 6). Multiple metabolites in the glycolytic, sorbitol and MG detoxification pathways were lower in plasma from the protected group than in that from the nonprotected group, despite the difference in HbA1c of 8.8% relative to 6.5%, respectively (Supplementary Fig. 1b and Supplementary Table 7). The observed reduction in glucose metabolic intermediates in the protected individuals is consistent with an increased ability to process these potentially harmful metabolites.
The schema in Figure 1c illustrates the upregulated proteins in the glucose metabolism and mitochondrial pathways of the protected kidneys as compared to the nonprotected ones. The elevation of the enzymes involved in sorbitol (AR), glycolysis (PKM1, PKM2; ENO1, enolase 1), MG (GLO1) and mitochondrial (MT-CO2, mitochondrial-encoded cytochrome C oxidase II) pathways were confirmed by immunoblot analysis (Fig. 1d). The protein levels of these enzymes were higher in the protected group than in the nonprotected group or in age-matched, nondiabetic controls without nephropathy. The assessment of renal pathology was classified according to the Renal Pathology Society’s “Pathologic Classification of Diabetic Nephropathy,” on the basis of glomerular pathology20 (Fig. 1e and Supplementary Table 8). Among the proteins upregulated in the protected glomeruli, PKM2 was of particular interest because its peptide level was upregulated by 2.7-fold and it is a well-studied enzyme that can be modulated by pharmacological and genetic approaches (P < 0.05; Fig. 1d,f). Moreover, we observed a correlation of PKM peptide level with eGFR, but not with HbA1c or albumin/creatinine ratio (ACR) (Fig. 1g and Supplementary Fig. 1c,d) or association with PKM2 genetic polymorphisms (data not shown). We further performed immunofluorescence staining of PKM2 and the podocyte marker WT-1, endothelial cell marker CD31 and mesangial cell marker α-smooth-muscle actin (α-SMA). We did not observe any substantial change in the number of PKM2+ and CD31+ cells or PKM2+ and α-SMA+ cells in the glomeruli when comparing protected and nonprotected kidneys (Supplementary Fig. 2). By contrast, there were substantially more PKM2+ and WT-1+ cells in the glomeruli of protected Medalists than in those of the nonprotected group (Supplementary Fig. 2b). Moreover, preliminary studies on the PKM2 protein levels in the glomeruli of individuals with shorter duration of T1DM and type 2 diabetes (T2DM) indicate a trend toward higher PKM2 levels, by 2.6-fold, in those with no or mild DN as compared to those with DN, but they did not achieve statistical significance (Supplementary Fig. 3 and Supplementary Table 9).
Regulation of PKM2 activity by high glucose and diabetes
In addition to changes in PKM2 protein levels, pyruvate kinase (PK) activity was also determined in glomeruli. Consistent with the higher PKM2 expression, PK activity was elevated in the protected group relative to the nonprotected group (P < 0.05; Fig. 2a). Furthermore, PK activity was 50% lower in glomeruli from STZ-induced diabetic DBA2/J mice (Fig. 2b). This is further supported by lower PK activity observed in mouse and human podocytes exposed to high glucose (Fig. 2c and Supplementary Fig. 4a). By contrast, PK activity in mesangial or endothelial cells was not affected by high glucose (Supplementary Fig. 4b,c).
Figure 2.
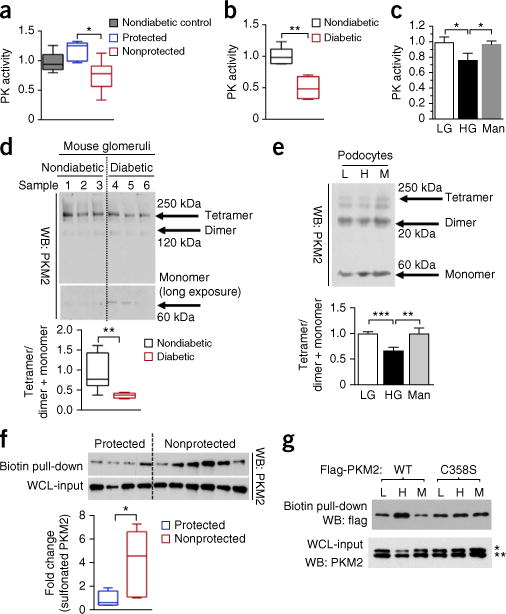
Regulation of PKM2 activity by high glucose and diabetes. (a) PK activity in glomeruli from age-matched controls without diabetes (n = 5) and protected (n = 6) and nonprotected (n = 10) individuals. (b) PK activity in glomeruli from nondiabetic mice (n = 5) and diabetic DBA/2J mice (n = 4) at 2 months post-STZ. (c) PK activity in podocytes treated with LG (5-mM D-glucose), HG (25-mM D-glucose) and Man (20-mM mannitol + 5-mM D-glucose) for 24 h. n = 4 independent experiments. (d) Representative blot image (n = 2 western blots with n = 7 mice per group) of cross-linked glomeruli from nondiabetic and diabetic DBA2/J mice at 2 months post-STZ. (e) Representative blot image (n = 3 western blots) from cross-linked podocytes at 24 h. Independent cross-linked experiments LG and HG (n = 9), and Man (n = 3). (f) Sulfenylated and oxidized PKM2 in human kidney cortex, normalized to PKM2 from whole-cell-lysate input. Protected (n = 4); nonprotected (n = 6). (g) Podocytes expressing Flag-PKM2 or Flag-PKM2(C358S) were treated with LG (5.5-mM D-glucose), HG (25-mM D-glucose) and Man (20-mM D-mannitol) for 24 h. Sulfenylated and oxidized PKM2 were probed with Flag antibody. WT, wild-type PKM2. Representative blot image (n = 4 western blots). * and ** refer to lower panel of western blot (PKM2). * refers to upper band of PKM2 (Flag-PKM2); ** refers to lower band of PKM2 (endogenous PKM2). For box plots (a,b,d,f), center lines represent the median; limits represent quartiles; whiskers represent minimum and maximum values. For other bar graphs (c,e), all values are means ± s.e.m. For two-group comparisons (b,d,f), data were analyzed by unpaired Student’s t-test. Comparison of more than two groups was analyzed using ANOVA. When overall F tests were significant (P < 0.05), post hoc comparisons using Tukey’s method of adjustment were conducted to determine the location of any significant pairwise differences. **P < 0.005; *P < 0.05.
The mechanism of lower PK activity in podocytes exposed to high glucose could be a shift in the distribution of PKM2 from tetramers to dimers and monomers, which are known to be less active than PKM2 tetramers21–24. To assess the status of PKM2 subunit association, cross-linking studies were performed. In agreement with the observed reduction in PK activity, the levels of PKM2 tetramer were lower in glomeruli from mice with diabetes (Fig. 2d) and podocytes exposed to high glucose (Fig. 2e). However, we did not observe any change in protein levels of PKM2 or PKM1 in glomeruli from mice with diabetes or mouse podocytes exposed to high glucose (Supplementary Fig. 4d,e). In addition, pyruvate kinase isozyme liver (PKL) enzyme, which is expressed at a lower level in podocytes, as compared to other PKM isoforms, was also studied. However, we did not observe any change in PKL protein when exposed to high glucose (Supplementary Fig. 4f).
Prior study has suggested that the oxidation of PKM2 at Cys358 can inhibit its tetramerization, thus reducing its activity21. To evaluate the mechanism of high-glucose-induced impairment in PKM2 activity, the levels of oxidized PKM2 were measured. We observed lower levels of sulfenylated and oxidized PKM2 in kidney cortex from the protected group than in the nonprotected group (Fig. 2f). These data are further supported by elevated PKM2 oxidation in cultured mouse podocytes exposed to high glucose (Fig. 2g). To confirm whether PKM2 was specifically oxidized at Cys358, we replaced cysteine residue with serine (Ser358) and observed a reduction in sulfenylated PKM2 in podocytes exposed to high glucose (Fig. 2g). These data collectively suggested that high-glucose-induced oxidative stress may act to reduce PKM2 activity.
The effect of Pkm2 deletion in podocytes on diabetes-induced glomerular abnormalities
Several lines of evidences suggest that PKC-δ activation is implicated in cell survival and apoptosis in many cell types25–27. Further, PKC-δ induced by high glucose has been shown to induce podocyte apoptosis25,27. Thus, we measured MG and PKC-δ activation in Pkm-knockdown podocytes. Both pathways were increased in Pkm-knockdown cells treated with either low or high glucose (P < 0.005; Fig. 3a,b). Notably, Ppargc1a (also known as Pgc1α) mRNA, mitochondrial membrane potential (MMP) and mitochondrial mass were all significantly lower in Pkm-knockdown cells (Fig. 3c). Furthermore, podocyte apoptosis was significantly increased in Pkm-knockdown cells treated with either low or high glucose as compared to scramble-shRNA control (shCntrl) cells in low glucose (Fig. 3d).
Figure 3.
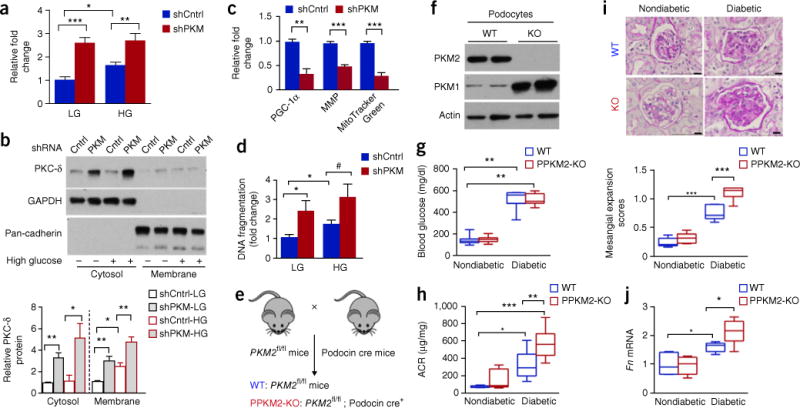
Pkm2 deletion in podocytes accelerates DN progression. (a) Methylglyoxal in control (shCntrl) and Pkm-knockdown (shPKM) podocytes treated with LG and HG for 72 h. Independent MG analysis shCntrl-LG, n = 11; shPKM-LG, n = 5; shCntrl-HG, n = 9; shPKM-HG n = 5. (b) PKC-δ from culture conditions, as described in a. Representative blot images from n = 4 independent experiments. (c) Ppargc1a mRNA, MMP and MitoTracker Green. Independent experiments n = 4. (d) DNA fragmentation in podocytes at 72 h. n = 7 independent experiments. (e) Schema illustrating generation of podocyte-specific Pkm2-KO mice. (f) Representative blot images (n = 2 western blots with n = 4 mice per group) of PKM2 and PKM1 protein in podocytes isolated from WT and PPKM2-KO mice. (g) Fasting blood glucose 6 months post-STZ. Nondiabetic WT mice (n = 14); PPKM2-KO mice (n = 11); diabetic WT mice (n = 10); diabetic PPKM2-KO mice (n = 16). (h) ACR 3 months post-STZ. Nondiabetic WT mice (n = 5); nondiabetic PPKM2-KO mice (n = 6); diabetic WT mice (n = 8); diabetic PPKM2-KO mice (n = 8). (i) Mesangial expansion 6 months post-STZ. Representative n = 20–43 images of PAS-stained kidney sections for each mouse. Nondiabetic WT mice (n = 7); nondiabetic PPKM2-KO mice (n = 5); diabetic WT mice (n = 6); diabetic PPKM2-KO mice (n = 7). Scale bars, 10 μm. (j) Glomerular fibronectin (Fn) mRNA 6 months post-STZ. Non-diabetic WT mice (n = 7); nondiabetic PPKM2-KO mice (n = 6); diabetic WT mice (n = 5); diabetic PPKM2-KO mice (n = 6). For box plots (g,h,i,j), center lines represent the median; limits represent quartiles; whiskers represent minimum and maximum values. All values are means ± s.e.m. in bar graphs. All data throughout this figure are analyzed using ANOVA. When overall F tests were significant (P < 0.05), post hoc comparisons using Tukey’s method of adjustment were conducted to determine the location of any significant pairwise differences. ***P < 0.001; **P < 0.005; *P < 0.05. #P = 0.068.
To confirm our in vitro findings, we bred a previously described Pkm2 conditional allele (Pkm2fl/fl)28 with podocin-Cre mice to generate podocyte-specific Pkm2-KO mice (PPKM2-KO) (Fig. 3e). Protein levels of PKM2 were significantly lower, with a compensatory greater level of PKM1, in podocytes isolated from PPKM2-KO mice as compared to wild-type (WT) mice (Fig. 3f); thus, PK activity in the mutant mice were normalized to WT level (Supplementary Fig. 5), in keeping with previous characterization of Pkm2-KO mice28. PPKM2-KO mice did not differ in fasting blood-glucose levels, body weight, kidney weight or blood pressure when compared to littermate WT mice in either diabetic or nondiabetic conditions (Fig. 3g and Supplementary Table 10). In keeping with a protective role for PKM2, PPKM2-KO mice with diabetes developed significantly higher levels of albuminuria as compared to WT mice with diabetes (Fig. 3h). Histological analysis showed greater mesangial expansion and fibronectin (Fn1, also known as Fn) expression in PPKM2-KO mice with diabetes than in WT mice with diabetes (Fig. 3i,j). In summary, Pkm2 deletion in podocytes accelerated mitochondrial dysfunction, podocyte apoptosis and glomerular pathology induced by diabetes.
We further determined the differential effects of PKM1 and PKM2, given that the compensation of PKM1 protein or PK activity could not confer protection from DN in PPKM2-KO mice with diabetes, which could be due to differential actions of PKM1 and PKM2 on the mitochondria. To delineate the mechanisms, we re-expressed PKM1 or PKM2 in podocytes with both Pkm1 and Pkm2 knockdown (PKM kd/M1 or PKM kd/M2) (Supplementary Fig. 6a–d). In PKM kd/M2 podocytes, PKM2 was re-expressed to levels similar to those in shCntrl podocytes and normalized mitochondrial mass. By contrast, in PKM kd/M1 podocytes, PKM1 was overexpressed by 40-fold relative to shCntrl podocytes, but resulted in only a modest trend to a higher level in mitochondrial mass, suggesting that PKM2 has a much more potent action than that of PKM1 with respect to the regulation of mitochondrial mass (Supplementary Fig. 6e). Similar findings were observed in MMP: re-expression of PKM2 greatly enhanced its actions, whereas PKM1 overexpression failed to return MMP to shCntrl level (Supplementary Fig. 6f). Given that PKM1 may have some effect on mitochondrial metabolism, as shown by its ability to modestly elevate mitochondrial mass and MMP when markedly overexpressed, we further compared the two PKM isoforms by overexpression of PKM1 at lower levels (Supplementary Fig. 7a–c). Notably, with a four-fold higher PKM1 expression level in ‘PKM1 OE low’ relative to WT podocytes, no changes were observed in mitochondrial mass or MMP when compared to empty-vector podocytes (Supplementary Fig. 7a–e). Furthermore, we compared the overexpression of PKM1 (PKM1 OE high; 12-fold higher PKM1 protein level relative to empty vector) to PKM2 (PKM2 OE; four-fold higher PKM2 protein level relative to empty vector) (Supplementary Fig. 7f–j), PKM2 overexpression has a substantially greater effect on mitochondrial mass and MMP as compared to WT podocytes or PKM1 OE high podocytes. These data suggest that PKM2 has a more potent and unique mitochondrial effect than PKM1, and this effect might not be the well-described pyruvate kinase glycolytic functions.
The effect of PKM2 activation on glycolysis, mitochondrial metabolism and apoptosis in podocytes
Multiple PKM2 activators, including TEPP-46 and those from Agios (PKM2 activator 1020) and Dynamix, (SCHEMBL2694519) increased PK activity in different types of kidney cells (podocytes and proximal tubule cell line, HK-2 cells) (Supplementary Fig. 8). TEPP-46 was selected for further study because it has been extensively characterized21,24.
We observed that high glucose significantly increased sorbitol, PKC-δ activation and MG levels, and that TEPP-46 or the Agios compound reduced these toxic glucose metabolites to low glucose (LG) levels (Fig. 4a–c). To further assess the effect of PKM2 activation on glucose kinetic entry into the podocytes, we measured changes in sorbitol using [U-13C6] glucose and DAG by [U-14C6] glucose. The labeling studies showed that TEPP-46 inhibited the effect of high-glucose-mediated increases in the levels of 13C-labeled sorbitol and 14C-labeled DAG levels in cultured podocytes (Fig. 4d,e). Because the activation of PKM2 seemed to increase glycolysis and mitochondrial biogenesis, the effect of TEPP-46 on glycolytic and mitochondrial flux in podocytes was determined. Prolonged incubation of podocytes with high glucose decreased glycolytic flux (ECAR) and mitochondrial function (OCR). Notably, TEPP-46 reversed the high-glucose-induced impairments in glycolytic flux and basal and maximal mitochondrial respiration (Fig. 4f). These data were further confirmed by CO2 production, specifically from the TCA cycle, using [6-14C] glucose (Fig. 4g) and by an increase in adenosine triphosphate (ATP) levels with the addition of TEPP-46 (Fig. 4h).
Figure 4.
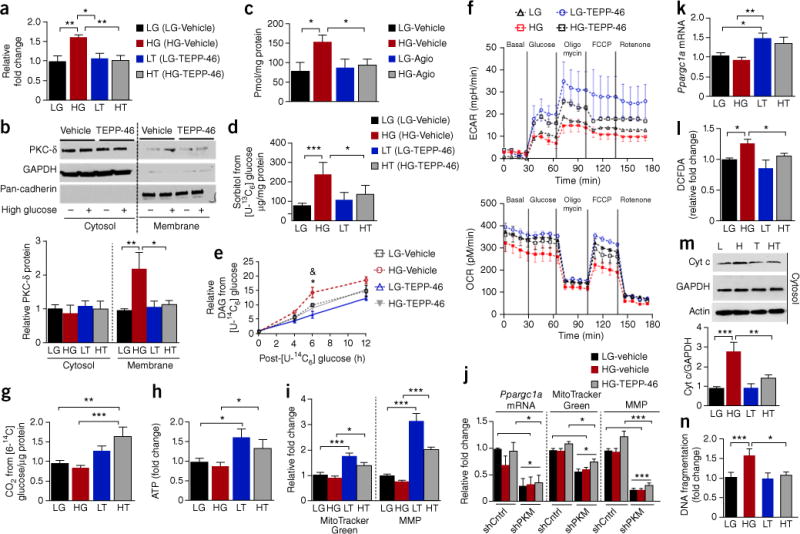
PKM2 activation normalizes abnormalities in glucose metabolism and mitochondrial function and prevents podocyte apoptosis induced by high glucose. Podocytes were treated with low-glucose vehicle (LG), high-glucose vehicle (HG), low glucose with 10-μM TEPP-46 (LT) or 10-μM Agio and high-glucose, 10-μM TEPP-46 (HT) or 10-μM Agio. (a) Sorbitol in podocytes treated for 72 h. n = 5 independent experiments. (b) PKC-δ membrane translocation in podocytes treated for 72 h. Representative blot images; n = 3 independent experiments. (c) Methylglyoxal in podocytes treated with LG-vehicle n = 4; HG-vehicle n = 4; LG-Agio n = 5; HG-Agio n = 6. (d) Sorbitol derived from D-[U-13C6] glucose over a period of 12 h; n = 4 independent experiments. (e) DAG derived from D-[U-14C6] glucose in podocytes treated for 72 h. Independent experiments n = 2 at 0 h, n = 5 at 4 h, n = 8 at 6 h, n = 3 at 12 h. *P < 0.05 versus LG-vehicle at 6 h; &P < 0.05 versus HG-vehicle at 6 h. (f) Podocytes were treated with LG or HG for 72 h before the addition of vehicle or 10-μM TEPP-46 for a further 24 h in the presence of LG or HG. Representative curve was shown (n = 4 replicates for each cell culture condition) and four independent experiments were performed. (g) CO2 derived from D-[6-14C] glucose over a period of 3 h in podocytes treated with LG-vehicle, n = 8; HG-vehicle, n = 7; LG-TEPP-46, n = 6; HG-TEPP-46, n = 5. (h) Podocytes were treated under the same conditions as described in f. ATP was presented as fold change. Four replicates for each cell culture condition are included in each experiment, and two independent experiments were performed. (i) MitoTracker Green, n = 6 independent experiments. MMP, LG-vehicle n = 6; HG-vehicle, n = 5; LG-TEPP-46, n = 3; HG-TEPP-46, n = 10. (j) Podocytes were treated for 8 h (Ppargc1a mRNA) and 4 d (MitoTracker Green and MMP). Independent experiments n = 4. (k) Podocytes were treated with LG or HG for 24 h before the addition of vehicle or 10-μM TEPP-46 for a further 24 h in the presence of LG or HG. Independent experiments n = 4; (l) ROS in podocytes treated for 24 h. LG-vehicle, n = 7; HG-vehicle, n = 7; LG-TEPP-46, n = 4; HG-TEPP-46, n = 6. (m) Representative blot images (n = 6 western blots) from podocytes treated for 72 h. LG-vehicle, n = 8; HG-vehicle, n = 10; LG-TEPP-46, n = 5; HG-TEPP-46, n = 9. (n) Podocytes treated for 72 h. Independent experiments n = 4. All values are means ± s.e.m. ***P < 0.001; **P < 0.005; *P < 0.05. All data throughout this figure are analyzed using ANOVA. When overall F tests were significant (P < 0.05), post hoc comparisons using Tukey’s method of adjustment were conducted to determine the location of any significant pairwise differences.
In line with the increased oxidative phosphorylation induced by TEPP-46, elevation of mitochondrial mass and MMP were also observed (Fig. 4i and Supplementary Fig. 9a,b). By contrast, TEPP-46 failed to normalize the inhibitory actions induced by high glucose on mitochondrial metabolism in Pkm-knockdown podocytes, which suggests that the actions of TEPP-46 require PKM expression (Fig. 4j). TEPP-46 increased Ppargc1a mRNA expression in podocytes treated with either low or high glucose (Fig. 4k and Supplementary Fig. 9c). The ability of PKM2 activation to induce Ppargc1a expression was confirmed using PKM2 activators from Agios and Dynamix (Supplementary Fig. 10d). These data are further supported by a more than four-fold elevation of Ppargc1a mRNA expression in podocytes overexpressing PKM2 (Supplementary Fig. 9e). In podocytes with Ppargc1a knockdown, TEPP-46 failed to increase mitochondrial mass (Supplementary Fig. 9f). By contrast, TEPP-46 continued to increase MMP in Ppargc1a knockdown podocytes, which suggests that the effect of TEPP-46 is independent of PGC-1α (Supplementary Fig. 9g). The results suggest that PKM2 activation by TEPP-46 may exert its mitochondrial biogenesis effect through different pathways, with some actions mediated by transcriptional changes in the nucleus and others by direct actions of PKM2 on the mitochondria.
Notably, we observed that PKM2 activation by TEPP-46 also prevented high-glucose-induced elevation of ROS production, cytochrome c release and podocyte apoptosis (Fig. 4l–n); these changes were reversed in an intervention study (Supplementary Fig. 10). The ability of TEPP-46 to reverse the toxic effects of high glucose on podocytes after chronic hyperglycemia exposure suggests that PKM2 activation can reverse the metabolic and biochemical changes induced by high glucose, namely metabolic memory, and promote podocyte survival in high-glucose conditions.
PKM2 activation reversed abnormalities in glucose and mitochondrial metabolism in diabetes
To determine its effects in vivo, TEPP-46 was given to mice in a daily oral gavage. We observed a substantial increase in PK activity in the kidney cortex after 24 h of TEPP-46 exposure (Supplementary Fig. 11). In intervention studies, TEPP-46 was not given to mice with diabetes until 3 months after disease induction (Fig. 5a). No differences were observed in blood glucose levels, body weights or blood pressure between vehicle-treated or TEPP-46-treated mice with diabetes after 3 months of treatment (Supplementary Table 11). At 6 months after the induction of diabetes, TEPP-46 lowered sorbitol, DAG (C16:0/18:0) and MG in diabetic mice and notably restored these metabolites to nondiabetic levels (all P < 0.05; Fig. 5b–d).
Figure 5.
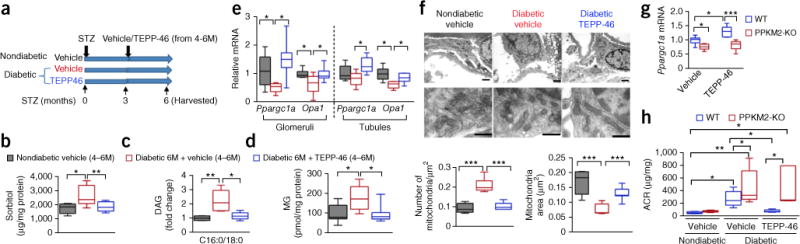
PKM2 activation reverses diabetes-induced defects in glucose metabolism and mitochondrial function in a mouse model of DN. (a) Schema of intervention-study design using STZ-induced diabetic DBA2/J mice treated with 30 mg/kg body weight TEPP-46 daily by oral gavage for 3 months after onset of STZ-induced diabetes. Mice were harvested 6 months post-STZ “4–6M” indicates that mice were given vehicle or TEPP-46 from 4–6 months onset of diabetes. (b) Sorbitol from kidney cortex. Nondiabetic vehicle treatment, n = 5 mice; diabetic vehicle, n = 11 mice; diabetic TEPP-46, n = 9 mice. (c) DAG (C16:0/18:0) from kidney cortex; n = 5 mice per group. (d) Methylglyoxal from kidney cortex. Nondiabetic vehicle, n = 7 mice; diabetic vehicle, n = 6 mice; diabetic TEPP-46, n = 7 mice. (e) Glomerular Ppargc1a and Opa1 mRNA. Nondiabetic vehicle, n = 6 mice; diabetic vehicle, n = 5 mice; diabetic TEPP-46, n = 7 mice. Tubular Ppargc1a and Opa1 mRNA, n = 6 mice. (f) Representative electron microscopy (EM) micrographs of mitochondria in podocytes from each group. Number of mitochondria was counted and normalized to area. Scale bar (top), 1 μm. Mitochondria area was quantified: nondiabetic vehicle, 333 mitochondria from 5 mice evaluated; diabetic vehicle, 732 mitochondria from 6 mice evaluated; diabetic TEPP-46, 1011 mitochondria from 7 mice evaluated. Scale bars (bottom), 0.5 μm. (g) Ppargc1a mRNA in primary podocytes isolated from WT and PPKM2-KO mice. Cells were treated with vehicle or 10-μM TEPP-46 for 8 h. WT, n = 5 mice, PPKM2-KO, n = 7 mice. (h) ACR at 6 months post-STZ. All mice were treated with vehicle or 50 mg/kg body weight TEPP-46 daily after 3 months of diabetes for a further 3 months. Nondiabetic WT vehicle (n = 4 mice); nondiabetic PPKM2-KO vehicle (n = 6 mice); diabetic WT vehicle (n = 11 mice); diabetic PPKM2-KO vehicle (n = 12 mice); diabetic WT TEPP-46 (n = 5 mice); diabetic PPKM2-KO TEPP-46 (n = 5 mice). For box plots, center lines represent the median; limits represent quartiles; whiskers represent minimum and maximum values. All data throughout this figure are analyzed using ANOVA. When overall F tests were significant (P < 0.05), post hoc comparisons using Tukey’s method of adjustment were conducted to determine the location of any significant pairwise differences. ***P < 0.001; **P < 0.005; *P < 0.05.
In agreement with the in vitro data, Ppargc1a mRNA levels were significantly lower in glomeruli from diabetic mice treated with vehicle. By contrast, TEPP-46 restored Ppargc1a expression to nondiabetic levels after 3 months of TEPP-46 treatment (Fig. 5e). Furthermore, TEPP-46 treatment induced the expression of Opa1, a gene that encodes for a reported mitochondrial fusion protein29, to nondiabetic levels in the diabetic glomeruli and tubules (P < 0.05; Fig. 5e), which suggests that PKM2 activation may promote mitochondrial fusion. These data are supported by electron microscopy showing that mice with diabetes had smaller and more punctate mitochondria in podocytes when compared to those in nondiabetic mice. Mitochondria number was 49% lower in diabetic mice treated with TEPP-46 as compared to vehicle-treated mice with diabetes. Conversely, mitochondria size was 1.69-fold larger in diabetic mice treated with TEPP-46 (P < 0.001; Fig. 5f), which indicates an elevation of mitochondrial fusion in TEPP-46-treated mice with diabetes. To provide additional evidence that the effect of TEPP-46 on Ppargc1α expression is a PKM2-specific effect, we isolated primary podocytes from PPKM2-KO and WT mice and treated them with TEPP-46. We did not observe any elevated Ppargc1α expression in podocytes with Pkm2 deletion, which suggests that the action of TEPP-46 on Ppargc1α expression is dependent on PKM2 activation (Fig. 5g).
Notably, we observed that TEPP-46 reversed the elevated ACR in diabetic mice in an intervention study. However, TEPP-46 treatment was ineffective in PPKM2-KO mice, further confirming that its effects occur in PKM2-specific manner (Fig. 5h and Supplementary Fig. 12a).
Pharmacologically activating PKM2 prevents the development of glomerular pathology
We studied the effect of PKM2 activation by TEPP-46 on the progression of renal abnormalities and glomerular pathology in STZ-induced diabetic DBA2/J mice using intervention studies with TEPP-46 for 3 months after the onset of diabetes. Blood urea nitrogen (BUN), creatinine, lipids, liver enzymes and blood cell counts were unaffected by TEPP-46 treatments. Furthermore, 6 months of STZ-induced diabetes did not cause any substantial elevations of plasma creatinine or BUN (Supplementary Table 12). After 3 months of diabetes, TEPP-46 treatment for 1 month and 3 months reduced albuminuria (ACR) as compared to diabetic mice treated with vehicle (P < 0.05; Fig. 6a). TEPP-46 attenuated mesangial expansion (Fig. 6b) and significantly reduced fibronectin mRNA expression in both diabetic glomeruli and tubules (Fig. 6c). In addition, other extracellular matrix (ECM)-associated genes were significantly lower in the tubules from TEPP-46-treated mice with diabetes (Fig. 6c). Glomerular basement membrane (GBM) thickening, a hallmark of DN, was also reduced in TEPP-46-treated diabetic mice relative to that in vehicle-treated mice with diabetes (P < 0.001; Fig. 6b). Conversely, podocyte number was notably increased in TEPP-46-treated diabetic mice as compared to vehicle-treated diabetic mice (P < 0.05; Fig. 6d).
Figure 6.
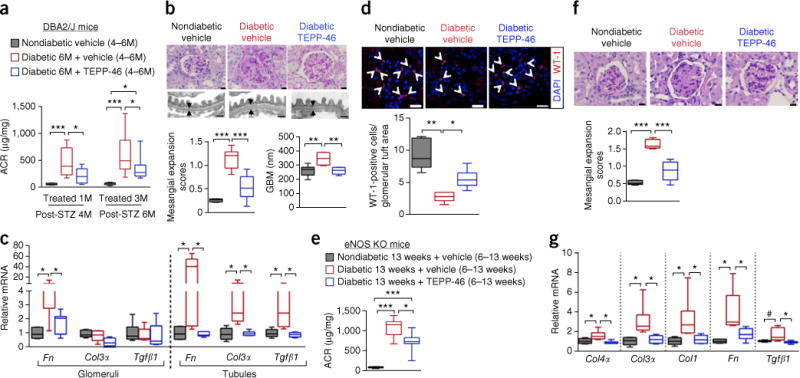
Pharmacologically activating PKM2 by TEPP-46 prevents the development of glomerular pathology. (a) ACR after 1 month of TEPP-46 treatment. Nondiabetic vehicle (n = 6 mice); diabetic vehicle (n = 9 mice); diabetic TEPP-46 (n = 10 mice). ACR after 3 months of TEPP-46 treatment. Nondiabetic vehicle treatment (n = 11 mice); diabetic vehicle (n = 17 mice); diabetic TEPP-46 (n = 15 mice). (b) Representative mesangial expansion at 6 months post-STZ by PAS staining. n = 350 images of kidney sections per group. Nondiabetic vehicle (n = 6 mice); diabetic vehicle (n = 6 mice); diabetic TEPP-46 (n = 7 mice). Scale bars, 10 μm. Representative images of thickness of glomerular basement membrane (GBM). Average of 100 measurements for each mouse and n = 6 mice per group. Scale bar, 0.5 μm. (c) mRNA for glomerular extracellular matrix genes. Nondiabetic vehicle (n = 6 mice); diabetic vehicle (n = 6 mice); diabetic TEPP-46 (n = 7 mice). mRNA for tubular extracellular matrix genes, n = 6 mice per group. (d) Representative confocal immunofluorescence images of Wilms tumor-1 (WT-1) staining. WT-1-positive cell number was normalized to glomerular tuft area. Nondiabetic vehicle, 60 glomeruli from 5 mice evaluated; diabetic vehicle, 91 glomeruli from 5 mice evaluated; diabetic TEPP-46, 88 glomeruli from 6 mice evaluated. Scale bars, 20 μm. (e) ACR at 13 weeks post-STZ eNos-KO mice. Nondiabetic vehicle, n = 5 mice; diabetic vehicle, n = 8 mice; diabetic TEPP-46, n = 7 mice. (f) Representative mesangial expansion (average of 42 glomeruli were assessed) at 13 weeks post-STZ eNos KO mice. Nondiabetic vehicle, n = 5 mice; diabetic vehicle, n = 6 mice; diabetic TEPP-46, n = 6 mice. Scale bars, 10 μm. (g) Extracellular matrix mRNA from kidney cortex. Nondiabetic vehicle (n = 5 mice); diabetic vehicle (n = 6); diabetic TEPP-46 (n = 6 mice). For box plots, center lines represent the median; limits represent quartiles; whiskers represent minimum and maximum values. All data throughout this figure are analyzed using ANOVA. When overall F tests were significant (P < 0.05), post hoc comparisons using Tukey’s method of adjustment were conducted to determine the location of any significant pairwise differences. ***P < 0.001; **P < 0.005; *P < 0.05.
We have further confirmed the beneficial effects of TEPP-46 by using an STZ-treated eNos (nitric oxide synthase 3, endothelial cell) KO mouse model30,31 (Supplementary Fig. 12b–d and Supplementary Table 13). TEPP-46 treatment also reduced albuminuria (Fig. 6e), mesangial expansion and the expression of ECM genes in eNos KO mice with diabetes (Fig. 6f,g). These data collectively suggest that PKM2 activation can reverse renal abnormalities and kidney pathology induced by diabetes.
DISCUSSION
This is the first proteomic analysis of glomeruli from individuals with extreme duration of diabetes but protected from DN, which allows for the identification of potential protective factors against the toxic effects of hyperglycemia. The detailed interrogation of the differentially expressed glomerular proteins shows a strong clustering of enzymes in pathways related to glycolysis, sorbitol, MG and mitochondrial function in the protected kidneys. The elevation of multiple enzymes involved in glucose metabolism, with correspondingly lower levels of plasma metabolites from these pathways in the protected group, even with elevated HbA1c, suggests that a reduction of free intracellular glucose and its metabolites can preserve glomerular function. The presence of elevated levels of aldose reductase and sorbitol dehydrogenase may enhance the metabolism of excess intracellular free glucose, which could protect podocytes and glomeruli from hyperglycemic toxicity. This is contrary to the hypothesis that their activation is pathogenic for diabetic vascular complications8,15.
The glomerular proteomic profiling suggests that increased metabolic flux through glycolysis could neutralize the toxic effects of hyperglycemia, and so we tested whether pharmacologically activating PKM2 can increase flux through glycolysis. The elevated levels of MG, PKC-δ activation and apoptosis in Pkm-knockdown podocytes mimic the effects of diabetes. Additionally, PKM2 activation normalizes high-glucose-induced elevation of these toxic glucose metabolites in podocytes, simulating the findings from the protected Medalists. Results from studies using stable and radioactive isotopes and the Seahorse Flux Analyzer support our hypothesis that increased flux through glycolysis by PKM2 activation in podocytes will lower the accumulation of toxic glucose-derived end products, increase flux through the TCA cycle and improve mitochondrial function. However, the protective properties of glycolytic flux are likely to be relative, because extreme or prolonged hyperglycemia will likely overwhelm the protective capacity of this mechanism. Notably, we have confirmed the specificity of TEPP-46 on mitochondrial metabolism in podocytes and ACR in mice with podocyte-specific deletion of Pkm2 (PPKM2-KO mice). It is interesting that increased glycolytic flux does not cause mitochondrial dysfunction, a common feature in diabetic vascular tissues5,32,33. Rather, these findings suggest that increased glycolytic activity in podocytes may even partially preserve mitochondrial function. Interestingly, a previous study using human and mouse models of kidney fibrosis reports that enzymes from the glycolytic and mitochondrial metabolism are also lower in the fibrotic tubules34.
Notably, the activation of PKM2 improves and even reverses mitochondrial dysfunction by increasing mitochondrial metabolism, including levels of PGC-1α, MMP and mitochondrial mass. This finding is particularly interesting in light of the fact that mitochondrial dysfunction has been proposed as a major defect induced by hyperglycemia, which leads to cellular dysfunction and pathology in multiple vascular tissues, including the glomeruli5,13,32,35. The mechanism by which the activation of PKM2 improves mitochondrial function could be related to enhancing OPA1, which has been reported to induce mitochondrial fusion29. Mitochondrial dysfunctions induced by diabetes and high glucose were reversible with the use of PKM2 activators, further suggesting that epigenetic abnormalities known to cause mitochondrial dysfunction and metabolic memory in diabetes could be reversed5,11,13,32,35,36. The normalization of mitochondrial dysfunction seems to be PKM2 specific, given that TEPP-46 does not induce PGC-1α in podocytes with Pkm2 deletion. Furthermore, our findings indicate that elevated oxidant production induced by high glucose can be reduced by PKM2 activators, which again supports the idea that PKM2 activation may improve mitochondrial function. Observations of glucose flux, as measured either by glycolysis or mitochondrial function, also support the idea that high-glucose-induced or diabetes-induced mitochondrial dysfunction could be improved by PKM2 activation associated with increasing flux through glycolysis.
It is not surprising that the compensatory elevation in PKM1 expression and PK activity exhibited in diabetic PPKM2-KO mice fails to protect them from DN development, because many reports have showed that PKM1 and PKM2 have different cellular functions37,38. Our findings from the rescue experiments of re-expressing PKM1 or PKM2 in Pkm-knockdown podocytes clearly demonstrate that these two isoforms have differential actions on mitochondrial function. Moreover, the differential actions of PKM1 and PKM2 might not be limited to the well-described pyruvate kinase glycolytic functions. Several reports of studies on transformed cells have suggested that PKM2 can function as a protein kinase in addition to its glycolytic functions, and translocate to the nucleus24,39–42. Unlike PKM1, the structural configuration of PKM2 can be regulated by glucose metabolites and cellular signaling events22,43–45. Our results have suggested that PKM2 has a more potent and unique effect on mitochondrial biogenesis than PKM1 when it is overexpressed in podocytes at basal physiological conditions. Extreme overexpression of PKM1 did modestly enhance mitochondrial function in the absence of PKM2. However, it is not clear whether extremely overexpressed PKM1 may occupy subcellular sites at which only PKM2 normally exists, thereby mediating the selective properties of PKM2. Further studies will be needed to confirm this hypothesis.
One potential explanation for the lower levels in some of the 14 glycolytic enzymes from the nonprotected group could be the contribution of podocyte loss, the replacement by other types of cells and extracellular matrix proteins. However, several of our findings suggest that may not be the primary explanation. We observed that these glycolytic and mitochondrial enzymes were lower in the glomeruli from nondiabetic donors without nephropathy than in those from protected Medalists. Furthermore, PK activity was also decreased in cultured podocytes exposed to high glucose and in glomeruli isolated from diabetic mice after 2 months, when podocyte loss is not significant. Additionally, other glomerular cells that replace podocytes in the fibrotic kidneys also express many of the glycolytic and mitochondrial enzymes, as observed in the glomerular proteomics from the Medalist cohort.
In our Medalist studies, we cannot exclude the possibility that non-protected individuals are actually partially protected, given that they have survived living with T1DM for more than 50 years. Typical DN in T1DM appears 5–15 years after the onset of diabetes. Our histological analysis of the nonprotected individuals is consistent with changes observed in DN. But the mechanisms underlying this nonclassical form of DN may be different from those with the usual presentation of DN. Further studies on a larger sample size of subjects with multiple stages of DN and shorter durations of both T1DM and T2DM will be needed to determine whether the findings from this study are also observed in individuals with classical presentation of DN.
Interestingly, preliminary studies on PKM2 protein levels in the glomeruli from subjects with shorter durations of T1DM and T2DM indicate a trend toward higher PKM2 levels in those with no or mild DN by 2.6-fold, when compared to DN, without achieving statistical significance. It is surprising that the expression of PKM2 was already higher in those with no or mild DN than those with DN in so few samples, given that the expectation is for few individuals with diabetes to have the ‘protective’ protein profile observed in the Medalists. Thus, it is likely that other factors, such as persistent good glycemic control, can also preserve some of the protective protein profile. As noted above, further studies on a larger sample size of subjects with shorter duration of both T1DM and T2DM will be needed to determine PKM2 levels in a general diabetic population.
In intervention studies, the activation of PKM2 by TEPP-46 clearly improves the pathological outcomes of glomerulopathy in diabetic mice. These results from intervention models are critical given that clinical studies will likely be interventional, owing to the high cost of prevention trials for DN. It is noted that mouse models for DN do not mimic human DN because they do not develop renal failure (end-stage renal disease)46–48. However, our study has clearly shown that treatments with TEPP-46 after 3 months of diabetes can reverse many early biochemical and cellular abnormalities that subsequently lead to a reduction of ACR, mesangial expansion, basement- membrane thickening and fibrosis in both glomeruli and tubules. This is confirmed by using two rodent models of DN, including STZ-induced diabetic DBA2/J mice and diabetic eNos KO mice30,31,47–49. In conclusion, these findings suggest that PKM2 is a novel therapeutic target identified in glomeruli isolated from individuals with diabetes, and that its activation prevents DN progression by reducing levels of toxic glucose metabolites and inducing mitochondrial biogenesis, despite the presence of diabetes.
METHODS
Methods, including statements of data availability and any associated accession codes and references, are available in the online version of the paper.
ONLINE METHODS
Human kidney tissue handling, dissection and pathology assessment
Human kidney tissue collection was approved by the Institutional Review Board at Joslin Diabetes Centre. Informed consent was obtained from all subjects. The kidneys were dissected for pathology assessment. Nondiabetic age-matched kidneys were from the National Disease Research Interchange (NDRI). Diabetic kidneys from the non-Medalist cohort were obtained from the NDRI and International Institute for the Advancement of Medicine (iiAM). Kidney tissue for light microscopy was formalin fixed and paraffin embedded. Sections were cut at 2 μm and stained with H&E, PAS and Masson Trichrome. Assessment of the pathology was evaluated in a blinded manner by an experienced renal pathologist (IES) and classified according to the Renal Pathology Society “Pathologic Classification of Diabetic Nephropathy” on the basis of glomerular pathology20, as described in Supplementary Methods.
Glomeruli isolation from human kidneys
Dissected kidney cortex was minced on ice, and the mixture was sequentially passed through different sizes of sieves: 263 μm, 212 μm and 89 μm. Glomeruli remaining on the 89-μm sieve were then washed off using cold PBS and pelleted by centrifugation. The purity of glomeruli was confirmed to be <95% in each sample by phase-contrast microscopy.
Proteomic analysis
Human glomeruli were lysed in RIPA buffer with proteinase inhibitors cocktail (Roche). Samples were centrifuged at 13,000 r.p.m. for 10 min. Supernatant (whole-cell lysate) was collected. A protein assay was performed and 120-μg of lysate were separated by 10% SDS–PAGE. The gels stained with Coomassie Blue were submitted to Joslin Proteomics Core for analysis using method as previously described50. In brief, the entire lane for each sample was divided into 40 slices. Tryptic digested gel slices were analyzed by LC–MS/MS using a linear ion-trap mass spectrometer (LTQ, Thermo Electron). Assignment of MS/MS data was performed using SEQUEST software (Bioworks, Thermo Electron) and X!Tandem (The Global Proteome Machine Organization) search against the International Protein Index (IPI) database from the European Bioinformatics Institute. Proteomics peptide hits are included in Supplementary Data Set.
Untargeted metabolomics
Plasma metabolites were measured by nontargeted metabolomic profiling and compared between the protected and nonprotected groups. Data analysis was performed as previously described51. Metabolites detected in at least two-thirds of the subjects were considered to be well detectable and were subjected to multivariate analysis. Subsequently, fold differences in means of these metabolites between the studied groups were examined. Significance of the differences in metabolites between the groups was based on the metabolites transformed to their base-10 logarithms and determined in a multivariate linear-regression model (volcano plot). Adjustment for multiple comparisons was determined by a positive false-discovery rate. Non-well-detectable metabolites were treated as categorical variables, and differences in their concentrations were evaluated by χ-squared tests. SAS software v9.3 (Cary, NC) was used to perform analysis. Allocation of the metabolites within designated pathways was supported by KEGG and Human Metabolome Database (HMDB).
Antibodies and reagents
We used antibodies to PKM2 (Cell Signaling, 4053, 1:1,000), PKM1 (Cell Signaling,7067, 1:1,000), actin (Santa Cruz, sc-1616 HRP, 1:1,000), AR (AKR1B1, abcam, ab71405, 1:100), GLO1 (Thermo Scientific Pierce, MA1-13029, 1:1,000), MT-CO2 (abcam, ab79393, 1:5,000), ENO1 (abcam, ab155102, 1:1,000), WT1 (Dako, M3561, 1:400), anti-FLAG M2 (Sigma-Aldrich, F1804, 1:5,000), GAPDH (Santa Cruz, sc-48166, 1:1,000), PKCδ (Cell Signaling, 2058, 1:1,000), cytochrome c (Cell Signaling, 11940, 1:1,000), pan-cadherin (Santa Cruz, sc-1499, 1:1,000), PKLR (Proteintech, #22456-1-AP, 1:1,000). PKM2 activators TEPP-46, Agio and Dynamix were synthesized by ChemPartner. We used the following kits: Compartmental Protein Extraction kit (Millipore); Cell Death detection ELISA PLUS kit (Roche); CellTiter-Glo Luminescent Cell Viability Assay (ATP production; Promega). Lentiviral shRNAs mouse PKM (TRCN0000025621) and pLKO (scramble) were purchased from Thermo scientific. pLHCX-Flag-mPKM2 and pLHCX-Flag-mPKM1 were kind gifts from Dimitrios Anastasiou/Matthew Heiden pLHCX-Flag-mPKM2(C358S) was purchased from Addgene. Human PKM1 (#LPP-Z5842-Lv152-050) and PKM2 (#LPP-Z7438-Lv152-050) lentivirus were purchased from Genecopoeia. rPGC1a lentivirus (sc-72151-V) was purchased from Santa Cruz.
Immunofluorescent staining
Human kidneys were fixed in 4% paraformaldehyde and paraffin embedded. 4-μm sections were made and stained with PKM2 (Cell Signaling, 4053; 1:400), CD31 (Dako, M3561, 1:50), α−SMA (Sigma-Aldrich, A2547, 1:200) and WT-1 (Dako, M3561, 1:400). All the slides were masked with their IDs, and images from 25–30 randomized nonoverlapping fields in the kidney cortex were acquired. Approximately 30–36 glomeruli were counted. For the quantification of PKM2 in podocytes, data were presented as PKM2+/WT-1+%. For the quantification of PKM2 in endothelial cells, data were presented as PKM2+/CD31+%. For the quantification of PKM2 in mesangial cells, data were presented as PKM2+/α−SMA+%. All experiments included controls without primary antibody.
Pyruvate kinase (PK) activity assays
We measured PK activity using the method described previously21. In brief, PK activity was measured by monitoring pyruvate-dependent conversion of NADH to NAD+ by lactate dehydrogenase (LDH). 1 μg of total protein was mixed with 1× pyruvate kinase reaction buffer (50-mM Tris-HCl, pH 7.5, 100-mM KCl and 5-mM MgCl2 containing 0.5-mM PEP (Sigma-Aldrich, P0564), 0.6-mM ADP (Sigma-Aldrich, A5285), 180-μM NADH (Sigma-Aldrich, N8129), 8 units LDH (Sigma-Aldrich, L1254), 1-mM DTT, and read at ex: 340 nm, em: 460 nm.
Cross-linking to determine tetramers, dimers and monomers of PKM2
In cell culture, we used 500-μM DSS (disuccinimidyl suberate; Thermo Scientific #PI21658), as per the manufacturer’s instructions, to cross-link at room temperature. Cell number was counted. Equal numbers of cells were lysed in 4X Bolt LDS Sample Buffer (Invitrogen) and boiled for 5 min. In glomeruli cross-linking, freshly isolated mouse glomeruli were pooled from three mice for each sample. An equal amount of the suspended glomeruli was used for protein assay. We used 2.5-mM DSS to cross-link for 30 min at 37 °C, with constant rotating. Equal amount of glomeruli were lysed in 4X Bolt LDS Sample Buffer (Invitrogen) and boiled for 5 min. Samples were separated by NuPAGE Novex 4–12% Bis-Tris Gel (Invitrogen). After transfer, membranes were incubated with 0.4% paraformaldehyde in PBS for 30 min at RT before PKM2 antibody was added for detection of tetramers, dimers and monomers of PKM2.
Mouse podocytes and human podocyte cell lines
Mouse podocytes and human podocytes cell lines were kind gifts from P. Mundel and J. Kopp. These cell lines were confirmed to be mycoplasma negative (MycoAlert Detection Kit, Lonza). Podocytes were cultured in RPMI medium with 10% FBS as previously described52,53 at 33 °C and then thermo-shifted to 37 °C for 10 d before they were used for experiments. Only passages 14–18 were used for experiments.
Biotin labeling of oxidized and sulfenylated PKM2
We used the method as described by Anastasiou21. In brief, cells or kidney tissues were lysed in biotin labeling lysis buffer (50-mM Tris-HCl, pH 7.0, 5-mM EDTA, 120-mM NaCl, 0.5% Igepal-630) containing protease inhibitors and 100 mM-maleimide (Sigma-Aldrich, 129585) for 15 min. SDS was added to a final concentration of 1% and the cell lysates were incubated at room temperature for 2 h rotation. Ice-cold acetone was used to precipitate the protein at −20 °C for 20 min. The pellet was air-dried and then resuspended in 200-μl lysis buffer containing 1% SDS, 10-mM DTT and 0.1-mM Z-Link Maleimide-PEG2-Biotin (Thermo Fisher) to reduce the remaining, previously oxidized, sulfhydryl groups and allow their reaction with biotin-maleimide. Proteins were precipitated with acetone as described above, and the dried pellet was resuspended in 500-μl of lysis buffer with 50% slurry of streptavidin-sepharose beads (GE Healthcare) rotating at 4 °C for 2 h. The beads were then washed and boiled. Samples were separated by 10% TGX gel (Bio-Rad) and incubated with antibodies as indicated in each experiment.
Sorbitol measurement
Mouse podocytes from two of P150 dishes and a piece of kidney cortex were lysed in RIPA buffer containing proteinase inhibitors (Roche). Protein assay was performed and sorbitol was analyzed by gas-liquid chromatography as previously described54.
Sorbitol measurement by D-[U-13C6] glucose labeling
Mouse podocytes were exposed to 5.5 (LG) or 25-mM (HG) glucose with or without 10-μM TEPP-46 for 72 h. Cells were washed with no glucose media and incubated with 5.5-mM or 25-mM D-[U-13C6] glucose (Cambridge Isotope, #CLM-1396) for 12 h. Cells were washed three times in cold PBS and analyzed using LC-MS as previously described55. Atom percentage excess (APE) values were calculated. In parallel podocyte culture conditions, unlabeled sorbitol was measured. Sorbitol derived from D-[U-13C6] glucose was calculated using the following formula: APE value X un-labeled sorbitol (μg/mg protein).
DAG measurement by D-[U-14C6] glucose labeling
This method has been adapted from previous studies56,57. Mouse podocytes were exposed to 5.5-mM (LG) or 25-mM (HG) glucose with or without 10-μM of TEPP-46 for 72 h. Cells were then labeled in media containing D-[U-14C6] glucose (specific activity 263 mCi/mmol) (PerkinElmer, #NEC042V2) at different time points, as indicated. Cells were scraped in isopropanol/0.1% acetic acid. and samples were incubated overnight at room temperature with slight shaking. Hexane and KCl were added to each sample. Samples were then rotated for 10 min at room temperature. The organic phase (upper phase) was collected and dried using a vacuum pump. The lipid pellet was dissolved in 1:1 methanol:chloroform and analyzed by thin-layer chromatography (TLC). TLC plate material was put into scintillation for counting. CPM values were obtained and data were presented as relative fold change.
Diacylglycerol (DAG) measurement
Approximately 5 mg of kidney cortex was lysed in RIPA buffer. Protein assay was performed. DAG was measured using HPLC/MS/MS by Lipidomics Masss Spectrometry core at South Carolina.
CO2 production by D-[6-14C] glucose labeling
This method has been adapted from previous studies21,58. Podocytes were seeded in a 35-mm petri dish and treated with to 5.5-mM (LG) or 25-mM (HG) glucose with or without 10-μM TEPP-46 for 96 h. Cells were washed with no-glucose media and incubated in no-glucose media for 30 mins. Cells were then labeled in media containing 5.5-mM glucose and D-[6-14C] glucose (specific activity 60.3 mCi/mmol) (PerkinElmer, #NEC045X) for 3 h. One Whatman filter paper saturated with KOH solution was attached to the inside lid of the petri dish. The petri dish was sealed with film to ensure airtight conditions. H2SO4 was added to the cell monolayer by syringe-injection liberation of CO2. Filter paper was then put into scintillation for counting. Production of [14C]CO2 from D-[6-14C] glucose was determined by CPM values and normalized to paralleled protein content from the same cell culture conditions. The data were presented as relative fold change.
Methylglyoxal (MG) measurement
The method has been modified as previously described59. Mouse podocytes or approx. 5 mg of kidney cortex were lysed in RIPA buffer. A protein assay was performed, and MG was analyzed using an LC–MS/MS system after derivatization with 1,2-diaminobenzene forming methylquinoxaline and d4-methylquinoxaline as internal standard. Quantification was performed by correlation of the respective peak areas using external calibration with methylquinoxaline.
Glucose flux in mitochondrial and glycolysis
Was measured using XF24 Extracellular Flux Analyzer. During Seahorse experiments, Seahorse assay media (Sigma-Aldrich, D5030) supplemented with 1% FBS was used. No glucose, pyruvate or glutamine was included in the assay medium during Seahorse analysis. Oxygen consumption rate (OCR) and extracellular acidification rate (ECAR) were measured using FluxPak mini kit (#100867-100, Seahorse Biosciences). Data are calculated from four independent measurements obtained at 5-min intervals at baseline and after the addition of the following compound at working concentrations of glucose (10 mM), oligomycin (5 μM), FCCP (1.5 μM) and rotenone (5 μM). For each experiment, the means from 3–5 replicate wells were recorded. Values presented are means ± s.e.m. The experiments were repeated three times.
Mitochondrial membrane potential (MMP)
Was evaluated by exposing cells to JC-1 probe (Molecular Probes, Invitrogen; #T3168). The medium was aspirated and cells were washed 2× with HBSS and incubated with HBSS containing JC-1 for 30 min at 37 °C/5% CO2. The cells were washed, trypsinized and centrifuged, and fluorescence was measured by flow cytometry (excitation/emission 543 nm/560 nm) with a LSRII system (Becton Dickinson).
Mitochondrial mass
The medium was aspirated and cells were washed two times with HBSS and incubated with HBSS containing 20-nM MitoTracker Green (Molecular Probes, Invitrogen) for 20 min. The cells were washed and trypsinized, and fluorescence was assessed by flow cytometry with a LSRII system (Becton Dickinson).
ATP
ATP was measured using a CellTiter-Glo Luminescent Cell Viability Assay kit (Promega). Mouse podocytes were seeded at a density of 7,500 cells per well in ppaque-walled with clear bottoms 96-well plate. Cells were treated as described, and ATP was measured as per manufacturer’s instructions.
Analysis of intracellular ROS production
The medium was aspirated and cells were washed two times with HBSS and incubated with HBSS containing 5-μM chloromethyl-H2DCFDA (CM-H2DCFDA, Invitrogen) for 20 min. The cells were washed, trypsinized and assessed by flow cytometry (LSRII, BD Biosciences).
Cell death (apoptosis)
Apoptosis was detected using Cell Death detection ELISA PLUS (Sigma-Aldrich, # 11774425001).
Generation of podocyte stable cell lines
The following mouse podocyte stable cell lines were generated: PKM knockdown stable cell line was generated by PKM shRNA lentivirus; PGC-1α knockdown stable cell line was generated by PGC-1α shRNA lentivirus; PKM1 and PKM2 overexpression stable cell lines were generated by PKM1 and PKM2 lentivirus and retrovirus. For ‘rescue’ experiments, PKM1 or PKM2 was re-expressed in the Pkm-knockdown mouse podocyte cell line by infecting human PKM1 or PKM2 lentivirus. After infection, cells were selected using hygromycin for 10 d and verified by the measurement of protein levels using immunoblotting.
RNA isolation, RT–qPCR and immunoblotting
RNA was isolated using RNeasy mini kit (Qiagen). 1 μg of RNA was reverse transcribed using High Capacity cDNA Transcription kit (Invitrogen) and RT–qPCR was performed using SYBR Green PCR Master Mix (Applied Biosystems). Housekeeping gene 36b4 was used to normalize in all the experiments. Primers used are listed in Supplementary Table 14. For western blotting, we used Mini-PROTEAN TGX precast gels (Bio-Rad) for all the western blotting unless stated otherwise. The quantifications of western blotting were performed using ImageJ. Uncropped western gels are shown in Supplementary Figures 13–21.
Primary culture of podocytes
This procedure was adapted from a previous protocol60. The isolated glomeruli were plated on collagen-type-1-coated dishes at 37 °C in RPMI 1640 medium with 15%FBS. On day 3 of culture, unattached glomeruli were washed away and medium was changed to 10% FBS. Podocytes were used for experiments on day 6 of culture. These cells were not tested for mycoplasma.
Mouse studies
All mouse studies were approved by the Institutional Review Board at Joslin Diabetes Centre and some protocols were adapted from Animal Models of Diabetic Complications Consortium (AMDCC)46–48. Males were used in mouse studies with the exception primary podocyte culture, where only females were used. DBA2/J (stock #671), eNos KO mice (stock #002684) and podocin-Cre mice (stock #008205) were purchased from the Jackson Laboratory. For podocyte-specific, PKM2 KO mice, we crossbred a conditional knockout (KO) mouse strain that contains a floxed PKM2-specific exon 10 (Pkm2fl/fl)28 with the podocin-Cre mouse line. Pkm2fl/fl;podocin-cre mice were used as wild-type (WT) controls. The Pkm2fl/fl mouse line is mixed background of C57BL/6J and 129/Sv. All experiments were performed with genetically appropriate littermate controls. In STZ-induced diabetic mouse studies, male mice at 8 weeks old were injected with either saline or streptozotocin (STZ, Sigma-Aldrich) at 40 mg/kg body weight (DBA2/J)48 or 50 mg/kg body weight (PPKM2-KO and eNos KO mice30 for 5 consecutive days. Mice with blood glucose ≥250 mg/dl after 2 weeks of STZ injection were included in the study. For DBA/2J mice, they were subcutaneously implanted with pellets impregnated with bovine insulin (LinBit tablets, LinShin Canada) at 12 weeks post-STZ to prevent ketosis, protein catabolism and significant weight loss.
Mouse metabolic measurements
Blood glucose levels were measured from tail-vein blood using contour (Bayer). Blood pressure was assessed by tail-cuff method (Visitech Systems noninvasive blood-pressure analysis system). In DBA2/J mice study, spot urine was collected. In PPKM2-KO and eNos KO mice study, urine was collected from 24-h metabolic caging. Albuminuria was quantified by albumin and creatinine ratio (ACR) using Albuwell M and the Creatinine Companion kits (Exocell). Plasma BUN was analyzed by Vanderbilt University Translational Pathology Core using Analyzer from Alfa Wassermann. Plasma creatinine was analyzed by LC/MS-MS at the University of Alabama Birmingham O’Brien Core Center for Acute Kidney Injury Research. Blood counts were performed using Hemavet 950FS (Drew Scientific). Liver function tests and BUN were performed by Vanderbilt Translational Pathology Core. Total cholesterol and triglyceride was measured using Stanbio Cholesterol Diagnostic Set and Stanbio Laboratory Triglyceride test set.
Mouse glomeruli isolation
Glomeruli were isolated using magnetic Dynabeads method as previously described61 with some modifications. In brief, Dynabeads M-450 Tosylactivated (Invitrogen, #14013) was perfused from the mouse aorta and minced kidney tissues were digested in 1 mg/ml collagenase A and 100 U/ml DNase I for 30 min. Digested mixture was then passed through a 100-μm cell strainer, and the flow-through was then placed on a magnet for purification. The purity of glomeruli was confirmed to be 95% in each sample by phase-contrast microscopy.
Mouse kidney pathology assessment
We used 4-μm sections from kidneys processed with paraformaldehyde-fixed and paraffin-embedded for PAS staining and immunohistochemistry staining of WT-1. Mesangial expansion was assessed in PAS-stained kidney sections as described by others48,62–65. A semiquantitative score (sclerosis index (SI)) was used to evaluate the degree and extent of glomerular sclerosis as previously described. In immunohistochemistry staining of WT-1, 60–91 glomeruli from each group were assessed in a masked manner.
Transmission electron microscopy
The complete method is previously described66. Kidney tissue samples were fixed in 2.5% glutaraldehyde in 0.1-M phosphate buffer and processed for routine electron microscopy. Images were obtained using Philips 301 Transmission Electron Microscope. For GBM measurement, there were 100 measurements for each mouse and n = 6 mice per group. For mitochondrial studies, more than 300 mitochondria were examined from each group comprising 5–7 mice. ImageJ was used for all the measurements.
Statistical analysis
Figures were produced using GraphPad prism software. Animals were randomly assigned to groups. In mouse and clinical studies, histological analysis was conducted in a blinded manner. Based on extensive experience with these mouse models of diabetes (for example, assay sensitivity, the different animal strains used, mortality rate) and given the planned analytical framework, we estimated the number of mice per group that would be required to detect effects of interest at the P < 0.05 level of significance. The numbers of technical replicates or biological replicates (independent experiments for cell culture, or individual mouse for in vivo) in each group were stated in figure legends. All data are presented as either means ± s.e.m. or means ± s.d., as stated in figure legends. Unpaired Student’s t-tests with no assumption of equal variance were used for comparisons between two groups. To determine goodness of fit correlation (R2), univariate linear regression was used. For comparisons of more than two groups, ANOVA (by general linear model) was used. When overall F tests were significant (P < 0.05), post hoc comparisons using Tukey’s method of adjustment were conducted to determine the location of any significant pairwise differences. Analysis was performed using SAS v9.4 (Cary, NC) and GraphPad prism 5.02 software (La Jolla, CA). A two-sided P value < 0.05 was considered to be statistically significant. Diabetic mice were excluded from the analysis if their body weight was less than the body weight at 8 weeks old before STZ injection or if they died before the end of the designated study period. The exclusion criteria were based on the pre-established requirements that the metabolic abnormalities and pathology observed in mice with significant weight loss are not reliable and could be due to starvation effects. For the STZ-induced diabetic DBA2/J mouse study, kidneys from diabetic mice with systemic infections were excluded from the analysis. 18/58 diabetic DBA2/J mice were excluded from the study. The exclusion included mice with systemic infection and those that died before the end of the designed study period.
Supplementary Material
Acknowledgments
We are grateful to all the fellows who participated in Medalist Kidneys collection, D. Anastasiou, J. Lee, C. Thomas and M. Lauterbach for their technical advice. We also thank the technical support from E. Yu, daily-oral-gavaging team members, Z. Zsengeller and E. Pernicone. We are grateful to M. Maurer, who gave us technical advice on human kidney pathology assessment. We thank C. Clish for plasma metabolomics analysis. We are grateful to J. Hourihan for technical advice and review of the manuscript. W. Qi was a recipient of awards from the Juvenile Diabetes Research Foundation and Mary Iacocca Research Foundation. Mouse podocytes and human podocytes cell lines were kind gifts from P.M. and J.K. This project was funded by NIH 1DP3DK112192-01 (G.L.K.); DK094333-01 (G.L.K. and H.A.K.), 1R24DK090961-01 (G.L.K.); DRC grant-P30DK036836-30 (G.L.K.); JDRF 8-2005-358 (G.L.K.); JDRF 18-2008-363 (G.L.K.); JDRF17-2011-47 (G.L.K.); and JDRF17-2013-310 (H.A.K.). Additional research support was provided by the Thomas Beatson, Jr Foundation, the Brehm Foundation and a research grant from Sanofi-Aventis (G.L.K.). Other co-authors were supported by the following funding: DK107339-02 (M.A.Y.); Harold Whitworth Pierce Charitable Trust Postdoctoral Fellowship (A.M.B.); R01 DK109015 and R00 DK090210 (C.W.L.) and JDRF CDA-2015-89-A-B (M.A.N.).
Footnotes
AUTHOR CONTRIBUTIONS
W.Q. designed and performed the experiments, analyzed the data and wrote the manuscript. H.A.K. assisted in the design of the Medalist study. Q.L., A.I., A.K., T.S., M.A.Y., S.L., L.J.C., A.P., C.W.L., G.Q., A.M.B. and W.J.I. provided technical support and/or critical discussions of the manuscript. I.-H.W. analyzed proteomics data. S.H. managed clinical data and samples. D.P. and L.T. performed all the clinical and some nonclinical statistical analysis and checked all the statistical analysis. C.C. performed electron-microscopy-related imaging work. M.A.N. analyzed metabolomics data. E.P.F. participated in proteomics analysis and critical review and discussion of the manuscript. M.G.V.H. provided technical advice on both TEPP-46 and Pkm2fl/fl mouse studies and constructs of pLHCX-Flag-mPKM2 and pLHCXFlag-mPKM1. I.E.S. and P.S.A. assessed all the human kidney pathology. R.C.S. provided critical review of the clinical data. G.L.K. supervised the project and wrote the manuscript. All the authors have reviewed the manuscript.
COMPETING FINANCIAL INTERESTS
The authors declare competing financial interests: details are available in the online version of the paper.
Note: Any Supplementary Information and Source Data files are available in the online version of the paper.
Data availability
All data underlying the findings reported in this manuscript are provided as part of the article. The proteomics data reported in this paper are provided as original dataset (the complete peptide hits) in Supplementary Information, and the complete lists of peptide hits are included in Supplementary Tables 3 and 4. Raw data are available via ProteomeXchange with identifier PXD006339. Source data are available for Figures 1–6.
References
- 1.Breyer MD, Susztak K. The next generation of therapeutics for chronic kidney disease. Nat Rev Drug Discov. 2016;15:568–588. doi: 10.1038/nrd.2016.67. [DOI] [PMC free article] [PubMed] [Google Scholar]
- 2.Khan SS, Quaggin SE. Therapies on the horizon for diabetic kidney disease. Curr Diab Rep. 2015;15:111. doi: 10.1007/s11892-015-0685-3. [DOI] [PMC free article] [PubMed] [Google Scholar]
- 3.United States Renal Data System. 2015 USRDS Annual Data Report. USRDS; 2015. [Google Scholar]
- 4.Brownlee M. The pathobiology of diabetic complications: a unifying mechanism. Diabetes. 2005;54:1615–1625. doi: 10.2337/diabetes.54.6.1615. [DOI] [PubMed] [Google Scholar]
- 5.Nishikawa T, et al. Normalizing mitochondrial superoxide production blocks three pathways of hyperglycaemic damage. Nature. 2000;404:787–790. doi: 10.1038/35008121. [DOI] [PubMed] [Google Scholar]
- 6.Dunlop M. Aldose reductase and the role of the polyol pathway in diabetic nephropathy. Kidney Int Suppl. 2000;77:S3–S12. doi: 10.1046/j.1523-1755.2000.07702.x. [DOI] [PubMed] [Google Scholar]
- 7.Giacco F, et al. Knockdown of glyoxalase 1 mimics diabetic nephropathy in nondiabetic mice. Diabetes. 2014;63:291–299. doi: 10.2337/db13-0316. [DOI] [PMC free article] [PubMed] [Google Scholar]
- 8.Greene DA, Lattimer SA, Sima AA. Sorbitol, phosphoinositides, and sodium-potassium-ATPase in the pathogenesis of diabetic complications. N Engl J Med. 1987;316:599–606. doi: 10.1056/NEJM198703053161007. [DOI] [PubMed] [Google Scholar]
- 9.Lee TS, Saltsman KA, Ohashi H, King GL. Activation of protein kinase C by elevation of glucose concentration: proposal for a mechanism in the development of diabetic vascular complications. Proc Natl Acad Sci USA. 1989;86:5141–5145. doi: 10.1073/pnas.86.13.5141. [DOI] [PMC free article] [PubMed] [Google Scholar] [Research Misconduct Found]
- 10.Reidy K, Kang HM, Hostetter T, Susztak K. Molecular mechanisms of diabetic kidney disease. J Clin Invest. 2014;124:2333–2340. doi: 10.1172/JCI72271. [DOI] [PMC free article] [PubMed] [Google Scholar]
- 11.Reddy MA, Natarajan R. Epigenetics in diabetic kidney disease. J Am Soc Nephrol. 2011;22:2182–2185. doi: 10.1681/ASN.2011060629. [DOI] [PMC free article] [PubMed] [Google Scholar]
- 12.Fogo AB. The targeted podocyte. J Clin Invest. 2011;121:2142–2145. doi: 10.1172/JCI57935. [DOI] [PMC free article] [PubMed] [Google Scholar]
- 13.Wang W, et al. Mitochondrial fission triggered by hyperglycemia is mediated by ROCK1 activation in podocytes and endothelial cells. Cell Metab. 2012;15:186–200. doi: 10.1016/j.cmet.2012.01.009. [DOI] [PMC free article] [PubMed] [Google Scholar]
- 14.Bolton WK, et al. Randomized trial of an inhibitor of formation of advanced glycation end products in diabetic nephropathy. Am J Nephrol. 2004;24:32–40. doi: 10.1159/000075627. [DOI] [PubMed] [Google Scholar]
- 15.Frank RN. The aldose reductase controversy. Diabetes. 1994;43:169–172. doi: 10.2337/diab.43.2.169. [DOI] [PubMed] [Google Scholar]
- 16.PKC-DRS Study Group. The effect of ruboxistaurin on visual loss in patients with moderately severe to very severe nonproliferative diabetic retinopathy: initial results of the Protein Kinase C beta Inhibitor Diabetic Retinopathy Study (PKC-DRS) multicenter randomized clinical trial. Diabetes. 2005;54:2188–2197. doi: 10.2337/diabetes.54.7.2188. [DOI] [PubMed] [Google Scholar]
- 17.Pergola PE, et al. Bardoxolone methyl and kidney function in CKD with type 2 diabetes. N Engl J Med. 2011;365:327–336. doi: 10.1056/NEJMoa1105351. [DOI] [PubMed] [Google Scholar]
- 18.Keenan HA, et al. Clinical factors associated with resistance to microvascular complications in diabetic patients of extreme disease duration: the 50-year medalist study. Diabetes Care. 2007;30:1995–1997. doi: 10.2337/dc06-2222. [DOI] [PubMed] [Google Scholar]
- 19.Sun JK, et al. Protection from retinopathy and other complications in patients with type 1 diabetes of extreme duration: the joslin 50-year medalist study. Diabetes Care. 2011;34:968–974. doi: 10.2337/dc10-1675. [DOI] [PMC free article] [PubMed] [Google Scholar]
- 20.Tervaert TW, et al. Pathologic classification of diabetic nephropathy. J Am Soc Nephrol. 2010;21:556–563. doi: 10.1681/ASN.2010010010. [DOI] [PubMed] [Google Scholar]
- 21.Anastasiou D, et al. Inhibition of pyruvate kinase M2 by reactive oxygen species contributes to cellular antioxidant responses. Science. 2011;334:1278–1283. doi: 10.1126/science.1211485. [DOI] [PMC free article] [PubMed] [Google Scholar]
- 22.Kung C, et al. Small molecule activation of PKM2 in cancer cells induces serine auxotrophy. Chem Biol. 2012;19:1187–1198. doi: 10.1016/j.chembiol.2012.07.021. [DOI] [PMC free article] [PubMed] [Google Scholar]
- 23.Nakatsu D, et al. L-cysteine reversibly inhibits glucose-induced biphasic insulin secretion and ATP production by inactivating PKM2. Proc Natl Acad Sci USA. 2015;112:E1067–E1076. doi: 10.1073/pnas.1417197112. [DOI] [PMC free article] [PubMed] [Google Scholar]
- 24.Palsson-McDermott EM, et al. Pyruvate kinase M2 regulates Hif-1α activity and IL-1β induction and is a critical determinant of the warburg effect in LPS-activated macrophages. Cell Metab. 2015;21:65–80. doi: 10.1016/j.cmet.2014.12.005. [DOI] [PMC free article] [PubMed] [Google Scholar]
- 25.Geraldes P, et al. Activation of PKC-delta and SHP-1 by hyperglycemia causes vascular cell apoptosis and diabetic retinopathy. Nat Med. 2009;15:1298–1306. doi: 10.1038/nm.2052. [DOI] [PMC free article] [PubMed] [Google Scholar]
- 26.Khamaisi M, et al. PKCδ inhibition normalizes the wound-healing capacity of diabetic human fibroblasts. J Clin Invest. 2016;126:837–853. doi: 10.1172/JCI82788. [DOI] [PMC free article] [PubMed] [Google Scholar]
- 27.Mima A, et al. Glomerular VEGF resistance induced by PKCδ/SHP-1 activation and contribution to diabetic nephropathy. FASEB J. 2012;26:2963–2974. doi: 10.1096/fj.11-202994. [DOI] [PMC free article] [PubMed] [Google Scholar]
- 28.Israelsen WJ, et al. PKM2 isoform-specific deletion reveals a differential requirement for pyruvate kinase in tumor cells. Cell. 2013;155:397–409. doi: 10.1016/j.cell.2013.09.025. [DOI] [PMC free article] [PubMed] [Google Scholar]
- 29.Varanita T, et al. The OPA1-dependent mitochondrial cristae remodeling pathway controls atrophic, apoptotic, and ischemic tissue damage. Cell Metab. 2015;21:834–844. doi: 10.1016/j.cmet.2015.05.007. [DOI] [PMC free article] [PubMed] [Google Scholar]
- 30.Kanetsuna Y, et al. Deficiency of endothelial nitric-oxide synthase confers susceptibility to diabetic nephropathy in nephropathy-resistant inbred mice. Am J Pathol. 2007;170:1473–1484. doi: 10.2353/ajpath.2007.060481. [DOI] [PMC free article] [PubMed] [Google Scholar]
- 31.Nakagawa T, et al. Diabetic endothelial nitric oxide synthase knockout mice develop advanced diabetic nephropathy. J Am Soc Nephrol. 2007;18:539–550. doi: 10.1681/ASN.2006050459. [DOI] [PubMed] [Google Scholar]
- 32.Sharma K. Mitochondrial hormesis and diabetic complications. Diabetes. 2015;64:663–672. doi: 10.2337/db14-0874. [DOI] [PMC free article] [PubMed] [Google Scholar]
- 33.Sharma K, et al. Metabolomics reveals signature of mitochondrial dysfunction in diabetic kidney disease. J Am Soc Nephrol. 2013;24:1901–1912. doi: 10.1681/ASN.2013020126. [DOI] [PMC free article] [PubMed] [Google Scholar]
- 34.Kang HM, et al. Defective fatty acid oxidation in renal tubular epithelial cells has a key role in kidney fibrosis development. Nat Med. 2015;21:37–46. doi: 10.1038/nm.3762. [DOI] [PMC free article] [PubMed] [Google Scholar]
- 35.Dugan LL, et al. AMPK dysregulation promotes diabetes-related reduction of superoxide and mitochondrial function. J Clin Invest. 2013;123:4888–4899. doi: 10.1172/JCI66218. [DOI] [PMC free article] [PubMed] [Google Scholar]
- 36.Susztak K. Understanding the epigenetic syntax for the genetic alphabet in the kidney. J Am Soc Nephrol. 2014;25:10–17. doi: 10.1681/ASN.2013050461. [DOI] [PMC free article] [PubMed] [Google Scholar]
- 37.Lunt SY, et al. Pyruvate kinase isoform expression alters nucleotide synthesis to impact cell proliferation. Mol Cell. 2015;57:95–107. doi: 10.1016/j.molcel.2014.10.027. [DOI] [PMC free article] [PubMed] [Google Scholar]
- 38.Dayton TL, et al. Germline loss of PKM2 promotes metabolic distress and hepatocellular carcinoma. Genes Dev. 2016;30:1020–1033. doi: 10.1101/gad.278549.116. [DOI] [PMC free article] [PubMed] [Google Scholar]
- 39.Luo W, et al. Pyruvate kinase M2 is a PHD3-stimulated coactivator for hypoxia-inducible factor 1. Cell. 2011;145:732–744. doi: 10.1016/j.cell.2011.03.054. [DOI] [PMC free article] [PubMed] [Google Scholar]
- 40.Shirai T, et al. The glycolytic enzyme PKM2 bridges metabolic and inflammatory dysfunction in coronary artery disease. J Exp Med. 2016;213:337–354. doi: 10.1084/jem.20150900. [DOI] [PMC free article] [PubMed] [Google Scholar]
- 41.Yang W, Lu Z. Nuclear PKM2 regulates the Warburg effect. Cell Cycle. 2013;12:3154–3158. doi: 10.4161/cc.26182. [DOI] [PMC free article] [PubMed] [Google Scholar]
- 42.Yang W, et al. Nuclear PKM2 regulates β-catenin transactivation upon EGFR activation. Nature. 2011;480:118–122. doi: 10.1038/nature10598. [DOI] [PMC free article] [PubMed] [Google Scholar]
- 43.Christofk HR, Vander Heiden MG, Wu N, Asara JM, Cantley LC. Pyruvate kinase M2 is a phosphotyrosine-binding protein. Nature. 2008;452:181–186. doi: 10.1038/nature06667. [DOI] [PubMed] [Google Scholar]
- 44.Hitosugi T, et al. Tyrosine phosphorylation inhibits PKM2 to promote the Warburg effect and tumor growth. Sci Signal. 2009;2:ra73. doi: 10.1126/scisignal.2000431. [DOI] [PMC free article] [PubMed] [Google Scholar]
- 45.Chaneton B, et al. Serine is a natural ligand and allosteric activator of pyruvate kinase M2. Nature. 2012;491:458–462. doi: 10.1038/nature11540. [DOI] [PMC free article] [PubMed] [Google Scholar]
- 46.Breyer MD, et al. Mouse models of diabetic nephropathy. J Am Soc Nephrol. 2005;16:27–45. doi: 10.1681/ASN.2004080648. [DOI] [PubMed] [Google Scholar]
- 47.Brosius FC, III, et al. Mouse models of diabetic nephropathy. J Am Soc Nephrol. 2009;20:2503–2512. doi: 10.1681/ASN.2009070721. [DOI] [PMC free article] [PubMed] [Google Scholar]
- 48.Qi Z, et al. Characterization of susceptibility of inbred mouse strains to diabetic nephropathy. Diabetes. 2005;54:2628–2637. doi: 10.2337/diabetes.54.9.2628. [DOI] [PubMed] [Google Scholar]
- 49.Takahashi T, Harris RC. Role of endothelial nitric oxide synthase in diabetic nephropathy: lessons from diabetic eNOS knockout mice. J Diabetes Res. 2014;2014:590541. doi: 10.1155/2014/590541. [DOI] [PMC free article] [PubMed] [Google Scholar]
- 50.Gao BB, Stuart L, Feener EP. Label-free quantitative analysis of one-dimensional PAGE LC/MS/MS proteome: application on angiotensin II-stimulated smooth muscle cells secretome. Mol Cell Proteomics. 2008;7:2399–2409. doi: 10.1074/mcp.M800104-MCP200. [DOI] [PMC free article] [PubMed] [Google Scholar]
- 51.Niewczas MA, et al. Circulating TNF receptors 1 and 2 predict ESRD in type 2 diabetes. J Am Soc Nephrol. 2012;23:507–515. doi: 10.1681/ASN.2011060627. [DOI] [PMC free article] [PubMed] [Google Scholar]
- 52.Sakairi T, et al. Conditionally immortalized human podocyte cell lines established from urine. Am J Physiol Renal Physiol. 2010;298:F557–F567. doi: 10.1152/ajprenal.00509.2009. [DOI] [PMC free article] [PubMed] [Google Scholar] [Retracted]
- 53.Shankland SJ, Pippin JW, Reiser J, Mundel P. Podocytes in culture: past, present, and future. Kidney Int. 2007;72:26–36. doi: 10.1038/sj.ki.5002291. [DOI] [PubMed] [Google Scholar]
- 54.Coppey LJ, et al. Effect of antioxidant treatment of streptozotocin-induced diabetic rats on endoneurial blood flow, motor nerve conduction velocity, and vascular reactivity of epineurial arterioles of the sciatic nerve. Diabetes. 2001;50:1927–1937. doi: 10.2337/diabetes.50.8.1927. [DOI] [PubMed] [Google Scholar]
- 55.Li B, et al. Fructose-1,6-bisphosphatase opposes renal carcinoma progression. Nature. 2014;513:251–255. doi: 10.1038/nature13557. [DOI] [PMC free article] [PubMed] [Google Scholar]
- 56.Inoguchi T, et al. Insulin’s effect on protein kinase C and diacylglycerol induced by diabetes and glucose in vascular tissues. Am J Physiol. 1994;267:E369–E379. doi: 10.1152/ajpendo.1994.267.3.E369. [DOI] [PubMed] [Google Scholar]
- 57.Massart J, Zierath JR, Chibalin AV. A simple and rapid method to characterize lipid fate in skeletal muscle. BMC Res Notes. 2014;7:391. doi: 10.1186/1756-0500-7-391. [DOI] [PMC free article] [PubMed] [Google Scholar]
- 58.Brown JM, et al. Isomer-specific regulation of metabolism and PPAR signaling by CLA in human preadipocytes. J Lipid Res. 2003;44:1287–1300. doi: 10.1194/jlr.M300001-JLR200. [DOI] [PMC free article] [PubMed] [Google Scholar]
- 59.Nemet I, Varga-Defterdarović L, Turk Z. Preparation and quantification of methylglyoxal in human plasma using reverse-phase high-performance liquid chromatography. Clin Biochem. 2004;37:875–881. doi: 10.1016/j.clinbiochem.2004.05.024. [DOI] [PubMed] [Google Scholar]
- 60.Sweetwyne MT, et al. Notch1 and Notch2 in podocytes play differential roles during diabetic nephropathy development. Diabetes. 2015;64:4099–4111. doi: 10.2337/db15-0260. [DOI] [PMC free article] [PubMed] [Google Scholar]
- 61.Takemoto M, et al. A new method for large scale isolation of kidney glomeruli from mice. Am J Pathol. 2002;161:799–805. doi: 10.1016/S0002-9440(10)64239-3. [DOI] [PMC free article] [PubMed] [Google Scholar]
- 62.Advani A, et al. Expression, localization, and function of the thioredoxin system in diabetic nephropathy. J Am Soc Nephrol. 2009;20:730–741. doi: 10.1681/ASN.2008020142. [DOI] [PMC free article] [PubMed] [Google Scholar]
- 63.Isermann B, et al. Activated protein C protects against diabetic nephropathy by inhibiting endothelial and podocyte apoptosis. Nat Med. 2007;13:1349–1358. doi: 10.1038/nm1667. [DOI] [PubMed] [Google Scholar]
- 64.Ma LJ, et al. Divergent effects of low versus high dose anti-TGF-β antibody in puromycin aminonucleoside nephropathy in rats. Kidney Int. 2004;65:106–115. doi: 10.1111/j.1523-1755.2004.00381.x. [DOI] [PubMed] [Google Scholar]
- 65.Zhao HJ, et al. Endothelial nitric oxide synthase deficiency produces accelerated nephropathy in diabetic mice. J Am Soc Nephrol. 2006;17:2664–2669. doi: 10.1681/ASN.2006070798. [DOI] [PMC free article] [PubMed] [Google Scholar]
- 66.Pisania A, et al. Quantitative analysis of cell composition and purity of human pancreatic islet preparations. Lab Invest. 2010;90:1661–1675. doi: 10.1038/labinvest.2010.124. [DOI] [PMC free article] [PubMed] [Google Scholar]
Associated Data
This section collects any data citations, data availability statements, or supplementary materials included in this article.