

Abstract
Near-infrared (NIR) fluorophores have several advantages over visible-light fluorophores, including superior tissue penetration and lower autofluorescence. We recently accessed a new class of readily synthesized NIR cyanines containing a novel C4′-O-alkyl linker, which provides both high chemical stability and excellent optical properties. In this study, we provide the first in vivo analysis of this new class of compounds, represented by the tetrasulfonate FNIR-774 (Frederick NIR 774). Monoclonal antibody (mAb) conjugates of FNIR-774 were compared to conjugates of the commercially available dye (IRDye800CW (IR800)), one of the most widely used NIR fluorophores for clinical translation. Both dyes were conjugated to panitumumab (pan) or cetuximab (cet) with ratios of 1:2 or 1:5. Conjugates of both dyes demonstrated similar quenching capacity, stability, and brightness in target cells in vitro. In contrast, in vivo imaging in mice showed different pharmacokinetics between pan-FNIR-774 (1:5) and pan-IR800 (1:5), or cet-FNIR-774 (1:5) and cet-IR800 (1:5). Particularly at the higher labeling density, mAb-FNIR-774 conjugates showed superior specific accumulation in tumors compared with mAb-IR800 conjugates. Thus, FNIR-774 conjugates showed superior in vivo pharmacokinetics compared with IR800 conjugates, independent of the mAb. These results suggest that FNIR-774 is a promising fluorescent probe for NIR optical imaging.
Keywords: cyanine, in vivo imaging, near-infrared (NIR) fluorophores, monoclonal antibody (mAb) conjugates
Graphical abstract
INTRODUCTION
Optical molecular imaging with monoclonal antibodies (mAbs) has considerable potential for diagnosis and evaluation of therapy response of cancers especially during surgical or endoscopic procedures.1–3 MAbs labeled with fluorescent probes permit real-time, high-resolution in vivo imaging that is suitable for detecting early stage or residual cancer during surgery.3 Among the available fluorescent probes, near-infrared (NIR) fluorophores that emit light in the range of 650 to 850 nm offer several advantages over visible fluorophores including superior tissue penetration and lower autofluorescence in vivo.4–6
Desirable optical, chemical, and biological characteristics of NIR fluorophores include high extinction coefficients, high quantum yields, minimal nonspecific binding to peptides or proteins, and minimal changes in in vivo biodistribution of targeting ligands after conjugation.7 Among the commercially available NIR dyes, IRDye800CW (IR800, Licor Bioscience, Lincoln, NE) possesses these favorable characteristics and, therefore, has been widely used as a NIR fluorophore for labeling target ligands in preclinical studies.8–11 Additionally, a good manufacturing, practice-compliant production (GMP) grade of IR800 has already received investigative new drug (IND) status for clinical studies by the US FDA, and the initial results of these studies using antibody-IR800 conjugates are promising.12,13 However, key chemical characteristics of NIR fluorescent probes still require optimization for certain applications.14 Key considerations include moderating net charge, charge distribution in the molecule, hydrophilicity, stability in oxidative or reducing conditions, and a readily scalable synthesis.
Consequently, the development of new NIR fluorophores with improved characteristics remains a critical goal. We have designed and synthesized a new cyanine-based NIR fluorophore, FNIR-774 (Frederick NIR 774), which preserves the highly sulfonated structure of IR800 while transferring the bioconjugatable linker to a central C4′-O-alkyl bond. FNIR-774 can be prepared quite efficiently through a high yielding concise synthesis that features an unusual electrophile-integrating Smiles rearrangement.15 Potential benefits of this novel scaffold include the symmetrical distribution of charged functional groups. Moreover, we have shown that the C4′ ether bond is highly stable to thiol nucleophiles.15 By contrast, C4′ phenol-substituted cyanines are known to react with thiols, which has been problematic in several settings.16–19
In this study, we compare the in vitro and in vivo characteristics of mAb-IR800 and mAb-FNIR-774 conjugates.
MATERIALS AND METHODS
Reagents
IRDye 800CW NHS ester was obtained from LI-COR Bioscience (Lincoln, NE, USA). The cyanine dye, FNIR-774, was synthesized as described before.15 Panitumumab, a fully humanized IgG2 mAb directed against EGFR, was purchased from Amgen (Thousand Oaks, CA, USA). Cetuximab, a chimeric (mouse/human) mAb directed against EGFR, was purchased from Bristol-Meyers Squibb Co. (Princeton, NJ, USA). All other chemicals were of reagent grade.
Synthesis of IR800/FNIR-774-Conjugated Panitumumab and Cetuximab
Conjugation of dyes with mAbs was performed according to previous reports.20 In brief, for conjugation 1:2 (2 dyes per 1 antibody), panitumumab or cetuximab (1 mg, 6.8 nmol) was incubated with IR800CW NHS ester/FNIR-774 (30.8 nmol) in 0.1 mol/L Na2HPO4 (pH 8.5), for conjugation 1:5 (5 dyes per 1 antibody), panitumumab or cetuximab (1 mg, 6.8 nmol) was incubated with IR800CW NHS ester or FNIR-774 (68 nmol) in 0.1 mol/L Na2 HPO4 (pH 8.5) at room temperature for 1 h. The mixture was purified with a Sephadex G25 column (PD-10; GE Healthcare, Piscataway, NJ, USA). The protein concentration was determined with the Coomassie Plus protein assay kit (Thermo Fisher Scientific Inc., Rockford, IL, USA) by measuring absorption at 595 nm (8453 Value System; Agilent Technologies, Santa Clara, CA, USA). The concentration of dye was measured respectively by absorption at 774 nm to confirm the number of fluorophore molecules conjugated to each mAb. The synthesis was controlled so that an average of two or five dye molecules were bound to a single antibody, respectively. We performed SDS-PAGE as a quality control for each conjugate as previously reported.20 We abbreviate IR800 or FNIR-774 conjugated to panitumumab or cetuximab with two ratios as pan-IR800 (1:2), cet-IR800 (1:2), pan-FNIR-774 (1:2), cet-FNIR-774 (1:2), pan-IR800 (1:5), cet-IR800 (1:5), pan-FNIR-774 (1:5), and cet-FNIR-774 (1:5), respectively. We used diluted cetuximab and panitumumab (2 µg) as non-conjugated controls for SDS-PAGE, and the fluorescent bands were measured with a Pearl Imager (LI-COR Biosciences) with a 800 nm fluorescence channel.
Determination of Quenching Capacity in Vitro
The quenching capacity of each conjugate was investigated by denaturation with 1% SDS. Briefly, the conjugates were incubated with 1% SDS in phosphate-buffered saline (PBS) for 15 min at room temperature. As a control, the samples were incubated in PBS. The change in fluorescence signal intensity of IR800 and FNIR-774 was investigated with a Pearl Imager at 800 nm channel. Regions of interest (ROIs) were placed on 800 nm channel images with reference to white light images to measure fluorescence intensities of solutions. The Pearl software was used for calculating ROI signal data.
Cell Culture
EGFR expressing MDA-MB-468 cells (human breast cancer) were used. Balb/3T3 cells were transfected with RFP (EF1a)-Neo lentiviral particles (AMSBIO, Cambridge, MA, USA). High, stable RFP expression was confirmed after 10 passages in the absence of a selection agent. Cells were grown in RPMI 1640 (Life Technologies, Gaithersburg, MD, USA) supplemented with 10% fetal bovine serum and 1% penicillin/streptomycin (Life Technologies) in tissue culture flasks in a humidified incubator at 37 °C at an atmosphere of 95% air and 5% carbon dioxide.
Flow Cytometry
IR800/FNIR-774-conjugate fluorescence was measured using a flow cytometer (FACS Calibur, BD BioSciences, San Jose, CA, USA) and analyzed with CellQuest software (BD BioSciences). Cells (1 × 10⁵) were incubated with each conjugate (10 µg/mL) for 1 h at 4 °C, then 6 h at 37 °C. To validate the specific binding of the conjugated antibody, excess antibody (50 µg) was used to block 0.5 µg of conjugates.
Fluorescence Microscopy
To detect the antigen specific localization of each conjugate, fluorescence microscopy was performed with a confocal laser microscope (LSM5 meta, Carl Zeiss, Jena, Germany). Ten thousand cells were seeded on cover-glass-bottomed dishes and incubated for 24 h. Each mAb-dye conjugate was then added to the culture medium at 10 µg/mL and incubated at 4 °C (on ice) for 1 h. After 1 h incubation on ice, the media with conjugates was changed to new media (containing no conjugates), then cells were observed after 6 h incubation at 37 °C.
Following 1 h incubation with each conjugate and confirmation of fluorescence signal, cells were washed with medium, and new medium was added and incubated for 3 days. Then, cells were observed with microscopy.
Analysis of the images was performed with ZEN software (Carl Zeiss).
Immunoreactivity of mAb-dye Conjugates (1:5)
To determine the in vitro binding characteristics of the IR800/FNIR-774 conjugates, pan-IR800 (1:5), pan-FNIR-774 (1:5), cet-IR800 (1:5), or cet-FNIR-774 (1:5) were labeled with 125I using the Indo-Gen procedure. The specific activities of the radiolabeled antibodies were 11.2, 15.3, 14.9, and 16.2 mCi/mg for pan-IR800 (1:5), pan-FNIR-774 (1:5), cet-IR800 (1:5), or cet-FNIR-774 (1:5), respectively. After trypsinization, 106 MDA-MB-468 cells were resuspended in PBS containing 1% bovine serum albumin (BSA). 125I-pan-IR800 (1:5), 125I-pan-FNIR-774 (1:5), 125I-cet-IR800 (1:5), or 125I-cet-FNIR-774 (1:5) (0.2 µg) was added and incubated for 0.5 and 2 h on ice. Cells were washed, pelleted, the supernatant decanted, and counted in a γ-counter (2470 Wizard2, PerkinElmer, Woodlands, TX, USA). Nonspecific binding to the cells was examined under conditions of antibody excess by adding 100 µg of respective nonlabeled mAbs.
Animal and Tumor Models
All in vivo procedures were conducted in compliance with the Guide for the Care and Use of Laboratory Animal Resources (1996), US National Research Council, and approved by the local Animal Care and Use Committee. Six- to eight-week-old female homozygote athymic nude mice were purchased from Charles River (NCI-Frederick). During procedures, mice were anesthetized with isoflurane.
Six million MDA-MB-468 cells were injected subcutaneously in the right dorsum. The experiments were performed at 14 day after cell injection. Tumors reaching approximately 10 mm in length were selected for the study. To avoid autofluorescence in the intestine, mice were fed with white food from 7 days after cell injection.
In Vivo Fluorescence Imaging
In vivo fluorescence images were obtained with a Pearl Imager (LI-COR Bioscience) before and after intravenous injection of 50 µg of each conjugate or same dose of dyes. After intravenous injection, at 1 h, 3 h, 6 h, 1 day, 2 days, 3 days, 4 days, 5 days, 6 days, 7 days, and 14 days, mice were imaged. The mice injected the same dose of each dye were side-by-side imaged in the same field with a Pearl Imager. Equal sized ROIs were manually drawn on each tumor, and fluorescence intensity at 800 nm channel was measured. When comparing fluorescence, the software Pearl Cam (LI-COR Biosciences) was used for calculating ROI signal data of each point. The average fluorescence intensity of each ROI was measured, and ROIs were placed in the adjacent nontumor region (e.g., a symmetrical region to the left of the tumor). Tumor-to-background ratio (TBR) was calculated using the following formula: TBR = ((mean tumor intensity) − (mean background intensity))/((mean nontumor intensity) − (mean background intensity)). Tumor-to-liver ratio (TLR) was calculated using the following formula: TLR = ((mean tumor intensity) − (mean background intensity))/((mean liver intensity) − (mean background intensity)).
Statistical Analysis
Data are expressed as means ± SEM from a minimum of three experiments, unless otherwise indicated. Statistical analyses were carried out using a statistics program (GraphPad Prism; GraphPad Software, La Jolla, CA, USA).
RESULTS
Characterization of IR800CW and FNIR-774 mAb Conjugates
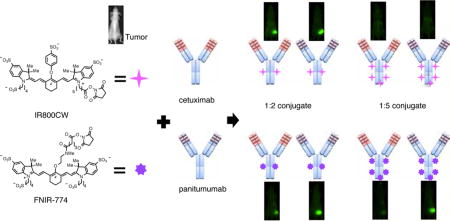
IR800 and FNIR-774 were conjugated to panitumumab or cetuximab at a ratio of 2:1 or 5:1 (Figure 1). By adding 1% SDS to dye-conjugated antibodies, the following dequenching capacities were observed: 1.63-, 1.33-, 2.68-, 1.74-, 2.36-, 1.88-, 3.57-, and 2.42-fold for pan-IR800 (1:2), pan-FNIR-774 (1:2), pan-IR800 (1:5), pan-FNIR-774 (1:5), cet-IR800 (1:2), cet-FNIR-774 (1:2), cet-IR800 (1:5), and cet-FNIR-774 (1:5), respectively (Figure 2A). As defined by SDS-PAGE, the fractions of covalently bound dyes to panitumumab were 84.4, 86.1, 72.4 and 79.6% for pan-IR800 (1:2), pan-FNIR-774 (1:2), pan-IR800 (1:5), and pan-FNIR-774 (1:5), respectively (Figure 2B). The fractions of covalently bound dyes to cetuximab were 76.2, 80.2, 70.1, and 73.3% for cet-IR800 (1:2), cet-FNIR-774 (1:2), cet-IR800 (1:5), and cet-FNIR-774 (1:5), respectively (Figure 2B). Using 2 µg of each conjugate, IR800 had somewhat higher fluorescence than FNIR-774, regardless of antibody, which was quantified by the fluorescence intensity/band of each conjugate (Figure 2B). Taken together, these data suggested that both IR800 conjugates and FNIR-774 conjugates have similar chemical stability.
Figure 1.

Schematic representation of IR800CW or FNIR-774 of 1:2 or 1:5 conjugates to cetuximab or panitumumab. Commercially available IR800CW and newly synthesized FNIR-774 were conjugated to cetuximab or panitumumab with ratio of 1:2 or 1:5.
Figure 2.

In vitro characterization of IR800CW or FNIR-774 conjugates. (A) The white image (left) and fluorescence (right) images of conjugates. With SDS, the conjugates are chemically dequenched. Dequenching capacities were shown on the right. Regardless of the abs, IR800 conjugates had higher dequenching capacities than FNIR-774 suggesting higher protein binding. The ratio of fold increase is summarized in the box. (B) Validation of the conjugates by SDS-PAGE. The fluorescence intensity/band of each conjugate was quantified (n = 3).
Characterization and Observation of IR800CW or FNIR-774 Conjugates in in Vitro Cell Cultures
To evaluate specific binding and fluorescence intensity of each conjugate, flow cytometric analysis on MDA-MB-468 cells was performed. Fluorescence intensity of each conjugate at 6 h incubation was higher than that at 1 h incubation. With the same concentration of each conjugate at 6 h incubation, similar binding intensities were detected with IR800 and FNIR-774, regardless of dye-to-mAb ratios (Figure 3A). Binding of each conjugate to MDA-MB-468 was completely blocked by the addition of excess mAb, suggesting specific binding (Figure 3A). We analyzed the in vitro specific binding (%binding − %nonspecific binding) of the pan-IR800 (1:5), pan-FNIR-774 (1:5), cet-IR800 (1:5), or cet-FNIR-774 (1:5) conjugates in a binding assay using 125I-labeling. After 0.5 h incubation, 75.1%, 74.8%, 72.3%, or 74.1% binding was achieved, and after 2 h incubation, 79.4%, 82.6%, 77.9%, or 80.1% binding was achieved for pan-IR800 (1:5), pan-FNIR-774 (1:5), cet-IR800 (1:5), or cet-FNIR-774 (1:5) conjugates, respectively (Table 1), that showed no decrease of immunoreactivity after conjugation with either IR800 or FNIR-774 because immunoreactive fraction of 125I-labeled non-conjugated antibodies were around 82% by using this cell binding method. Nonspecific binding was less than 6%. The data showed both IR800 and FNIR-774 did not compromise the specific binding of antibody to EGFR regardless of conjugation ratios. Serial fluorescence microscopy of MDA-MB-468 and 3T3-RFP cells was performed after incubation for 1 h at 4 °C (on ice) (Figure 3B). Each conjugate bound to the MDA-MB-468 cell surface but brighter fluorescence was detected with 1:5 conjugates than 1:2, regardless of the dyes used. 3T3-RFP (EGFR negative) had no IR800/FNIR-774 fluorescence, suggesting specific binding to EGFR (Figure 3B). After replacement of the medium and 6 h incubation, each conjugate was endocytosed in a similar way. These results suggest that both IR800 and FNIR-774 conjugates specifically bound to target cells and have similar fluorescence in in vitro cell culture.
Figure 3.

Characterization and observation of IR800CW or FNIR-774 conjugates in in vitro cell cultures. (A) Fluorescence of EGFR expressing MDA-MB-468 cells incubated with the conjugates was evaluated by flow cytometry. MDA-MB-468 cells incubated 1 h incubation on ice, and then cells were observed after 6 h incubation. Similar fluorescence signals were detected with each conjugate at 6 h incubation. (B) Microscopic observation of MDA-MB-468 cells incubated on ice for 1 h with each conjugate (upper). After 1 h incubation on ice, the media with conjugates was changed to new media, and then cells were observed after 6 h incubation (lower). EGFR nonexpressing 3T3-RFP cells (*) were used for nontarget controls. Bar = 25 µm.
Table 1.
Immunoreactivity of mAb-Dye Conjugates (1:5)a
| pan-IR800 (1:5) |
pan-FNIR-774 (1:5) |
cet-IR800 (1:5) |
cet-FNIR-774 (1:5) |
|
|---|---|---|---|---|
| 0.5 h | 75.1% | 74.8% | 72.3% | 74.1% |
| 2 h | 79.4% | 82.6% | 77.9% | 80.1% |
In vitro specific binding (%binding - %nonspecific binding) of the pan-IR800 (1:5), pan-FNIR-774 (1:5), cet-IR800 (1:5), or cet-FNIR-774 (1:5) conjugates in a binding assay using 125I-labeling were summarized.
Stability of Dye-Conjugations in in Vitro Cell Cultures
In order to assess the stability of dyes after endocytosis, microscopy was performed at 3 days after 1 h incubation with each conjugate (Figure 4A). Regardless of the antibody or antibody-dye ratios, the fluorescence of both IR800 and FNIR-774 was preserved at day 3 (Figure 4B). These results show that both IR800 conjugates and FNIR-774 conjugates demonstrated similar stability after internalization.
Figure 4.

Fluorescence stability of in vitro cell cultures. (A) Regimen of the evaluation of fluorescence stability in in vitro cell culture. (B) Microscopic observation of MDA-MB-468 cells along the regimen. Both IR800 and FNIR-774 were still fluorescent at the time of observation.
Confirmation of Rapid Urinary Excretion of Free Dye in Vivo
To confirm the difference of free dye excretion in vivo between free IR800 and FNIR-774 dye, in vivo imaging with intravenous injection of each dye was performed (Figure 5). With the same dose injection, FNIR-774 was more rapidly excreted by kidney than IR800. Neither IR800 nor FNIR-774 dye accumulated into the tumor. These data suggest that both dyes are immediately excreted by the kidney.
Figure 5.

In vivo serial fluorescence images of free dyes. In vivo serial fluorescence images of MDA-MB-468 tumor bearing mice (right dorsum) injected with each free dye. Both free dyes were excreted to the urine immediately after injection. FNIR-774 dye showed a more rapid clearance than IR800 dye (n = 5 in each dye).
Comparison of Biodistribution and Tumor Accumulation between mAb-IR800 and FNIR-774 Conjugates
To demonstrate whether IR800 and FNIR-774 conjugates exhibited differences in pharmacokinetics, in vivo imaging comparing conjugates with the same ratio of IR800 and FNIR-774 was performed in a serial manner. With 1:2 ratio conjugates of panitumumab or cetuximab, both IR800 and FNIR-774 had similar high tumor fluorescence during short-term imaging (Figures 6A and S1). However, with 1:5 ratio conjugates of panitumumab or cetuximab, the FNIR-774 conjugate had higher tumor fluorescence than the IR800 conjugate (Figures 6A and S1). Although both IR800 and FNIR-774 conjugates (1:5) rapidly accumulated in the liver (between 1 to 6 h p.i.), FNIR-774 conjugates (1:5) also accumulated within the tumor while IR800 conjugates (1:5) did not, suggesting that the FNIR-774 conjugate (1:5) is more stable in the liver and was not as rapidly catabolized. IR800 conjugates (1:5) were excreted into the intestine, while FNIR-774 conjugates (1:5) were not (1 to 6 h p.i.) (Figure 6A and Figure S1). The in vivo imaging results were confirmed with ex vivo analysis at 24 h after injection (Figure 6B). With comparison of the same dye at antibody-dye ratios of 1:2 and 1:5, pan-IR800 (1:5) and cet-IR800 (1:5) conjugates immediately accumulated in the liver and were catabolized, resulting in less tumor accumulation than pan-IR800 (1:2) and cet-IR800 (1:2), while FNIR-774 conjugates accumulated within the tumor regardless of ratios (Figure S2A). This demonstration was again confirmed with ex vivo analysis at 24 h postinjection (Figure S2B). Collectively, these data suggest that FNIR-774 has superior in vivo imaging characteristics when bound to a mAb and that even at a mAb-dye ratio of 1:5 the FNIR-774 fluorophore was still useful to detect target tumors with high tumor-to-background ratio.
Figure 6.

In vivo serial fluorescence images of each conjugate. (A) In vivo serial fluorescence images of MDA-MB-468 tumor bearing mice (right dorsum) injected with each conjugate. A comparison of IR800 or FNIR-774 conjugates was performed. Mice were compared with each other side by side with the same field and imaged. (B) Ex vivo fluorescence images of liver, kidney, and MDA-MB-468 tumor obtained at 24 h after injection.
To further demonstrate whether IR800 and FNIR-774 conjugates exhibited difference in long-term pharmacokinetics, in vivo imaging was used to compare the same ratio conjugates with different fluorophores for 14 days. With 1:2 ratio conjugates of panitumumab or cetuximab, both IR800 and FNIR-774 had similar high tumor fluorescence and retained fluorescence over 2 weeks (Figure S3A). At 14 days after injection, both IR800 and FNIR-774 fluorescence of 1:2 conjugates demonstrated similar intensity within the target tumor, regardless of the antibody (Figure S3B). Pan-FNIR-774 (1:5) and cet-FNIR-774 (1:5) were detected in tumor even at 14 days, whereas pan-IR800 (1:5) or cet-IR800 (1:5) were barely detectable (Figure S3A,B). These data suggested that while both dye conjugates of 1:2 ratio showed similar fluorescence stabilities in vivo, FNIR-774 conjugates were advantageous for in vivo imaging since the 1:5 conjugates accumulated cells within tumors and retained fluorescence.
Evaluation of Tumor-to-Background Ratio (TBR) and Tumor-to-Liver Ratio (TLR)
To quantitatively evaluate fluorescence intensities in tumor-bearing mice given pan-IR800 (1:2), pan-IR800 (1:5), pan-FNIR-774 (1:2), pan-FNIR-774 (1:5), cet-IR800 (1:2), cet-IR800 (1:5), cet-FNIR-774 (1:2), or cet-FNIR-774 (1:5), TBR and TLR were assessed (n = 5 mice each conjugate) (Figure 7). Pan-IR800 (1:2) showed 3.5 times higher TBR than pan-IR800 (1:5) at 24 h, while pan-FNIR-774 (1:2) showed similar TBR to pan-FNIR-774 (1:5). Pan-800 (1:2), pan-FNIR-774 (1:2), and pan-FNIR-774 (1:5) had similar TBR at 24 h. The difference in TBR among pan-IR800 (1:2), pan-FNIR-774 (1:2), and pan-FNIR-774 (1:5) became bigger after 24 h since pan has good retention in mice.20 Pan-IR800 (1:2) showed 5 times higher TLR than pan-IR800 (1:5) at 24 h and, pan-FNIR-774 (1:2) showed 1.6 times higher TLR than pan-FNIR-774 (1:5). These data suggested that pan-IR800 (1:5) was catabolized in the liver, while pan-FNIR-774 (1:5) initially was taken up in the liver but was not catabolized immediately, resulting in good TBR. Cet-IR800 (1:2) showed 3.4 times higher TBR than cet-IR800 (1:5) at 24 h, while cet-FNIR-774 (1:2) showed similar TBR to cet-FNIR-774 (1:5), which is almost the same as panitumumab conjugates. Cet-IR800 (1:2), cet-FNIR-774 (1:2), and cet-FNIR-774 (1:5) showed similar TBR after 24 h, due to reduced retention of cetuximab, which is different from conjugates with panitumumab.20 Cet-IR800 (1:2) showed 5.6 times higher TLR than cet-IR800 (1:5) at 24 h, cet-FNIR-774 (1:2) showed 1.4 times higher TLR than cet-FNIR-774 (1:5). These data suggested that cet-IR800 (1:5) was catabolized in the liver, while cet-FNIR-774 (1:5) initially was taken up in the liver but was not catabolized, resulting in good TBR. These data suggested that FNIR-774 has superior tumor imaging characteristics to IR800 regardless of mAb-dye ratios.
Figure 7.

Tumor background ratio (TBR) and tumor liver ratio (TLR). Tumor background ratio (TBR) and tumor liver ratio (TLR) of conjugates injected in MDMB468 tumor bearing mice (n = 5).
DISCUSSION
In this study, we investigated optical probes targeting EGFR with two different US FDA-approved monoclonal antibodies, panitumumab and cetuximab, and compared the in vitro and in vivo imaging properties between mAb conjugates of IR800 and FNIR-774 at two different mAb-dye ratios (1:2, 1:5). Both mAbs recognize the same epitope on the EGFR molecule. However, with the minimal modification from fluorophore conjugation, the cetuximab-based conjugates, but not pantiumumab conjugates, exhibit significantly altered in vivo pharmacokinetics likely due to higher liver uptake resulting in lower tumor accumulation.20 Therefore, from the conjugation chemistry point of view, comparison of these two antibody-conjugates at two different mAb-dye ratios provides meaningful insight. All the mAb-dye conjugates exhibited similar fluorescence and stability in in vitro cell cultures regardless of mAb or mAb-dye ratio. In contrast, higher tumor accumulation was detected in vivo with FNIR-774 (1:5) conjugates than IR800 (1:5) conjugates due to faster hepatic accumulation of IR800 (1:5) conjugates. As in vitro studies demonstrated that immunoreactive fraction of both conjugates was preserved, altered biodistribution appears to be the critical factor leading to this differentiated tumor accumulation. By contrast, the 1:2 conjugates accumulated in target tumors to a similar degree, likely as a consequence of reduced initial hepatic uptake. In total, these data suggest that FNIR-774 has superior in vivo fluorescence imaging properties compared to IR800, especially at high dye-to-mAb conjugation ratios.
A growing number of humanized mAbs directed against tumor-specific cell surface antigens have gained FDA approval and are successfully used in the clinic.21 When labeled with optical “beacons,” these mAbs could be used to diagnose and treat cancers. Such antibodies can be “labeled” with chelates that hold radioactive metals and noninvasively used for diagnosis and therapy in the whole body. Immuno-PET, for instance, is sensitive for cancer; however, it requires ionizing radiation and may take several days to complete.2 Optical imaging depicts only the near surface, yet allows us to perform high-resolution, dynamic, real-time imaging of targeted lesions without radiation.22 Therefore, optical labeling is most useful for assisting operators during surgery or endoscopic procedures. NIR camera systems for assisting surgery in surgical suites have already been reported.14 Therefore, it is quite plausible that mAb-FNIR-774 conjugates could be adapted for clinical use. Because optical imaging is simple and inexpensive compared with other imaging methods, this technology may be readily translatable into clinical contexts.
CONCLUSION
In conclusion, the novel NIR fluorescent probe, FNIR-774, which can be easily and efficiently prepared, has favorable in vivo target tumor-specific accumulation that may make it superior to existing NIR dyes. These studies provide support for the notion that seemingly minor variations in the chemical structure of the fluorophore can have a dramatic impact on pharmacokinetics and tumor accumulation of antibody conjugates. Ongoing efforts to utilize the advantages of our concise synthesis to develop cyanines that are chemically tuned for specific in vivo applications will be reported in due course.
Supplementary Material
Acknowledgments
This research was supported by the Intramural Research Program of the National Institutes of Health, National Cancer Institute, Center for Cancer Research. This project has been funded in whole or in part with Federal funds from the National Cancer Institute, National Institutes of Health, under Contract No. HHSN261200800001E. The content of this publication does not necessarily reflect the views or policies of the Department of Health and Human Services, nor does mention of trade names, commercial products, or organizations imply endorsement by the U.S. Government.
Footnotes
ASSOCIATED CONTENT
- In vivo serial fluorescence images of each conjugate (short-term comparison between 1:2 and 1:5 conjugates) (PDF)
Author Contributions
K.S. mainly designed and conducted experiments, made the study concept, performed analysis, and wrote the manuscript. T.N., Y.N., and T.H. did the analysis. R.R.N. and J.B.S synthesized FNIR-774. A.P.G. conducted experiments. I.K. and C.H.P. conducted the radiolabeled experiment. P.L.C. wrote the manuscript and supervised the project. M.J.S designed experiments and wrote the manuscript. H.K. planned the project, designed experiments, wrote the manuscript, and supervised the entire project.
The authors declare no competing financial interest.
References
- 1.Weissleder R, Pittet MJ. Imaging in the Era of Molecular Oncology. Nature. 2008 Apr;452:580–589. doi: 10.1038/nature06917. [DOI] [PMC free article] [PubMed] [Google Scholar]
- 2.Kaur S, Venktaraman G, Jain M, Senapati S, Garg PK, Batra SK. Recent Trends in Antibody-Based Oncologic Imaging. Cancer Lett. 2012;315(2):97–111. doi: 10.1016/j.canlet.2011.10.017. [DOI] [PMC free article] [PubMed] [Google Scholar]
- 3.Keereweer S, Van Driel PB, Snoeks TJ, Kerrebijn JDF, De Jong RJB, Vahrmeijer AL, Sterenborg HJCM, Löwik CWGM. Optical Image-Guided Cancer Surgery: Challenges and Limitations. Clin. Cancer Res. 2013;19:3745–3754. doi: 10.1158/1078-0432.CCR-12-3598. [DOI] [PubMed] [Google Scholar]
- 4.Hilderbrand Sa, Weissleder R. Near-Infrared Fluorescence: Application to in Vivo Molecular Imaging. Curr. Opin. Chem. Biol. 2010;14:71–79. doi: 10.1016/j.cbpa.2009.09.029. [DOI] [PubMed] [Google Scholar]
- 5.Weissleder R. A Clearer Vision for in Vivo Imaging Progress Continues in the Development of Smaller, More Penetrable Probes for Biological Imaging. Toward the Phosphoproteome. Nat. Biotechnol. 2001;19:316–317. doi: 10.1038/86684. [DOI] [PubMed] [Google Scholar]
- 6.Frangioni JV. In Vivo Near-Infrared Fluorescence Imaging. Curr. Opin. Chem. Biol. 2003;7:626–634. doi: 10.1016/j.cbpa.2003.08.007. [DOI] [PubMed] [Google Scholar]
- 7.Kobayashi H, Longmire MR, Ogawa M, Choyke PL. Rational Chemical Design of the Next Generation of Molecular Imaging Probes Based on Physics and Biology: Mixing Modalities, Colors and Signals. Chem. Soc. Rev. 2011;40:4626–4648. doi: 10.1039/c1cs15077d. [DOI] [PMC free article] [PubMed] [Google Scholar]
- 8.Luo S, Zhang E, Su Y, Cheng T, Shi C. A Review of NIR Dyes in Cancer Targeting and Imaging. Biomaterials. 2011;32(29):7127–7138. doi: 10.1016/j.biomaterials.2011.06.024. [DOI] [PubMed] [Google Scholar]
- 9.Korb ML, Hartman YE, Kovar J, Zinn KR, Bland KI, Rosenthal EL. Use of Monoclonal Antibody-IRDye800CW Bioconjugates in the Resection of Breast Cancer. J. Surg. Res. 2014;188(1):119–128. doi: 10.1016/j.jss.2013.11.1089. [DOI] [PMC free article] [PubMed] [Google Scholar]
- 10.Day KE, Sweeny L, Kulbersh B, Zinn KR, Rosenthal EL. Preclinical Comparison of Near-Infrared-Labeled Cetuximab and Panitumumab for Optical Imaging of Head and Neck Squamous Cell Carcinoma. Mol. Imaging Biol. 2013 May;15:722–729. doi: 10.1007/s11307-013-0652-9. [DOI] [PMC free article] [PubMed] [Google Scholar]
- 11.Cohen R, Stammes MA, de Roos IH, Stigter-van Walsum M, Visser GW, van Dongen GA. Inert Coupling of IRDye800CW to Monoclonal Antibodies for Clinical Optical Imaging of Tumor Targets. EJNMMI Res. 2011;1(1):31. doi: 10.1186/2191-219X-1-31. [DOI] [PMC free article] [PubMed] [Google Scholar]
- 12.Marshall MV, Draney D, Sevick-Muraca EM, Olive DM. Single-Dose Intravenous Toxicity Study of IRDye 800CW in Sprague-Dawley Rats. Mol. Imaging Biol. 2010 Apr;12:583–594. doi: 10.1007/s11307-010-0317-x. [DOI] [PMC free article] [PubMed] [Google Scholar]
- 13.Zinn KR, Korb M, Samuel S, Warram JM, Dion D, Killingsworth C, Fan J, Schoeb T, Strong TV, Rosenthal EL. IND-Directed Safety and Biodistribution Study of Intravenously Injected Cetuximab-IRDye800 in Cynomolgus Macaques. Mol. Imaging Biol. 2015 Jul;17:49–57. doi: 10.1007/s11307-014-0773-9. [DOI] [PMC free article] [PubMed] [Google Scholar]
- 14.Vahrmeijer AL, Hutteman M, van der Vorst JR, van de Velde CJH, Frangioni JV. Image-Guided Cancer Surgery Using Near-Infrared Fluorescence. Nat. Rev. Clin. Oncol. 2013;10(9):507–518. doi: 10.1038/nrclinonc.2013.123. [DOI] [PMC free article] [PubMed] [Google Scholar]
- 15.Nani RR, Shaum JB, Gorka AP, Schnermann MJ. Electrophile-Integrating Smiles Rearrangement Provides Previously Inaccessible C4′-O-Alkyl Heptamethine Cyanine Fluorophores. Org. Lett. 2015;17:302–305. doi: 10.1021/ol503398f. [DOI] [PMC free article] [PubMed] [Google Scholar]
- 16.Zaheer A, Wheat TE, Frangioni JV. IRDye78 Conjugates for Near-Infrared Fluorescence Imaging. Mol. Imaging. 2002;1(4):354–364. doi: 10.1162/15353500200221302. [DOI] [PubMed] [Google Scholar]
- 17.Shealy DB, Lipowska M, Lipowski J, Narayanan N, Sutter S, Strekowski L, Patonay G. Synthesis, Chromatographic Separation, and Characterization of Near-Infrared Labeled DNA Oligomers for Use in DNA Sequencing. Anal. Chem. 1995;67(2):247–251. [Google Scholar]
- 18.Lee H, Mason JC, Achilefu S. Heptamethine Cyanine Dyes with a Robust C-C Bond at the Central Position of the Chromophore. J. Org. Chem. 2006;71:7862–7865. doi: 10.1021/jo061284u. [DOI] [PubMed] [Google Scholar]
- 19.Lim SY, Hong KH, Kim DIl, Kwon H, Kim HJ. Tunable Heptamethine-Azo Dye Conjugate as an NIR Fluorescent Probe for the Selective Detection of Mitochondrial Glutathione over Cysteine and Homocysteine. J. Am. Chem. Soc. 2014;136:7018–7025. doi: 10.1021/ja500962u. [DOI] [PubMed] [Google Scholar]
- 20.Sato K, Watanabe R, Hanaoka H, Harada T, Nakajima T, Kim I, Paik CH, Choyke PL, Kobayashi H. Photoimmunotherapy: Comparative Effectiveness of Two Monoclonal Antibodies Targeting the Epidermal Growth Factor Receptor. Mol. Oncol. 2014;8(3):620–632. doi: 10.1016/j.molonc.2014.01.006. [DOI] [PMC free article] [PubMed] [Google Scholar]
- 21.Reichert JM, Dhimolea E. The Future of Antibodies as Cancer Drugs. Drug Discovery Today. 2012;17(17–18):954–963. doi: 10.1016/j.drudis.2012.04.006. [DOI] [PubMed] [Google Scholar]
- 22.Hoffman RM. The Multiple Uses of Fluorescent Proteins to Visualize Cancer in Vivo. Nat. Rev. Cancer. 2005;5(10):796–806. doi: 10.1038/nrc1717. [DOI] [PubMed] [Google Scholar]
Associated Data
This section collects any data citations, data availability statements, or supplementary materials included in this article.