Abstract
Purpose
To evaluate the feasibility of using a clinical magnetic resonance (MR) system and MR spectroscopy (MRS) to measure glucose concentration changes in the human hypothalamus, a structure central to whole-body glucose regulation.
Subjects and Methods
A time series of MR spectra (semi-LASER, TE = 28 msec), localized to the bilateral hypothalamus ~1.6 ml) were obtained at 3T in six healthy subjects at baseline (euglycemia) and during a ~65–70-minute-long hyperglycemic clamp in 11-minute blocks with interleaved T1 FLASH images to retrospectively assess head motion, and track changes in cerebrospinal fluid (CSF) partial volume. The LCModel was used to quantify the sum of glucose and taurine concentrations, [Glc+Tau], along with their associated Cramér-Rao lower bounds (CRLB).
Results
Spectral quality allowed quantification of [Glc+Tau] (sum reported due to high negative correlation between these metabolites) with CRLB <25% in 35/36 timepoints during hyperglycemia. Increased [Glc+Tau] was observed with hyperglycemia in all subjects, but most reliably in those with plasma glucose targets ≥300 mg/dl. For these subjects, [Glc+Tau]baseline (n = 4) was 1.5 (±0.3, SD) mM, and increased to 4.5 (±1.1) mM (n = 16) for timepoints acquired ≥25 minutes after onset of the clamp, with 15/16 timepoints having no overlap of 95% confidence intervals (CIs) between baseline and hyperglycemia. Preliminary analysis revealed a linear (1:5) relationship between hypothalamus–blood glucose concentrations.
Conclusion
It is feasible to measure glucose concentration changes in the human hypothalamus using a standard 3T scanner and a short-echo semi-LASER sequence by utilizing retrospective motion tracking, CSF correction, predetermined quality acceptance criteria, and hyperglycemic blood glucose levels ≥300 mg/dl.
Level of Evidence
2
Although the brain accounts for only 2% of the human body’s weight, it accounts for 20% of the body’s resting metabolism1 and under normal diet and physiological conditions, it relies almost exclusively on glucose (Glc) as a source of energy.2,3 Regulation of glucose transport and metabolism in the brain is therefore essential for proper brain and body function.
The body’s ability to regulate glucose transport and metabolism is dependent on its ability to monitor glucose availability, a function performed in various organs and within the brain by distinct neuronal populations that become either excited or inhibited with changes in blood glucose concentration.4 In the brain, these cell types are densely populated within the hypothalamus, a centrally located brain structure that plays regulatory roles in both the endocrine and nervous systems.5 Because the hypothalamus is thought to be a structure central to glucose regulation and energy homeostasis, measurement of hypothalamic Glc transport is of great interest. Regional Glc transport kinetics in the brain can be quantified by monitoring brain glucose levels as blood glucose levels rise.6–8 However, the small size of the hypothalamus and its location deep within the brain have made noninvasive measurement of glucose uptake in the human hypothalamus a challenging undertaking.
In vivo glucose uptake is often visualized with the use of [18F]-fluorodeoxyglucose and positron emission tomography (FDG-PET). This approach is practicable for the measurement of Glc uptake in large brain structures or lesions in which flux through glycolytic pathways are significantly increased, but the current resolution of clinical human PET systems (~4 mm) is limiting and results in poor spatial fidelity of the hypothalamic FDG-PET signal. Brain-dedicated high-resolution research tomography (HRRT) systems have afforded improved 3D PET image resolution (~2.5 mm FWHM) in humans,9 but these systems are not widely available and methodological subtleties in quantification remain to be fully elucidated.10 For these reasons, a more accessible imaging alternative to measure Glc uptake in the human hypothalamus is desirable.
Despite having much lower sensitivity than FDG-PET, single-voxel proton magnetic resonance spectroscopy (MRS) on a clinically used 3T platform may be a viable alternative to FDG-PET measures of glucose uptake in the hypothalamus. Importantly, an ~5:1 ratio of plasma to tissue glucose concentration was recently demonstrated by biochemical methods in the rat hypothalamus at euglycemia,11 as was previously observed by MRS in other brain regions,6,7 indicating a functional hypothalamus–blood interface for glucose transport. Brain glucose metabolism/uptake measurements in humans by 1H MR are well established for large volumes of interest (VOI),6–8,12–14 in which small shifts in VOI position (2–3 mm) compared to the VOI dimensions do not appreciably alter the spatial localization. On the other hand, the fidelity of anatomic localization of the dynamic MRS signal arising from an appropriately sized VOI of the hypothalamus (10–13 mm per dimension) may substantially degrade with modest subject motion expected during an imaging session of longer duration,15 even if MR spectral quality measures (residual water, spectral linewidth, and signal-to-noise ratio [SNR]) do not appreciably degrade.
Therefore, our goal was to evaluate a combined MR acquisition and analysis methodology designed to quantify glucose transport in the human hypothalamus, which necessitates measurement of brain Glc levels at euglycemia and at a series of hyperglycemic blood glucose levels.6–8,12–14 Specifically, we aimed 1) to assess spectral data quality from a small hypothalamic VOI, measurement errors of the hypothalamic Glc measurement and the influence of subject movement on spectral quality and CSF fraction in the VOI, and 2) to establish criteria that can be used to select the reliable data points in an MRS time series obtained during a euglycemic baseline followed by a hyperglycemic clamp.
Subjects and Methods
Subjects
Six healthy volunteers (age 34.2 ± 13.2 years, 4M/2F) were studied after giving informed consent using procedures approved by the Institutional Review Board: Human Subjects Committee of the University of Minnesota. On the day of the experiment, subjects arrived at the Center for Magnetic Resonance Research in the morning after an overnight fast. On arrival, an intravenous catheter was placed antegrade in a forearm for subsequent infusion and a catheter was placed retrograde in the lower leg for blood sampling. The leg used for blood sampling was wrapped in heated towels and hot packs to arterialize the venous blood.16
MR Data Acquisition
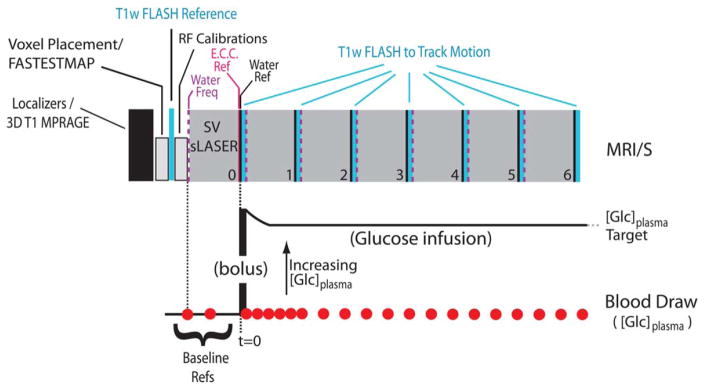
All data were acquired at 3T on a Siemens (Siemens Medical, Erlangen, Germany; software version, Syngo VB17B) Trio MR scanner using a body coil transmit and a vendor-supplied 32-channel phased array receive coil. A block diagram of the MR time course is presented in Fig. 1.
FIGURE 1.
A block diagram depicting the acquisition scheme used to track voxel location during the MRS time course. Below is the concurrent timing diagram of the glucose infusion/blood draws as described in the text. (“E.C.C Ref.,” eddy current correction reference; “Water Ref,” unsuppressed water spectrum; “Water Freq.,” RF transmitter set to water frequency).
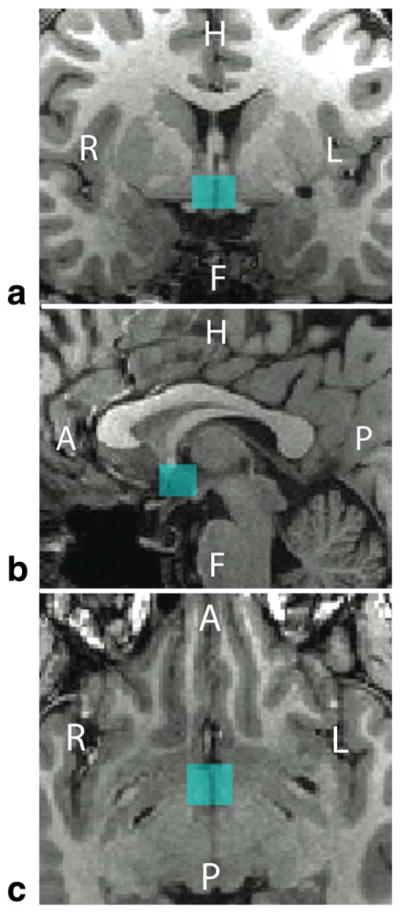
The imaging session began with the acquisition of a 1-mm isotropic 3D T1 magnetization-prepared rapid gradient echo (MPRAGE) (field of view [FOV]: 256 × 176 mm, matrix size: 256 × 176, with 1 mm slice thickness; repetition time, echo time, and inversion time [TR/TE/TI] were 2530 msec, 3.65 msec, and 1100 msec, respectively; a GRAPPA factor of 2 was used to yield a scan duration of roughly 5 min) on which the MRS voxel was prescribed (Fig. 2). Hypothalamic B0 shimming was then performed with FASTESTMAP17 followed by the acquisition of a reference 2D FLASH image set (70 sagittal slices of 3 mm thickness; TR/TE = 212/2.42 msec; FOV of 256 × 256 mm with an acquisition matrix of 256 × 256 and 6/8 partial Fourier encoding with a GRAPPA factor of 3) that achieved full brain coverage in 35 seconds.
FIGURE 2.
The location of a typical hypothalamic voxel (blue) as it was placed in the (A) coronal, (B) sagittal, and (C) axial views at the beginning of the study. The voxel dimensions were 13 mm (AP) × 12 mm (LR) × 10 mm (FH) for a sampling volume of 1.56 cm3. Subject 3’s voxel position is shown.
The FLASH reference was followed by voxel-localized calibration of RF power for slice-selective and water suppression pulses.18 The resulting calibration values were used for the MRS acquisitions throughout the duration of the scan session. Immediately following the calibrations, a baseline MRS spectrum (2048 points, 6 kHz spectral width) was acquired using a modified semi-LASER sequence19 that included outer volume suppression interleaved with VAPOR water suppression.20 The acquisition of the hypothalamic baseline spectrum (two preparation scans; TR/TE = 5000/28 msec; 128 transients, saved as individual FIDs; voxel dimensions of 10 × 12 × 13 mm [=1.56 cm3] resulting in an acquisition time just under 11 min) was followed immediately with the acquisition of two unsuppressed water references18 for eddy current correction and for water scaling for metabolite quantification purposes. A single eddy current correction spectrum was used for all subsequent timepoints since the eddy currents are only a function of the VOI location in space, while a separate water-scaling reference spectrum was acquired for each individual timepoint, as depicted in Fig. 1.
After onset of glucose infusion, six sets of the MRS/FLASH/water reference ensemble were collected. Separate B0 shim settings associated with FLASH (system “tune up” mode) and MRS (FASTESTMAP) acquisitions were held in memory and were applied as required by the acquisition type. Additionally, the water resonance frequency was evaluated prior to each of the six MRS timepoint acquisitions and was adjusted as necessary to assure that water suppression pulses were applied on-resonance. The MR parameters of the acquired FLASH and MRS datasets were not altered throughout the scan session. The resulting scan was completed within 90 minutes.
Glucose Infusion and Blood Sampling
The MRS calibrations and baseline MRS data were collected during euglycemia (90–100 mg/dl blood Glc). Subjects were then given an intravenous bolus injection of 20% dextrose, followed by a continuous infusion to maintain the desired blood [Glc] target in the 200–400 mg/dl range, as described previously.14 Estimation of the arterial input function was accomplished from blood samples collected throughout the study, at 2–5-minute intervals. The placement of the catheter in the lower leg allowed the subject to remain at the magnet isocenter at all times, thereby enabling blood draws to be performed at a finer resolution than individual MRS timepoint acquisitions (Fig. 1).
MRS Data Analysis
Each MRS timepoint consisted of 128 single transients that were eddy current-corrected using the eddy current reference spectrum acquired at the start of the MRS time series. The 128 frequency domain spectra were averaged in consecutive groups of four, prior to phase correction and frequency alignment, as previously described.18 The resulting 32 frequency domain traces were summed and the resulting spectrum referenced to N-acetylaspartate (NAA) at 2.01 ppm. The resulting spectrum for each timepoint was then saved with its associated water reference spectrum and its calculated CSF fraction (see below). Spectral fitting and metabolite quantification were performed using LCModel21 with the water-scaling feature (v. 6.3-0G) to reference metabolite concentrations to water, a basis set consisting of 18 simulated metabolites,20 and a previously measured macromolecular basis set.22 The primary metabolite of interest for purposes herein was glucose. We used LCModel output of the sum of glucose and taurine, [Glc+Tau], and this quantity’s associated Cramér-Rao lower bounds (CRLB). We report the sum of these two metabolites in accordance with LCModel guidelines whereby metabolites with strong negative cross correlations (< −0.5) be reported also as a sum of the two metabolites (LCModel & LCMgui User’s Manual, November 17, 2014. p 148). While we show the sum of these two metabolites in our results, the observed changes in [Glc+Tau] over the glucose infusion time course are attributed to changes in [Glc] based on results obtained by LCModel fitting of aggregate spectra: the baseline spectrum and the three last spectra of the time course from subjects with plasma glucose targets ≥300 mg/dl were summed across subjects, resulting in four timepoints with higher signal-tonoise ratio. The resulting LCModel quantification showed changes in [Glc], but not in [Tau] between the summed baseline and the later timepoint spectra (Fig. SF1 in Supplementary Materials). This analysis demonstrated that Glc is the main contributor to [Glc+Tau] and that the measured changes in [Glc+Tau] arise from changes in [Glc]. However, because these two metabolites retain a high negative correlation in the individual timepoint spectra, we present our results in terms of [Glc+Tau].
LCModel analysis was performed for each spectrum twice: once with a static CSF voxel fraction and once with a dynamic CSF voxel fraction. The static CSF voxel fraction was taken from tissue segmentation maps from the initial MPRAGE image set on which the MRS voxel was initially placed. This provides an example of a [Glc+Tau] time course under the typical assumption of no subject motion. The dynamic CSF voxel fraction was calculated for each timepoint from the spatially transformed segmentation maps associated with each timepoint as described below.
MRS Voxel Tracking and Dynamic CSF Voxel Fraction Estimates
All image analysis was performed using a slightly modified version of SPM823 and supporting MatLab (v. R2013b, MathWorks, Natick, MA) scripts written in-house. All image sets were imported into SPM in DICOM format (Siemens .dcm) image and saved in NIfTI (.nii) format.24 Voxel tracking and estimation of CSF voxel fraction were achieved by transforming the initial MPRAGE images, its segmented tissue maps, and time-dependent FLASH image sets to a reference space using well-established image segmentation and registration software, thereby generating an MPRAGE image set (MPRAGEi*) and tissue segmentation maps for each timepoint (i) in FLASH image space. A detailed description of our implementation is presented in the Supplementary Materials.
Subject motion was calculated and output in a text file within SPM8 using , where Δx, Δy, and Δz are differences in translational distances (in mm) along x, y, and z between the reference FLASH image set and each timepoint’s FLASH image set, as determined by SPM8. Measured rotational components of motion (yaw, roll, pitch) were under ±1.5° for all timepoints but three, with these three having values less than ±1.7° and of which none were lost due to our established rejection criteria (dashed lines, Figs. (3 and 4)). Thus, in addition to the degree of subject motion, each MRS timepoint had four image sets associated with it: a 3D T1 anatomic image set, used for visual inspection, and a set of three tissue segmentation maps that were used to refine CSF voxel fraction for each timepoint.
FIGURE 3.
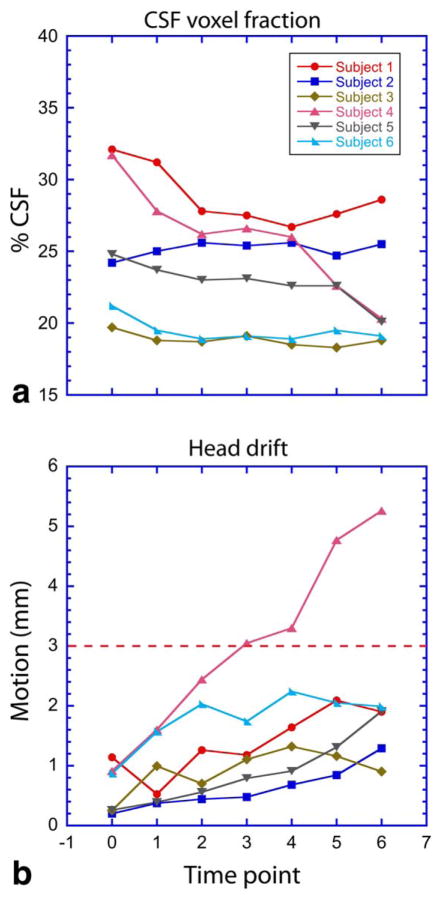
Plots of the resulting parameters generated from the voxel tracking pipeline, (A) CSF voxel fraction, and (B) head motion, for the six subjects studied. The red dashed line demarks the upper limit of data acceptance criteria used for subject motion.
FIGURE 4.
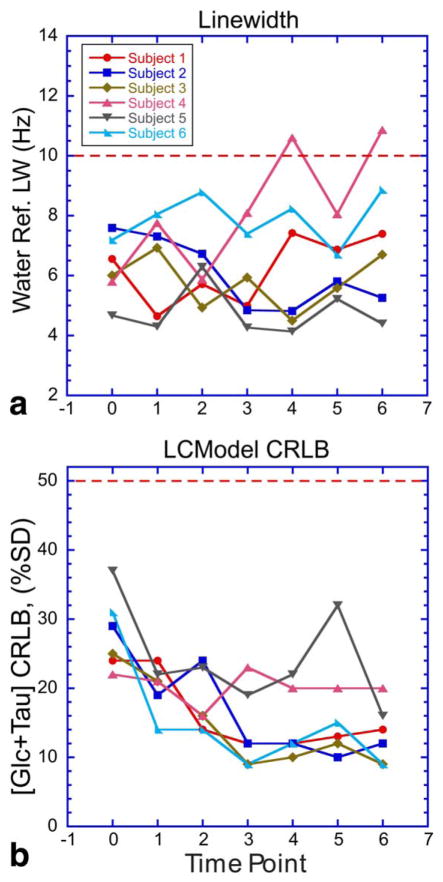
Graphs that represent MR spectral data quality parameters, (A) water reference linewidth, and (B) [Glc+Tau] CRLB, for all measured timepoints. Red dashed lines demark the upper limit of data acceptance criteria used.
The CSF fraction in the MRS voxel was determined by applying a 3D binary voxel mask to the MPRAGE (static) and MPRAGEi* (dynamic) image set for each timepoint (Supplementary Materials, Fig. SF2). We define CSF voxel fraction as:
| (1) |
where px is the number of pixels from MPRAGEi* images at each timepoint classified as a specific tissue type within the MRS voxel. Within the MRS voxel, at least 99.80% of the pixels were classified for all timepoints.
Refinement of [Glc+Tau]Brain by CSF Fraction
Because most MRS-measured brain metabolites lack a transport mechanism at the blood–CSF barrier interface,25 their concentration within CSF is limited by their inability to diffuse across the plexus epithelial barrier, thereby resulting in CSF metabolite concentrations well below the MRS detection limit. Thus, for the majority of MRS-measured metabolites, the applied CSF volume correction pertains to the dilutive effects of the CSF volume, such that only the tissue volume is considered as a source of the MRS signal, with an effective metabolite concentration in CSF of zero.
In special cases in which a metabolite, such as glucose, may be actively transported into CSF,7,25 a dynamic equilibrium exists between the metabolite concentrations across pools, resulting in potentially significant CSF-pool contributions to the MRS signal. 7,8,26,27 We therefore correct the measured [Glc+Tau] to account for MRS signal contributions from glucose partitioned into CSF using:
| (2) |
where fCSF is the CSF voxel fraction as determined by image segmentation and the application of Eq. (1), is the total [Glc+Tau] within the MRS voxel recalculated to remove the dilutive (CSF) partial volume correction applied during the LCModel analysis pipeline, and the quantity (1-fCSF) is the tissue voxel fraction. [Glc]CSF at each timepoint was determined by solving differential equations for glucose transport using a three-compartment plasma-CSF-brain model7 (see Supplementary Materials for details).
Utilization of Steady-State Data Points
Of the three tissue maps generated from image segmentation, our methodology focuses on the CSF component, a known glucose reservoir whose fraction within the hypothalamic MRS voxel varies across subjects at baseline, and is subject to motion-induced fluctuations during the time course. Because the hypothalamus may have unique properties with respect glucose uptake compared to its surrounding tissue, we implemented a motion threshold (Fig. 3) that limited partial volume contributions of the surrounding white matter to the acquired MRS signal, leaving the hypothalamus and its surrounding tissue lumped as a single tissue type. Under steady-state (ie, under stable plasma glucose), glucose concentrations in cortical gray matter and white matter do not significantly differ from each other over the eu- and hyperglycemic states and glucose concentration in both tissue types is linearly related to the plasma glucose concentration.6,8 This suggests that if steady-state hypothalamic [Glc+Tau] are used to model glucose transport, partial volume differences with respect to [Glc+Tau] from surrounding tissue will be minimized. A linear relationship between plasma and hypothalamic glucose under steady-state further suggests that utilizing 300–400 mg/dl clamps—in addition to euglycemic clamps—would be sufficient to estimate glucose transport parameters, eliminating the need to utilize clamps with lower hyperglycemic blood glucose levels (≤200 mg/dl), where the described MRS measures may not provide the required sensitivity to measure changes in [Glc+Tau].
Statistical Analysis
MRS data were quantified using LCModel, which includes percent standard deviation (%SD) in the form of each metabolite’s CRLB. We include 95% CIs (±2*CRLB) for [Glc+Tau] at each timepoint, and use this measure as a means to distinguish measurable changes in [Glc+Tau] with increased plasma glucose.
Results
MRS Data Quality Assessment
Figure 3 shows that head displacement through the 90-minute acquisition remained within 2 mm of the initial voxel location for almost all timepoints in five out of six subjects. Accordingly, relatively stable CSF fractions were measured throughout the clamp in these five subjects. Baseline CSF fractions ranged from ~20–32% of the VOI due to the midsagittal placement of the hypothalamic voxel and variability in the width of the 3rd ventricle.
Parameters allowing assessment of data quality for all six subjects are presented in Fig. 4. Spectra associated with water reference linewidths (FWHM) greater than 10 Hz at 3T were excluded from further analysis.18 All data acquired had [Glc+Tau] CRLB lower than 50% even at the euglycemic baseline. CRLBs decreased with increasing blood [Glc]—and consequently hypothalamic [Glc+Tau]—leveled out with increasing time. Notably, all but one spectra acquired during the hyperglycemic clamp had [Glc+Tau] CRLB <25%, indicating reliable quantification. The CRLB values for subjects 4 and 5 were consistently higher than the other subjects, likely due to lower plasma glucose targets during their hyperglycemic clamps.
Voxel location was assessed from the SPM8 motion output, and was further confirmed with visual inspection of the voxel mask overlaid upon each realigned MPRAGE image set using FSLView (v. 3.2.028) and in-house written MatLab code. We used a maximum motion threshold of 3 mm as a discard criterion based on relative dimensions of the voxel used and partial volume effects deemed acceptable for this example. Four out of 42 data points (10%) did not meet our quality acceptance criteria (linewidth, CRLB, head drift).
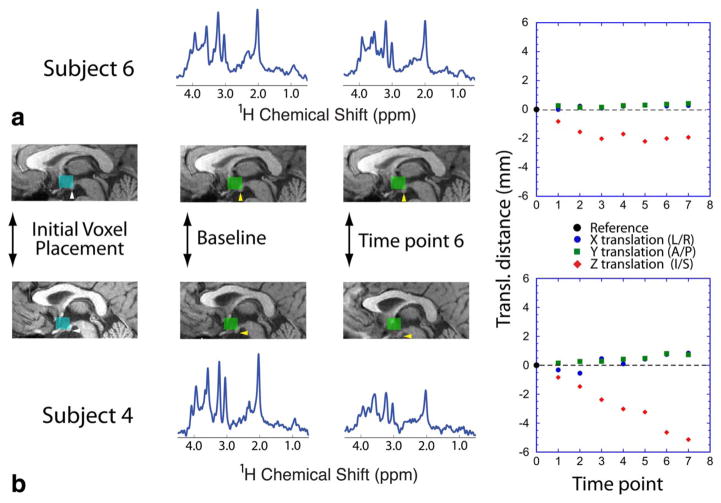
Figure 5 illustrates an example of changes in the MRS voxel location, and hence, the spatial volume from which CSF voxel fraction was calculated at each timepoint for two subjects. The location of the dynamic voxel position for each timepoint reveals that the MRS data acquired from subject 6, who had an average head displacement of 1.8 (±0.5, SD) mm, remained better localized to the original voxel placement compared to subject 4, whose average head displacement was 3.1 (±1.6) mm. While it is evident that spectral quality degraded substantially over time for subject 4 (water reference linewidths ranged from 5.8–10.9 Hz), it is not possible to determine whether MRS signals still arise primarily from the hypothalamus without the additional information regarding voxel position.
FIGURE 5.
The voxel location and MR spectral data obtained from subjects with varied degree of motion. (A) Subject 6, who retained position well throughout the scan session, and (B) subject 4, who moved in z-direction throughout the MR session. The blue voxel indicates the initial voxel placement, with the lower boundary of the voxel placed at the floor of the hypothalamus (white arrows). The green voxels in subsequent images denote the relative voxel position as determined from the interleaved FLASH acquisitions. Yellow arrows point to the hypothalamic mammillary body, which eventually became excluded from the MRS measurement voxel during subject 4’s scan session. Above and below the anatomic images is the spectrum acquired at each timepoint. The spectra are shown with identical scaling across subjects and time. The measured translational motion at each timepoint is shown on the right-hand-side panels.
Corrected [Glc+Tau]Brain
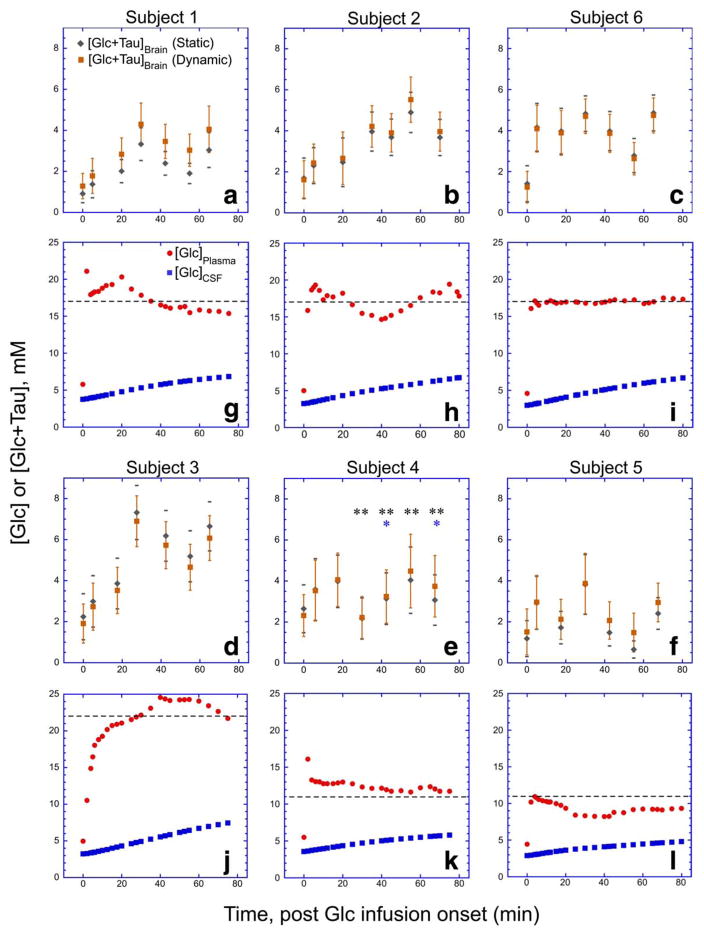
Corrected [Glc+Tau]Brain for each subject’s time course was calculated (Eq. (2)) using static and dynamic fCSF values. Figure 6 shows the resulting [Glc+Tau]Brain time courses, together with the calculated [Glc]CSF time course. Notably, increases in [Glc+Tau]Brain could be detected for subjects with a plasma glucose target of 300–400 mg/dl. These plots also indicate that for this subject group, the static fCSF correction is a sufficient correction, as [Glc+Tau]Brain using the dynamic fCSF correction fell within the 95% confidence levels associated with using the static fCSF approach to calculating [Glc+Tau]Brain.
FIGURE 6.
A summary of the resulting [Glc + Tau]Brain time courses for each subject (A–F) with (dynamic) and without (static) voxel tracking refinements. Subject data are grouped by plasma glucose concentrations for ease of comparison. The error bars denote the ) for each measurement. Included directly beneath (G–L) are time course plots of measured [Glc]Plasma and the modeled [Glc]CSF used in the CSF correction described in the text and Supplementary Material. Dashed lines in (G–L) denote plasma glucose concentration targets for each subject. The asterisks appearing in subject 4’s time course refer to points excluded due to excessive spectral linewidth (*) or motion criterion (**) as defined in Figs. 3 and 4.
The results in Fig. 4 show that quantification of [Glc+Tau] in our 1.6 cm3 voxel at 3T results in CRLBs that typically plateau in the low double digits when the subject is in the hyperglycemic state. As a result, the 95% confidence levels are sizeable, as indicated by the error bars in Fig. 6. In all subjects whose targeted plasma glucose was at least 300 mg/dl, changes of [Glc+Tau] share overlap with 95% CIs of adjacent timepoints, revealing a gradual increase of hypothalamic [Glc+Tau] with time. Data from these same subjects (Fig. 6, subjects 1, 2, 3, and 6) also show that 15 of 16 timepoints occurring 25 minutes postglucose bolus have [Glc+Tau] and associated 95% CIs outside of the 95% CIs at baseline ([Glc+Tau]baseline = 1.5(±0.3) (SD) mM (n = 4) and ([Glc+Tau]>25minutes = 4.5 (±1.1) mM (n = 16)). No increase of [Glc+Tau] for the two subjects whose plasma glucose targets were 200 mg/dl were observed to climb outside of 95% CIs at baseline ([Glc+Tau]baseline = 1.9 (±0.6) mM (n = 2) and ([Glc+Tau]>25minutes = 2.6 (±1.0) mM (n = 4). Note the 200 mg/dl plasma glucose target data uses only subject 5’s [Glc+Tau] for the last four timepoints, since subject 4’s data did not meet our quality standards.
Hypothalamic [Glc+Tau] Under Steady-State Plasma [Glc]
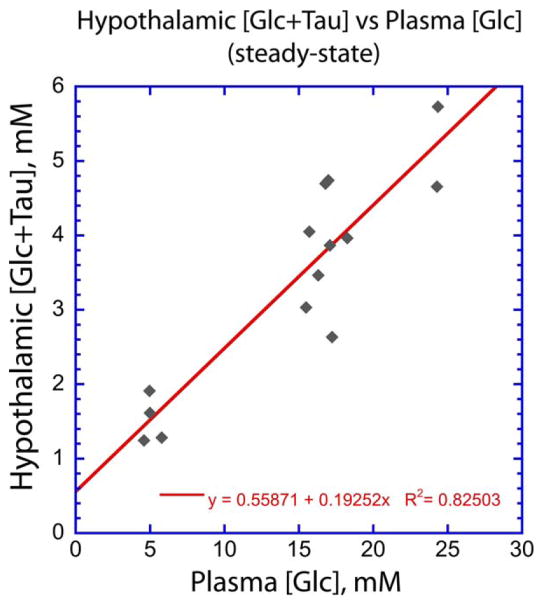
Using steady-state data from subjects whose baseline and steady-state [Glc+Tau] values are measurably different as described above, we plotted the relationship between hypothalamic [Glc+Tau] and plasma [Glc]. Unlike the values of [Glc+Tau]baseline and [Glc+Tau]>25mintues discussed above, these data account for each individual’s time-varied plasma glucose time course, which is relevant for measuring hypothalamic glucose transport. Figure 7 shows the hypothalamic/plasma glucose relationship to be reasonably linear, in agreement with previous work in other brain regions.6–8 Moreover, the slope of this plot is in good agreement with the 5:1 ratio measured in the rodent hypothalamus at euglycemia with biochemical methods.11
FIGURE 7.
A plot of hypothalamic [Glc+Tau] vs plasma [Glc] at steady state for subjects with plasma glucose targets of 300 mg/dl or higher. Steady-state points were determined by the stability of the plasma [Glc] as determined from Fig. 6. The timepoints used in the plot are as follows: subject 1: baseline, 4, 5, 6; subject 2: baseline, 6; subject 3: baseline, 4,5; subject 6: baseline, 3, 4, 5, 6, where 1, 2, 3, etc., refer to timepoint postglucose infusion onset. Dynamic CSF corrections were used for [Glc+Tau].
Discussion
Here we evaluated an MRS protocol at 3T to measure glucose concentration changes in the human hypothalamus with a goal to utilize the method in estimating glucose transport in this small structure central to whole-body glucose regulation. The presented protocol utilizes a recently developed short-echo, full intensity single-voxel localization method18,19 and includes assessment of dynamic voxel location during an MRS time series acquisition using interleaved FLASH images. The protocol can therefore be utilized with standard clinical hardware without the need for specialized optical tracking devices or pulse sequence modifications for motion tracking. The proposed method not only provides a means by which to assess voxel location to ensure that the resulting data reflect hypothalamic processes, but also provides a dynamic assessment CSF content in the voxel by which measured [Glc] may be refined at each MRS timepoint. While ultrahigh fields (≥7T) can provide higher spectral signal to noise and resolution than 3T, glucose is known to be quantified more reliably at 3T and 4T than 7T due to a simpler spectral pattern at the lower fields,29–31 further justifying the choice of 3T for studying hypothalamic Glc transport.
The observation that none of the [Glc+Tau] following glucose infusion with a 200 mg/dl target were classified outside of 95% CIs of [Glc+Tau] established at baseline, may indicate that the 300 mg/dl target is a preliminary lower limit for measuring [Glc+Tau] in the hypothalamus. These results do not necessarily preclude hypothalamic glucose measurements with hyperglycemic clamps ≤300 mg/dl from being studied, but suggest that at the very least, a longer MRS time block to reduce [Glc+Tau] CRLB values32 may be necessary to detect changes in hypothalamic [Glc+Tau].
We observed an increased pulse rate in all subjects during the hyperglycemic clamp, which may lead to the question of possible changes in water or metabolite relaxation due to blood oxygenation level-dependent (BOLD) effects from within the MRS voxel during the glucose infusion. fMRI studies have shown that glucose ingestion decreases the BOLD response by 1–2%,33,34 with the BOLD response being less pronounced and shorter lived when glucose is delivered by i.v. compared to oral delivery.34 Quantification of metabolites was not affected beyond 1% for even larger BOLD changes of 3–4%, which result in linewidth changes within 0.5 Hz.35 Furthermore, addition of 0.5 Hz line broadening does not alter glucose quantification, 35 suggesting that glucose quantification is not altered by BOLD effects. We therefore conclude that the small glucose-related BOLD effect in our subjects does not contribute to the observed changes in [Glc+Tau], or its corresponding CRLB, in a meaningful way.
The data from the healthy adult subjects shown here indicate that the subjects were generally still, and while the overall number of data points discarded due to motion in the data presented here is relatively low (4/42), the inclusion of voxel location provides a measure that helps to remove ambiguity regarding the retention or discarding of data points within a time series containing marginal quality. With respect to a single subject’s time course, discarded data may preclude kinetic analysis altogether, but in instances where kinetic analysis permits time course data to be pooled across subjects,6,8,13 partial time course data may be acceptable, and the addition of a motion parameter results in higher quality data to produce a more meaningful measure of hypothalamic glucose transport. Here, we used simple distance measures of voxel location relative to its initial placement, but any motion-related parameter(s) derived from the transformation matrix can be customized to user-determined values as dictated by experimental requirements and the level to which partial volume confounds are deemed acceptable. Voxel tracking was achieved using SPM8, which contains widely used, robust registration and segmentation algorithms that are easily accessed and modified in MatLab. Therefore, SPM8 facilitated a more streamlined approach to image analysis in conjunction with house-written MatLab scripts. These reasons do not preclude the described approach from being implemented outside of SPM/MatLab packages that may possess similar image processing capabilities.28,36
Improvements in fast imaging techniques using highly parallelized imaging37 with multiband EPI approaches38 may also serve the purpose of voxel tracking as described. Although the described method using readily available sequences resulted in the addition of only 4 minutes for the interleaved FLASH images to the overall scan session of roughly 90 minutes, the resulting voxel tracking is temporally coarse, and ultrafast imaging would enable more frequent voxel tracking. Recent work by a few groups39–42 that involves the use of optical sensors and cameras and/or navigator echoes has been shown to be useful for tracking and correcting MRS voxel location using real-time feedback to update gradient waveforms and shim coil currents during the MRS acquisition. These approaches are highly desirable since they serve to preserve data quality in a prospective sense and do not require additional analysis. However, these methods are not widely implemented and the presented methodology may serve as a feasible alternative until real-time methods become more widely available. Developments in current scanner software on some systems may enable a variation of our approach that operates between the work presented here, and real-time approaches. For example, the recently available Siemens (“AutoAlign”) and Philips (“SmartExam”) imaging options internally change gradient settings based on a short survey scan, such that images are acquired at a defined (fixed) orientation. If used in a manner similar to that described here in which the vendor’s alignment survey replaces the FLASH image set, these products may enable the MRS voxel to capture the same nominal hypothalamic volume at each timepoint. As a result, the need for retrospective alignment and calculation of timepoint-dependent CSF fractions are theoretically removed from the analysis pipeline. However, the vendor alignment software approach alters the voxel location in space, and may therefore require additional shimming and/or eddy current correction acquisitions to be performed on a timepoint basis. The availability, details of implementation, robustness, and compatibility of vendor-based alignment tools with respect to MRS voxel placement may vary across vendors.
In addition to the sensitivity challenges associated with small voxel MRS, changes in plasma glucose levels, onset of sleep, blood draws, or pressure points from lying for an extended period may result in subject discomfort that may cause transient or retraceable motion, which is not detectable with the presented methodology.
Limitations to the presented work includes our ability to assess the feasibility of the 200 mg/dl plasma glucose target. This target was hindered by a small sample size and would benefit from additional data at varied plasma glucose targets (200–300 mg/dl) in order to further establish whether the steady-state plasma/hypothalamic glucose relationship retains linearity, and to also establish a refined lower plasma glucose target. Since this was a feasibility study, we did not include a patient group in our limited sized cohort. However, we point out that the presented method is not intended for clinical care in a hospital setting, but for mechanistic research in the academic setting aimed at better understanding glucose regulation.
In conclusion, here we demonstrated the feasibility of using single voxel 1H MRS on a standard 3T clinical scanner to quantify changes in hypothalamic glucose concentration during a hyperglycemic clamp, the first step towards noninvasively quantifying glucose transport localized to the human hypothalamus. We found that hypothalamic [Glc+Tau] increased while [Glc+Tau] CRLBs decreased when the plasma glucose target was maintained at or above 300 mg/dl, suggesting that glucose changes in the hypothalamus may be more challenging to measure for lower plasma targets at 3T. Our limited dataset showed a linear relationship with a roughly 5:1 of plasma [Glc] to hypothalamic [Glc+Tau] at steady-state, and is in good agreement with invasive measures made in rodent hypothalamus.
Supplementary Material
Acknowledgments
Contract grant sponsor: National Institute of Neurological Disorders and Stroke (NINDS); contract grant number: R01 NS035192; Contract grant sponsor: National Institute of Biomedical Imaging and Bioengineering (NIBIB); contract grant number: P41 EB015894; Contract grant sponsor: Institutional Center Cores for Advanced Neuroimaging; contract grant number: P30 NS076408; Contract grant sponsor: CTSA; contract grant number: 5KL2TR000113; Contract grant sponsor: National Center for Advancing Translational Sciences of the National Institutes of Health; contract grant number: UL1TR000114 We thank Dr. Melissa Terpstra for acquiring some of the datasets that were used in the study and the staff of the Center for MR Research for maintaining and supporting the MR system.
Footnotes
Additional Supporting Information may be found in the online version of this article.
References
- 1.Sokoloff L, Reich M, Kennedy C, et al. The [14C] deoxyglucose method for the measurement of local cerebral glucose utilization: theory, procedure, and normal values in the conscious and anesthetized albino rat. J Neurochem. 1977;28:897–916. doi: 10.1111/j.1471-4159.1977.tb10649.x. [DOI] [PubMed] [Google Scholar]
- 2.Rooijackers HMM, Wiegers EC, Tack CJ, van der Graaf M, de Galan BE. Brain glucose metabolism during hypoglycemia in type 1 diabetes: insights from functional and metabolic neuroimaging studies. Cell Mol Life Sci. 2016;73:705–722. doi: 10.1007/s00018-015-2079-8. [DOI] [PMC free article] [PubMed] [Google Scholar]
- 3.Magistretti PJ, Allaman IA. Cellular perspective on brain energy metabolism and functional imaging. Neuron. 2015;86:883–896. doi: 10.1016/j.neuron.2015.03.035. [DOI] [PubMed] [Google Scholar]
- 4.Levin BE, Dunn-Meynell AA, Routh VH. CNS sensing and regulation of peripheral glucose levels. Int Rev Neurobiol. 2002;51:219–258. doi: 10.1016/s0074-7742(02)51007-2. [DOI] [PubMed] [Google Scholar]
- 5.Swaab DF, editor. The human hypothalamus. Part 2: Basic and clinical aspects, handbook of clinical neurology, third series. Amsterdam: Elsevier; 2004. [Google Scholar]
- 6.Gruetter R, Ugurbil K, Seaquist ER. Steady-state cerebral glucose concentrations and transport in the human brain. J Neurochem. 1998;70:397–408. doi: 10.1046/j.1471-4159.1998.70010397.x. [DOI] [PubMed] [Google Scholar]
- 7.Shestov AA, Emir UE, Kumar A, et al. Simultaneous measurement of glucose transport and utilization in the human brain. Am J Physiol Endocrinol Metab. 2011;301:E1040–E1049. doi: 10.1152/ajpendo.00110.2011. [DOI] [PMC free article] [PubMed] [Google Scholar]
- 8.de Graaf RA, Pan JW, Telang F, et al. Differentiation of glucose transport in human brain gray and white matter. J Cereb Blood Flow Metab. 2001;21:483–492. doi: 10.1097/00004647-200105000-00002. [DOI] [PubMed] [Google Scholar]
- 9.van Velden FHP, Kloet RW, van Berckel BNM, et al. HRRT versus HR plus human brain PET studies: an interscanner test-retest study. J Nucl Med. 2009;50:693–702. doi: 10.2967/jnumed.108.058628. [DOI] [PubMed] [Google Scholar]
- 10.Walker MD, Sossi V. Commentary: an eye on PET quantification. Mol Imaging Biol. 2015;17:1–3. doi: 10.1007/s11307-014-0809-1. [DOI] [PMC free article] [PubMed] [Google Scholar]
- 11.Poitry-Yamate C, Lei HX, Gruetter R. The rate-limiting step for glucose transport into the hypothalamus is across the blood-hypothalamus interface. J Neurochem. 2009;109:38–45. doi: 10.1111/j.1471-4159.2009.05934.x. [DOI] [PMC free article] [PubMed] [Google Scholar]
- 12.Gruetter R, Novotny EJ, Boulware SD, Rothman DL, Shulman RG. 1H NMR studies of glucose transport in the human brain. J Cereb Blood Flow Metab. 1996;16:427–438. doi: 10.1097/00004647-199605000-00009. [DOI] [PubMed] [Google Scholar]
- 13.Seaquist ER, Damberg GS, Tkáč I, Gruetter R. The effect of insulin on in vivo cerebral glucose concentrations and rates of glucose transport/metabolism in humans. Diabetes. 2001;50:2203–2209. doi: 10.2337/diabetes.50.10.2203. [DOI] [PubMed] [Google Scholar]
- 14.Mangia S, Kumar AF, Moheet AA, et al. Neurochemical profile of patients with type 1 diabetes measured by 1H-MRS at 4 T. J Cereb Blood Flow Metab. 2013;33:754–759. doi: 10.1038/jcbfm.2013.13. [DOI] [PMC free article] [PubMed] [Google Scholar]
- 15.Moheet A, Emir UE, Terpstra M, et al. Initial experience with seven Tesla magnetic resonance spectroscopy of hypothalamic GABA during hyperinsulinemic euglycemia and hypoglycemia in healthy humans. Magn Reson Med. 2014;71:12–18. doi: 10.1002/mrm.24663. [DOI] [PMC free article] [PubMed] [Google Scholar]
- 16.Seaquist ER. Comparison of arterialized venous sampling from the hand and foot in the assessment of in vivo glucose metabolism. Metabolism. 1997;46:1364–1366. doi: 10.1016/s0026-0495(97)90245-6. [DOI] [PubMed] [Google Scholar]
- 17.Gruetter R, Tkáč I. Field mapping without reference scan using asymmetric echo-planar techniques. Magn Reson Med. 2000;43:319–323. doi: 10.1002/(sici)1522-2594(200002)43:2<319::aid-mrm22>3.0.co;2-1. [DOI] [PubMed] [Google Scholar]
- 18.Deelchand DK, Adanyeguh IM, Emir UE, et al. Two-site reproducibility of cerebellar and brainstem neurochemical profiles with short-echo, single-voxel MRS at 3T. Magn Reson Med. 2015;73:1718–1725. doi: 10.1002/mrm.25295. [DOI] [PMC free article] [PubMed] [Google Scholar]
- 19.Öz G, Tkéč I. Short-echo, single-shot, full-intensity proton magnetic resonance spectroscopy for neurochemical profiling at 4 T: validation in the cerebellum and brainstem. Magn Reson Med. 2011;65:901–910. doi: 10.1002/mrm.22708. [DOI] [PMC free article] [PubMed] [Google Scholar]
- 20.Tkáč I, Starcuk Z, Choi IY, Gruetter R. In vivo 1H NMR spectroscopy of rat brain at 1 ms echo time. Magn Reson Med. 1999;41:649–656. doi: 10.1002/(sici)1522-2594(199904)41:4<649::aid-mrm2>3.0.co;2-g. [DOI] [PubMed] [Google Scholar]
- 21.Provencher SW. Estimation of metabolite concentrations from localized in vivo proton NMR spectra. Magn Reson Med. 1993;30:672–679. doi: 10.1002/mrm.1910300604. [DOI] [PubMed] [Google Scholar]
- 22.Deelchand DK, Henry P-G, Ugurbil K, Marjanska M. Measurement of transverse relaxation times of J-coupled metabolites in the human visual cortex at 4 T. Magn Reson Med. 2012;67:891–897. doi: 10.1002/mrm.23080. [DOI] [PMC free article] [PubMed] [Google Scholar]
- 23.Ashburner J, Friston KJ. Multimodal image coregistration and partitioning — a unified framework. NeuroImage. 1997;6:209–217. doi: 10.1006/nimg.1997.0290. [DOI] [PubMed] [Google Scholar]
- 24.Cox RW, Ashburner J, Breman H, et al. A (sort of) new image data format standard: NifTI-1. Proc 10th Annual Meeting of the Organization for Human Brain Mapping; Budapest. 2004. (abstract WE 150) [Google Scholar]
- 25.Liddelow SA. Development of the chorid plexus and blood-CSF barrier. Front Neurosci. 2015;9:1–13. doi: 10.3389/fnins.2015.00032. [DOI] [PMC free article] [PubMed] [Google Scholar]
- 26.Kusmierz J, DeGeorge JJ, Sweeney D, May C, Rapoport SI. Quantitative analysis of polyols in human plasma and cerebrospinal fluid. J Chromatogr. 1989;497:39–48. doi: 10.1016/0378-4347(89)80003-9. [DOI] [PubMed] [Google Scholar]
- 27.Fishman RA. Carrier transport of glucose between blood and cerebrospinal fluid. Am J Physiol. 1964;206:836–844. doi: 10.1152/ajplegacy.1964.206.4.836. [DOI] [PubMed] [Google Scholar]
- 28.Smith SM, Jenkinson M, Woolrich MW, et al. Advances in functional and structural MR image analysis and implementation as FSL. Neuro-Image. 2004;23:208–219. doi: 10.1016/j.neuroimage.2004.07.051. [DOI] [PubMed] [Google Scholar]
- 29.Tkáč I, Öz G, Adriany G, et al. In vivo 1H NMR spectroscopy of the human brain at high magnetic fields: metabolite quantification at 4T vs. 7T. Magn Reson Med. 2009;62:868–879. doi: 10.1002/mrm.22086. [DOI] [PMC free article] [PubMed] [Google Scholar]
- 30.Terpstra M, Cheong I, Lyu T, et al. Test-retest reproducibility of neurochemical profiles with short-echo, single-voxel MR spectroscopy at 3T and 7T. Magn Reson Med. 2015 doi: 10.1002/mrm.26022. Epub ahead of print. [DOI] [PMC free article] [PubMed] [Google Scholar]
- 31.Deelchand DK, Iltis I, Henry P-G. Improved quantification precision of human brain short echo-time 1H magnetic resonance spectroscopy at high magnetic field: a simulation study. Magn Reson Med. 2014;72:20–25. doi: 10.1002/mrm.24892. [DOI] [PMC free article] [PubMed] [Google Scholar]
- 32.Kries R. Issues of spectral quality in clinical 1H-magnetic resonance spectroscopy and a gallery of artifacts. NMR Biomed. 2004;17:361–381. doi: 10.1002/nbm.891. [DOI] [PubMed] [Google Scholar]
- 33.Liu YJ, Gao JH, Liu HL, Fox PT. The temporal response of the brain after eating revealed by functional MRI. Nature. 2000;405:1058–1062. doi: 10.1038/35016590. [DOI] [PubMed] [Google Scholar]
- 34.Smeets PAM, Vidarsdottir S, De Graaf C, et al. Oral glucose intake inhibits hypothalamic neuronal activity more effectively than glucose infusion. Am J Physiol Endocrinol Metab. 2007;293:E754–E758. doi: 10.1152/ajpendo.00231.2007. [DOI] [PubMed] [Google Scholar]
- 35.Mangia S, Tkáč I, Gruetter R, et al. Sensitivity of single-voxel 1H-MRS in investigating the metabolism of the activated human visual cortex at 7T. MRI. 2006;24:343–348. doi: 10.1016/j.mri.2005.12.023. [DOI] [PubMed] [Google Scholar]
- 36.Cox RW, Hyde JS. Software tools for analysis and visualization of FMRI Data. NMR Biomed. 1997;10:171–178. doi: 10.1002/(sici)1099-1492(199706/08)10:4/5<171::aid-nbm453>3.0.co;2-l. [DOI] [PubMed] [Google Scholar]
- 37.Pruessmann KP, Weiger M, Scheidegger MB, Boesiger P. SENSE: sensitivity encoding for fast MRI. Magn Reson Med. 1999;42:952–956. [PubMed] [Google Scholar]
- 38.Barth M, Breuer F, Koopmans PJ, Norris DG, Poser BA. Simultaneous multislice (SMS) imaging techniques. Magn Reson Med. 2016;75:63–81. doi: 10.1002/mrm.25897. [DOI] [PMC free article] [PubMed] [Google Scholar]
- 39.Zaitsev M, Speck O, Hennig J, Buchert M. Single-voxel MRS with prospective motion correction and retrospective frequency correction. NMR Biomed. 2010;23:325–332. doi: 10.1002/nbm.1469. [DOI] [PubMed] [Google Scholar]
- 40.Andrews-Shigaki BC, Armstrong BSR, Zaitsev M, Ernst T. Prospective motion correction for magnetic resonance spectroscopy using single camera retro-grate reflector optical tracking. J Magn Reson Imaging. 2011;33:498–504. doi: 10.1002/jmri.22467. [DOI] [PMC free article] [PubMed] [Google Scholar]
- 41.Hess AT, Tisdall MD, Andronesi OC, Meintjes EM, van der Kouwe AJW. Real-time motion and B0 corrected single voxel spectroscopy using volumetric navigators. Magn Reson Med. 2011;66:314–323. doi: 10.1002/mrm.22805. [DOI] [PMC free article] [PubMed] [Google Scholar]
- 42.Bogner W, Hess AT, Gagoski B, et al. Real-time motion- and Bocorrection for LASER-localized spiral-accelerated 3D-MRSI of the brain at 3T. NeuroImage. 2014;88:22–31. doi: 10.1016/j.neuroimage.2013.09.034. [DOI] [PMC free article] [PubMed] [Google Scholar]
Associated Data
This section collects any data citations, data availability statements, or supplementary materials included in this article.


