

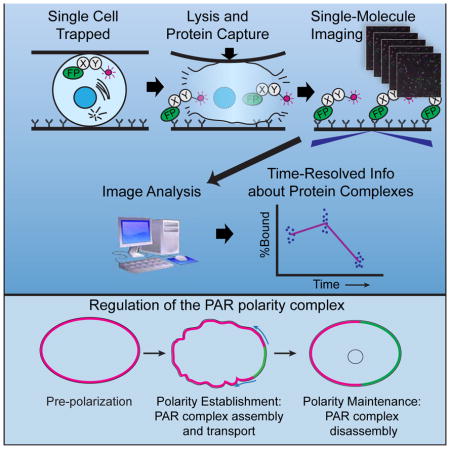
Summary
Regulated protein-protein interactions are critical for cell signaling, differentiation and development. To study dynamic regulation of protein interactions in vivo, there is a need for techniques that can yield time-resolved information and probe multiple protein binding partners simultaneously, using small amounts of starting material. Here, we describe a single-cell protein interaction assay. Single-cell lysates are generated at defined timepoints and analyzed using single-molecule pull-down, yielding information about dynamic protein complex regulation in vivo. We established the utility of this approach by studying PAR polarity proteins, which mediate polarization of many animal cell types. We uncovered striking regulation of PAR complex composition and stoichiometry during C. elegans zygote polarization, which takes place in less than 20 minutes. PAR complex dynamics are linked to the cell cycle by polo-like kinase 1, and govern movement of PAR proteins to establish polarity. Our results demonstrate an approach to study dynamic biochemical events in vivo.
Graphical Abstract
Single-cell analysis is becoming increasingly important for cell biology. Dickinson et al. describe a single-cell assay for protein interactions, using microfluidic lysis and single-molecule pulldown. They apply this approach to show that PAR complex assembly is dynamic, and is linked to the cell cycle, during cell polarization in C. elegans.
Introduction
Regulation of protein-protein interactions is a widespread mechanism for control of cell signaling. In one common signaling paradigm, a cellular event triggers binding (or unbinding) of a signaling protein to factors that regulate its activity. As a consequence of regulated protein complex formation, the signaling protein acquires (or loses) some activity, and can then transduce the signal to initiate a cellular response. Due to their pivotal role in transducing cellular signals, regulated protein-protein interactions are of considerable interest in both basic and applied biomedical research.
Formation and dissolution of protein complexes due to cell signaling necessarily occurs over time, as a cell senses and responds to stimuli. It is therefore critical to study regulated protein-protein interactions using techniques that yield time-resolved information. Because cell signaling is strongly context dependent, protein interactions that are involved in signaling should be studied in vivo in the context of a living animal wherever possible. Biochemical approaches (e.g., co-immunoprecipitation) can reveal important information about protein-protein interactions. However, co-IP requires a large amount of starting material that can be prohibitive for in vivo studies. The need for large amounts of material also limits time resolution and obscures cell-to-cell heterogeneity that can be an important feature of a signaling process (Altschuler and Wu, 2010). Finally, conventional approaches for assaying pairwise protein-protein interactions are ill suited for deconvolving elaborate cell signaling networks in which a protein can have multiple binding partners. Therefore, new approaches to studying regulated protein19 protein interactions using in vivo models are needed.
The need for methods to study dynamic protein-protein interactions is illustrated by the field of cell polarity. Cell polarity is a fundamental property of eukaryotic cells and plays a major role in many aspects of animal biology. In animals, proteins of the PAR system are key polarity determinants. Groups of PAR proteins localize to opposite ends of a cell and influence downstream cellular processes that lead to polarized cell behavior, such as asymmetric mitotic spindle positioning and segregation of cell fate determinants (Goldstein and Macara, 2007). Mutual antagonism between PAR proteins that localize to opposite ends of a cell, coupled with positive feedback within each group, is thought to account for the stable maintenance of opposing PAR domains (Dawes and Munro, 2011; Fletcher et al., 2012; Goehring et al., 2011). Although these basic principles are reasonably well established, the underlying molecular mechanisms are less clear. In the context of a developing animal, cells must respond to external spatial cues that specify the correct axis of polarity, and they must appropriately control the timing of polarity establishment. The PAR system involves at least a dozen proteins and a plethora of interactions (reviewed in (Assémat et al., 2008)), but how these interactions are regulated and coordinated to build a signaling system that responds correctly to spatial and temporal cues is unclear.
This gap in knowledge is due to the fact that the process of cell polarization has so far been challenging to study in vivo using biochemical experiments. To date, no in vivo animal model system has been described in which one can obtain pure populations of synchronously polarizing cells in sufficient quantities for conventional biochemical approaches.
Motivated by this challenge, we developed a biochemical assay that can be applied to single cells. We used microfluidics to generate cell lysates in nanoliter volumes, and we assayed protein-protein interactions in these lysates using a single-molecule pull-down assay performed on proteins tagged at their endogenous genomic loci. We applied this approach to study the PAR polarity system in the C. elegans zygote, a single cell that polarizes with defined and reproducible timing in response to a known spatial cue (Cuenca et al., 2003; Goldstein and Hird, 1996). Our results reveal that PAR protein complexes are dynamically regulated throughout the process of cell polarization. We identified oligomerization of the PAR-3/PAR-6/aPKC complex as a critical, regulated molecular event that enables cell polarization by coupling PAR complex movement to actomyosin cortical flows. Moreover, we found that PAR complex oligomerization is regulated by the cell cycle kinase PLK-1, revealing a mechanism by which the timing of PAR complex transport is linked to cell cycle progression. Our results provide molecular insight into the regulation of cell polarity establishment in metazoans and introduce an approach that will be valuable for studying diverse cell biological problems.
Design
In order to study the dynamic molecular events that occur during C. elegans zygote polarization, we developed a biochemical assay that can be performed on individual, precisely staged zygotes. We first designed a simple microfluidic device for cell lysis in small volumes. The device consists of a flow channel 75 μm wide, 30 μm high and 8 mm long, with a total volume of 18 nL (Figure 1A). The exact dimensions were chosen to accommodate C. elegans embryos, but could be adjusted for other sample types. We fabricated this device from optically clear polydimethylsiloxane (PDMS) and bonded it to a glass coverslip to create a closed channel. To use the device, we placed a cell in the inlet well and allowed it to be drawn into the channel by gravity-driven flow, where it was trapped in the center of the chamber by a constriction smaller than the cell. Once trapped, the cell could be observed, staged, and allowed to continue developing if desired. To generate a lysate, the device was sealed to stop flow, and the zygote was crushed by pressing gently on the surface of the PDMS. In preliminary experiments, we found that sealing the device was critical to eliminate flow and to generate a confined lysate with minimal dilution. We crushed cells in a lysis buffer containing detergent in order to extract both cytosolic and membrane-associated proteins.
Figure 1. A single-cell biochemistry assay for the C. elegans zygote.

A) Illustration of the approach. A C. elegans embryo, staged based on morphology, is placed into a flow chamber and trapped in the center by a small constriction. The embryo is crushed to generate a lysate, and proteins of interest are captured using antibodies bound to the coverglass floor of the chamber. The device is placed directly on a TIRF microscope to interrogate molecular complexes via single-molecule imaging.
B) Images of mNG::HaloTag molecules pulled down from a single embryo labeled with JF646 HaloTag ligand. The mNG channel is shown in green and the JF646 (far red) channel is shown in red. Scale bars represent 5 μm.
C) Quantification of the number of green and far-red spots per image as a function of position along the length of the chamber.
D) Quantification of the fraction of colocalized spots for an mNG::HaloTag fusion protein labeled with JF646 (left graph), an mNG::mKate2 fusion protein (center graph) or an mScarlet-I::HaloTag fusion protein labeled with JF646 (right graph).
E) Images of mNG::AraD tetramers pulled down from a single embryo. Scale bars represent 5 μm.
F) Example of a photobleaching trace from a single mNG::AraD complex, showing four photobleaching steps.
G) Blue bars: histogram showing the distribution of photobleaching step counts in a population of molecules (data from four single-embryo experiments are combined). Red line: fit of the data to the binomial distribution , where PN is the probability of detecting N photobleaching steps given the fraction d of mNG molecules detected in this assay.
See also Figures S1, S2 and S3.
To assay protein-protein interactions in single-cell lysates, we adapted an assay called single-molecule pull-down (SiMPull) (Jain et al., 2011; Padeganeh et al., 2013). To perform SiMPull in microfluidic channels, we first functionalized the inside of each channel with polyethylene glycol (PEG) to prevent non-specific protein adsorption. Although we began by testing a published protocol for cleaning and PEG functionalization of our chambers (Jain et al., 2012), in our hands this procedure yielded coverslips with relatively high levels of background fluorescence contamination. We therefore adopted an alternative cleaning and PEGylation protocol (see Methods). Next, we attached antibodies recognizing a protein of interest to the inside of each lysis chamber via a biotin-streptavidin linkage (Figure 1A, right side; see Methods). To avoid antibody-induced dimerization of proteins of interest, we exclusively used monovalent affinity reagents (nanobodies or Fab fragments) for the experiments reported here. Finally, we introduced a cell into the chamber and crushed it to generate a lysate as described above. Upon cell lysis, proteins of interest from the lysate were immunoprecipitated onto the coverslip surface, and then detected via single-molecule total internal reflection fluorescence (TIRF) microscopy (Figure 1A, right side). Importantly, this assay is rapid: data collection begins within 2–3 minutes after lysis and is generally complete within 10–20 minutes after lysis. Given this time frame, we expect that some weak or transient complexes will dissociate (a common limitation in biochemical experiments), but interactions with moderate-to-high affinity should be detectable. We refer to this assay as single-cell SiMPull or sc-SiMPull.
The raw data from an sc-SiMPull experiment are multicolor TIRF movies of single molecules immunoprecipitated from single-cell lysates. Information about macromolecular complexes is obtained from colocalization between signals in different fluorescent channels and from the photobleaching behavior of single complexes (see below). We routinely acquire images at 15–20 stage positions along the length of microfluidic chamber, capturing up to 1000 image frames at each stage position, and typically observe several thousand single molecules per experiment. Given the quantity of data generated, automated analysis of the images is required. We developed software to automatically identify precipitated molecules (diffraction-limited spots), to classify them as colocalized or not, and to determine the number of steps in which each spot photobleached. To identify spots, we used a probabilistic segmentation algorithm that separates signal from background in an unbiased way (Padeganeh et al., 2013). Spots were identified separately for each fluorescent channel, then classified as colocalized if signal was present in the same location (within the resolution of the microscope) in two different channels. Our software includes an image viewer for inspection of spot detection and colocalization results (Figure S1A). In control experiments, we found that some amount of autofluorescent background was unavoidable, especially when using 488 nm excitation; however, we could reliably distinguish bona fide immunoprecipitated protein signals from autofluorescent background based on their fluorescence intensity (Figure S1B). Therefore, we implemented a filtering routine that separates signal from background and eliminates background spots from the data (Figures S1B and C). Finally, to characterize the photobleaching behavior of immunoprecipitated protein complexes, we extracted the fluorescence intensity of each signal as a function of time. We detected stepwise changes in signal intensity (corresponding to photobleaching steps) in an automated and unbiased way using a Bayesian changepoint detection algorithm designed for single-molecule data (Ensign and Pande, 2010) (Figure S2). In addition to the core modules that process the raw imaging data, we developed a suite of tools for visualizing and interacting with sc-SiMPull data. The full software package is available as open source code (see Methods).
In order to apply sc-SiMPull to endogenous cellular proteins, the proteins of interest need to be fused to fluorescent tags. For the results to be maximally interpretable, 100% of each protein of interest should be labeled (i.e., no unlabeled protein should be present in the cell), and the tagged proteins should be expressed at endogenous levels under native regulatory control. We therefore used CRISPR/Cas9-triggered homologous recombination (Dickinson et al., 2015; 2013) to insert fluorescent tags into endogenous genomic loci. All results reported in this paper were obtained using endogenously tagged proteins, except where otherwise noted. Importantly, because we developed sc-SiMPull using antibodies directed against fluorescent tags, and introduced these tags into endogenous genes, our approach is readily adaptable to any protein of interest. It is not necessary to test new antibodies or re23 optimize conditions to apply sc-SiMPull to a new target, provided that the protein complexes in question are sufficiently stable and the protein of interest can remain functional when fused to a fluorescent tag.
Results
Detection and quantification of labeled proteins from single cells
To test whether sc-SiMPull could be used to visualize protein complexes from single cells, we examined several control proteins. First, to examine how efficiently we could detect two different fluorescent tags that are physically associated, we expressed mNeonGreen fluorescent protein (mNG) (Shaner et al., 2013) fused to HaloTag. We labeled embryos with far-red JaneliaFluor 646 (JF646) HaloTag ligand (Grimm et al., 2015) by feeding the dye to young adult worms in liquid culture (see Methods). We then dissected single embryos, lysed them by crushing in devices functionalized with monovalent anti-HaloTag Fab fragments, and examined the resulting samples using TIRF microscopy. We detected abundant diffraction-limited spots in both the green (mNG) and far-red (JF646) fluorescence channels, and most of these signals colocalized (Figure 1B). A large majority (95.8% ± 0.9%; unless otherwise noted, ranges correspond to mean ± 95% confidence interval throughout this paper) of mNG::Halo spots photobleached in a single step, indicating that they correspond to individual mNG::Halo fusion protein molecules (Figure S3). To examine the spatial distribution of cellular protein molecules in our devices after cell lysis, we acquired TIRF images at multiple stage positions along the length of the microfluidic channel and determined the number of molecules in each image. The density of molecules exhibited a sharp peak in the center of the channel, near where the cell was lysed, and decreased in both directions moving away from the point of lysis (Figure 1C). The peak of signal covered approximately 2 mm, which corresponds to a volume of approximately 5 nL. We observed only background signal levels outside of the main peak, indicating that all of the molecules of interest were captured before they diffused out of this volume.
To examine the efficiency of single-molecule detection, we quantified colocalization between green and far-red signals in the mNG::HaloTag pull-down experiments. 68% ± 3% of far-red spots colocalized with green spots (Figure 1D, left panel), indicating that ~70% of mNG molecules produced detectable fluorescence under our experimental conditions. This fraction is comparable to previous reports for single-molecule assays using fluorescent proteins (Jain et al., 2011; Padeganeh et al., 2013). Conversely, 79% ± 3% of green spots colocalized with far-red spots (Figure 1D, left panel), indicating that we could detect ~80% of HaloTag molecules after labeling with the JF646 ligand. The fact that less than 100% of molecules were detected in our experiments is likely due to a number of factors, including pre-bleaching by ambient light prior to TIRF imaging, incomplete fluorescent protein maturation (in the case of mNG) or incomplete labeling (in the case of HaloTag).
We used a similar experiment to examine the performance of red fluorescent proteins in sc-SiMPull experiments. We first tested mKate2, but found that we could detect only ~30% of mKate2 molecules in the context of an mNG::mKate2 fusion protein (Figure 1D, center panel). Moreover, we found that the mNG::mKate2 fusion protein had a tendency to aggregate, in contrast to the mNG::HaloTag fusion protein that was strictly monomeric (Figure S3). Thus, although we continued to use mKate2 for live imaging experiments, we avoided using it in sc-SiMPull experiments. We also tested the recently-developed mScarlet-I fluorescent protein (mSc), which was engineered for improved maturation and monomeric character (Bindels et al., 2017). In the context of an mSc::HaloTag fusion, we were able to detect fluorescence from ~50% of mSc molecules, an almost two-fold improvement over mKate2 (Figure 1D, right panel). mSc was also less aggregation-prone than mKate2, although it was still not strictly monomeric (Figure S3). We conclude that mNG and HaloTag-JF646 are superior probes for two-color colocalization experiments, while mSc is an acceptable choice for sc-SiMPull experiments in which three colors are required.
Single-molecule assays, including SiMPull, allow measurement of protein complex stoichiometry by counting photobleaching steps (Jain et al., 2011; Padeganeh et al., 2013; Ulbrich and Isacoff, 2007). To determine whether we could accurately measure stoichiometry of protein complexes isolated from single cells, we produced a known stoichiometry by expressing mNG fused to AraD, a metabolic enzyme from E. coli that folds as a tetramer (Lee et al., 1968; Luo et al., 2001). AraD was chosen as a control protein because it is exclusively tetrameric in solution, with no detectable monomer fraction (Lee et al., 1968); because it has no C. elegans homolog, and thus would not be expected to form hetero11 tetramers with any C. elegans protein; and because it could be robustly expressed without apparent toxicity in the C. elegans germline. We observed abundant diffraction-limited signals when mNG::AraD was pulled down from single embryos using monovalent anti-mNG nanobodies (Figure 1E). Many spots photobleached in four discrete steps (Figure 1F), consistent with the expected tetrameric stoichiometry of mNG::AraD. Using automated photobleaching step detection (Figure S2 and Methods), we determined the apparent stoichiometry of thousands of mNG::AraD complexes. Consistent with the fact that not all mNG molecules were fluorescent, we observed a distribution of up to four photobleaching step counts in the whole population (Figure 1G). Given a pure population of tetramers and a fluorophore detection efficiency less than 100%, the probability of observing a certain number of photobleaching steps is given by the binomial distribution (see Methods for a more detailed discussion). The observed distribution of photobleaching steps was well fit by a binomial distribution with detection efficiency of 69.0% ± 0.5% (Figure 1G), which is in good agreement with the 68% ± 3% detection efficiency for mNG that we measured in the mNG::HaloTag fusion experiments (Figure 1D). Importantly, we detected few spots with >4 photobleaching steps, indicating that we mainly observed single tetramers and not larger aggregates. Together, these data indicate that we were able to reliably detect and accurately quantify exogenously expressed control proteins from single-embryo lysates using our sc-SiMPull assay.
Application of sc-SiMPull to the PAR polarity system
The C. elegans zygote is an appealing model for studying cell polarization by the PAR system, because polarization occurs via a series of defined and reproducible stages during the first embryonic cell cycle (Figure 2A) (Cuenca et al., 2003). At the beginning of the first cell cycle, immediately after fertilization, the cell is in a pre-polarized state, with the anterior proteins PAR-6 and aPKC occupying the entire cell cortex and the posterior PAR proteins in the cytoplasm. After maternal meiosis and polar body extrusion, the cell enters the polarity establishment phase, in which anterior PAR proteins are segregated to the anterior and a domain containing posterior PAR proteins is formed. Polarity establishment is achieved by actomyosin-driven cortical flow that is thought to physically transport anterior PAR protein complexes to the anterior side of the cell (Cheeks et al., 2004; Goehring et al., 2011; Munro et al., 2004). Finally, anterior and posterior PAR domains are stable during a polarity maintenance phase that lasts several more minutes and encompasses pronuclear migration and mitosis.
Figure 2. aPKC and PAR-6 are constitutively associated but dynamically oligomerize.

A) Illustration of the events that lead to zygote polarization. See text for a detailed description.
B) Schematic of a SiMPull experiment to analyze the PAR-6/aPKC interaction. Individual embryos were staged based on morphology, and endogenously tagged PAR-6::HaloTag was pulled down. The single-molecule images shown are actual data from pull-downs at the indicated stages. Scale bars represent 5 μm. Note that the oligomeric complexes (arrowheads) are not macroscopic; they are diffraction-limited objects, but appear larger because the images were scaled so that monomers would be visible.
C, D) Measurements of the fraction of PAR-6 molecules in complex with aPKC (C) or the fraction of aPKC molecules in complex with PAR-6 (D) at the indicated stages. Each circle in the plots shows the result of one single-cell experiment, with the size of the circle representing the number of molecules that were counted in that experiment. The lines show the weighted mean, and error bars represent 95% confidence intervals.
E) Measurement of the fraction of PAR-6/aPKC heterodimers found in oligomers of different sizes. The experiment was conducted by pulling down PAR-6::HaloTag and counting the number of co-precipitated mNG::aPKC molecules in each complex. For each stage, the distribution of numbers of molecules found in oligomers of different sizes is shown as a vertical histogram. For clarity, the monomer fraction (80–90% of total molecules) is not shown. n = 10,138 molecules counted from 7 embryos for pre-polarization phase, n = 5,698 molecules counted from 6 embryos for establishment phase, n = 5,550 molecules counted from 6 embryos for maintenance phase and n = 6,944 molecules counted from 7 embryos for establishment embryos derived from mothers treated with par-3 RNAi.
F) Images of cortical PAR-6::mNG in live embryos at the indicated stages. Anterior is to the left. Scale bar represents 10 μm.
Although the cellular mechanisms of polarity establishment in the C. elegans zygote are reasonably well understood, this process has so far been inaccessible to biochemical experiments. It is impossible to collect sufficient numbers of precisely staged zygotes to perform bulk biochemical assays, because polarity establishment is rapid (the establishment phase lasts less than 10 minutes) and fertilization in C. elegans is asynchronous. As a result, important mechanistic questions remain unanswered, including: Are PAR protein interactions dynamically regulated during cell polarization? Do specific PAR complexes have unique roles during polarity establishment vs. maintenance? How are interactions between PAR proteins regulated? We applied sc-SiMPull, together with targeted mutations, to begin to address these questions.
aPKC and PAR-6 are constitutively associated but dynamically oligomerize
We began by assaying two anterior PAR proteins that we expected would strongly interact: the anterior kinase aPKC and its partner PAR-6. Genetic evidence from C. elegans (Rodrigues, Peglion et al., this issue of Developmental Cell) and biochemical experiments performed on the mammalian homologs (Graybill et al., 2012) indicate that PAR-6 and aPKC form a tight, perhaps even constitutive, heterodimer. To detect this interaction via sc-SiMPull, we constructed a strain carrying endogenously tagged PAR-6::HaloTag and mNG::aPKC, labeled embryos with Halo-JF646, and pulled down PAR-6 from staged zygotes using anti-HaloTag. PAR-6::HaloTag molecules robustly colocalized with mNG::aPKC when pulled down from pre-polarization, establishment and maintenance phase zygotes (Figure 2B). Quantitatively, 40–50% of PAR-6 molecules were detectably associated with aPKC at all three stages (Figure 2C). We also performed the converse experiment, using the same strain but substituting anti-mNG for anti-HaloTag, and found that similarly 40–50% of aPKC molecules were detectably associated with PAR-6 across the first cell cycle (Figure 2D). Considering that a maximum of 70–80% colocalization was detected for a covalently linked homodimer of mNG and HaloTag (Figure 1D), these data indicate that a majority of PAR-6 and aPKC are in complex with each other throughout the first cell cycle, as expected.
Although a complex between PAR-6 and aPKC was expected, we were surprised to find that the stoichiometry of this complex was not constant across the cell cycle. We observed large oligomeric complexes containing PAR-6 and aPKC from embryos lysed during polarity establishment, but not during pre-polarization or maintenance phases (Figure 2B, arrowheads). We determined the stoichiometry of PAR-6/aPKC oligomers by counting mNG photobleaching steps (Figure 2E). During establishment phase, we observed complexes that contained as many as 15 copies of aPKC, and 4.5% of total aPKC molecules were present within oligomers containing 4 or more subunits. These measurements likely underestimate the true extent of PAR-6/aPKC oligomerization, because of an inherent limitation of the step-counting approach: when two mNG molecules bleach simultaneously, they are counted as a single step. Simultaneous bleaching of two or more molecules becomes more likely when a complex contains a larger number of fluorophores (Ulbrich and Isacoff, 2007). Thus, step counting faithfully reports the stoichiometry of small complexes (Figure 1G) but systematically underestimates the size of larger complexes (for a detailed analysis, see the section headed “Impact of incomplete fluorophore maturation and simultaneous bleaching events on stoichiometry measurements” in the Methods). Despite this limitation, it is clear that the formation of large PAR-6/aPKC oligomers is upregulated during polarity establishment.
To corroborate these biochemical results in the context of an intact embryo, we performed live imaging of cortical PAR-6::mNG in 1-cell embryos. We found that endogenously tagged PAR-6 formed bright clusters during establishment phase, but not during pre-polarization or maintenance phases (Figure 2F). This observation supports our biochemical result that large oligomers mainly form during establishment phase. However, we emphasize that in vivo imaging data alone cannot establish the molecular identity of clusters; bright punctae observed in cells could be molecular oligomers, or another cellular structure (for example, tethered vesicles or membrane microdomains). Our biochemical finding that PAR-6 and aPKC form molecular oligomers during establishment phase, together with data from mutants (presented below), strongly suggests that the punctae observed in cells are oligomers containing PAR-6 and aPKC.
PAR-3 dynamically oligomerizes and mediates oligomerization of PAR-6/aPKC
A likely candidate for recruiting PAR-6 and aPKC into oligomeric complexes is another anterior PAR protein, PAR-3. PAR-3 can bind directly to both PAR-6 and aPKC in vitro, and the three proteins have been proposed to form a trimeric complex (Hung and Kemphues, 1999; Joberty et al., 2000; Lin et al., 2000). Furthermore, PAR-3 is known to oligomerize in other systems (Benton and St Johnston, 2003a; Mizuno et al., 2003), and structure-function studies have highlighted an important role for the N-terminal oligomerization domain in cell polarization (Benton and St Johnston, 2003a; Feng et al., 2007; Li et al., 2010; McKinley et al., 2012). Indeed, when we depleted PAR-3 from PAR-6::HaloTag; mNG::aPKC embryos using RNAi, oligomers of PAR-6/aPKC disappeared (Figure 2E), confirming that oligomerization of PAR-6/aPKC requires PAR-3.
We therefore tested directly whether C. elegans PAR-3 forms oligomers. Indeed, when we pulled down mNG::PAR-3 from staged zygotes, we saw large oligomeric complexes that were specific to establishment phase (Figure 3A). 8.6% of detected PAR-3 molecules were present in oligomers containing 4 or more subunits, a larger fraction than for PAR-6/aPKC (Figure 3B). This may simply reflect that the monomeric pool of PAR-3 is smaller than for PAR-6/aPKC, so that oligomers contain a larger fraction of the total cellular protein. The distribution of sizes of PAR-3 oligomers was similar to that for PAR-6/aPKC (Figure 3B), consistent with the possibility that each PAR-3 monomer can recruit one PAR-6/aPKC heterodimer into a larger oligomeric complex. We also imaged mNG::PAR-3 at the cortex of live embryos and found that it formed bright clusters that were specific to establishment phase (Figure 3C). These clusters colocalized with PAR-6 (Figure 3D). Clusters containing both PAR-3 and PAR-6 formed, moved towards the anterior during polarity establishment, and dissolved in concert at the onset of maintenance phase (Figure 3D). Again, although these imaging experiments do not provide direct information about molecular interactions, they are consistent with our sc-SiMPull results and further indicate that PAR-3/PAR-6/aPKC oligomers localize to the cell cortex and are segregated to the anterior during polarity establishment.
Figure 3. PAR-3 forms large oligomers during polarity establishment.

A) Images of mNG::PAR-3 pulled down from embryos of the indicated stages. Scale bars represent 5 μm.
B) Measurement of the abundance of mNG::PAR-3 oligomers of different sizes as a function of embryonic stage. For each stage, the distribution of numbers of molecules found in oligomers of different sizes is shown as a vertical histogram. For clarity, the monomer fraction (80–90% of total molecules) is not shown. n = 5,914 molecules counted from 7 embryos for pre-polarization phase, n = 4,741 molecules counted from 9 embryos for establishment phase and n = 17,201 molecules counted from 9 embryos for maintenance phase.
C) Images of cortical mNG:PAR-3 in live embryos at the indicated stages. Anterior is to the left. Scale bar represents 10 μm.
D) Kymograph of cortical mNG::PAR-3 (green) and PAR-6::mKate2 (magenta) during the first cell cycle. Anterior is to the left. Horizontal scale bar represents 10 μm and vertical scale bar represents 1 min.
PAR-3 oligomerization promotes PAR complex assembly
We next investigated the relationship between PAR-3 oligmerization and its association with PAR-6/aPKC. When we pulled down mNG::PAR-3 from establishment phase embryos in a strain also carrying PAR-6::HaloTag, we saw that large PAR-3 oligomers were clearly associated with PAR-6, as expected (Figure 4A). Surprisingly, however, dimmer PAR-3 spots only rarely appeared to be associated with PAR-6. We counted the fraction of PAR-3 oligomers of different sizes that contained PAR-6 and found that although PAR-3 oligomers were nearly always associated with PAR-6, PAR-3 monomers bound PAR-6 at much lower levels (Figure 4B, blue bars). We considered that this result might simply reflect incomplete occupancy of PAR-3 monomers by PAR-6: if each PAR-3 monomer has a certain probability of being bound to PAR-6, then oligomers with more copies of PAR-3 would be more likely to contain at least one copy of PAR-6. However, this simple probabilistic argument cannot explain our data: binomial models based on different degrees of occupancy of PAR-3 by PAR-6 predict either much lower levels of PAR-6 bound to PAR-3 oligomers, or much higher levels of PAR-6 bound to PAR-3 monomers (Figure 4B, red curves). Thus, it appears that oligomerization of PAR-3 promotes its association with PAR-6; that is, oligomerization of PAR-3 and its binding to PAR-6 may occur cooperatively.
Figure 4. PAR-3 oligomerization and PAR complex assembly occur in concert.

A) Image of mNG::PAR-3 (green) and PAR-6::HaloTag (magenta) pulled down from an establishment-phase embryo using an anti-mNG nanobody. Note that the bright mNG::PAR-3 spots (oligomers) colocalize with PAR-6::HaloTag, but the dimmer mNG::PAR-3 spots (monomers) do not. Scale bar represents 5 μm.
B) Blue bars: Fraction of PAR-3 oligomers of different sizes that were found associated with PAR-6::HaloTag. Red curves: predicted results from a simple model in which all PAR-3 monomers have an equal probability of being bound to PAR-6, regardless of whether they are part of a larger oligomer. The numbers at right show the bound fraction used to calculate each curve.
C) Measurements of the fraction of PAR-3 molecules in complex with PAR-6 at the indicated stages. Each circle in the plots shows the result of one single-cell experiment, with the size of the circle representing the number of molecules that were counted in that experiment. The line shows the weighted mean, and error bars represent 95% confidence intervals.
D) Images of cortical mNG::PAR-3 (green) and PAR-6::mKate2 (magenta) in establishment and maintenance phases.
E) Quantification of the extent of colocalization between PAR-6::mKate2 and mNG::PAR-3 using two different colocalization metrics. Each pair of data points from the same embryo is connected by a line.
If PAR-3 oligomerization and PAR complex assembly are indeed cooperative, we predicted that PAR-3 should interact less with PAR-6 during the pre-polarization and maintenance phases, when large PAR-3 oligomers are absent. We directly tested this prediction using sc-SiMPull. Indeed, PAR-3 complexes containing PAR-6 were most prevalent during establishment phase and dropped sharply during polarity maintenance, to a level comparable to that observed for PAR-3 monomers during establishment phase (Figure 4C). In pre-polarization embryos, the mean fraction of PAR-3 molecules in complex with PAR-6 was intermediate between establishment and maintenance phases (Figure 4C, purple line); however, inspection of the individual data points (blue circles) revealed that the majority of pre-polarization embryos had low levels comparable to what we observed during maintenance phase, while a few samples had higher levels more similar to establishment-phase embryos. A likely explanation for this result is that the PAR-3/PAR-6 interaction is upregulated at the end of the pre-polarization phase, and the pre-polarization embryos with higher amounts of the complex were collected later, closer to the onset of establishment. We conclude that PAR-3 oligomerization and PAR complex assembly occur in concert. We note that we were only able to draw this conclusion because our assay visualizes single protein complexes; a bulk biochemical assay could have shown an interaction between PAR-3 and PAR-6, but could not have revealed that PAR-6 preferentially associates with PAR-3 oligomers.
We also measured the colocalization between PAR-6 and PAR-3 at the cortex of live embryos, and found that PAR-6 colocalized with PAR-3 to a lesser extent during maintenance phase (Figures 4D and E). This supports our biochemical finding that disassembly of large PAR-3 oligomers coincides with loss of PAR-3 binding to PAR-6 during polarity maintenance.
PAR-3 oligomerization is required for normal polarity establishment
Prior studies have suggested that PAR-3 oligomerization may contribute to maintenance of stable PAR domains during polarity maintenance phase (Dawes and Munro, 2011; Sailer et al., 2015). However, we observed that the largest PAR-3 oligomers were present during establishment phase rather than maintenance phase (Figure 3B). Although this result does not rule out a role for small oligomers (containing fewer than four subunits) during polarity maintenance, it suggests that larger oligomers may have a specific and previously unknown function during polarity establishment. Although previous studies suggested an important role for PAR-3 oligomerization in cell polarization (Benton and St Johnston, 2003a; Feng et al., 2007; Li et al., 2010; McKinley et al., 2012), these studies mainly used endpoint assays for polarity and did not investigate whether PAR-3 oligomerization contributes to the process of polarity establishment. We therefore decided to investigate the control of PAR-3 oligomerization and its importance for polarity establishment in the C. elegans zygote.
To investigate how PAR-3 oligomerization contributes to polarity establishment, we made targeted mutations to render endogenous PAR-3 monomeric. Based on the structure of the mammalian PAR-3 N-terminus (Zhang et al., 2013), we made two different sets of point mutations to disrupt electrostatic interactions that mediate self-association of PAR-3 (Figure 5A). In one mutant, termed par-3(RRKEEE), we reversed the charges of 3 basic residues that make electrostatic contacts with acidic residues on an adjacent protomer (Figure S4A). In the second mutant, termed par-3(TTDE), we introduced negatively charged residues in place of two threonines that reside on the positively charged side of the dimerization interface and pack closely against the adjacent protomer (Figure S4A). We introduced these mutations into the endogenous par-3 gene using Cas9-triggered homologous recombination. We then used sc-SiMPull from establishment-phase embryos to confirm that both sets of mutations abolished PAR-3 oligomerization as predicted (Figure 5B and S4B) without affecting the levels of PAR-3 protein in the cell (Figure S4C). Both sets of mutations caused similar phenotypes and affected the localization of PAR-3 similarly (see below). Since both mutants behaved equivalently in our assays, we mainly used the par-3(RRKEEE) mutant to examine how PAR-3 oligomerization contributes to cell polarization.
Figure 5. PAR-3 oligomerization is essential for proper polarity establishment.

A) PAR-3 domain structure illustrating the location of RRKEEE point mutations that were introduced into endogenous PAR-3 to block oligomerization.
B) Distribution of oligomer sizes for PAR-3 WT, RRKEEE and TTDE during establishment phase. The WT data from Figure 3B are presented again here to facilitate comparison. n = 4,741 molecules counted from 9 embryos for WT, n = 11,843 molecules counted from 10 embryos for RRKEEE and n = 18,401 molecules counted from 8 embryos for TTDE.
C) Localization of endogenously-tagged PAR-6::mKate2 and mNG::PAR-2 in wild-type and par-3(RRKEEE) zygotes. For each example, the top row shows PAR-6::mKate2 localization in inverted contrast; the middle row shows PAR-6::mKate2 (magenta) and mNG::PAR-2 (green); and the bottom row shows measurements of fluorescence intensity as a function embryo length.
D) Cortical flow rates measured during establishment phase in wild-type and par-3(RRKEEE) zygotes. The wild-type rate is similar to previous reports (Cheeks et al., 2004; Hird and White, 1993).
E) Example of the shift in cleavage furrow position toward the center of the cell in a par-3(RRKEEE) embryo. These two examples were chosen because they had cleavage furrow positions as close as possible to the mean of each population.
F) Quantification of cleavage furrow position in wild-type and par-3(RRKEEE) zygotes.
G) Example of cell mis-positioning at the 4-cell stage in the par-3(RRKEEE) mutant. 36% (9/25) of par-3(RRKEEE) mutants showed this phenotype; the remaining embryos had normal cell positioning at the 4-cell stage.
See also Figures S4 and S5 and Table S1.
We examined the effect of par-3(RRKEEE) on cell polarization by monitoring the localization of PAR-6 and the posterior polarity protein PAR-2 (Figure 5C). Strikingly, 100% (n=18) of par-3(RRKEEE) mutants failed to segregate PAR-6 to the anterior during polarity establishment, even though PAR-6 was still localized to the cortex in these embryos. The majority of embryos (14/18) were still able to form a posterior PAR-2 domain, although it appeared less well defined than in wild-type (Figure 5C, mutant class 1). PAR-6 and PAR-2 overlapped at the posterior cortex of these embryos. The remaining embryos (4/18) completely failed to establish PAR polarity, with PAR-6 uniformly localized at the cortex and PAR-2 retained in the cytoplasm (Figure 5C, mutant class 2). We examined the distribution of PAR-6 on the cortex of par-3(RRKEEE) zygotes and found that, although PAR-6 was still present on the cortex, it did not form clusters and did not segregate to the anterior in par-3(RRKEEE) mutants (Figure S5A).
Segregation of anterior PAR proteins during polarity establishment is thought to be due to physical transport by actomyosin-driven cortical flow (Cheeks et al., 2004; Goehring et al., 2011; Munro et al., 2004). Importantly, cortical flow still occurred in par-3(RRKEEE) zygotes, albeit with slightly reduced velocity (Figure 5D); thus, the failure to segregate PAR-6 to the anterior cannot be attributed to lack of cortical flow in these mutants.
We observed phenotypes consistent with defects in polarity establishment in monomeric par-3 mutants. Two independent par-3(RRKEEE) strains and the par-3(TTDE) mutant strain exhibited significant embryonic lethality, and a large fraction of the surviving animals were sterile (Figure S5B). The position of the first cleavage furrow was more variable and shifted towards the anterior in par-3(RRKEEE) mutants compared to wild-type, resulting in a first division that was less asymmetric than in wild-type (Figures 5E and F). During the second cell division in C. elegans, the posterior P1 cell normally rotates its mitotic spindle to lie along the anterior-posterior (AP) axis, while the spindle in the anterior AB cell is oriented perpendicular to the AP axis. This division pattern results in a rhombus-shaped arrangement of cells in a normal 4-cell embryo (Figure 5G). Mutations that disrupt zygote polarity can alter spindle orientation at the second division, resulting in an abnormal arrangement of cells at the 4-cell stage (Cheng et al., 1995; Etemad-Moghadam et al., 1995; Kemphues et al., 1988). P1 spindle rotation failed to occur in 36% (9/25) of par-3(RRKEEE) mutants, resulting in an abnormal square-shaped arrangement of cells at the 4-cell stage (Figure 5G). Importantly, par-3(RRKEEE) embryos did not exhibit a typical par-3 loss-of-function phenotype in which both spindles rotate, resulting in all four cells in a line at the 4-cell stage (Cheng et al., 1995; Etemad-Moghadam et al., 1995; Kemphues et al., 1988). In addition to the P1 spindle defects, we observed other phenotypes consistent with a loss of posterior identity. MEX-5, an RNA-binding protein involved in cell fate specification that is normally depleted from the posterior cytoplasm and forms a gradient along the AP axis (Griffin et al., 2011; Schubert et al., 2000), formed a shallower gradient in par-3(RRKEEE) mutants (Figures S5D–F). P granules, which contain germline fate determinants and are normally segregated exclusively to the germline P lineage (Hird et al., 1996; Strome and Wood, 1982), were mis-segregated in 76% (19/25) of par-3(RRKEEE) embryos (Figure S5G and Table S1). Together, these results suggest that specification of the posterior cell fate may be compromised in par-3(RRKEEE) mutants (see Discussion).
Oligomerization is required for membrane association and efficient anterior transport of PAR-3
We next investigated at the cellular level how PAR-3 oligomerization contributes to polarity establishment. As a first step, we examined the localization of PAR-3(RRKEEE) and PAR-3(TTDE). Although wild-type PAR-3 localized to the cell cortex during polarity establishment and maintenance, the monomeric PAR-3 mutants were completely cytoplasmic (Figure 6A). This result, obtained using mutations generated at the endogenous par-3 locus, is consistent with previous overexpression experiments in mammalian cells (Feng et al., 2007) and C. elegans (Li et al., 2010). However, in Drosophila epidermal cells, overexpressed PAR-3 lacking the oligomerization domain still associated with the plasma membrane (McKinley et al., 2012), as did our monomeric PAR-3 mutants at later stages of development (Figure S4E). Thus, the ability of monomeric PAR-3 to stably associate with the plasma membrane appears to depend on the cell type and possibly expression level.
Figure 6. PAR-3 oligomerization facilitates polarity establishment by coupling PAR-3 to cortical flows.

A) Localization of mNG::PAR-3, mNG::PAR-3(RRKEEE) and mNG::PAR-3(TTDE) at the indicated embryonic stages.
B) Quantification of the total amount of cortical mNG::PAR-3 fluorescence in wild-type embryos as a function of time. Each curve is a measurement from a single embryo. The curves were aligned in time based on cytokinesis onset and were offset in the Y direction for better visibility.
C) Tracks of cortical PAR-3 clusters from among the brightest 25% or dimmest 25% of all particles tracked. For each panel, 25 tracks were selected at random from the total pool of 468 tracks and superimposed with the origin indicated by the cross. Anterior is to the left.
D) Velocity autocorrelation as a function of time step (Δt) for PAR-3 particles of different intensity. Vcorr > 0 indicates directed motion.
E) The same 25 PAR-3 tracks as in (C), after transformation to a cortical frame of reference by subtracting cortical flow (see text for a detailed explanation).
F) Velocity autocorrelation as a function of time for PAR-3 particles in the cortical frame of reference.
G) Distributions of track lengths for four populations of cortical PAR-3 particles binned based on intensity, and
H) Distributions of the Péclet number (the ratio of advective to diffusive transport rates) for PAR-3 particles of different intensities. For each plot, the whiskers show the 10th and 90th percentiles, and the center line shows the median. n = 4,256 particles tracked from 3 embryos. ** indicates p < 0.01 and **** indicates p < 0.0001 (Kruksal-Wallis test with Dunn’s post-test).
See also Figures S4 and S6.
We considered the possibility that the oligomerization-blocking mutations disrupted a previously unknown membrane-binding domain at the N-terminus of PAR-3. However, a fragment of PAR-3 comprising only the unmodified N-terminus was unable to localize to the cortex in the absence of wild-type PAR-3 (Figure S4D) (Li et al., 2010), suggesting that this domain does not contain a membrane binding site. These data are consistent with the fact that the known membrane-binding determinants in PAR-3 reside in more C-terminal domains that were not perturbed by our mutations (Krahn et al., 2010; Wu et al., 2007). We also considered it possible that oligomerization-blocking mutants non-specifically disrupted folding or expression of PAR-3; however, similar mutations of surface residues were shown not to affect the overall structure of the mammalian PAR-3 N-terminal domain (Feng et al., 2007). Three non-overlapping sets of point mutations affected PAR-3 localization similarly (Figure 6A and see Figure 7E, below) without changing the amount of PAR-3 protein in the cell (Figure S4C), arguing against the possibility that mislocalization of PAR-3 results from an unintended consequence of one particular set of mutations. Moreover, embryos carrying monomeric PAR-3 mutants do not exhibit par-3 loss-of17 function phenotypes (Figures 5 and S5), as we would have predicted had the oligomerization-blocking mutations simply compromised PAR-3 function.
Figure 7. PAR-3 oligomerization is negatively regulated by PLK-1.

A) Kymographs of cortical mNG::PAR-3 in wild-type and plk-1(RNAi) embryos. Anterior is to the left. Horizontal scale bar represents 10 μm and vertical scale bar represents 1 min.
B) Yeast two hybrid assays examining the interaction between PAR-3N (amino acids 1–394) and the PBD of PLK-1. Colonies transformed with the indicated plasmids were grown on non-selective or selective medium. Growth on selective medium indicates an interaction.
C) Autoradiograph (top) and comassie stained gel (bottom) showing phosphorylation of PAR-3N by PLK-1. The red asterisks at around 72 kDa indicate PLK-1 autophosphorylation in the autioradiograph and PLK-1 loading in the Comassie stained gel.
D) Distribution of oligomer sizes for PAR-3 WT and T32E, T89E during establishment phase. The WT data from Figure 3B are presented again here to facilitate comparison. n = 4,741 molecules counted from 9 embryos for WT and n = 9,658 molecules counted from 4 embryos for T32E, T89E.
E) Localization of mNG::PAR-3(T32E, T89E) at the indicated embryonic stages.
F) Quantification of cleavage furrow position in wild-type and the par-3(T32E, T89E) mutant. The wild-type data from Figure 5E are presented again here to facilitate comparison.
G) Kymographs of cortical mNG::PAR-3 during maintenance phase in a wild-type embryo and an embryo partially depleted of PLK-1 using feeding RNAi. Anterior is to the left. Horizontal scale bar represents 10 μm and vertical scale bar represents 1 min. The timing of cellular events that define the beginning and end of maintenance phase are labeled; PNM, pronuclear meeting. Note that maintenance phase is slightly longer after treatment with plk-1 RNAi, most likely because depletion of PLK-1 results in a cell cycle delay.
H) Model for regulation of polarity establishment by PAR-3 oligomerization. PAR-3 oligomers recruit PAR-6 and aPKC during polarity establishment, forming functional units that couple to cortical flow and are transported to the anterior to establish polarity. By negatively regulating PAR-3 oligomerization, PLK-1 links PAR-3 oligomerization to the cell cycle and restricts PAR complex transport to the correct developmental time.
See also Figures S4, S5 and S7.
Having ruled out trivial explanations for the failure of monomeric PAR-3 to localize to the cortex in the zygote, we suspect that PAR-3 oligomerization promotes membrane binding due to an avidity effect. Known phospholipid-binding motifs in the PDZ2 and C-terminal domains (Krahn et al., 2010; Wu et al., 2007) evidently cannot mediate stable binding of monomeric PAR-3 to the plasma membrane, but stable membrane binding can be achieved by clustering multiple binding sites into an oligomer. Further supporting the idea that oligomerization of PAR-3 promotes stable membrane association, the levels of cortical PAR-3 were highest during establishment phase, when oligomers formed, and were lower during pre-polarization and maintenance phases, when oligomerization was downregulated (Figures 6A and B).
During polarity establishment, anterior PAR proteins are thought to be transported to the anterior by cortical flows powered by actomyosin contractility (Goehring et al., 2011; Munro et al., 2004). Monomeric PAR-3 did not exhibit a polarized distribution along the AP axis of the zygote (Figure 6A), indicating that PAR-3 must localize to the membrane in order to be transported to the anterior. Interestingly, monomeric PAR-3 mutants also failed to segregate PAR-6 to the anterior, even though PAR-6 was still present on the cortex (Figures 5C and S5A), and cortical flows still occurred (Figure 5D). We therefore hypothesized that PAR-3 oligomerization might be required to couple PAR complex movement to cortical flow. To investigate this idea, we imaged cortical PAR-3 at a high frame rate and tracked individual PAR-3 particles. We then binned particles based on their intensity (using intensity as a proxy for oligomer size) and compared the motion of bright vs. dim particles. Brighter particles generated much longer tracks (Figures 6C and G), consistent with the idea that larger PAR-3 oligomers bind stably to the plasma membrane, while smaller oligomers bind more transiently.
Bright PAR-3 clusters clearly exhibited directed motion towards the anterior of the embryo, whereas dim particles did not stay associated with the membrane long enough for directed motion to be visible (Figure 6C). To quantitatively analyze the motion of PAR-3 clusters, we calculated the velocity autocorrelation function Vcorr, which compares the velocity of each particle at one time (t) to its velocity after a time shift (t + Δt). For Brownian diffusion, Vcorr = 0 at all time shifts (except Δt = 0), because the velocity of a particle at any given time is unrelated to its velocity at any other time. A value of Vcorr greater than 0 indicates persistent, directed motion – that is, a particle has a tendency to continue moving in the same direction over time (Konopka and Weisshaar, 2004; Qian et al., 1991). We observed that all populations of cortical PAR-3 particles had Vcorr > 0 (Figure 6D), indicating that even the smallest PAR-3 clusters underwent biased motion towards the anterior during the short time they remained bound to the membrane.
The motion of cortical PAR-3 particles is expected to be due to a combination of advection (i.e., transport by cortical flow) and diffusion. We sought to quantify the relative contributions of advection and diffusion to PAR-3 motion, in order to understand how PAR-3 oligomerization contributes to PAR complex transport. To quantify cortical flow, we imaged cortical NMY-2::mKate2 (non-muscle myosin) and mNG::PAR-3 simultaneously during establishment phase, and measured cortical flow by applying particle image velocimetry (PIV) to the NMY-2::mKate2 images. PIV yielded a vector map of local cortical flow for each time point. This cortical flow map corresponds to the expected motion of PAR-3 particles in the absence of diffusion, since without diffusion PAR-3 particles would move perfectly in tandem with the cortex. Therefore, subtracting the measured cortical flow from the observed motion of PAR-3 particles should yield the PAR-3 motion that is due to diffusion alone. Indeed, when we subtracted cortical flow from the trajectories of PAR-3 particles, we observed that the residual motion of these particles appeared diffusive (Figure 6E). The velocity autocorrelation function for these trajectories was close to 0 for all values of Δt ≠ 0 (Figure 6F), indicating that subtracting cortical flow removed the directed motion from the PAR-3 trajectories and resulted in purely diffusive motion, as expected. Subtraction of cortical flow can be viewed as converting PAR-3 trajectories from a cellular frame of reference to a cortical frame of reference; that is, PAR-3 clusters exhibit directed motion relative to the cell, due to cortical flow (Figures 6C and D), but diffusive motion relative to the (moving) cell cortex (Figures 6E and F).
Having thus isolated the contributions of advection and diffusion to the motion of each PAR-3 particle, we were able to compare these contributions quantitatively. We calculated the dimensionless Péclet number, defined as the ratio of the rate of advection to the rate of diffusion, for PAR-3 particles of different sizes. A larger Péclet number indicates more efficient advective transport. We found a statistically significant trend towards larger values of the Péclet number for brighter PAR-3 particles (Figure 6H): the brightest clusters had a median Péclet number of 1.3, compared to 1.0 for the dimmest particles. Thus, larger PAR-3 clusters not only remain associated with the membrane longer (Figure 6G); they are also more efficiently transported by cortical flows while bound, because diffusion contributes less to their overall motion on the cell membrane (Figure 6H).
We conclude that PAR-3 oligomerization promotes transport of PAR-3 to the anterior by cortical flows, both because oligomerization increases the residence time of PAR-3 at the cell membrane and because oligomerization increases the efficiency of coupling between PAR-3 clusters and the moving actomyosin cortex. Considering that PAR-3 oligomerization also promotes its association with PAR-6 (Figure 4B), we propose that PAR-3 oligomerization is the key biochemical event that couples movement of PAR-3/PAR-6/aPKC to cortical flows during polarity establishment. This suggestion is consistent with the finding that PAR-6, although still cortically localized, is no longer transported to the anterior when PAR-3 oligomerization is prevented.
PAR-3 oligomerization is negatively regulated by the cell cycle kinase PLK-1
We next sought to identify cellular factors that restrict PAR-3 oligomerization to the establishment phase. PAR-1 and 14-3-3 were reported to control PAR-3 oligomerization in Drosophila (Benton and St Johnston, 2003b; McKinley and Harris, 2012) and mammalian cells (Hurd et al., 2003). However, the key PAR-1 phosphorylation site identified in those studies is not conserved in C. elegans PAR-3, and depletion of either PAR-1 or PAR-5/14-3-3 by RNAi had no effect on the timing of PAR-3 cluster formation or dissolution (Figure S7). We therefore conducted a small-scale RNAi candidate screen to look for other factors that affected the timing of PAR-3 clustering, targeting a total of 14 genes (listed in Methods) by dsRNA injection. Strikingly, depletion of Polo-Like Kinase PLK-1, a cell cycle regulator, led to PAR-3 clusters that formed prior to the onset of polarity establishment and persisted after polarity establishment was complete (Figure 7A). Loss of PLK-1 was previously shown to result in polarity defects in C. elegans embryos (Noatynska et al., 2010), but the molecular mechanism by which it contributes to cell polarization has not been investigated.
Consistent with a role for PLK-1 in regulating PAR-3, the PAR-3 N-terminus interacted with the PLK-1 Polo Box Domain (PBD) in a yeast two-hybrid assay (Figure 7B). Polo-like kinases recognize their substrates via an interaction between the PBD and a phosphorylated S–pS/pT–P motif on the substrate (Elia et al., 2003). The PAR-3 N-terminus contains two STP motifs that could serve as PLK-1 docking sites (Figure S7C). The two-hybrid interaction was abolished by substitutions that disrupted either of the two STP motifs in PAR-3N or that eliminated phosphopeptide binding of the PLK-1 PBD (Elia et al., 2003; Nishi et al., 2008; Noatynska et al., 2010) (Figure 7B), suggesting that the interaction occurs via the canonical substrate mechanism of polo-like kinases. Purified C. elegans PLK-1 was able to phosphorylate an N-terminal fragment of PAR-3 in vitro (Figure 7C) that contains two potential PLK-1 consensus sites, T32 and T89 (Figure S7C). Mass spectrometry analysis of the in vitro-phosphorylated PAR-3N revealed phosphorylation of T89. PLK-1 might also phosphorylate T32, as the peptide containing T32 was not identified in the mass spectrometry analysis in either the phosphorylated or unphosphorylated form. We conclude that PLK-1 can interact with the N-terminus of PAR-3 and can phosphorylate PAR-3N on at least one site.
To test the effects of PLK-1 phosphorylation of PAR-3 in vivo, we generated a C. elegans strain carrying phosphomimetic T32E and T89E mutations, and assessed the effect on PAR-3 oligomerization during establishment phase using sc-SiMPull. Strikingly, phosphomimetic mutations at the PLK-1 sites abolished PAR-3 oligomerization to the same extent as the RRKEEE and TTDE mutations (Figures 7D and S4), and the PAR-3(T32E, T89E) mutant protein was similarly localized in the cytoplasm at the 1-cell stage (Figure 7E). The phosphomimetic mutations also caused embryonic lethality and adult sterility, although to a lesser extent than par-3(RRKEEE) and par-3(TTDE) (Figure S5B). Phosphomimetic PAR-3 mutations also perturbed cleavage furrow positioning (Figure 7F).
These results indicate that phosphorylation of PAR-3 at two consensus PLK-1 sites is sufficient to prevent PAR-3 oligomerization, and suggest that PLK-1 regulates PAR-3 oligomerization by phosphorylating at least T89 in vivo. PLK-1 is active during both meiosis and mitosis in mammalian cells (Glover et al., 1998). This corresponds to the times when PAR-3 oligomers were absent in the zygote: polarity establishment begins and PAR-3 oligomers appear upon completion of maternal meiosis, and oligomers dissolve (and maintenance phase begins) upon entry into mitosis. Thus, PLK-1 might serve as a timer to restrict PAR-3 oligomerization, and consequently transport of the PAR-3/PAR-6/aPKC complex, to the interphase between meiosis and mitosis. If this idea were correct, then ectopic stabilization of PAR-3 oligomers should lead to aberrant movement of PAR-3 oligomers outside polarity establishment. Specifically, we predicted that ectopic PAR-3 oligomers would be transported towards the cleavage furrow by cortical flows that occur prior to cytokinesis (Hird and White, 1993). We attempted to directly test this prediction by generating a form of PAR-3 that could not be phosphorylated by PLK-1; however, multiple independent par-3(T32A, T89A) alleles caused highly penetrant sterility even when present as heterozygotes, which prevented us from examining embryos expressing PAR-3(T32A, T89A). As an alternative approach, we used timed RNAi feeding to partially deplete PLK-1, with the goal of preserving PAR-3 oligomers during maintenance phase but still allowing cells to progress normally through the cell cycle (in contrast to the strong depletion of PLK-1 shown in Figure 7A, which caused cell cycle arrest). We found that the majority of embryos exposed to PLK-1 RNAi for 9–14 hours retained PAR-3 clusters at the cortex during maintenance phase, yet still divided normally. In 10/10 such embryos, PAR-3 flowed back towards the cleavage furrow during maintenance phase, as predicted (Figure 7G). This behavior was never observed in wild-type (n=11 embryos). Although we cannot exclude the possibility that partial depletion of PLK-1 might have indirect effects on the distribution of PAR-3 during maintenance phase, these results are consistent with the idea that down-regulation of PAR-3 oligomerization by PLK-1 is necessary to prevent mis-segregation of PAR-3. Taken together, our results indicate that control of PAR-3 oligomerization by PLK-1 controls the timing of PAR complex segregation by regulating coupling of PAR complex movement to cortical flows.
Discussion
A single-cell biochemistry approach for the study of cell signaling
Single cell analysis is becoming an increasingly important approach in cell biology. By analyzing single cells, it becomes possible to understand cellular heterogeneity, to make measurements with improved spatial and temporal resolution, and to study processes for which it is impossible or impractical to collect sufficient material for bulk assays. Single-cell sequencing approaches have been widely used (Wang and Navin, 2015), including in C. elegans (Hashimshony et al., 2012; Osborne Nishimura et al., 2015; Tintori et al., 2016); and single-cell enzyme activity measurements have been pioneered (Guillaume-Gentil et al., 2016; Kovarik and Allbritton, 2011). Here, we presented a single-cell approach for measuring protein-protein interactions at the single molecule level in individual, staged C. elegans embryos. Our sc-SiMPull approach has several important features. First, it is conceptually simple and technically straightforward to carry out once established. Second, it is rapid: since there are no intermediate steps between lysis and immunoprecipitation, data collection can begin within 2–3 minutes of lysis, and is generally complete in 10–20 minutes. This helps to ensure that endogenous cellular protein complexes are preserved and makes it possible to perform multiple replicate experiments in a reasonable amount of time. Third, because we generally perform pull-downs using antibodies that recognize protein tags, the assay can be adapted to any protein of interest without re-optimizing conditions. The use of streamlined genome engineering approaches to tag genes (Dickinson et al., 2015; Leonetti et al., 2016; Schwartz and Jorgensen, 2016) facilitates rapid testing of hypotheses using standardized assay conditions. Although we have focused here on cell polarity, our approach should be readily applicable to any cell biological problem that can be modeled in C. elegans embryos, and will be extended to other model systems in future studies.
Limitations of the approach
As with any technology, sc-SiMPull has limitations that warrant discussion. The most important limitation is that, because it relies on binding affinity, sc-SiMPull might not be able to detect weak or transient protein-protein interactions. It is possible that crosslinking reagents could be used to stabilize weak or transient complexes, but we have not yet extensively tested such an approach. Some protein13 protein interactions that are sensitive to buffer conditions might also escape detection; buffer composition might need to be optimized for some protein pairs, especially those involving membrane proteins. These limitations apply to biochemical approaches in general and are not unique to sc-SiMPull. Other limitations of sc-SiMPull are more specific to techniques that rely on single-molecule fluorescence detection. In this study, we have used genetically encoded fluorescent tags, which are limited in terms of their brightness, maturation efficiency, and available colors. This limitation could be circumvented by using antibodies for detection (Jain et al., 2011; Padeganeh et al., 2013) if appropriate antibodies are available. Determination of stoichiometry by photobleaching step counting also involves challenges, especially for larger complexes, that are discussed in detail in the Methods. Finally, it is worth noting that our existing microfluidic lysis chambers are designed to accommodate C. elegans embryos; application to other model systems would require adjusting the dimensions of the devices in order accommodate other cell types.
Insights into the biochemical basis of PAR polarity
We have uncovered a crucial role for regulated PAR-3 oligomerization, and its control by PLK-1, in the establishment of cell polarity. PAR protein segregation is coupled to cell cycle progression via phosphorylation of PAR-3 by PLK-1, which negatively regulates PAR-3 oligomerization (Figure 7H). PAR-3 oligomerization, in turn, contributes to cell polarization by increasing the affinity of PAR-3 for the plasma membrane and allowing the PAR-3/PAR-6/aPKC complex to be transported to the anterior by cortical actomyosin flows.
Our results emphasize the roles of different pools of PAR proteins for cell polarization. Prior studies have suggested two pools of cortical PAR-6/aPKC: a pool that is associated with PAR-3 and a pool that is independent of PAR-3 (Aceto et al., 2006; Beers and Kemphues, 2006). Our results are consistent with this view, and further reveal that the PAR-3–associated pool is the major substrate for cortical flows during polarity establishment. The PAR-3–independent pool, though present on the cortex during the time when cortical flows occur, cannot be segregated to the anterior (Figures 5 and S5). This PAR-3–independent pool predominates during polarity maintenance phase, and it is notably not mis-segregated by cortical flows that occur during cytokinesis. We therefore propose that tuning the abundance of different cortical pools of PAR-6/aPKC allows cells to coordinate the cell polarity program with other cellular functions in a way that is consistent with normal cell physiology.
Interestingly, although the par-3(RRKEEE) mutation disrupts an anterior PAR protein, the resulting phenotype resembles a par-2 (posterior PAR protein) loss-of-function phenotype (Figures 5 and S5). par-2 mutants have a square-shaped arrangement of cells at the 4-cell stage (Cheng et al., 1995; Kemphues et al., 1988), form an abnormally shallow MEX-5 gradient (Griffin et al., 2011) and exhibit defective P granule localization (Boyd et al., 1996; Labbé et al., 2006) and sterility (Labbé et al., 2006). In contrast, in par-3 loss-of-function mutants, both cells divide along the AP axis at the 2-cell stage, resulting in a 4-cell embryo with all four cells in a line (Cheng et al., 1995; Etemad-Moghadam et al., 1995; Kemphues et al., 1988). Thus, PAR-3 variants that cannot oligomerize behave as gain-of19 function mutations that result in overexpression of the anterior cell fate and repression of the posterior cell fate. This interpretation is consistent with the observed mislocalization of PAR-6 throughout the cell cortex and failure to establish a normal posterior PAR domain (Figure 5C).
Considering the clear importance of PAR-3 oligomerization for polarity establishment, it may seem surprising that large oligomers appear to contain only ~10% of total cellular PAR-3 molecules during establishment phase (Figure 3B). This number represents only a lower bound due to the limitations of our assay, and the actual fraction may be two- to three-fold higher (see the section headed “Impact of incomplete fluorophore maturation and simultaneous bleaching events on stoichiometry measurements” in the Methods). Nevertheless, it is clear that establishment-phase cells contain a significant amount of monomeric PAR-3. The presence of a monomeric pool is also a feature of other biological polymers, including actin and tubulin. In the case of actin, the monomeric pool is in dynamic equilibrium with the polymerized pool, and at steady state the concentration of free monomer is equal to the critical concentration above which polymers form (Frieden, 1985). We speculate that in the case of PAR-3, the total cellular concentration is only slightly higher than the critical concentration, so that most of the protein remains monomeric even under conditions that favor oligomerization. Such a situation could allow for rapid, switch-like regulation of PAR-3 oligomerization: by phosphorylating only a relatively small fraction of the total cellular pool of PAR-3 molecules, PLK-1 could reduce the concentration of oligomerization-competent molecules below the critical concentration, which would effectively abolish oligomerization.
Conclusions
In this study, we have developed a time-resolved single-cell biochemistry approach for interrogation of cellular signaling processes. By detecting protein complexes at the single-molecule level, we were able to measure protein interactions in time-resolved single-cell lysates and to resolve distinct complexes in the same sample. Our approach is technically straightforward, rapid, quantitative and readily adaptable to new protein targets. By combining single-cell biochemistry with genome editing and quantitative live imaging, we have gained insight into the dynamic biochemical processes that contribute to cell polarization. We showed that PAR complex assembly is dynamic and coupled to PAR-3 oligomerization. By regulating PAR-3 oligomerization, PLK-1 controls PAR complex coupling to cortical flows, thereby restricting PAR protein transport to the period between meiosis and mitosis. Future studies will make use of this approach to gain additional insights into the regulation of cell polarity in vivo.
STAR Methods
Key resources table
The key resources table is provided as a separate file.
KEY RESOURCES TABLE.
| REAGENT or RESOURCE | SOURCE | IDENTIFIER |
|---|---|---|
| Antibodies | ||
| Anti-mNeonGreen nAb | Allele Biotechnology | Cat# ABP-NAB-MNGAB; RRID: AB_2629489 |
| Rabbit anti-HaloTag pAb | Promega | Cat# G9281; RRID:AB_713650 |
| Bacterial and Virus Strains | ||
| N/A | ||
| Biological Samples | ||
| N/A | ||
| Chemicals, Peptides, and Recombinant Proteins | ||
| EZ-Link NHS-PEG4-biotin | ThermoFisher | Cat# 21330 |
| mPEG-Silane, MW 5,000 | Laysan Bio, Arab, AL | Cat# MPEG-SIL-5000 |
| Biotin-PEG-Silane, MW 5,000 | Laysan Bio, Arab, AL | Cat# Biotin-PEG-SIL-5K |
| 2-[methoxy(polyethylenxy)9–12-propyl] trimethoxysilane | Gelest, Morrisville, PA | Cat# SIM6492.72 |
| Neutravidin | ThermoFisher | Cat# 31000 |
| JF646 HaloTag ligand | Laboratory of Luke D. Lavis | |
| Critical Commercial Assays | ||
| N/A | ||
| Deposited Data | ||
| N/A | ||
| Experimental Models: Cell Lines | ||
| N/A | ||
| Experimental Models: Organisms/Strains | ||
| C. elegans wild-type strain | Caenorhabditis Genetics Center | N2 |
|
C. elegans unc-119 injection
strain Genotype: unc-119(ed3) III |
Caenorhabditis Genetics Center | HT1593 |
|
C. elegans transgenic strain
expressing mNG::HaloTag Genotype: cpIs90[Pmex-5::mNG::HaloTag::tbb-2 3′UTR + LoxP] II |
This study | LP539 |
|
C. elegans transgenic strain
expressing mNG::mKate2 Genotype: cpIs71[Pmex-5::mNG::mKate2::tbb-2 3′UTR + SEC] II |
This Study | LP420 |
|
C. elegans transgenic strain
expressing mNG::mKate2 Genotype: cpIs72[Pmex-5::mNG::mKate2::tbb-2 3′UTR + SEC] II |
This Study | LP421 |
|
C. elegans transgenic strain
expressing mSc::HaloTag Genotype: cpIs132[Pmex-5::mScarlet-I::HaloTag::tbb-2 3′UTR + LoxP] II |
This Study | LP734 |
|
C. elegans transgenic strain
expressing mNG::AraD Genotype: cpIs36[Pmex-5::mNG::3xFlag::AraD::tbb-2 3′UTR + unc-119(+)] II; unc-119(ed3) III |
This Study | LP230 |
|
C. elegans strain with
endogenously tagged mNG::aPKC Genotype: pkc-3(cp41[mNG:3xFlag::pkc-3]) II |
This Study | LP212 |
|
C. elegans strain with
endogenously tagged PAR-6::HaloTag Genotype: par-6(cp346[PAR-6::HaloTag]) I |
This Study | LP654 |
|
C. elegans strain with
endogenously tagged mNG::aPKC and PAR-6::HaloTag Genotype: par-6(cp346[PAR-6::HaloTag]) I; pkc-3(cp41[mNeonGreen:3xFlag::pkc-3]) II |
This Study | LP747 |
|
C. elegans strain with
endogenously tagged PAR-6::mNG Genotype: par-6(cp45[par-6::mNG::3xFlag + LoxP unc-119(+) LoxP]) I; unc-119(ed3) III |
This Study | LP216 |
|
C. elegans strain with
endogenously tagged mNG::PAR-3 Genotype: par-3(cp54[mNG::3xFlag::par-3]) III |
This Study | LP242 |
|
C. elegans strain with
endogenously tagged PAR-6::mKate2 Genotype: par-6(cp60[par-6::mKate2::3xMyc + LoxP unc-119(+) LoxP]) I; unc-119(ed3) III |
This Study | LP244 |
|
C. elegans strain with
endogenously tagged mNG::PAR-3 and PAR-6::mKate2 Genotype: par-6(cp60[par-6::mKate2::3xMyc + LoxP unc-119(+) LoxP]) I; par-3(cp54[mNG::3xFlag::par-3]) III |
This Study | LP282 |
|
C. elegans strain with
endogenously tagged mNG::PAR-3 and PAR-6::HaloTag Genotype: par-6(cp346[PAR-6::HaloTag]) I; par-3(cp54[mNeonGreen::3xFlag::par-3]) III |
This Study | LP749 |
|
C. elegans strain with RRKEEE
mutations and an N-terminal mNG tag in endogenous
par-3 Genotype: par-3(cp344[mNG^3xFlag::PAR-3 R69E R100E K103E]) III |
This Study | LP651 |
|
C. elegans strain with TTDE
mutations and an N-terminal mNG tag in endogenous
par-3 Genotype: par-3(cp327[mNG^3xFlag::PAR-3 T67D T71E]) III |
This Study | LP625 |
|
C. elegans strain with
endogenously tagged mNG::PAR-2 Genotype: par-2(cp329[mNG^PAR-2]) III |
This Study | LP637 |
|
C. elegans strain with
endogenously tagged mNG::PAR-2 and PAR-6::mKate2 Genotype: par-6(cp60[par-6::mKate2::3xMyc + LoxP unc-119(+) LoxP]) I; par-2(cp329[mNG^PAR-2]) III |
This Study | LP675 |
|
C. elegans strain with RRKEEE
mutations and an N-terminal HaloTag in endogenous
par-3 Genotype: par-3(cp354[HaloTag^PAR-3 R69E R100E K103E]) III |
This Study | LP676 |
|
C. elegans strain with RRKEEE
mutations and an N-terminal HaloTag in endogenous
par-3, plus endogenously-tagged mNG::PAR-2 and
PAR-6::mKate2 Genotype: par-6(cp60[par-6::mKate2::3xMyc + LoxP unc-119(+) LoxP]) I; par-2(cp329[mNG^PAR-2]) par-3(cp355[HaloTag^PAR-3 R69E R100E K103E]) III |
This Study | LP677 |
|
C. elegans strain with
endogenously-tagged mNG::MEX-5 Genotype: mex-5(cp119[mNG^3xFlag::mex-5]) IV |
Dickinson et al. 2015 | LP367 |
|
C. elegans strain with RRKEEE
mutations and an N-terminal HaloTag in endogenous
par-3, plus endogenously-tagged
mNG::MEX-5 Genotype: par-3(cp354[HaloTag^PAR-3 R69E R100E K103E]) III; mex-5(cp119[mNG^3xFlag::mex-5]) IV |
This Study | LP679 |
|
C. elegans transgenic strain
expressing GFP::PGL-1 Genotype: bnIs1[pie-1::GFP::pgl-1 + unc-119(+)] I |
Cheeks et al. 2004 | SS747 |
|
C. elegans strain with RRKEEE
mutations and an N-terminal HaloTag in endogenous
par-3, also expressing GFP::PGL-1 from a
transgene Genotype: bnIs1[pie-1::GFP::pgl-1 + unc-119(+)] I; par-3(cp354[HaloTag^PAR-3 R69E R100E K103E]) III |
This Study | LP680 |
|
C. elegans strain with
endogenously tagged NMY-2::mKate2 Genotype: nmy-2(cp52[nmy-2::mkate2 + LoxP unc-119(+) LoxP]) I; unc-119(ed3) III |
This Study | LP229 |
|
C. elegans strain with
endogenously tagged mNG::PAR-3 and NMY-2::mKate2 Genotype: nmy-2(cp52[nmy-2::mkate2 + LoxP unc-119(+) LoxP]) I; par-3(cp54[mNeonGreen::3xFlag::par-3]) III |
This Study | LP636 |
|
C. elegans strain with
phosphomimetic mutations in two putative PLK-1 phosphorylation sites,
plus an N-terminal mNG tag, in endogenous
par-3 Genotype: par-3(cp357[mNG^3xFlag::PAR-3 T32E T89E]) III |
This Study | LP681 |
|
C. elegans strain with
phosphomimetic mutations in two putative PLK-1 phosphorylation sites,
plus an N-terminal mNG tag, in endogenous
par-3 Genotype: par-3(cp358[mNG^3xFlag::PAR-3 T32E T89E]) III |
This Study | LP682 |
| Oligonucleotides | ||
| N/A | ||
| Recombinant DNA | ||
| N/A | ||
| Software and Algorithms | ||
| SiMPull analysis software for MATLAB | This paper | https://github.com/dannyhmg/SiMPull-Analysis-Software |
| Probabilistic Segmentation | Laboratory of Paul Maddox (Padeganeh et al. 2013) | |
| Bayesian step detection | Laboratory of Vijay Pande (Ensign and Pande 2010) | |
| Ezyfit toolbox for MATLAB | MATLAB File Exchange | Version 2.44; http://www.mathworks.com/matlabcentral/fileexchange/10176-ezyfit-2-44 |
| U-track particle tracking software for MATLAB | Jaqaman et al. 2008 | Version 2.1.3; http://lccb.hms.harvard.edu/software.html |
| MSDanalyzer for MATLAB | Tarantino et al. 2014 | https://tinevez.github.io/msdanalyzer/ |
| PIVlab | Thielicke and Stamhuis, 2014 | Version 1.4; http://pivlab.blogspot.com/ |
| Other | ||
| N/A | ||
Contact for reagent and resource sharing
Requests for resources and further information should be directed to Daniel J. Dickinson (daniel.dickinson@austin.utexas.edu).
Experimental model and subject details
C. elegans strains were maintained on standard NGM growth medium and fed E. coli OP50. All strains were kept at 20°C except where noted. Embryos were examined at a stage that precluded determination of sex, although a large majority of embryos were likely hermaphrodites because mother were not mated, and spontaneous appearance of males in the absence of mating is rare (Brenner, 1974).
Modifications to the C. elegans genome were made using protocols previously published by our laboratory (Dickinson et al., 2013; 2015). Briefly, we used Gibson assembly (Gibson et al., 2009) to generate a homologous repair template that contained the desired genome modifications, plus a selectable marker, flanked by 500–1500 bp of unmodified genomic homology. In parallel, we cloned an sgRNA targeting sequence into the pDD162 Cas9–sgRNA expression vector for C. elegans. The Cas9–sgRNA and homologous repair template plasmids were co-injected into the syncytial gonad of young adult worms, along with fluorescent marker plasmids that were used to exclude animals carrying extrachromosomal arrays. Cas9 cleavage of the C. elegans genome led to DNA repair via homologous recombination and incorporation into the genome of the modifications present in the repair template. Recombinant animals were identified from the F2 or F3 offspring of injected animals based on the presence of the selectable marker (included on the repair template) and absence of extrachromosomal array markers. After strain isolation, the selectable marker was removed via Cre-Lox recombination. Correct incorporation of the desired modifications into the genome was verified by PCR and sequencing.
Method Details
Microfluidic device fabrication
Microfluidic devices were fabricated using a standard soft lithography procedure. A photomask corresponding to the desired channel shape was designed using CAD software and produced by Front Range Photomask (Palmer Lake, CO). A 30 μm-thick layer of 1002F-10 photoresist (Pai et al., 2007) was deposited on a plasma-treated glass slide by spin coating for 10s at 500 rpm followed by 30s at 875 rpm. After soft baking at 95°C for 60 min., the films were exposed to 1000 mJ UV light through the photomask. Following a post-exposure bake of 5 min. each at 95°C and 120°C, the molds were developed in propylene glycol monomethyl ether acetate (PGMEA) and rinsed with isopropanol. The molds were hard baked at 95°C for 30 minutes and then at 120°C overnight. Finally, molds were treated with vapor-phase trichlorooctyl silane overnight to reduce stickiness.
PDMS (Sylgard 184 silicone elastomer kit, Dow Corning, Midland, MI) was mixed using a 10:1 ratio of base to curing agent and deposited onto the molds by spin coating at 300 rpm for 30s. The PDMS was cured for 20 minutes at 95°C, then peeled off of the molds, and inlet and outlet holes were punched with a 2 mm biopsy punch. Each PDMS device contained 12 channels, and each channel was used for one single-embryo experiment.
24×60 mm glass coverslips were cleaned in piranha solution (2 parts concentrated sulfuric acid plus 1 part 30% hydrogen peroxide) for at least 1 hour, then rinsed with copious amounts of deionized water, sonicated 4 times in chloroform, and dried under nitrogen flow. Each cleaned coverslip was bonded to a PDMS device by 3 min. treatment with air plasma, then baked at 120°C for 30 minutes to form a permanent bond. Devices were stored with the open holes facing downward, in a closed box, until use.
Preparation of monovalent antibodies for SiMPull
Monovalent Fab fragments recognizing HaloTag were prepared from a commercial anti-HaloTag antibody using the Fab micro fragmentation kit (G biosciences, St. Louis, MO) according to the manufacturer’s instructions. Monovalent nanobodies recognizing mNG were purchased from Allele Biotechnology (San Diego, CA). Antibodies were biotinylated by incubating with a 100-fold molar excess of EZ-Link NHS-PEG4-biotin for 1h at room temperature, followed by quenching with Tris base and exhaustive dialysis against PBS to remove excess biotin. Concentrations were determined by UV absorbance at 280 nm.
Microfluidic device passivation and antibody functionalization
We used two different protocols for PEG passivation of microfluidic devices. In the first protocol, an assembled microfluidic device was first activated by flowing 1 M KOH through the channels for 20–30 min. and then washed twice with 10 mM HCl (all washing steps were performed by drawing 1.5 μL of liquid through each channel under vacuum). A passivation solution was freshly prepared by dissolving 10% (w/v) mPEG-silane and 0.1% (w/v) Biotin-PEG-silane in 10 mM HCl. The solution was applied to the inlet well of each channel and allowed to flow overnight at room temperature in a humidified chamber. The channels were then washed twice with 10 mM HCl and three times with SiMPull buffer (10 mM Tris pH 8.0, 50 mM NaCl, 0.1% Triton X-100 and 0.1 mg/mL BSA). This procedure was used for experiments reported in figures 1B–G, 2B–E, 3A–B, 5B, 7D and S4C.
In the second protocol, an assembled microfluidic device was first activated by flowing 1 M KOH through the channels for 20–30 min., washed 3 times with water, and then dried. Biotin-PEG-silane was dissolved in ethanol at a concentration of 1% (w/v), and 1 μL of this solution was mixed with 50 μL of 2-[methoxy(polyethylenxy)9–12Propyl]-trimethoxysilane, which is a liquid at room temperature. The mixture was applied to the inlet well of each channel and allowed to flow for 30–60 min. at room temperature. The channels were then washed 3 times with water and dried. The dry devices were cured overnight at room temperature, then re-hydrated in SiMPull buffer before functionalizing with antibodies. This procedure was used for experiments reported in figures 1D, 2D and 4A–C.
To attach antibodies to the device, 0.2 mg/mL Neutravidin and 100 nM biotinylated antibody were flowed through the channels for 10 min. each, washing four times with SiMPull buffer after each incubation. The functionalized devices could be stored sealed at 4°C for at least several days without a noticeable change in performance.
HaloTag labeling
Upon receipt, the JF646 HaloTag ligand dissolved in acetonitrile and dispensed into 2 nmol aliquots. The solvent was evaporated using a speedvac and the resulting dry aliquots were stored desiccated in an opaque jar at −20°C. To label whole worms, an aliquot was removed and dissolved in 2 μL DMSO to make a 1 mM stock. An overnight culture of E. coli OP50 was then spun down and resuspended in 1/10 volume of S medium (150 mM NaCl, 1 g/L K2HPO4, 6 g/L KH2PO4, 5 μg/L cholesterol, 10 mM potassium citrate pH 6.0, 3 mM CaCl2, 3 mM MgCl2, 65 μM EDTA, 25 μM FeSO4, 10 μM MnCl2, 10 μM ZnSO4, 1 μM CuSO4). 1/100 volume of the 1 mM HaloTag ligand was then added to the bacterial suspension for a final concentration of 10 μM. 10–30 L4 worms were picked into 30 μL of this solution in one well of a 96-well plate and incubated overnight at 20°C in the dark with gentle shaking. Adult worms were retrieved the next day and immediately dissected in egg buffer (5 mM HEPES pH 7.4, 118 mM NaCl, 40 mM KCl, 3.4 mM MgCl2, 3.4 mM CaCl2) to obtain labeled embryos.
sc-SiMPull from staged embryos
Embryos were dissected from gravid adults in egg buffer and transferred to a 1 μL drop of SiMPull buffer, placed the inlet well of a prepared microfluidic device, using a mouth pipet. A clean 26G needle was used to push the embryo into the microfluidic channel. Once trapped in the center of the chamber, the embryo could be observed for at least 1–2 cell cycles without apparent loss of viability. Embryos stage was determined by visual inspection of morphology (mainly cell shape and nuclear position) on a dissecting microscope. One a trapped embryo reached the desired stage, excess buffer was aspirated from the inlet well and the channel was sealed with crystallography-grade clear tape (Crystal Clear, Hampton Research, Aliso Viejo, CA) to stop flow. The embryo was then immediately crushed by pushing down on the surface of the PDMS with the tip of a pencil. The device was transferred to the TIRF microscope and data collection began as quickly as possible, generally within 2–3 minutes after embryo lysis. More than half of the embryos analyzed yielded usable data (defined as counts of bait protein molecules >2 fold higher than the background fluorescence signal, which was measured separately for each device).
TIRF microscopy
TIRF images were acquired using a Nikon Ti-E microscope equipped with a 100X, 1.49 NA objective; a Hamamatsu ImageEM EM-CCD camera; and an iLas2 circular TIRF illuminator (Roper scientific, Évry, France). TIRF images were magnified by sequential 1.5X and 1.2X relay lenses before being collected on the EM-CCD chip. We acquired TIRF images at regular intervals (most commonly 150 μm) along the length of each microfluidic channel. The TIRF illuminator was operated in 180° arc mode with the arc facing opposite the direction of motion in order to obtain the benefits of circular TIRF while avoiding bleaching by scattered light of regions of the microfluidic channel that had not yet been imaged. At each stage position, we acquired short movies for each channel sequentially, beginning with the reddest imaging wavelengths and moving towards the bluer wavelengths. When a full photobleaching series was required for determination of stoichiometry, we acquired a sufficiently long timelapse (typically 20–30 seconds) to capture the vast majority of photobleaching events. We empirically determined the movie duration, laser power and frame rates for each fluorophore so as to achieve bleaching of 99% of molecules within 300–500 frames. For experiments where we only needed to identify colocalizing molecules and were not concerned with determining stoichiometry, we acquired a smaller number of frames (10–50) at longer exposure (100–300 ms) to maximize signal:noise. Approximately 20 stage positions were imaged per sample, resulting in a total data acquisition time of 10–20 minutes depending on the wavelengths imaged in a particular experiment. mNG was excited using a 50 mW, 488 nm laser and JF646 was excited using a 150 mW, 637 nm laser.
Confocal microscopy
Gravid adults were dissected directly on polylysine-coated coverslips in a drop of egg buffer and were gently flattened by mounting with 22.8 μm beads (Whitehouse scientific, Chester, UK) as spacers. Cortical images were acquired using a Nikon Ti-E microscope equipped with a 100X, 1.49 NA objective; a Yokogawa CSU-X1 spinning disk head; and a Hamamatsu ImageEM EM-CCD camera. Embryo cross-section images were acquired using a Nikon TE-2000 microscope equipped with a 60X, 1.4 NA objective; a Yokogawa CSU-10 spinning disk head; and a Hamamatsu Orca-Flash4.0 V2+ scMOS camera. For embryo imaging, mNG was excited using a 40 mW, 514 nm laser, which produced less autofluorescent background and phototoxicity compared to 488 nm. GFP was excited using a 50 mW, 488 nm laser and mKate2 was excited using a 50 mW, 561 nm laser.
RNA interference
To screen candidate genes for effects on PAR-3 clustering, RNAi was performed by injection. First, we amplified 0.5–2 kb of coding sequence from cDNA using primers that added T7 promoters to both ends of the amplicon. dsRNA was then synthesized using the T7 Ribomax kit (Promega), following the manufacturer’s instructions. 1 μg/μL dsRNA was injected into young adults, and embryos were collected 23–32h later for imaging. The following genes were targeted: air-1, cdc-37, cdc-42, cdk-1, let-502, mel-11, mrck-1, pak-1, par-1, par-2, par-5, pkc-3, plk-1 and pri-1.
To partially deplete plk-1 (Figure 8H), RNAi was performed by timed feeding. Clone III-4E08, targeting plk-1, was retrieved from the Ahringer RNAi library (Kamath and Ahringer, 2003) and verified by Sanger sequencing before use. Log-phase cultures of this bacterial strain were grown in LB, spotted onto NGM plates supplemented with 25 μg/mL Carbenicillin and 1 mM IPTG, and the plates were incubated for 3 days at ambient temperature. Young adults were picked onto these plates, and embryos dissected for imaging at different times thereafter. We found that embryos collected 9–14h after the start of feeding retained PAR-3 clusters at the cortex during maintenance phase, but still divided normally.
Yeast two-hybrid analysis
The yeast two-hybrid analysis was performed using a GAL4-based system (Gateway, Invitrogen) using the MAV203 yeast strain. Constructs containing the PBD of PLK-1 (either wild-type or a non-phosphopeptide-binding mutant with Y417A, V418A substitutions in polo box 1 and H542M, K544A in polo box 2) are fused to the GAL4 DNA binding domain (Bait plasmid) (Noatynska et al., 2010). PAR3N wild-type and mutant constructs are fused to the GAL4 activation domain (prey plasmid). The PAR-3N fragment was first cloned into pDONR201 and subsequently transferred to the pDEST22 vector (GAL4AD) using gateway technology. Mutations were inserted by site directed mutagenesis. Transformed MAV203 clones were selected on double drop out media (lacking Leucine and Tryptophan). The interaction was tested by spotting individual colonies containing the desired plasmids on medium lacking Leucine, Tryptophan and Histidine and containing 150 mM of 3AT (3-amino-1,2,3-triazole, Sigma).
Protein purification
A plasmid containing MBP-PAR-3N was generated using gateway technology from pDONR-PAR-3N. MBP and MBP-PAR-3N were expressed in E. coli BL21 and purified on amylose resin (NEB). Briefly, bacterial strains were grown in LB with ampicillin (100μg/ml) and 0.2% Glucose, protein expression was induced with Isopropyl β-D-1-thiogalactopyranoside (0.2mM) 4hours at 25°C. The pellet washed with 20 ml of 20mM Tris (ph 7.4), 200 mM NaCl, 1mM EDTA, 1mM DTT, pelleted and resuspended in 5 ml of the same buffer. The suspension was frozen in liquid nitrogen and kept at −80 at least 1 hour. After thawing on ice, 1 tablet of proteinase cocktail inhibitor was added (Roche, ref 04693159 001) and the sample was sonicated on ice (6 times for 10 seconds each). After the addition of Triton X-100 (1% final), the suspension was incubated on a wheel at 4°C for 20 minutes before being centrifuged (12000 RCF) at 4°C for 20 minutes. The supernatant was loa ded on the amylose column, washed with 5 bed volumes of 20mM Tris (ph 7.4), 1M NaCl, 1mM EDTA, 1mM DTT and the bound protein was eluted with 20mM Tris (ph 7.4), 200 mM NaCl, 1mM EDTA, 1mM DTT, 20mM Maltose. After aliquoting, the protein was frozen in liquid nitrogen and stored at −80°C.
PLK-1 was expressed in insect cells using Baculovirus, and purified as previously described (Tavernier et al., 2015).
In vitro kinase assay
PLK-1 kinase assays were performed in kinase buffer (50 mM Hepes pH 7.6, 10 mM MgCl2, 1 mM DTT and protease and phosphatase inhibitors (Roche)) with C. elegans PLK-1 in a final volume of 15 μL containing either 300 ng N-terminal MBP-PAR-3 (aa 1–394) or MBP. Reactions were initiated by adding a mix of 0.2 mM ATP and 5 μCi [γ-32P] ATP (Perkin Elmer), during 40 minutes at 30°C. S amples were boiled in Laemmli buffer 3X and visualised by Coomassie blue staining, [γ-32P] ATP incorporation was analysed with a phosphoimager (GE Healthcare).
Mass spectrometry for identification of PAR-3 phosphorylation site
For the analysis of PAR-3 phosphorylated in vitro, the protein mixture containing MBP-PAR-3 (aa 1-767) phosphorylated by PLK-1 was digested overnight at 37°C using sequencing grade trypsin (12.5 μg/ml; Promega Madison, Wi, USA) in 20 μL of 25 mM NH4HCO3. Digests were analyzed by a LTQ Velos Orbitrap (Thermo Fisher Scientific, San Jose, CA) coupled to an Easy nano-LC Proxeon system (Thermo Fisher Scientific, San Jose, CA). An Easy column Proxeon C18 (2 cm, 100 μm i.d., 120 A) was used for peptide preconcentration and an Easy Column Proxeon C18 (10 cm, 75 μm i.d., 120 A) for peptide separation. Chromatographic separation of the peptides was performed with the following parameters: 300nl/min flow, gradient rising from 95% solvent A (0.1% formic acid in water) to 25% B (100 % acetonitrile, 0.1% formic acid) in 20 minutes, then to 45% B in 40 min and finally to 80% B in 10 min. Peptides were analyzed in the Orbitrap in full ion scan mode at a resolution of 30000 (at m/z 400), a mass range of m/z 400–1800. Fragments were obtained with a collision-induced dissociation (CID) activation energy of 35%, an activation Q of 0.250 for 10 ms, and analyzed in the LTQ in a second scan event. The maximum ion accumulation times were set to 100 ms for MS acquisition and 50 ms for MS/MS acquisition. MS/MS data were acquired in a data dependent mode in which the 20 most intense precursor ions were isolated, with a dynamic exclusion of 20 seconds, an exclusion mass width of 10 ppm, an exclusion list size of 500 and a repeat duration of 30 sec.
Quantification and statistical analysis
Analysis of SiMPull data
We developed a custom software package, written in MATLAB, for processing of SiMPull images and extraction of the relevant biological results. The source code for our software is available at https://github.com/dannyhmg/SiMPull-Analysis-Software. In brief, our analysis pipeline consists of the following steps:
-
Identification of spots
First, we generated images for spot detection by averaging a user-specified number of frames from the TIRF movies. Averaging multiple frames reduced noise, allowing more robust spot detection. We generally averaged the first 50 frames of full-length photobleaching movies, or all frames when a smaller number of frames were acquired (see above).
Next, fluorescent spots were identified in the averaged images using a previously described probabilistic segmentation algorithm. This algorithm first subtracts background using a median filter. Next, the noise level is determined based on the gradient of the third derivative of the image, and an intensity threshold is calculated that distinguishes signal from background. Finally, signals that fit the Gaussian profile expected for diffraction-limited spots are identified, and the location of each spot is recorded. The only adjustable parameters are the width of the Gaussian profile used for spot detection, which depends on the optical properties of the imaging system (i.e., the diffraction limit), and a false positive rate that defines how often a signal is erroneously identified. We set the false positive rate to 1×10⁻⁵, meaning we expected to detect a false positive signal in 1 out of every 100,000 images. Although this threshold is quite conservative, we found that probabilistic segmentation was still sensitive enough to identify all of the signals that we could see by eye.
-
Calculation of colocalization
After performing spot detection on each channel, we looked for spots that colocalized between channels by simply asking whether, for each spot in one channel, a colocalizing spot existed in another channel. Two spots were defined as colocalizing if their centers were within 1 diffraction limit of each other.
There is some probability that signals from molecules that are not actually in complex colocalize by chance. We performed simulations to estimate the density of spots below which we could be confident that colocalizing signals were mostly not due to chance. To do this, we randomly distributed different numbers of spots on pairs of 512×512 imaginary images, and then applied our colocalization test. We found that the fraction of signals that colocalized by chance was fairly constant, and was less than 5%, as long as the density of signals did not exceed 1000 spots per image. We therefore calculated colocalization only for images that contained fewer than 1000 spots in both channels, and omitted images with a higher density of spots from the analysis.
-
Photobleaching step counting
For each spot, we extracted the fluorescence intensity as a function of time by applying box-within-a-box local background subtraction. The pixel intensity was measured for a 3×3 pixel region centered on the spot, and was converted to a fluorescence intensity by subtracting the pixel intensity in a 2-pixel-wide strip surrounding the central 3×3 box (that is, in a 5×5 pixel region that excludes the central 3×3 pixels). This process was repeated for each frame to extract the intensity of each spot at each time point.
To identify changes in intensity, we used a Bayesian step detection algorithm (Ensign and Pande, 2010). This algorithm takes into account noise levels to robustly determine the probability, based on the data, that a change in intensity occurred during a specific time interval. We chose a 99% confidence level for identifying an intensity change as a step, although most steps that were visible by eye were identified with a vastly higher confidence than this (Figure S2). To deal with trajectories that contain more than one intensity change, the algorithm is applied iteratively: if a step is found at the first pass, then the trajectory is split into two, and each half is tested to identify additional steps. The process continues until no more steps are found.
The Bayesian algorithm identifies all intensity changes for which there is statistical evidence, without regard to whether those changes are physically realistic. We therefore further filtered the results to exclude two kinds of artifacts that we observed in un-filtered data. First, we noticed that the algorithm had a tendency to identify very small intensity changes that occurred at the end of a trajectory, after all molecules had already photobleached. Therefore, our algorithm ignores steps that occur when the magnitude of the fluorescence intensity is greater than its standard deviation. Second, the algorithm identifies both increases and decreases in fluorescence intensity, but we are only interested in decreases because these represent photobleaching steps. Increases in intensity could occur due to photoblinking or binding of a second molecule to the same site. We found that these events occurred rarely (in less than 5% of traces), and so we simply excluded from the analysis trajectories in which increases in intensity occurred.
After determining the location of photobleaching steps, we calculate the fluorescence intensity at each plateau by averaging the intensity for each window between steps (or between a step and the end of the time series). We calculate the size of each photobleaching step by subtracting the intensity after the step from the intensity before the step.
-
Filtering based on intensity to eliminate background signals in the green channel
Although our coverslip cleaning protocol (see above) eliminated the vast majority of fluorescent background, a small number of background spots (20–50 spots per image) were still observed in the green channel. These signals result from fluorescence contamination of our devices, because they were present even in devices that were not passivated and treated with antibodies, and in functionalized devices into which no embryo was introduced. Fortunately, these signals were consistently dimmer than bona fide mNG molecules, and so we were able to eliminate them from the data by applying an intensity filter (Figure S1). No filtering was necessary for the far-red channel, for which background fluorescence was negligible.
First, we fit the distribution of photobleaching step sizes (that is, the distribution of molecular brightness) to a sum of two log-normal distributions to define a threshold that distinguishes signal from noise (see Figure S1).
Next, photobleaching steps smaller than this intensity threshold are eliminated, and the fluorescence intensity for the region of the trajectory spanning the eliminated step is re-calculated.
Spots that have no photobleaching steps larger than the threshold are eliminated from the data. Based on visual inspection, the vast majority of eliminated spots had only a single, very small photobleaching step and almost certainly are background spots. It is possible that bona fide mNG molecules that fail to bleach during the image series would be eliminated by this filtering step, but we minimized this possibility by choosing imaging conditions so that our movies captured >99% of photobleaching events.
After applying the intensity filter, colocalization is re-calculated as above, this time ignoring spots that were eliminated by the intensity filter.
Impact of incomplete fluorophore maturation and simultaneous bleaching events on stoichiometry measurements
Counting photobleaching steps is a well-established method for determining the stoichiometry of fluorescently-labeled macromolecular complexes (Jain et al., 2011; Padeganeh et al., 2013; Ulbrich and Isacoff, 2007). Although this approach is powerful, it does have two main limitations. First, less than 100% of fluorescent proteins generate observable signal (see Figure 2 of the main text), so the number of photobleaching steps observed is often less than the number of fluorescent protein molecules in the complex. Second, photobleaching is a stochastic process, and sometimes two fluorescent molecules bleach simultaneously (within the time resolution of the experiment), which results in two molecules being erroneously counted as one. Here, we show why, as a result of these factors, step counting is able to accurately measure the sizes of small complexes but systematically underestimates the sizes of large complexes.
Incomplete fluorophore detection
In practice, not all fluorescent protein molecules are capable of generating observable signal in single-molecule assays, due to incomplete fluorophore maturation and/or bleaching of fluorescence before the experiment. This leads to underestimation of the number of molecules in a complex; for example, a population of pure tetramers produces a distribution of numbers of photobleaching steps (Figure 2G).
Given a macromolecular complex containing n subunits, the probability of detecting i photobleaching steps is given by the binomial distribution
| (1) |
where d is the fraction of fluorescent protein molecules that produce detectable signal. Now consider a population of C oligomeric complexes. We represent the distribution of actual complex sizes using the column vector c⃗, whose elements cn are the numbers of oligomers of actual size n. For example, a population with c⃗ = (2,5,10,6) contains 2 monomers, 5 dimers, 10 trimers and 6 tetramers, and C = Σ c⃗ = 23. We describe the effect of incomplete fluorophore detection as a linear transformation that maps the actual distribution of complexes c⃗ onto the observed distribution of photobleaching step counts, which we denote as d⃗. We define the incomplete detection matrix Td such that
| (2) |
Td is a square matrix with i rows and n columns. Each element Td(i, n) is the probability of detecting i steps for a complex that actually contains n subunits, calculated using equation (1), and each column vector in Td is the zero-truncated binomial distribution P(i, n). Figure S8A shows the effects of applying the incomplete labeling transformation to pure populations of oligomers of various sizes.
Simultaneous bleaching of multiple molecules
Because photobleaching of individual fluorescent molecules is a stochastic process, there is some probability that two fluorophores bleach simultaneously and are counted as one. This effect results in underestimation of the number of fluorophores in a complex, and becomes more severe as the number of fluorophores in the complex increases.
Because photobleaching occurs stochastically, bleaching of a population of molecules can be treated as a Poisson process with rate λ = kbleach * n, where kbleach is a rate constant for photobleaching of a single fluorophore and n is the number of active fluorophores in a complex. kbleach depends on the identity of the fluorophore, but also on laser power and frame rate used for data acquisition. We measured kbleach values for mNG ranging from 0.0072 frame−1 to 0.021 frame−1 (mean 0.012 frame−1) in six representative experiments. Note that we express the photobleaching rate constant in units of “per frame” because this is the relevant unit of time for determining whether two bleaching events can be temporally resolved.
Consider a complex containing two active fluorophores. We wish to calculate the probability that both bleaching events will be observed, i.e. that the fluorophores do not bleach simultaneously. The algorithm that we use to detect photobleaching steps requires two steps to be separated by a minimum of 3 data points (i.e., 3 frames) in order to be detected as separate events (Ensign and Pande, 2010). From the distribution of waiting times for a Poisson process, the probability that two events are separated by Δt ≥ 3 frames is
| (3) |
Now consider a complex containing n active fluorophores. The probability that all gaps between bleaching events are longer than 3 frames is
| (4) |
which is equivalent to the probability that all active fluorophores in the complex are detected. The exponent in equation (4) is n –1 because there are n –1 gaps between photobleaching events in a complex with n fluorophores.
Similarly, for a complex containing n active fluorophores, the probability that one and only one pair of photobleaching events occurs simultaneously is
| (5) |
which is equivalent to the probability that n –1 fluorophores are detected and 1 fluorophore is missed. From inspection of equations (4) and (5), it is clear that this situation generalizes to a binomial problem, so that the probability of detecting i photobleaching steps for a complex containing n active fluorophores is given by
| (6) |
As we did for incomplete detection, we can describe the effect of simultaneous photobleaching events as a linear transformation, represented by the transformation matrix Ts such that
| (7) |
Each element Ts(i, n) is the probability of detecting i steps for a complex that actually contains n active fluorophores, calculated using equation (7), and each column vector in Ts is the zero-truncated distribution P(i, n). Figure S8B shows the effect of applying the simultaneous photobleaching transformation to pure populations of oligomers containing different numbers of active fluorophores.
Combined effects of incomplete detection and simultaneous bleaching
Because we have represented the effects of incomplete detection and simultaneous bleaching as linear transformations, it is straightforward to calculate their combined effect: we can define a combined transformation that is the composition of the simultaneous bleaching and incomplete detection transformations. We calculate a combined transformation matrix T such that
| (8) |
where again c⃗ is the actual distribution of complex sizes and d⃗ is the observed distribution of photobleaching step counts. Figure S8C shows the effect of applying the combined transformation to pure populations of oligomers of different sizes. Qualitatively, it is clear that step counting is relatively accurate for small complexes, but systematically underestimates the sizes of large complexes. The effect becomes more severe for larger oligomers: the sizes of 8mers are underestimated by approximately 25–50%, the sizes of 20mers by approximately 40–70%, and the sizes of 30mers by approximately 50–80%.
Difficulty of correcting for the effects of incomplete detection and simultaneous bleaching
Although we would like to infer the actual number of molecules in a complex based on the observed number of photobleaching steps – that is, to correct for the effects of incomplete labeling and simultaneous photobleaching – inspection of Figure S8C makes clear that this will not be straightforward. Especially for larger complexes, the number of steps observed provides only a rough estimate of the actual complex size. For example, complexes containing 20 to 30 subunits can generate 10 photobleaching steps with almost equal probability (Figure S8C). More formally, the transformation that maps the actual distribution of complexes sizes c⃗ onto the observed data d⃗ is not one-to-one, and so the transformation matrix T is not invertible and the equation T c⃗ = d⃗ does not have a unique solution. We therefore follow the lead of previous authors (Das et al., 2007; Jain et al., 2011; Leake et al., 2006; Reyes-Lamothe et al., 2010; Ulbrich and Isacoff, 2007) and report “raw” photobleaching step counts in this paper, avoiding any correction that would imply a false sense of certainty about the actual numbers of PAR-3 monomers in large complexes.
During establishment phase, ~9% of detectable PAR-3 molecules reside in oligomers in which we observe 4 or more subunits (Figure 3B). Qualitatively, it is clear that this measurement underestimates both the total size of these oligomers and the fraction of subunits they contain. Based on the calculations presented in Figure S8C, we conservatively estimate that the actual number of molecules present in these complexes may be 2–3 fold higher than what we can measure. We emphasize, however, that incomplete detection and simultaneous bleaching cannot account for our failure to observe large oligomers in pre-polarization and maintenance-phase embryos. We report an approximately 20-fold increase in the fraction of PAR-3 molecules in large oligomers during establishment phase (Figure 3B), but the actual increase is likely even greater because we can accurately measure the sizes of small oligomers present during pre-polarization and maintenance, while we underestimate the sizes of the large oligomers that appear during polarity establishment.
Measurement of colocalization between PAR-3 and PAR-6
Colocalization between mNG::PAR-3 and PAR-6::mKate2 was measured in images taken at a cortical focal plane. We made maximum intensity projections as above to expand the area of cortex that could be analyzed. Following background subtraction using the rolling ball option in FIJI (rolling ball radius of 50 pixels), we calculated two different metrics of colocalization (Spearmann’s rank correlation coefficient and Manders’ tMR; for review of the interpretation of these metrics see (Dunn et al., 2011)) for a region of interest comprising the portion of the cell cortex for which PAR-6::mKate2 signal was visible, using the FIJI Coloc2 plugin.
Quantification of PAR-6 and PAR-2 distributions
To measure the intensity distribution of PAR-6::mKate2 and mNG::PAR-2 along the AP axis, we first subtracted inhomogenous background from the images using a 60×60 median filter. Then, we measured the intensity along a 7 pixel wide line drawn along one side of the cortex from anterior to posterior. Distances were converted to a percentage of the total length before plotting.
Measurement of cortical flow rates
Cortical flow rates were measured from DIC movies of the cell cortex, in which images were captured every 3 s. A 3 pixel wide strip along the center of the cortex, parallel to the AP axis, was converted to a kymograph using the “montage” command in FIJI. For 3–5 prominent cortical granules per embryo, flow rate was determined by manually measuring the angle of a particle’s path in the kymograph. Angle measurements for each embryo were averaged and converted to a flow rate using the known scale of the image.
Measurement of total PAR-3 and PAR-6 cortical intensities
The total amount of cortical fluorescence was measured from images taken at a cortical focal plane. First, we made maximum intensity projections of 3 Z slices spaced 0.5 μm apart and centered on the cell cortex. These Z projections served mainly to expand the area of the cortex that could be quantified (the region of in the center of the embryo was closest to the coverslip, while neighboring areas were slightly further away). Next, we drew a region of interest around the entire visible area of the cell cortex. We measured the total pixel intensity (integrated density) of this region over the course of the entire movie, spanning pre-polarization phase to mitosis, and subtracted off-embryo background.
PAR-3 particle tracking and motion analysis
PAR-3 particles were tracked using the U-track package (Jaqaman et al., 2008). For particle detection, we used the Gaussian mixture model option with α = 0.1. For particle tracking, we used the Brownian + directed motion model with a maximum gap size of 2 frames and a minimum track length of 3 frames. All other settings were the defaults. The U-track package reports the position and intensity of each tracked particle as a function of time. We sorted tracks into intensity bins based on the average intensity of each particle over the entire duration of its track. The velocity autocorrelation function was calculated using the MSDanalyzer package for MATLAB (Tarantino et al., 2014).
To measure the motion of the actomyosin cortex, we applied particle image velocimetry (PIV) to the NMY-2::mKate2 image channel using the PIVlab MATLAB plugin (Thielicke and Stamhuis, 2014). Images were pre-processed with a high-pass filter, using a filter size of 10. The other pre-processing filters were disabled. Flow detection used the default FFT phase-space algorithm with 3 passes (window sizes 64, 32 and 16 pixels) and linear window deformation. Post-processing was done with two filters: first, velocity limits were drawn manually to exclude outliers, and second, a standard deviation filter removed vectors that were more than three standard deviations from the mean in each image. Vectors that were rejected by these filters were replaced by interpolation. The resulting maps have a flow vector every 8 pixels. To allow pixel-by-pixel comparison of PAR-3 and myosin velocities, we generated the intervening vectors using bicubic interpolation.
To convert PAR-3 tracks from a cell frame of reference (i.e., the raw data) to a cortical frame of reference, we calculated the motion of a PAR-3 particle relative to the cortex at each frame as a vector difference between the displacement of the PAR-3 particle (from particle tracking data) and the cortical motion at the same time and location (from the myosin PIV data). Tracks were drawn starting at a position of (0,0) and adding the calculated relative motion vector at each time step.
We calculated an apparent Péclet number for each PAR-3 particle. For each particle at each time step, we calculated a vector for the motion due to advection (which is equal to the local cortical flow, measured from NMY-2::mKate2 PIV) and a vector for the motion due to diffusion (which we estimate as the total particle displacement minus the advective motion). The apparent Péclet number for that time step is simply the ratio of the lengths of the advection vector and the diffusion vector. We averaged these values over the length of each trajectory to obtain an apparent Péclet number for the particle. The value of the Péclet number depends on the time step chosen, because the distance traveled due to advection is proportional to Δt while the distance traveled due to diffusion is proportional to . To determine how the choice of time step affected our analysis, we repeated the calculations using different values of Δt (Figure S6). Larger values of Δt resulted in larger estimates of the Péclet number, as expected, but did not change the overall trend towards larger Péclet numbers for brighter PAR-3 particles (Figure S6).
Data processing of mass spectrometry analysis
Data were processed with Proteome Discoverer 1.4 software (Thermo Fisher Scientific, San Jose, CA) coupled to an in house Mascot search server (Matrix Science, Boston, MA; version 2.4.1). The mass tolerance of fragment ions was set to 7 ppm for precursor ions and 0.5 Dalton for fragments. The following modifications were used in variable modifications: oxidation (M), phosphorylations (Serine Threonine S, T). Phosphorylation localization was evaluated by Phospho-RS 3.1 algorithm (Taus et al., 2011). The maximum number of missed cleavages was limited to 2 for trypsin digestion. MS-MS data were searched against NCBInr database with the Caenorhabditis elegans taxonomy. False Discovery Rate (FDR) was calculated using the Support Vector Machine based algorithm Percolator with a 5% q22 value in relaxed mode and 1% q-value in stringent mode. A threshold of 1% was chosen for this rate. The following non-phosphorylated and phosphorylated PAR-3 peptides were identified:
Peptide MH33+ : 2668,44917 MKIVVPWKESDQTVGQLADAALLR (Ion score 61)
Peptide MH33+ : 2748,41526 MKIVVPWKESDQpTVGQLADAALLR (Ion score 20, binomial peptide score 78).
Quantification of MEX-5 distribution
mNG::MEX-5 intensity was measured immediately prior to cytokinesis along an 11 pixel wide line drawn from anterior to posterior in the cytoplasm. We drew this line slightly to one side of the center to avoid the spindle region where mNG::MEX-5 intensity appeared lower. The intensity profile from each embryo was fit individually to an exponential decay function using the ezyfit toolbox for MATLAB.
Image processing and display
Images of SiMPull data (Figures 2B, 2E and 3A) are the averaged images that were used for spot detection (see Analysis of SiMPull data > Identifcation of spots, above). To generate kymographs Figures 3E, 3F and 8A), we extracted a 15 pixel wide strip from the center of each cortical plane image and stacked these strips on top of one another using the “montage” command in FIJI. The PAR-6-only images (shown in inverted contrast in Figure 4B) are the images resulting from background subtraction prior to quantification (see Quantification of PAR-6 and PAR-2 distributions, above). When preparing figures for publication, some images were processed with a 3×3 median filter to reduce noise, images were rotated so that the anterior was to the left, and brightness and contrast were adjusted using FIJI. No other image manipulations were performed.
Statistical analysis
Results from sc-SiMPull assays are given in the text and figures as a mean ± 95% confidence interval. The means we report are weighted means based on the number of molecules counted in each experiment. This is equivalent to calculating a single percentage based on all molecules counted, weighting each molecule equally regardless of which replicate embryo it was derived from. 95% confidence intervals were calculated using the formula
where xi is the measured value from one single-embryo experiment, R̄ is the weighted mean, wi is the weight (defined as the number of molecules counted in experiment i divided by the total number of molecules counted in all experiments), n is the number of experiments performed, and the sums are over all experiments.
Where relevant, other statistical tests used are given in the figure legends and were performed using GraphPad Prism software.
Supplementary Material
Highlights.
Protein interactions assayed in single-cell lysates via single-molecule pull-down
This approach provides time-resolved information about protein complex regulation
PAR complex oligomerization occurs during cell polarity establishment in C. elegans
Oligomerization is linked to the cell cycle and controls PAR complex segregation
Acknowledgments
We thank Kerry Bloom, Nate Goehring, Robert Hobson, Paul Maddox, Fumio Motegi, Edwin Munro, David Reiner, Stephen Rogers and members of the Goldstein lab for helpful discussions; Nancy Allbritton, Matthew DiSalvo and Yuli Wang for training in microfabrication and access to their equipment; Luke Lavis for providing JaneliaFluor dyes; Mark Slabodnick for constructing the mScarlet::HaloTag strain; Jessica L. Sullivan-Brown for constructing the NMY-2::mKate2 strain; Jacques Boisvert, Jonas Dorn, Daniel Ensign, Khuloud Jaqaman, Paul Maddox, Frédéric Moisy, Vijay Pande, Eize J. Stamhuis, William Thielicke and Jean-Yves Tinevez for software used in data anlaysis; Anna Noatynska and Alexandra Gomez for preliminary experiments on the phosphorylation of PAR-3 by PLK-1; the Mass Spectrometry Facility of the Jacques Monod Institute (UMR 7592); and Paul Maddox for critical reading of the manuscript. Some strains were provided by the CGC, which is funded by NIH Office of Research Infrastructure Programs (P40 OD010440). This work was supported by NIH T32 CA009156, a Howard Hughes postdoctoral fellowship from the Helen Hay Whitney Foundation and NIH K99 GM115964 (D.J.D.); by SNF grants 31003A_138501 and 31003A_156013 and by the University of Geneva (M.G.); by the French Medical Research Foundation “Equipe FRM”, DEQ20140329538 (L.P.); and NIH R01 GM083071 (B.G.).
Footnotes
Author Contributions
D.J.D. initiated the project, developed the sc-SiMPull assay, and designed the experiments with input from B.G. F.S., L.P. and M.G. performed the yeast two-hybrid and in vitro kinase assays presented in Figure 8 and mass spectrometry to identify phosphorylation sites. D.J.D. performed all remaining experiments and data analysis, including development of analysis software, and wrote the manuscript with input from M.G. and B.G.
Publisher's Disclaimer: This is a PDF file of an unedited manuscript that has been accepted for publication. As a service to our customers we are providing this early version of the manuscript. The manuscript will undergo copyediting, typesetting, and review of the resulting proof before it is published in its final citable form. Please note that during the production process errors may be discovered which could affect the content, and all legal disclaimers that apply to the journal pertain.
References
- Aceto D, Beers M, Kemphues KJ. Interaction of PAR-6 with CDC-42 is required for maintenance but not establishment of PAR asymmetry in C. elegans. Developmental Biology. 2006;299:386–397. doi: 10.1016/j.ydbio.2006.08.002. [DOI] [PMC free article] [PubMed] [Google Scholar]
- Altschuler SJ, Wu LF. Cellular Heterogeneity: Do Differences Make a Difference? Cell. 2010;141:559–563. doi: 10.1016/j.cell.2010.04.033. [DOI] [PMC free article] [PubMed] [Google Scholar]
- Assémat E, Bazellières E, Pallesi-Pocachard E, Le Bivic A, Massey-Harroche D. Polarity complex proteins. Biochim Biophys Acta. 2008;1778:614–630. doi: 10.1016/j.bbamem.2007.08.029. [DOI] [PubMed] [Google Scholar]
- Beers M, Kemphues K. Depletion of the co-chaperone CDC-37 reveals two modes of PAR-6 cortical association in C. elegans embryos. Development. 2006;133:3745–3754. doi: 10.1242/dev.02544. [DOI] [PubMed] [Google Scholar]
- Benton R, St Johnston D. A conserved oligomerization domain in drosophila Bazooka/PAR-3 is important for apical localization and epithelial polarity. Curr Biol. 2003a;13:1330–1334. doi: 10.1016/s0960-9822(03)00508-6. [DOI] [PubMed] [Google Scholar]
- Benton R, St Johnston D. Drosophila PAR-1 and 14-3-3 inhibit Bazooka/PAR-3 to establish complementary cortical domains in polarized cells. Cell. 2003b;115:691–704. doi: 10.1016/s0092-8674(03)00938-3. [DOI] [PubMed] [Google Scholar]
- Bindels DS, Haarbosch L, van Weeren L, Postma M, Wiese KE, Mastop M, Aumonier S, Gotthard G, Royant A, Hink MA, et al. mScarlet: a bright monomeric red fluorescent protein for cellular imaging. Nat Meth. 2017;14:53–56. doi: 10.1038/nmeth.4074. [DOI] [PubMed] [Google Scholar]
- Boyd L, Guo S, Levitan DJ, Stinchcomb DT, Kemphues KJ. PAR-2 is asymmetrically distributed and promotes association of P granules and PAR-1 with the cortex in C. elegans embryos. Development. 1996;122:3075–3084. doi: 10.1242/dev.122.10.3075. [DOI] [PubMed] [Google Scholar]
- Brenner S. The genetics of Caenorhabditis elegans. Genetics. 1974;77:71–94. doi: 10.1093/genetics/77.1.71. [DOI] [PMC free article] [PubMed] [Google Scholar]
- Cheeks RJ, Canman JC, Gabriel WN, Meyer N, Strome S, Goldstein B. C. elegans PAR proteins function by mobilizing and stabilizing asymmetrically localized protein complexes. Curr Biol. 2004;14:851–862. doi: 10.1016/j.cub.2004.05.022. [DOI] [PubMed] [Google Scholar]
- Cheng NN, Kirby CM, Kemphues KJ. Control of cleavage spindle orientation in Caenorhabditis elegans: the role of the genes par-2 and par-3. Genetics. 1995;139:549–559. doi: 10.1093/genetics/139.2.549. [DOI] [PMC free article] [PubMed] [Google Scholar]
- Cuenca AA, Schetter A, Aceto D, Kemphues K, Seydoux G. Polarization of the C. elegans zygote proceeds via distinct establishment and maintenance phases. Development. 2003;130:1255–1265. doi: 10.1242/dev.00284. [DOI] [PMC free article] [PubMed] [Google Scholar]
- Das SK, Darshi M, Cheley S, Wallace MI, Bayley H. Membrane Protein Stoichiometry Determined from the Step-Wise Photobleaching of Dye-Labelled Subunits. ChemBioChem. 2007;8:994–999. doi: 10.1002/cbic.200600474. [DOI] [PubMed] [Google Scholar]
- Dawes AT, Munro EM. PAR-3 Oligomerization May Provide an Actin-Independent Mechanism to Maintain Distinct Par Protein Domains in the Early Caenorhabditis elegans Embryo. Biophys J. 2011;101:1412–1422. doi: 10.1016/j.bpj.2011.07.030. [DOI] [PMC free article] [PubMed] [Google Scholar]
- Dickinson DJ, Pani AM, Heppert JK, Higgins CD, Goldstein B. Streamlined Genome Engineering with a Self-Excising Drug Selection Cassette. Genetics. 2015;200:1035–1049. doi: 10.1534/genetics.115.178335. [DOI] [PMC free article] [PubMed] [Google Scholar]
- Dickinson DJ, Ward JD, Reiner DJ, Goldstein B. Engineering the Caenorhabditis elegans genome using Cas9-triggered homologous recombination. Nat Meth. 2013;10:1028–1034. doi: 10.1038/nmeth.2641. [DOI] [PMC free article] [PubMed] [Google Scholar]
- Dunn KW, Kamocka MM, McDonald JH. A practical guide to evaluating colocalization in biological microscopy. AJP: Cell Physiology. 2011;300:C723–C742. doi: 10.1152/ajpcell.00462.2010. [DOI] [PMC free article] [PubMed] [Google Scholar]
- Elia AEH, Rellos P, Haire LF, Chao JW, Ivins FJ, Hoepker K, Mohammad D, Cantley LC, Smerdon SJ, Yaffe MB. The molecular basis for phosphodependent substrate targeting and regulation of Plks by the Polo-box domain. Cell. 2003;115:83–95. doi: 10.1016/s0092-8674(03)00725-6. [DOI] [PubMed] [Google Scholar]
- Ensign DL, Pande VS. Bayesian detection of intensity changes in single molecule and molecular dynamics trajectories. J Phys Chem B. 2010;114:280–292. doi: 10.1021/jp906786b. [DOI] [PubMed] [Google Scholar]
- Etemad-Moghadam B, Guo S, Kemphues KJ. Asymmetrically distributed PAR-3 protein contributes to cell polarity and spindle alignment in early C. elegans embryos. Cell. 1995;83:743–752. doi: 10.1016/0092-8674(95)90187-6. [DOI] [PubMed] [Google Scholar]
- Feng W, Wu H, Chan LN, Zhang M. The Par-3 NTD adopts a PB1-like structure required for Par-3 oligomerization and membrane localization. Embo J. 2007;26:2786–2796. doi: 10.1038/sj.emboj.7601702. [DOI] [PMC free article] [PubMed] [Google Scholar]
- Fletcher GC, Lucas EP, Brain R, Tournier A, Thompson BJ. Positive feedback and mutual antagonism combine to polarize Crumbs in the Drosophila follicle cell epithelium. Curr Biol. 2012;22:1116–1122. doi: 10.1016/j.cub.2012.04.020. [DOI] [PubMed] [Google Scholar]
- Frieden C. Actin and tubulin polymerization: the use of kinetic methods to determine mechanism. Annual Review of Biophysics and Biophysical …. 1985 doi: 10.1146/annurev.bb.14.060185.001201. [DOI] [PubMed] [Google Scholar]
- Gibson DG, Young L, Chuang RY, Venter JC, Hutchison CA, Smith HO. Enzymatic assembly of DNA molecules up to several hundred kilobases. Nat Meth. 2009;6:343–345. doi: 10.1038/nmeth.1318. [DOI] [PubMed] [Google Scholar]
- Glover DM, Hagan IM, Tavares ÁAM. Polo-like kinases: a team that plays throughout mitosis. Genes Dev. 1998;12:3777–3787. doi: 10.1101/gad.12.24.3777. [DOI] [PubMed] [Google Scholar]
- Goehring NW, Trong PK, Bois JS, Chowdhury D, Nicola EM, Hyman AA, Grill SW. Polarization of PAR Proteins by Advective Triggering of a Pattern-Forming System. Science. 2011;334:1137–1141. doi: 10.1126/science.1208619. [DOI] [PubMed] [Google Scholar]
- Goldstein B, Hird SN. Specification of the anteroposterior axis in Caenorhabditis elegans. Development. 1996;122:1467–1474. doi: 10.1242/dev.122.5.1467. [DOI] [PubMed] [Google Scholar]
- Goldstein B, Macara IG. The PAR proteins: fundamental players in animal cell polarization. Dev Cell. 2007;13:609–622. doi: 10.1016/j.devcel.2007.10.007. [DOI] [PMC free article] [PubMed] [Google Scholar]
- Graybill C, Wee B, Atwood SX, Prehoda KE. Partitioning-defective Protein 6 (Par-6) Activates Atypical Protein Kinase C (aPKC) by Pseudosubstrate Displacement. Journal of Biological Chemistry. 2012;287:21003–21011. doi: 10.1074/jbc.M112.360495. [DOI] [PMC free article] [PubMed] [Google Scholar]
- Griffin EE, Odde DJ, Seydoux G. Regulation of the MEX-5 Gradient by a Spatially Segregated Kinase/Phosphatase Cycle. Cell. 2011;146:955–968. doi: 10.1016/j.cell.2011.08.012. [DOI] [PMC free article] [PubMed] [Google Scholar]
- Grimm JB, English BP, Chen J, Slaughter JP, Zhang Z, Revyakin A, Patel R, Macklin JJ, Normanno D, Singer RH, et al. A general method to improve fluorophores for live-cell and single-molecule microscopy. Nat Methods. 2015;12:244–250. doi: 10.1038/nmeth.3256. [DOI] [PMC free article] [PubMed] [Google Scholar]
- Guillaume-Gentil O, Grindberg RV, Kooger R, Dorwling-Carter L, Martinez V, Ossola D, Pilhofer M, Zambelli T, Vorholt JA. Tunable Single-Cell Extraction for Molecular Analyses. Cell. 2016;166:506–516. doi: 10.1016/j.cell.2016.06.025. [DOI] [PubMed] [Google Scholar]
- Hashimshony T, Wagner F, Sher N, Yanai I. CEL-Seq: Single-Cell RNA-Seq by Multiplexed Linear Amplification. Cell Reports. 2012;2:666–673. doi: 10.1016/j.celrep.2012.08.003. [DOI] [PubMed] [Google Scholar]
- Hird SN, White JG. Cortical and cytoplasmic flow polarity in early embryonic cells of Caenorhabditis elegans. J Cell Biol. 1993;121:1343–1355. doi: 10.1083/jcb.121.6.1343. [DOI] [PMC free article] [PubMed] [Google Scholar]
- Hird SN, Paulsen JE, Strome S. Segregation of germ granules in living Caenorhabditis elegans embryos: cell-type-specific mechanisms for cytoplasmic localisation. Development. 1996;122:1303–1312. doi: 10.1242/dev.122.4.1303. [DOI] [PubMed] [Google Scholar]
- Hung TJ, Kemphues KJ. PAR-6 is a conserved PDZ domain-containing protein that colocalizes with PAR-3 in Caenorhabditis elegans embryos. Development. 1999;126:127–135. doi: 10.1242/dev.126.1.127. [DOI] [PubMed] [Google Scholar]
- Hurd TW, Fan S, Liu CJ, Kweon HK, Hakansson K, Margolis B. Phosphorylation16 dependent binding of 14-3-3 to the polarity protein Par3 regulates cell polarity in mammalian epithelia. Curr Biol. 2003;13:2082–2090. doi: 10.1016/j.cub.2003.11.020. [DOI] [PubMed] [Google Scholar]
- Jain A, Liu R, Ramani B, Arauz E, Ishitsuka Y, Ragunathan K, Park J, Chen J, Xiang YK, Ha T. Probing cellular protein complexes using single-molecule pull-down. Nature. 2011;473:484–488. doi: 10.1038/nature10016. [DOI] [PMC free article] [PubMed] [Google Scholar]
- Jain A, Liu R, Xiang YK, Ha T. Single-molecule pull-down for studying protein interactions. Nat Protoc. 2012;7:445–452. doi: 10.1038/nprot.2011.452. [DOI] [PMC free article] [PubMed] [Google Scholar]
- Jaqaman K, Loerke D, Mettlen M, Kuwata H, Grinstein S, Schmid SL, Danuser G. Robust single-particle tracking in live-cell time-lapse sequences. Nat Meth. 2008;5:695–702. doi: 10.1038/nmeth.1237. [DOI] [PMC free article] [PubMed] [Google Scholar]
- Joberty G, Petersen C, Gao L, Macara IG. The cell-polarity protein Par6 links Par3 and atypical protein kinase C to Cdc42. Nat Cell Biol. 2000;2:531–539. doi: 10.1038/35019573. [DOI] [PubMed] [Google Scholar]
- Kamath RS, Ahringer J. Genome-wide RNAi screening in Caenorhabditis elegans. Methods. 2003;30:313–321. doi: 10.1016/s1046-2023(03)00050-1. [DOI] [PubMed] [Google Scholar]
- Kemphues KJ, Priess JR, Morton DG, Cheng NS. Identification of genes required for cytoplasmic localization in early C. elegans embryos. Cell. 1988;52:311–320. doi: 10.1016/s0092-8674(88)80024-2. [DOI] [PubMed] [Google Scholar]
- Konopka MC, Weisshaar JC. Heterogeneous motion of secretory vesicles in the actin cortex of live cells: 3D tracking to 5-nm accuracy. The Journal of Physical Chemistry …. 2004;108:9814–9826. [Google Scholar]
- Kovarik ML, Allbritton NL. Measuring enzyme activity in single cells. Trends in Biotechnology. 2011;29:222–230. doi: 10.1016/j.tibtech.2011.01.003. [DOI] [PMC free article] [PubMed] [Google Scholar]
- Krahn MP, Klopfenstein DR, Fischer N, Wodarz A. Membrane Targeting of Bazooka/PAR-3 Is Mediated by Direct Binding to Phosphoinositide Lipids. Current Biology. 2010;20:636–642. doi: 10.1016/j.cub.2010.01.065. [DOI] [PubMed] [Google Scholar]
- Labbé JC, Pacquelet A, Marty T, Gotta M. A Genomewide Screen for Suppressors of par-2 Uncovers Potential Regulators of PAR Protein-Dependent Cell Polarity in Caenorhabditis elegans. Genetics. 2006;174:285–295. doi: 10.1534/genetics.106.060517. [DOI] [PMC free article] [PubMed] [Google Scholar]
- Leake MC, Chandler JH, Wadhams GH, Bai F, Berry RM, Armitage JP. Stoichiometry and turnover in single, functioning membrane protein complexes. Nature. 2006;443:355–358. doi: 10.1038/nature05135. [DOI] [PubMed] [Google Scholar]
- Lee N, Patrick JW, Masson M. Crystalline L-ribulose 5-phosphate 4-epimerase from Escherichia coli. J Biol Chem. 1968;243:4700–4705. [PubMed] [Google Scholar]
- Leonetti MD, Sekine S, Kamiyama D, Weissman JS, Huang B. A scalable strategy for high-throughput GFP tagging of endogenous human proteins. Proc Natl Acad Sci U S A. 2016;113:E3501–E3508. doi: 10.1073/pnas.1606731113. [DOI] [PMC free article] [PubMed] [Google Scholar]
- Li B, Kim H, Beers M, Kemphues K. Different domains of C. elegans PAR-3 are required at different times in development. Developmental Biology. 2010;344:745–757. doi: 10.1016/j.ydbio.2010.05.506. [DOI] [PMC free article] [PubMed] [Google Scholar]
- Lin D, Edwards AS, Fawcett JP, Mbamalu G, Scott JD, Pawson T. A mammalian PAR-3-PAR-6 complex implicated in Cdc42/Rac1 and aPKC signalling and cell polarity. Nat Cell Biol. 2000;2:540–547. doi: 10.1038/35019582. [DOI] [PubMed] [Google Scholar]
- Luo Y, Samuel J, Mosimann SC, Lee JE, Tanner ME, Strynadka NC. The structure of L-ribulose-5-phosphate 4-epimerase: an aldolase-like platform for epimerization. Biochemistry. 2001;40:14763–14771. doi: 10.1021/bi0112513. [DOI] [PubMed] [Google Scholar]
- McKinley RFA, Harris TJC. Displacement of basolateral Bazooka/PAR-3 by regulated transport and dispersion during epithelial polarization in Drosophila. Molecular Biology of the Cell. 2012;23:4465–4471. doi: 10.1091/mbc.E12-09-0655. [DOI] [PMC free article] [PubMed] [Google Scholar]
- McKinley RFA, Yu CG, Harris TJC. Assembly of Bazooka polarity landmarks through a multifaceted membrane-association mechanism. Journal of Cell Science. 2012;125:1177–1190. doi: 10.1242/jcs.091884. [DOI] [PubMed] [Google Scholar]
- Mizuno K, Suzuki A, Hirose T, Kitamura K, Kutsuzawa K, Futaki M, Amano Y, Ohno S. Self-association of PAR-3-mediated by the Conserved N-terminal Domain Contributes to the Development of Epithelial Tight Junctions. Journal of Biological Chemistry. 2003;278:31240–31250. doi: 10.1074/jbc.M303593200. [DOI] [PubMed] [Google Scholar]
- Munro E, Nance J, Priess JR. Cortical flows powered by asymmetrical contraction transport PAR proteins to establish and maintain anterior-posterior polarity in the early C. elegans embryo. Dev Cell. 2004;7:413–424. doi: 10.1016/j.devcel.2004.08.001. [DOI] [PubMed] [Google Scholar]
- Nishi Y, Rogers E, Robertson SM, Lin R. Polo kinases regulate C. elegans embryonic polarity via binding to DYRK2-primed MEX-5 and MEX-6. Development. 2008;135:687–697. doi: 10.1242/dev.013425. [DOI] [PubMed] [Google Scholar]
- Noatynska A, Panbianco C, Gotta M. SPAT-1/Bora acts with Polo-like kinase 1 to regulate PAR polarity and cell cycle progression. Development. 2010;137:3315–3325. doi: 10.1242/dev.055293. [DOI] [PubMed] [Google Scholar]
- Osborne Nishimura E, Zhang JC, Werts AD, Goldstein B, Lieb JD. Asymmetric transcript discovery by RNA-seq in C. elegans blastomeres identifies neg-1, a gene important for anterior morphogenesis. PLoS Genet. 2015;11:e1005117. doi: 10.1371/journal.pgen.1005117. [DOI] [PMC free article] [PubMed] [Google Scholar]
- Padeganeh A, Ryan J, Boisvert J, Ladouceur AM, Dorn JF, Maddox PS. Octameric CENP-A Nucleosomes Are Present at Human Centromeres throughout the Cell Cycle. Current Biology. 2013;23:764–769. doi: 10.1016/j.cub.2013.03.037. [DOI] [PubMed] [Google Scholar]
- Pai JH, Wang Y, Salazar GT, Sims CE, Bachman M, Li GP, Allbritton NL. Photoresist with low fluorescence for bioanalytical applications. Anal Chem. 2007;79:8774–8780. doi: 10.1021/ac071528q. [DOI] [PMC free article] [PubMed] [Google Scholar]
- Qian H, Sheetz MP, Elson EL. Single particle tracking. Analysis of diffusion and flow in two-dimensional systems. Biophysical Journal. 1991;60:910–921. doi: 10.1016/S0006-3495(91)82125-7. [DOI] [PMC free article] [PubMed] [Google Scholar]
- Reyes-Lamothe R, Sherratt DJ, Leake MC. Stoichiometry and Architecture of Active DNA Replication Machinery in Escherichia coli. Science. 2010;328:498–501. doi: 10.1126/science.1185757. [DOI] [PMC free article] [PubMed] [Google Scholar]
- Sailer A, Anneken A, Li Y, Lee S, Munro E. Dynamic Opposition of Clustered Proteins Stabilizes Cortical Polarity in the C. elegans Zygote. Developmental Cell. 2015;35:131–142. doi: 10.1016/j.devcel.2015.09.006. [DOI] [PMC free article] [PubMed] [Google Scholar]
- Schubert CM, Lin R, de Vries CJ, Plasterk RH, Priess JR. MEX-5 and MEX-6 function to establish soma/germline asymmetry in early C. elegans embryos. Mol Cell. 2000;5:671–682. doi: 10.1016/s1097-2765(00)80246-4. [DOI] [PubMed] [Google Scholar]
- Schwartz ML, Jorgensen EM. SapTrap, a Toolkit for High-Throughput CRISPR/Cas9 Gene Modification in Caenorhabditis elegans. Genetics. 2016 doi: 10.1534/genetics.115.184275. genetics.115.184275. [DOI] [PMC free article] [PubMed] [Google Scholar]
- Shaner NC, Lambert GG, Chammas A, Ni Y, Cranfill PJ, Baird MA, Sell BR, Allen JR, Day RN, Israelsson M, et al. A bright monomeric green fluorescent protein derived from Branchiostoma lanceolatum. Nat Meth. 2013;10:407–409. doi: 10.1038/nmeth.2413. [DOI] [PMC free article] [PubMed] [Google Scholar]
- Strome S, Wood WB. Immunofluorescence visualization of germ-line-specific cytoplasmic granules in embryos, larvae, and adults of Caenorhabditis elegans. Proc Natl Acad Sci USA. 1982;79:1558–1562. doi: 10.1073/pnas.79.5.1558. [DOI] [PMC free article] [PubMed] [Google Scholar]
- Tarantino N, Tinevez JY, Crowell EF, Boisson B, Henriques R, Mhlanga M, Agou F, Israël A, Laplantine E. TNF and IL-1 exhibit distinct ubiquitin requirements for inducing NEMO–IKK supramolecular structures. J Cell Biol. 2014;204:231–245. doi: 10.1083/jcb.201307172. [DOI] [PMC free article] [PubMed] [Google Scholar]
- Tavernier N, Noatynska A, Panbianco C. Cdk1 phosphorylates SPAT-1/Bora to trigger PLK-1 activation and drive mitotic entry in C. elegans embryos. The Journal of Cell …. 2015;208:661–669. doi: 10.1083/jcb.201408064. [DOI] [PMC free article] [PubMed] [Google Scholar]
- Thielicke W, Stamhuis E. PIVlab – Towards User-friendly, Affordable and Accurate Digital Particle Image Velocimetry in MATLAB. Journal of Open Research Software. 2014;2:1202. [Google Scholar]
- Tintori SC, Osborne Nishimura E, Golden P, Lieb JD, Goldstein B. A Transcriptional Lineage of the Early C. elegans Embryo. Dev Cell. 2016;38:430–444. doi: 10.1016/j.devcel.2016.07.025. [DOI] [PMC free article] [PubMed] [Google Scholar]
- Ulbrich MH, Isacoff EY. Subunit counting in membrane-bound proteins. Nat Methods. 2007;4:319–321. doi: 10.1038/NMETH1024. [DOI] [PMC free article] [PubMed] [Google Scholar]
- Wang Y, Navin NE. Advances and Applications of Single-Cell Sequencing Technologies. Molecular Cell. 2015;58:598–609. doi: 10.1016/j.molcel.2015.05.005. [DOI] [PMC free article] [PubMed] [Google Scholar]
- Wu H, Feng W, Chen J, Chan LN, Huang S, Zhang M. PDZ Domains of Par-3 as Potential Phosphoinositide Signaling Integrators. Molecular Cell. 2007;28:886–898. doi: 10.1016/j.molcel.2007.10.028. [DOI] [PubMed] [Google Scholar]
- Zhang Y, Wang W, Chen J, Zhang K, Gao F, Gao B, Zhang S, Dong M, Besenbacher F, Gong W, et al. Structural Insights into the Intrinsic Self-Assembly of Par-3 N-Terminal Domain. Structure. 2013;21:997–1006. doi: 10.1016/j.str.2013.04.004. [DOI] [PubMed] [Google Scholar]
Associated Data
This section collects any data citations, data availability statements, or supplementary materials included in this article.