Abstract
Serial Analysis of Gene Expression (SAGE) is becoming a widely used gene expression profiling method for the study of development, cancer and other human diseases. Investigators using SAGE rely heavily on the quantitative aspect of this method for cataloging gene expression and comparing multiple SAGE libraries. We have developed additional computational and statistical tools to assess the quality and reproducibility of a SAGE library. Using these methods, a critical variable in the SAGE protocol was identified that has the potential to bias the Tag distribution relative to the GC content of the 10 bp SAGE Tag DNA sequence. We also detected this bias in a number of publicly available SAGE libraries. It is important to note that the GC content bias went undetected by quality control procedures in the current SAGE protocol and was only identified with the use of these statistical analyses on as few as 750 SAGE Tags. In addition to keeping any solution of free DiTags on ice, an analysis of the GC content should be performed before sequencing large numbers of SAGE Tags to be confident that SAGE libraries are free from experimental bias.
INTRODUCTION
Serial Analysis of Gene Expression (SAGE) is a powerful method for obtaining comprehensive and quantitative gene expression profiles from cell populations under selected physiological conditions. Since the first publication introducing SAGE (1), significant progress has been made toward making the method more efficient (2–4) and applicable to smaller amounts of mRNA (5–7). In addition, computational tools (8–10) and statistical methods (11–14) have been developed to aid in the design and analysis of a SAGE experiment.
To fully realize the power of this method, it is essential that investigators become proficient with the detailed steps of the SAGE protocol. Proficiency is assessed with several established procedures that are frequently used for monitoring the quality of a generated SAGE library. These include: (i) assessing the efficiency of cDNA synthesis by radioactive nucleotide incorporation; (ii) monitoring the success of several enzymatic steps with gel analyses of the SAGE-generated DNA molecules; and (iii) measurement of linker contamination and duplicate DiTags in the sequenced SAGE library. Typically, the results of these established quality control procedures are evaluated before committing large amounts of time, resources and money to generate extensive SAGE libraries.
To gain additional confidence that a SAGE library is suitable for large-scale Tag sequencing, our laboratory has developed additional statistical methods for assessing the quality and reproducibility of a given SAGE library. In the course of using these methods, a critical temperature variable in the SAGE protocol was identified that has the potential to bias the distribution of sampled SAGE Tags relative to GC content. In this paper, we will show the underlying methodological variable, how to evaluate any SAGE library for the presence of the GC content bias, and how to prevent this error during the construction of a SAGE library. We also address the presence and magnitude of this bias in publicly available and published SAGE libraries.
MATERIALS AND METHODS
SAGE library synthesis
Our SAGE libraries were constructed following the SAGE protocol v1.0c (http://www.sagenet.org) on RNA from B6C3Fe mouse embryonic limbs, essentially as described (1) and reported elsewhere (E.H.Margulies, S.L.R.Kardia and J.W.Innis, manuscript submitted), or a B6C3Fe mouse adult male brain.
SAGE data aquisition
eSAGE v1.10b (9) was used to extract and analyze the SAGE data. To assure SAGE Tags were only extracted from high-quality sequences, data from the ALFexpress were manually edited with ALFwin v2.10 to exclude low quality regions. Sequence trace files generated on the ABI PRISM 3700 DNA Analyzer were analyzed with the Phred base-calling algorithm (15). PHD-formatted output files (*.phd.1) generated from Phred-analyzed sequence trace data were read by eSAGE, which was programmed to automatically exclude sequences with Phred quality values <20 (E.H.Margulies, S.L.R.Kardia and J.W.Innis, manuscript submitted).
Test for an overall difference to assess reproducibility of a SAGE library
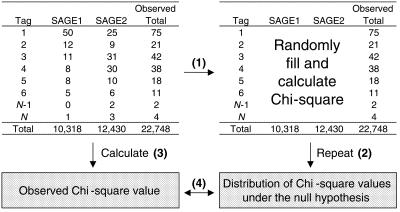
Because the Chi-square test of independence performs poorly when Tag counts are <5 (16), a Monte Carlo simulation approach was used to determine the similarity between two subpopulations of SAGE data from the same library (Fig. 1). A program was written in S-Plus 2000 (Insightful Corp.) to perform this Monte Carlo simulation and is available upon request.
Figure 1.
Description of the Monte Carlo simulation process used to detect an overall difference between subpopulations of SAGE data. Keeping the row and column totals fixed, a new data table is randomly generated and a Chi-square value is calculated (step 1). This process is repeated 200 times to generate a distribution of Chi-square values under the null hypothesis of no difference (step 2). The observed Chi-square value is then calculated from the actual data (step 3) and compared to the distribution of Chi-square values under the null hypothesis (step 4). The null distribution represents Chi-square values that occur by chance, assuming there is no difference between the two populations. Comparing the observed Chi-square value with the null distribution gives us an idea of the overall difference between the two subpopulations.
Calculations for rate of accumulation
Using the eSAGE (9) limit function, which limits the number of Tags extracted to a SAGE library by a user-specified amount, the frequency (number of times a Tag was observed) for each SAGE Tag was determined at regular intervals. These data were plotted with Excel 2000 (Microsoft Corp.) and the slope of a best-fit line through the data points representing the cumulative frequencies of individual SAGE Tags were calculated with the SLOPE function (which uses a least squares method). The frequencies of Tags from the same SAGE library are expected to increase at the same rate and this slope calculation is a quantitative representation of the rate of accumulation for a given SAGE Tag.
RESULTS
A test of overall difference can be used to assess the quality of a SAGE library
As a measure of quality for our SAGE libraries, we have used the Monte Carlo simulation approach (Fig. 1) to test subpopulations of data from the same SAGE library for reproducibility. The overall test used in this fashion is suitable for identifying inconsistencies arising from a number of methodological and data management errors. An example of such an error would include, but is not limited to, contamination with data arising from other concurrently pursued SAGE libraries in a laboratory.
In a typical experiment of this type, Tag data from a SAGE library are split into two subpopulations and compared with each other. This test has been validated with multiple SAGE libraries of different sizes (data not shown). In all cases, when there are no known discrepancies, the null hypothesis of no overall difference is accepted at a significance level of 1% (Fig. 2A).
Figure 2.
Monte Carlo simulation results. Histograms showing the distribution of Chi-square values under the null hypothesis. These are the results from 200 Monte Carlo simulations, as described in Materials and Methods, for two subpopulations of 25 000 SAGE Tags each. (A) Distribution from a population made up of 14 000 Tags from Amp1 and 36 000 Tags from Amp5. (B) A different population made up of 14 000 Tags from Amp1 and 36 000 Tags from Amp2. Since Amp1, Amp2 and Amp5 were generated from the same DiTag ligation, the null hypothesis is that there is no difference between either of the two subpopulations. Arrows point to the observed Chi-square values. In (A), the observed Chi-square value falls within the null distribution (empirical P-value = 0.31) indicating no overall difference between the two subpopulations. In (B), the observed Chi-square value falls outside the null distribution (empirical P-value = 0) indicating the presence of an overall difference between the two subpopulations. Note the x-axis break in (B). The y-axis represents the number of simulations with a given range of Chi-square values.
In a recent analysis of one of our SAGE libraries, the null hypothesis was rejected (Fig. 2B), indicating the presence of an unexplained overall difference between the two subpopulations of data generated from the same SAGE library. Upon investigation, it was determined that the Tags for this library were sequenced from two separate DiTag amplifications (Amp1 and Amp2) that were generated from the same DiTag ligation (see Fig. 3 for an outline of the repeated steps). Further analysis showed that the overall difference was greatest when the two subpopulations used in the Monte Carlo analysis were divided according to DiTag amplification (data not shown). This anomaly was further explored to identify the basis for the observed difference between Amp1 and Amp2.
Figure 3.
Steps of the SAGE method repeated for multiple DiTag amplifications. Linker-DiTag molecules were created through a series of enzymatic steps outlined in the SAGE protocol. Dilutions of this substrate were used for multiple DiTag amplifications from the same DiTag ligation. Amplified DiTags were gel purified (step 1) and digested with NlaIII (step 2). This digest was purified by phenol extraction, ethanol precipitated and free DiTags were gel purified and concatenated (step 3). Large concatemers were gel purified (step 4) and cloned into plasmids (step 5). Individual clones were amplified by colony PCR (step 6) for sequencing. It should be noted that all DiTag amplifications performed in our laboratory and reported in this paper had gels that looked similar to those shown here.
Differences between two DiTag amplifications correlate with Tag GC content
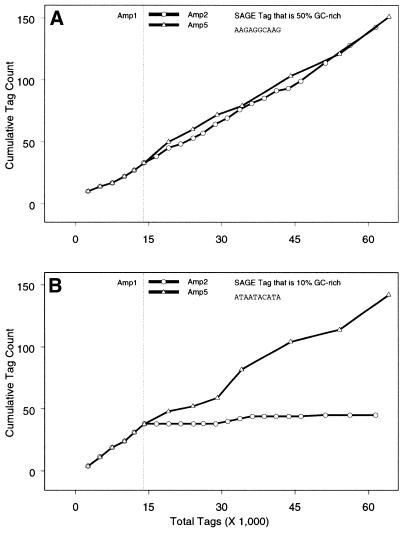
One explanation for the observed difference could be that the DiTag amplifications were treated differently. However, great care was taken to perform each DiTag amplification similarly, by strictly following the SAGE protocol v1.0c. It should be emphasized that all diagnostic gels looked similar between the two DiTag amplifications (a typical set of gels is shown in Fig. 3). In an attempt to identify the cause of this overall difference, the rate of accumulation (or slope) for individual SAGE Tags (see Materials and Methods for slope calculation) was compared between Amp1 and Amp2. Most SAGE Tags examined had similar slopes (Fig. 4A). However, several SAGE Tags had noticeably different slopes between the two DiTag amplifications (Fig. 4B). Furthermore, it was observed that the DNA sequences of SAGE Tags with different slopes were frequently AT-rich.
Figure 4.
The accumulation of Tag counts through time for two representative SAGE Tags in different DiTag amplifications. (A) Accumulation of a representative SAGE Tag that is 50% GC-rich and (B) 10% GC-rich. Tag accumulation for DiTag amplification 1 (Amp1) is represented to the left of the reference line. Tag accumulation for DiTag amplifications 2 and 5 (Amp2 and Amp5) are added to the accumulation from Amp1 and represented to the right of the reference line. The change in slope between Amp1 and Amp2 for the 10% GC-rich SAGE Tag in (B), but not for the 50% GC-rich SAGE Tag in (A) suggests that AT-rich SAGE Tags are under-represented in Amp2. Whereas, the similar slopes between Amp1 and Amp5 for both the 10 and 50% GC-rich SAGE Tag suggests that there is no bias with respect to GC content of a SAGE Tag in Amp5.
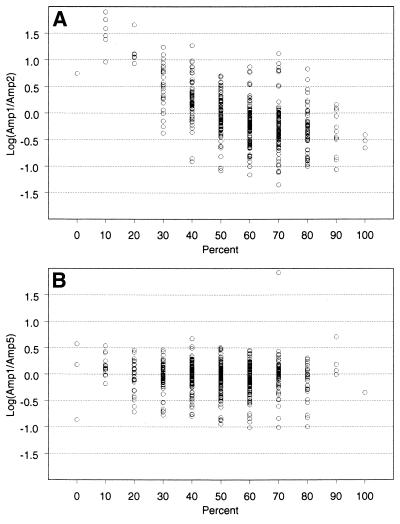
To test the hypothesis that SAGE Tags with AT-rich sequences have different rates of accumulation between Amp1 and Amp2, the statistic in equation 1 was calculated for all SAGE Tags and plotted on a graph sorted by GC content (Fig. 5A).
Figure 5.
Correlation between GC content and rate of tag accumulation. Scatter plot of V from equation 1 versus GC%. Any deviation from zero represents a difference in the slopes between two different DiTag amplifications for the same SAGE Tag. Some variation around zero is expected, especially for SAGE Tags with low frequencies. For clarification purposes, Tags with total frequencies <15 were removed from these plots. The same trends were observed on plots containing all the data (not shown). (A) Amp1 (unbiased) compared to Amp2 (biased). Note the asymmetric distribution of V versus GC%, where V tends to be an increasingly positive value for AT-rich Tags. The positive value of V is the result of smaller slopes in Amp2 (since the slope of Amp2 is in the denominator for the calculation of V), indicating a loss of AT-rich Tags in Amp2. (B) Amp1 (unbiased) compared to Amp5 (unbiased). Here, the distribution of V is similarly distributed for all percentages of GC content.
V = log(S1/S2) 1
where S = slope of the fitted line (see Materials and Methods). In equation 1, any deviation from V = 0 represents a change in slope between the two DiTag amplifications. Some variation was expected around V = 0 (Fig. 5B), especially for Tags with low frequencies. However, as the GC content of a SAGE Tag decreased below 50%, the distribution of V shifted to an increasingly positive value. This indicated that AT-rich SAGE Tags had different abundances between Amp1 and Amp2. Moreover, the positive values of V indicated a loss of AT-rich SAGE Tags in Amp2; it will be shown below that there was not the alternative gain of AT-rich Tags in Amp1. This difference resulted in an overall shift in the sampled distribution of SAGE Tags with respect to GC content for Amp2 (Fig. 6, compare Amp1 with Amp2) as well as an increase in the average GC content of all SAGE Tags in a library (Table 1).
Figure 6.

Distribution of SAGE Tags sorted by GC content. This graph represents the fraction of SAGE Tags from each DiTag amplification with a particular GC content (0–100%). A line has been drawn through each point to depict a distribution. Note that the distribution of SAGE Tags from Amp2 is skewed to the right, indicating a loss of AT-rich SAGE Tags and corresponding increase in the proportion of GC-rich SAGE Tags.
Table 1. Summary of DiTag amplifications.
| DiTag amplification |
Average GC contenta (%) |
Method usedb |
| Amp1 | 48.3 | RT |
| Amp2 | 58.4 | RT |
| Amp3 | 55.8 | RT |
| Amp4 | 49.7 | Cold |
| Amp5 | 48.5 | Cold |
The rows in bold highlight DiTag amplifications affected with a GC content bias.
aCalculated as described in Materials and Methods.
bRefers to whether the phenol extraction after the NlaIII digest to release free DiTags was performed at room temperature (RT) or on ice and centrifuged at 4°C (Cold).
Other SAGE libraries are potentially biased
To investigate whether other SAGE libraries could have a GC content sampling bias, we obtained all 89 SAGE libraries available as of January 2001 from the SAGE website at NCBI (http://www.ncbi.nlm.nih.gov/SAGE) and analyzed their average GC content. For this analysis, we also evaluated three developing mouse kidney SAGE libraries (17), three mouse brain SAGE libraries (18), five of our own SAGE libraries and two additional mouse SAGE libraries (J.Shires, E.Theodoridis and A.Hayday, in press). Figure 7 is a histogram of the calculated average GC content of the SAGE Tags from each library. The circle and triangle denote the two peaks of this bimodal distribution, which correlate well with the average GC content from our unbiased and biased SAGE libraries, respectively.
Figure 7.
Histogram of average GC contents from 102 publicly available SAGE libraries. Averages were calculated as described in Materials and Methods. The circle and triangle represent the two peaks of this bimodal distribution that correlate well with the averages of SAGE libraries shown in this paper to be unbiased and biased, respectively. Of the tested SAGE libraries, 82% have an average GC content <52%.
Some of the variation in the average GC content is likely explained by variability in gene expression of the different tissue sources as well as the random sampling process inherent in the method. Nevertheless, the group of averages in Figure 7 centered at the triangle could be due to the unregulated melting of AT-rich DiTags during SAGE library construction and therefore may not be an accurate quantitative representation of gene expression. To test this hypothesis, a SAGE library was constructed with mRNA isolated from an adult male mouse brain. This tissue source is very similar to the source used in one of the libraries with an average GC content of 54.5% (18).
Concatemers from our mouse SAGE library were generated and sequenced from two independent DiTag amplifications, keeping all solutions of free DiTags on ice. In both instances, the average GC content of the SAGE Tags was 48.3 and 48.7%, respectively, falling in the major group centered around the circle. This suggests that SAGE libraries with a relatively high average GC content (centered around the triangle) could represent biased distributions.
Denaturation and experimental loss of AT-rich DiTags can cause a GC content bias
It has been noted in our laboratory and others (V.E.Velculescu, personal communication) that a small, usually unnoticed, temperature increase of a solution containing free DiTags can cause them to denature under low-salt conditions (Fig. 8). Even though our diagnostic gels did not show any significant sign of denatured DiTags, we nevertheless hypothesized that selective denaturation of AT-rich DiTags had occurred, undetected, in Amp2. To test this hypothesis, three additional DiTag amplifications (Amp3, Amp4 and Amp5) were generated from the same DiTag ligation by varying the temperature at which the phenol extraction after the NlaIII digest to release free DiTags was performed. This step was either performed at room temperature (Amp3) or kept on ice and centrifuged at 4°C (Amp4 and Amp5).
Figure 8.
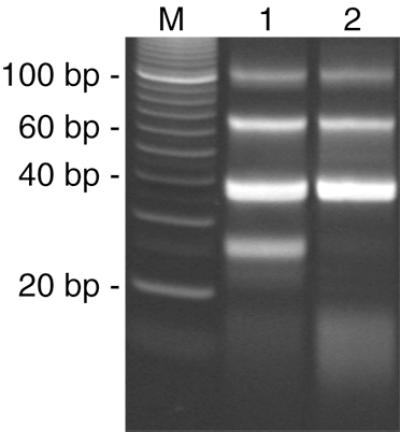
An example of the effects of unregulated temperature control on free DiTags. Polyacrylamide gel (12%) stained with Sybr Green. A single DiTag amplification and NlaIII digest was performed then split equally into two samples. The sample in lane 1 was kept on ice for the phenol extraction and ethanol precipitation steps of the SAGE protocol. The sample in lane 2 was kept at room temperature for the above mentioned steps of the SAGE protocol. Note the loss of released DiTags in lane 2 and subsequent gain of a lower molecular weight smear, likely representing the denatured DiTags. Images were captured on a BioRad Molecular Imager 2000, exported as a TIFF file and cropped in Photoshop 5.0. The image was edited such that these two lanes, resolved on the same gel, could be viewed side-by-side. No other modifications were made to the image.
We were able to reproduce a distribution of SAGE Tags with a GC content bias (Amp3) by performing the phenol extraction (including the centrifugation) of free DiTags at room temperature, instead of 4°C. Furthermore, both Amp4 and Amp5 yielded populations of SAGE Tags similar to Amp1 in GC content distribution (Fig. 6), rates of accumulation (Fig. 4) and average SAGE Tag GC content (Table 1). Figure 9 shows a direct comparison of the gels used to purify the free DiTags from Amp3 and Amp4. Note the similarity of the lanes and that there is no significant difference between the staining intensity below the DiTag band (the region of the gel that would contain denatured DiTags).
Figure 9.
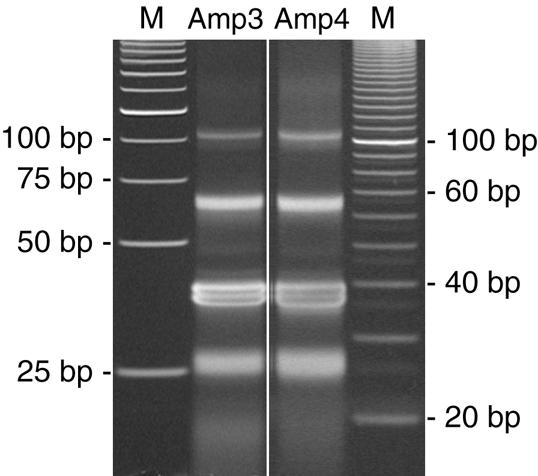
Biased (Amp3) and unbiased (Amp4) products from the NlaIII digest of the amplified linker-DiTag molecules. NlaIII digests were resolved on two separate gels as described in Figure 8. Shown here is one of four lanes from two separate DiTag amplifications from the same DiTag ligation. Note the similarity of both lanes and that this gel cannot reliably detect a GC content bias. The image length of the gel for Amp3 was reduced by 34% to line up the bands with similar molecular weights on the different gels. No other modifications were made to these images.
Further evidence that Amp1, Amp4 and Amp5 have expected GC content distributions while Amp2 and Amp3 likely have biased distributions is provided by an analysis of the average GC content of the DNA sequences from which SAGE Tags are derived. SAGE Tags are generated from a 10 bp sequence flanking the 3′ end of the last NlaIII site in a cDNA. This position usually falls within the 3′ untranslated region (UTR) of a gene, which has been shown to be ∼45% GC-rich for rodents and mammals (19). It has also been shown that ∼80% of the identified genes in the human genome fall within regions of DNA that are ≤50% GC-rich while ∼5% of the genes fall within regions that are >55% GC-rich (20,21). Therefore, the observed average SAGE Tag GC content for Amp1, Amp4 and Amp5 are consistent with expectations from analyses of 3′ UTR and genomic databases.
Test to detect the GC content bias in a SAGE library
Two approaches can be used to determine the extent of GC content bias in a population of SAGE Tags. The first, a subjective approach, is to observe the distribution of SAGE Tags versus GC content as in Figure 6. The data used to generate this distribution can be obtained with the GC content function in eSAGE (9). Unbiased libraries usually have a curve similar to that of Amp1 and Amp5 (data not shown).
The second, a quantitative approach, is to determine the average GC content of the SAGE Tags in a library. To obtain this value, we used a combination of Access 97 queries and customized Perl programs (22) to reformat the GC content data obtained with eSAGE for analysis with the summary statistics functions of S-Plus 2000. Since the degree of bias in any SAGE library could vary depending on experimental conditions, we do not attempt to put a limit on the average GC content value that determines biased or unbiased status. However, SAGE libraries with average GC content values above 50% are questionable and it has been shown here that values near 55% and greater are the result of GC content biased SAGE libraries. Both of these tests can detect sampling bias by sequencing as few as 750 Tags from a SAGE library (data not shown).
DISCUSSION
The statistical tools presented here can be used to identify unwanted discrepancies due to methodological or data management errors. Using the overall test on one of our own SAGE libraries, an error was identified that reflected a GC content bias. Our analysis showed that several publicly available SAGE libraries were similarly affected with this bias.
A recent modification to the SAGE protocol (v1.0c to v1.0e) recommends that any solution containing free DiTags be kept on ice. This was added to help prevent the dissociation of this complex mixture in low salt conditions (Fig. 8). While many investigators have had successful results without this modification, we have shown here that melting of AT-rich DiTags can occur undetected (Fig. 9) unless additional statistical analyses are performed.
DiTags generated from the SAGE method are double-stranded DNA molecules ∼26 bp in length. In any given SAGE experiment, virtually all DiTag molecules have a unique DNA sequence, making the thermodynamic properties of a DiTag solution different from a solution of double-stranded 26 bp DNA molecules of identical sequence. First, the melting point of each DiTag molecule varies based on its GC content (23). Secondly, the re-association of single-stranded DiTags with their complementary strand is hindered by the heterogeneous complexity of the solution (data not shown).
The critical time that DiTags are vulnerable to denaturation is after the NlaIII digest that releases them from the amplified linker-DiTag PCR product, until the time DiTags are concatenated. Clearly, keeping free DiTags on ice is one way to prevent this from happening and is strongly suggested. In particular, the centrifugation step of the phenol extraction to clean up the NlaIII digest of released DiTags should be performed in a refrigerated centrifuge as we have noticed that unrefrigerated bench-top microfuges can heat tubes up to 33°C with a 10 min spin (measured with a micro thermometer in 2 ml of water; data not shown). Another way to prevent DiTag melting is to modify the enzymes used in the method such that longer, more stable, DiTags are generated. Such a method (LongSAGE) that uses a different Tagging enzyme has recently been developed (K.W.Kinzler, personal communication) and may not suffer from this potential problem.
SAGE libraries affected with a GC content bias can still be used to determine the types of genes expressed in a tissue. However, to fully realize the potential of the method in obtaining quantitative gene expression profiles, experimental bias must be eliminated.
Acknowledgments
ACKNOWLEDGEMENTS
The authors would like to thank R. H. Lyons for helpful suggestions using Perl, S. C. Hamon for helpful suggestions with the statistical aspects of this paper as well as using S-Plus 2000 and M. W. Glynn for critical review of the manuscript. E.H.M. is supported by the Institutional Training Program in Genomic Science (T32 HG00040). This work was supported in part by a University of Michigan Bioinformatics pilot grant.
References
- 1.Velculescu V.E., Zhang,L., Vogelstein,B. and Kinzler,K.W. (1995) Serial analysis of gene-expression. Science, 270, 484–487. [DOI] [PubMed] [Google Scholar]
- 2.Powell J. (1998) Enhanced concatemer cloning—a modification to the SAGE (Serial Analysis of Gene Expression) technique. Nucleic Acids Res., 26, 3445–3446. [DOI] [PMC free article] [PubMed] [Google Scholar]
- 3.Kenzelmann M. and Muhlemann,K. (1999) Substantially enhanced cloning efficiency of SAGE (Serial Analysis of Gene Expression) by adding a heating step to the original protocol. Nucleic Acids Res., 27, 917–918. [DOI] [PMC free article] [PubMed] [Google Scholar]
- 4.Angelastro J.M., Klimaschewski,L.P. and Vitolo,O.V. (2000) Improved NlaIII digestion of PAGE-purified 102 bp ditags by addition of a single purification step in both the SAGE and microSAGE protocols. Nucleic Acids Res., 28, e62. [DOI] [PMC free article] [PubMed] [Google Scholar]
- 5.Peters D.G., Kassam,A.B., Yonas,H., O’Hare,E.H., Ferrell,R.E. and Brufsky,A.M. (1999) Comprehensive transcript analysis in small quantities of mRNA by SAGE-Lite. Nucleic Acids Res., 15, e39. [DOI] [PMC free article] [PubMed] [Google Scholar]
- 6.Datson N.A., van der Perk-de Jong,J., van den Berg,M.P., de Kloet,E.R. and Vreugdenhil,E. (1999) MicroSAGE: a modified procedure for serial analysis of gene expression in limited amounts of tissue. Nucleic Acids Res., 27, 1300–1307. [DOI] [PMC free article] [PubMed] [Google Scholar]
- 7.Ye S.Q., Zhang,L.Q., Zheng,F., Virgil,D. and Kwiterovich,P.O. (2000) MiniSAGE: gene expression profiling using serial analysis of gene expression from 1 µg total RNA. Anal. Biochem., 287, 144–152. [DOI] [PubMed] [Google Scholar]
- 8.Lash A.E., Tolstoshev,C.M., Wagner,L., Schuler,G.D., Strausberg,R.L., Riggins,G.J. and Altschul,S.F. (2000) SAGEmap: a public gene expression resource. Genome Res., 10, 1051–1060. [DOI] [PMC free article] [PubMed] [Google Scholar]
- 9.Margulies E.H. and Innis,J.W. (2000) eSAGE: managing and analysing data generated with serial analysis of gene expression (SAGE). Bioinformatics, 16, 650–651. [DOI] [PubMed] [Google Scholar]
- 10.van Kampen A.H., van Schaik,B.D., Pauws,E., Michiels,E.M., Ruijter,J.M., Caron,H.N., Versteeg,R., Heisterkamp,S.H., Leunissen,J.A., Baas,F. and van Der Mee,M. (2000) USAGE: a web-based approach towards the analysis of SAGE data. Bioinformatics, 16, 899–905. [DOI] [PubMed] [Google Scholar]
- 11.Audic S. and Claverie,J.M. (1997) The significance of digital gene expression profiles. Genome Res., 7, 986–995. [DOI] [PubMed] [Google Scholar]
- 12.Kal A.J., van Zonneveld,A.J., Benes,V., van den Berg,M., Koerkamp,M.G., Albermann,K., Strack,N., Ruijter,J.M., Richter,A., Dujon,B., Ansorge,W. and Tabak,H.F. (1999) Dynamics of gene expression revealed by comparison of serial analysis of gene expression transcript profiles from yeast grown on two different carbon sources. Mol. Biol. Cell, 10, 1859–1872. [DOI] [PMC free article] [PubMed] [Google Scholar]
- 13.Stollberg J., Urschitz,J., Urban,Z. and Boyd,C.D. (2000) A quantitative evaluation of SAGE. Genome Res., 10, 1241–1248. [DOI] [PMC free article] [PubMed] [Google Scholar]
- 14.Man M.Z., Wang,X. and Wang,Y. (2000) POWER_SAGE: comparing statistical tests for SAGE experiments. Bioinformatics, 16, 953–959. [DOI] [PubMed] [Google Scholar]
- 15.Ewing B., Hillier,L., Wendl,M.C. and Green,P. (1998) Base-calling of automated sequencer traces using phred. I. Accuracy assessment. Genome Res., 8, 175–185. [DOI] [PubMed] [Google Scholar]
- 16.Sokal R.R. and Rohlf,F.J. (1995) Biometry: The Principles and Practice of Statistics in Biological Research, 3rd Edn. Freeman, New York, NY.
- 17.Virlon B., Cheval,L., Buhler,J.M., Billon,E., Doucet,A. and Elalouf,J.M. (1999) Serial microanalysis of renal transcriptomes. Proc. Natl Acad. Sci. USA, 96, 15286–15291. [DOI] [PMC free article] [PubMed] [Google Scholar]
- 18.Chrast R., Scott,H.S., Papasavvas,M.P., Rossier,C., Antonarakis,E.S., Barras,C., Davisson,M.T., Schmidt,C., Estivill,X., Dierssen,M., Pritchard,M. and Antonarakis,S.E. (2000) The mouse brain transcriptome by SAGE: differences in gene expression between P30 brains of the partial trisomy 16 mouse model of down syndrome (Ts65Dn) and normals. Genome Res., 10, 2006–2021. [DOI] [PMC free article] [PubMed] [Google Scholar]
- 19.Pesole G., Luini,S., Grillo,G. and Saccone,C. (1997) Structural and compositional features of untranslated regions of eukaryotic mRNAs. Gene, 205, 95–102. [DOI] [PubMed] [Google Scholar]
- 20.International Human Genome Sequencing Consortium. (2001) Initial sequencing and analysis of the human genome. Nature, 409, 860–921. [DOI] [PubMed] [Google Scholar]
- 21.Venter J.C., Adams,M.D., Myers,E.W., Li,P.W., Mural,R.J., Sutton,G.G., Smith,H.O., Yandell,M., Evans,C.A., Holt,R.A. et al. (2001) The sequence of the human genome. Science, 291, 1304–1351. [DOI] [PubMed] [Google Scholar]
- 22.Wall L., Christiansen,T. and Orwant,J. (2000) Programming Perl, 3rd Edn. O’ Reilly & Associates, Inc., Sebastopol, CA.
- 23.Cantor C. and Schimmel,P. (1980) Biophysical Chemistry, Part III: The Behavior of Biological Macromolecules. W.H. Freeman and Company, San Francisco, CA.


