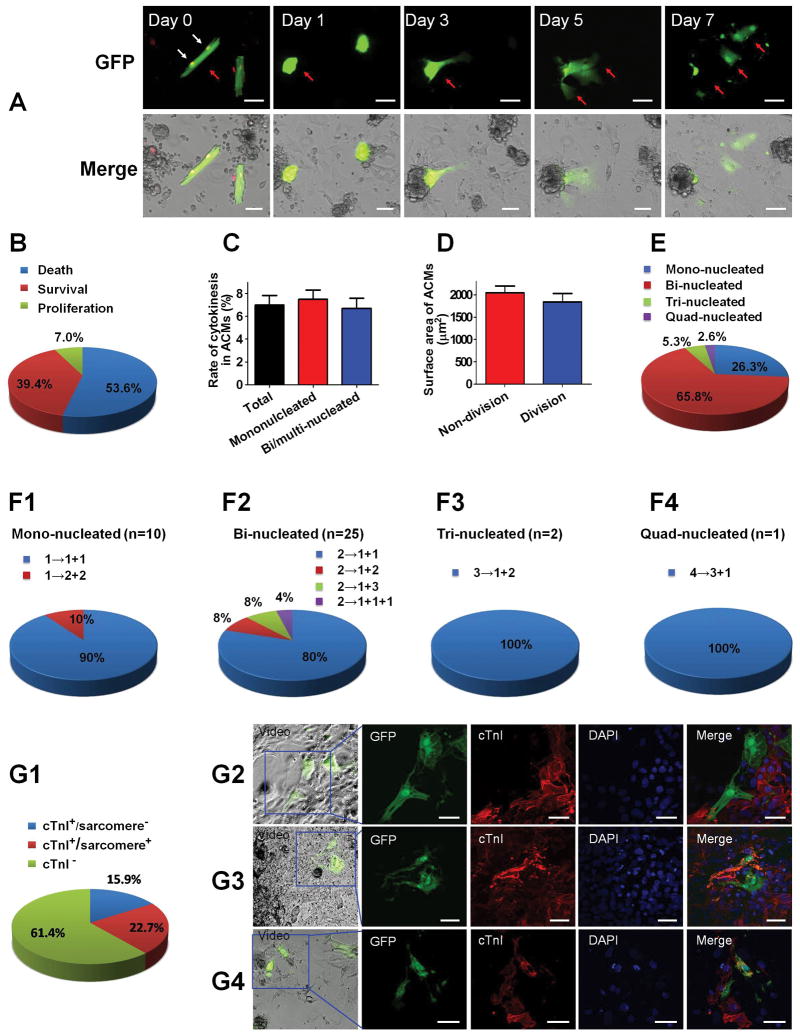
Figure 2. ACM proliferation with cytokinesis in-vitro.
Freshly isolated ACMs from β-actin-GFP transgenic mice were co-cultured with NRVMs for 7 days. Every ACM was traced with a time-lapse video microscopy, and only the division events with completed cytokinesis were counted as ACM proliferation. A: The morphological remodeling of ACMs in the co-culture system observed with a time-lapse video microscopy. A bi-nucleated ACM indicated with red arrow became spherical and lost organized contractile apparatus during the first 3 days of co-culture, and then proliferated into several daughter cells that assumed a NRVM-like shape over the next few days. White arrow indicates the nuclei (labeled with DRAQ5™ Fluorescent Probe) of the ACM that underwent cytokinesis at the beginning of co-culture. The proliferation process of this ACM can be found in Supplemental Video 1. B: The cell fate of ACMs during the 7 days co-culture with NRVMs. The rates of cell death, survival and proliferation were quantified. C: The proliferation rates of mononucleated and bi/multi-nucleated ACMs. D: The surface area of ACMs that underwent proliferation and those without proliferation. E: The percent composition of proliferated ACMs. A total number of 38 ACM proliferation events with clearly visible nuclei were quantified. F: The cell division patterns of ACMs with different nuclei number. G: The characteristics of the daughter cells after ACM cytokinesis immunostained with cTnI. G1: The percentage of ACM progeny with different properties. G2: Representative images showing both of the ACM derived daughter cells lost cTnI expression. G3: Representative images showing one ACM derived daughter cell maintained sarcomeric structure while the other lost cTnI. G4: Representative images showing both of the ACM derived daughter cells regained sarcomeric structure. The proliferation process of the ACMs shown in G2-4 can be found in Supplemental Videos 2–4. For A–G, scale bars represent 50μm.

