

Abstract
Both Reelin (RELN) and glutamate decarboxylase 67 (GAD1) have been implicated in the pathophysiology of Autism Spectrum Disorders (ASD). We have previously shown that both mRNAs are reduced in the cerebella (CB) of ASD subjects through a mechanism that involves increases in the amounts of MECP2 binding to the corresponding promoters. In the current study, we examined the expression of RELN, GAD1, GAD2, and several other mRNAs implicated in this disorder in the frontal cortices (FC) of ASD and CON subjects. We also focused on the role that epigenetic processes play in the regulation of these genes in ASD brain. Our goal is to better understand the molecular basis for the down-regulation of genes expressed in GABAergic neurons in ASD brains.
We measured mRNA levels corresponding to selected GABAergic genes using qRT-PCR in RNA isolated from both ASD and CON groups. We determined the extent of binding of MECP2 and DNMT1 repressor proteins by chromatin immunoprecipitation (ChIP) assays. The amount of 5-methylcytosine (5mC) and 5-hydroxymethylcytosine (5hmC) present in the promoters of the target genes was quantified by methyl DNA immunoprecipitation (MeDIP) and hydroxyl MeDIP (hMeDIP).
We detected significant reductions in the mRNAs associated with RELN and GAD1 and significant increases in mRNAs encoding the Ten-eleven Translocation (TET) enzymes 1, 2, and 3. We also detected increased MECP2 and DNMT1 binding to the corresponding promoter regions of GAD1, RELN, and GAD2. Interestingly, there was decreased amounts of 5mC at both promoters and little change in 5hmC content in these same DNA fragments.
Our data demonstrate that RELN, GAD1, and several other genes selectively expressed in GABAergic neurons, are down-regulated in post-mortem ASD FC. In addition, we observed increased DNMT1 and MECP2 binding at the corresponding promoters of these genes. The finding of increased MECP2 binding to the RELN, GAD1 and GAD2 promoters, with reduced amounts of 5mC and unchanged amounts of 5hmC present in these regions, suggests the possibility that DNMT1 interacts with and alters MECP2 binding properties to selected promoters. Comparisons between data obtained from the FC with CB studies showed some common themes between brain regions which are discussed.
Keywords: methylcytosine, hydroxymethylcytosine, gene expression, chromatin, GABA neuron, transcription, repressors
1. Introduction
Autism spectrum disorder (ASD) is a neurodevelopmental condition characterized by impaired social interactions, language deficits, as well as, restrictive or repetitive behaviors. As recently iterated (Grayson and Guidotti, 2016; Zhubi et al., 2014a), to better understand the complexity of ASD etiopathogenesis, it is essential to conceptualize genetic and environmental factors as complementary factors that modify ASD risk through changes in gene expression. Environmental factors and genetic background interact and amplify the contribution of individual components. Epigenetic mechanisms represent a dynamic platform through which environmental factors interact with the genetic landscape resulting in modifications in gene expression (Grayson and Guidotti, 2016).
Gamma-aminobutyric acid (GABA) is the main inhibitory neurotransmitter in the mature, adult brain. During prenatal development, GABA is depolarizing and plays a role in stimulating the proliferation of neural progenitor cells, neuronal migration, neuronal differentiation and dendritic spine maturation (Represa and Ben-Ari, 2005). During birth, oxytocin mediates an abrupt transition in the action of GABA from excitatory to inhibitory that has been proposed to be absent in patients diagnosed with ASD (Ben-Ari, 2015). Postmortem human brain and induced pluripotent stem cell studies from autistic patients have highlighted the role of the GABAergic inhibitory system in the pathophysiology of ASD (Fatemi et al., 2010; Fatemi et al., 2014; Mariani et al., 2015). Linkage disequilibrium studies demonstrate linkage between ASD and a number of genes encoding GABAergic signaling molecules implicating a role for these genes in ASD (Ma et al., 2005; McCauley et al., 2004; Chang et al., 2011; Piton et al., 2013). Additional biochemical findings, including the reduction in GABA binding sites (Blatt et al., 2001; Guptill et al., 2007; Oblak et al., 2010, 2011), reduced expression of glutamic acid decarboxylase 65 (GAD2) and 67 (GAD1) kD proteins and mRNAs (Fatemi et al., 2002; Yip et al., 2007, 2009; Zhubi et al., 2014b) and the altered expression of GABAA and GABAB receptor subunits in post-mortem ASD brain (Fatemi et al., 2009a, 2009b, 2010, 2014) support a GABAergic involvement in the pathogenesis of ASD. In addition, reduced levels of receptor subunits in Brodmann area 9 (BA9) (12 subunits), BA40 (6 subunits) and CB (4 subunits) (Fatemi et al., 2009a, 2009b, 2010, 2014) have been reported. It seems likely that reduced levels of the neurotransmitter GABA or a dysfunction of GABAA receptors may be responsible for the observed inhibitory signaling deficits which could explain the high comorbidity of Rett Syndrome (RTT) and ASD with seizures (80% in the RTT and 10–25% in ASD). Moreover, 15–30% of children diagnosed with epilepsy are co-morbid with ASD (Berg et al., 2011; Tuchman and Rapin, 2002).
RELN is an important developmental molecule that provides a stop signal during radial migration in the cortex (D’Arcangelo et al., 1995). In the adult rodent and human, RELN is expressed in various GABAergic neurons in the outer layers of the cortex and in glutamatergic neurons in the CB. Upon secretion, RELN binds to members of the low density lipoprotein receptor gene family, very low density lipoprotein receptor and apolipoprotein E receptor 2 (Trommsdorf et al., 1999), and is thought to play a role in synaptic plasticity. In addition, RELN interacts with α3β1 integrins, components of dendritic spine post-synaptic densities of cortical pyramidal neurons where it is associated with activation of activity-regulated cytoskeleton-associated protein synthesis (Arc) (Dong et al., 2003). RELN mRNA and protein has been shown to be down-regulated along with other GABAergic genes in schizophrenia (Impagnatiello et al., 1998; Guidotti et al., 2000) and ASD (Fatemi et al. 2002; Fatemi et al. 2009a).
We have previously examined epigenetic mechanisms (promoters methylation and hydroxymethylation) involved in the regulation of GABAergic genes (GAD1, GAD2, and RELN) expression in the CB of ASD subjects (Zhubi et al; 2014b). In brains of patients with major neuropsychiatric disorders, changes in DNA methylation and hydroxymethylation of GABAergic, glutamatergic, synaptic plasticity, and inflammatory genes are mediated through changes in DNMT and TET enzyme levels and activities (Grayson and Guidotti, 2013, 2016).
DNA methylation at the fifth position of cytosine (5mC) is a process initiated and maintained by DNMTs. 5mC can be oxidized by members of the TET methylcytosine dioxygenase enzyme family (TET1, 2, 3) to 5hmC, 5-formylcytosine (5fC) and 5-carboxylcytosine (5caC). 5fC/5caC can be excised by thymine-DNA glycosylase (TDG) and members of the base excision repair (BER) pathway. In general, 5mC at promoter regions is associated with gene repression, while 5hmC at gene regulatory regions, including enhancers and promoters, positively correlates with transcription (Grayson and Guidotti, 2013). Many of the epigenetic proteins, including methyl CpG binding proteins, DNMT1, and the TET (1–3) proteins, also bind DNA where they act in repressing transcription. We previously established that 5hmC is enriched (relative to 5mC) at specific regulatory domains of GAD1 and RELN in CB of ASD patients. (Zhubi et al., 2014b).
We (Matrisciano et al. 2013; Dong et al. 2016, Labouesse et al. 2017), and others (Richetto et al 2017) have shown that behavioral (social interaction deficits, fear conditioning, anxiety, stereotype behavior) and molecular (methylation related epigenetic modifications at GABAeric genes), endophenotypes similar to the behavioral and molecular endophenotypes present in ASD patients, were found to be present in mice exposed in utero to stress, infection, toxins, or drugs that interfere with chromatin remodeling. In addition, in these mice, similar to ASD patients, there is increased binding of MECP2 to the GAD1 and RELN promoters and reduced expression of the corresponding mRNAs.
The current study is a continuation of this research into epigenetic mechanisms operative in ASD, but focusing on prefrontal cortical tissue (BA9 and 10). We now report results on increases in the binding of MECP2 and DNMT1 to the promoter domains of GAD1 and RELN in the prefrontal cortex of ASD. We also demonstrate that the 5mC and 5hmC content at the corresponding promoter regions are either lower or do not change, respectively. Furthermore, increased levels of TETs 1, 2, and 3 mRNAs and decreased levels of DNMT1 mRNA are associated with an overall shift towards hydroxymethylation (5hmC/5mC ratio) in the promoter regions of GAD1 and RELN.
2. Methods
2.1. Frontal cortex cohort and demographic information
For this study, we obtained fresh-frozen FC tissue from Harvard Brain Tissue Resource Center at McLean Hospital in Belmont, MA, with approval of Autism Speaks (Autism Tissue Program). Tissue blocks from dorsolateral prefrontal cortex regions (BA9 and BA10) of 10 CON and 8 ASD were obtained and maintained frozen at −80 °C. Based on the available neuropathology reports at the level of where surfaces were cut, there were no signs of infarction, hemorrhage or inflammatory lesions, with the exception of one ASD subject, which had a large early intermediate stage infarct. Subjects were matched for age, sex, PMI and brain mass. For detailed demographic characteristics of this cohort, please refer to Supplemental Fig. 1. Subjects diagnosed with Asperger’s syndrome, Fragile–X syndrome, RTT, pervasive developmental disorder not otherwise specified, or 15q11–q13 duplication were not included in this cohort. Additionally, all CON (typically developed) subjects were free of neurological disorders (e.g. seizures, mental retardation, dementia, etc.), and psychiatric disorders (schizophrenia, bipolar disorder, unipolar depression, substance abuse, etc.) based on medical records.
2.2. RNA isolation and quantification of mRNA using real-time PCR
RNA was extracted and purified using the RNeasy kit (Qiagen, Valencia, CA). RNA concentration determinations were performed using a Qubit (New York, NY) as described by the manufacturer. RNA integrity numbers were measured for each sample with the Agilent 220 TapeStation (Santa Clara, CA). mRNAs corresponding to DNMT1, MECP2, BDNF, TET1, TET2, TET3, GAD1, GAD2, RELN, OXTR, GABRB3 were measured following reverse transcription using an MXP3005 qPCR machine (Agilent, Santa Clara, CA). β-Actin (ACTB) and glyceraldehyde-3-phosphate dehydrogenase (GAPDH) were used as internal controls for sample normalization as previously described (Zhubi et al., 2014b). The primers used for gene-specific amplification are reported in Supplementary Fig. 2. The analysis of each target RNA was run in duplicate and the two housekeeping genes were run in parallel. Values were calculated as relative abundance to the mean of the two housekeeping genes after normalization. The GAPDH mRNA levels did not vary considerably from sample to sample. mRNA levels are reported relative to GAPDH mRNA to be consistent with our previous study (Zhubi et al., 2014b). Moreover, GAPDH was deemed a suitable reference gene for qRT-PCRstudies of a series of post-mortem brain samples from psychiatric subjects (Abasolo et al., 2011).
We determined the quality of RNA isolated from our samples by measuring RNA integrity numbers (RIN) (see Supplementary Figure 2). The RINs varied from 5.3 to 7.9 and were not different between groups. RINs below 5.0 may underestimate the amount of specific mRNA for amplicons greater than 400 bp in length (Fleige and Pfaffl, 2006). The mean RIN value measured for each group in our study was 6.26 ± 0.26 (CON) and 6.67 ± 0.32 (ASD). Moreover, each mRNA amplicon measured was approximately 200 bp in length.
2.3. DNA regions in the RELN, GAD1 and GAD2 examined by ChIP, MeDIP and hMeDIP
We had previously carried out transient transfection studies to examine functional regions of the RELN (Chen et al., 2002) and GAD1 (Chen et al., 2011) promoters. The gene body regions were chosen downstream of the start site and so as to provide similar CpG densities across each amplicon. With respect to the RNA start site, the RELN promoter extended from −220 to +70 bp and the gene body was from +562 to +763 bp. The GAD1 promoter was from −55 to +122 bp and the body region was from +656 to +856 bp. The GAD2 promoter extended from −1501 to −1310 bp and the corresponding gene body was from +1293 to +1447 bp. The locations of each region relative to the corresponding gene are shown in Supplementary Fig. 3.
2.4. Chromatin immunoprecipitation assays
We performed ChIP assays based on a previously described protocol (Chen et al., 2002). In brief, tissue was homogenized and crosslinked with paraformaldehyde (1% final). Crosslinking was stopped after seven min by the addition of 0.125 M glycine. Nuclei were isolated and chromatin was fragmented with a M220 Sonicator (Covaris, Woburn, MA). Chromatin was immunoprecipitated using antibodies against DNMT1 (Novus Biologicals, Littleton, CO) and MECP2 (Diagenode, Denville, NJ). The immunoprecipitates were washed and collected using protein A/G coupled magnetic beads (Millipore, Billirica, MA). The amount of immunoprecipitated DNA was determined by q-PCR using primers specific to each gene of interest. Both DNMT1 and MECP2 antibodies were ChIP-grade and were tested in house using Western blot and antigen blocking experiments.
ChIP data are calculated relative to the amount of each gene present in the input DNA. The percentage of immunoprecipitated DNA was calculated using the following: % (gene−IP/total input)=2(Ct(10% input)−3.32)−Ct(gene−IP) × 100%. The use of antibodies against MECP2, TET1 (Zymo, Irving, CA, USA), and DNMT1 (Abcam, Cambridge, MA) were previously described (Zhubi et al., 2014b). TET2 and TET3 antibodies were monoclonal and obtained from Zymo, Irving, CA.
2.5. Methyl and hydroxymethyl DNA immunoprecipitation (MeDIP and hMeDIP)
MeDIP/hMeDIP experiments were performed as previously described (Zhubi et al., 2014b) using 5-mC and 5-hmC monoclonal antibodies on immobilized magnetic beads (Diagenode, Denville, NJ, USA). In brief, the protocol we followed is similar to that outlined above for the ChIP assays except that we used DNA isolated from tissue as a template for immunoprecipitation. Following DNA isolation, DNA shearing is performed as described above. 5mC and 5hmC are immunoprecipitated using antibodies specific to these modifications. The antibodies are well characterized and do not show detectable cross reactivity based on in house testing with artificially methylated and hydroxymethylated templates. After immunoprecipitation, washing and release from the beads, the amount of DNA was quantified using Qubit. Gene specific amplification was used to measure the extent of modification using qPCR. The percent methyl- or hydroxymethyl- DNA/input DNA was calculated as described for ChIP and is expressed relative to input.
2.6. Statistical analysis
All statistical analyses were performed with IBM SPSS statistics 22 as previously described (Zhubi et al., 2014b). Distributions for all dependent variables were examined by Kolmogoroz-Smirnov test of normality. The results suggest a normal distribution of the data allowing parametric analyses. Statistical differences between groups (CON and ASD) for each measurement (mRNA, protein, ChIP, hMeDIP and MeDIP assays) were determined by Analyses of Variance (ANOVA) with statistical significance set at p < 0.05. Analysis of Covariance (ANCOVA), controlling for scale (age, PMI, RIN, pH, brain mass) and categorical variables (presence of medication, type of medication, sex) on dependent measures. Relationships between variables were analyzed for Pearson correlations. Two-sided probability levels were used for statistical significance (**p < 0.001, *p < 0.05), or trends (0.05 < p < 0.1).
3. Results
3.1. Analysis of candidate gene mRNA levels in the FC (BA 9/10) of ASD and CON
We measured the mRNA levels corresponding to genes expressed in GABAergic and glutamatergic neurons (RELN, GAD1, GAD2, GABRB3, BDNF-IV, BDNF-IX), and to the oxytocin receptor (OXTR) using qRT-PCR.
We detected a statistically significant reduction in the mRNA levels encoding RELN (53%) and GAD1 (75%) (Fig. 1), when expressed relative to the levels of GAPDH mRNA. In contrast, the amounts of mRNA encoding GABRB3, GAD2, BDNF-IV, BDNF-IX, BDNF-Tot, and OXTR mRNAs did not show statistically significant differences in RNA isolated from the FC of ASD compared to CON (Table 1).
Fig. 1. GAD1 and RELN mRNA levels in ASD vs. CON FC.
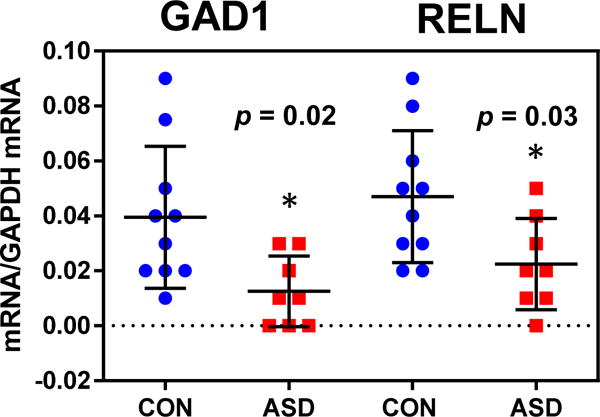
GAD1 (left) and RELN (right) mRNA levels were measured by qRT-PCR. Individual data points are represented relative to the levels of GAPDH determined in parallel. The mean ± standard deviation are indicated. ANOVA indicated that both GAD1 (F1,16 = 5.85, p = 0.02) and RELN (F1,16 = 5.85, p = 0.03) mRNAs were different from controls. * indicates statistically significant differences (p < 0.05).
Table 1.
mRNA Content* in ASD vs. CON Frontal Cortices
| mRNAs | Means: CON vs ASD | One way ANOVA |
|---|---|---|
|
| ||
| RELN | 0.040 ± 0.0081 vs 0.0125 ± 0.0045 | F(1, 16) =5.85, p = 0.03 |
|
| ||
| GAD1 | 0.0470 ± 0.0076 vs 0.022 ± 0.006 | F(1, 16) = 5.85, p = 0.02 |
|
| ||
| GABRB3 | 0.020 ± 0.003 vs 0.010 ± 0.003 | F(1,16) = 7.92, p = 0.12 |
|
| ||
| GAD2 | 0.017 ± 0.005 vs 0.010 ± 0.005 | F(1,16) = 1.73, p = 0.21 |
|
| ||
| BDNF IV | 0.001 ± 0.001 vs 0.001 ± 0.001 | F(1,16) = 0.31, p = 0.69 |
|
| ||
| BDNF IX | 0.002 ± 0.001 vs 0.002 ± 0.001 | F(1,16) = 0.042, p = 0.62 |
|
| ||
| BDNF Total | 0.0620 ± 0.021 vs 0.040 ± 0.13 | F(1,16) = 0.61, p = 0.45 |
|
| ||
| OXTR | 0.010 ± 0.005 vs 0.009 ± 0.002 | F(1,16) = 0.047, p = 0.83 |
|
| ||
| MECP2 | 0.034 ± 0.01 vs 0.031 ± 0.01 | F(1,16) = 0.084, p = 0.78 |
|
| ||
| DNMT1 | 0.020 ± 0.0017 vs 0.015 ± 0.0012 | F(1,16) = 1.56, p = 0.23 |
|
| ||
| TET1 | 0.0078 ± 0.0014 vs 0.013 ± 0.0017 | F(1,16) = 5.11, p = 0.04 |
|
| ||
| TET2 | 0.065 ± 0.010 vs 0.14 ± 0.036 | F(1,16) = 5.18, p = 0.02 |
|
| ||
| TET3 | 0.013 ± 0.0034 vs 0.034 ± 0.0093 | F(1,16) = 5.21, p = 0.03 |
mRNA levels are expressed relative to GAPDH as described in the Methods
To study whether the reduced amount of GAD1 and RELN mRNAs in the FC of ASD might be related to alterations in the levels or binding of DNA repressor proteins, we measured the levels of mRNAs encoding MECP2 and the enzymes DNMT1, TET1, 2, and 3. DNMT family members methylate 5C but also bind and occupy unmethylated DNA through an interaction with their –CXXC- domains (Grayson and Guidotti, 2013). In addition, the TET 1–3 proteins convert 5mC to 5hmC, and then to 5fC or 5caC (Grayson and Guidotti, 2016). TETs 1 and 3 also bind DNA through similar -CXXC- domains. MECP2 binds DNA through its methyl DNA binding domain. We detected a down-regulation of the mRNA level corresponding to DNMT1 (Fig. 2), one of the enzymes important for DNA methylation, although this did not reach significance. No changes were detected in the levels of MECP2 mRNA either (Table 1). In contrast, the mRNA levels of TETs 1 (73%), 2 (180%), and 3 (160%) were significantly increased in the FC of ASD as compared with CON (Fig. 2).
Fig. 2. mRNA levels corresponding to several epigenetic proteins in ASD vs. CON FC.
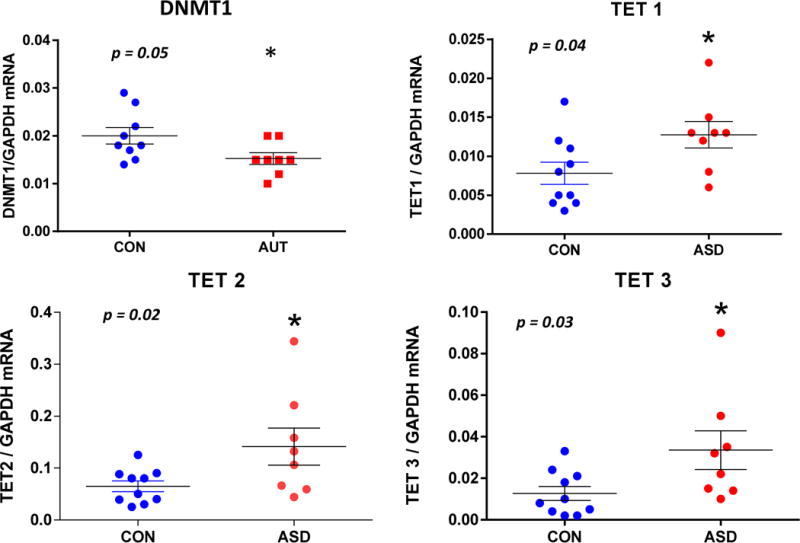
The levels of the indicated mRNAs were determined by qRT-PCR as described in the Methods. All mRNA data are expressed relative to GAPDH. Two way ANOVA was used for statistical analyses of the data. While DNMT1 mRNA (F1,16 = 1.56, p = 0.23) was not significantly different from CON, TET1 (F1,16 = 5.11, p = 0.04), TET2 (F1,16 = 5.18, p = 0.02), and TET3 (F1,16 = 5.21, p = 0.03) were significantly (2–3 fold) increased. * indicates statistically significant differences (p < 0.05).
3.2. MECP2, and DNMT1 binding to GAD1, GAD2 and RELN in CON and ASD
We next determined the levels of binding of MECP2, and DNMT1 to the RELN, GAD1, and GAD2 gene promoters using tissue from the FC of ASD and CON samples by ChIP assays. Analysis of the immunoprecipitated DNA using qPCR showed that MECP2 binds significantly more (1.5–2 fold) to the promoters of GAD1 ((F1,18 = 10.23, p = 0.005), GAD2 (F1,18 = 10.94, p = 0.005) and RELN (F1,18 = 18.5, p = 0.001) in the FC of ASD as compared to CON (Fig. 3). In contrast, MECP2 binding to the corresponding gene body regions of RELN, GAD1 and GAD2 failed to show significant differences in the FC of ASD compared with CON (RELN (F1,17 = 0.89, p > 0.10), GAD1 (F1,17 = 0.89, p > 0.10) and GAD2 (F1,17 = 0.71, p > 0.10)).
Fig. 3. MECP2 and DNMT1 binding to the RELN, GAD1, and GAD2 promoter regions as determined by ChIP.
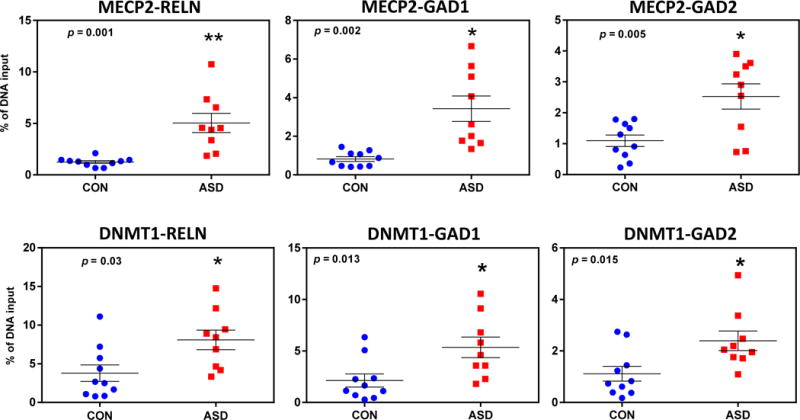
ChIP was used to determine the extent of MECP2 (top panels) and DNMT1 (bottom panels) binding to the RELN (−220 to +70 bp), GAD1 (−55 to +122 bp), and GAD2 (−1501 to −1310 bp) promoter regions as described in Methods. The amount of MECP2 binding to each promoter (RELN, F1,17 = 18.74, p < 0.001; GAD1, F1,17 = 10.23, p = 0.005; GAD2, F1,17 = 10.94, p = 0.004) are significantly increased in the ASD subjects. In addition, DNMT binding to the indicated promoters (RELN, F1,17 = 6.68, p = 0.028; GAD1, F1,17 = 9.46, p = 0.007; GAD2, F1,17 = 7.36, p = 0.015) in ASD were all significantly increased relative to the CON group. * indicates statistically significant differences (p < 0.05). Two way ANOVA was used for statistical evaluation of the data.
A similar pattern was observed with DNMT1 protein binding to these selected regulatory regions. In the ASD samples, DNMT1 binds significantly more to the promoter regions of GAD1 (F1,18 = 9.47, p=0.007), GAD2 (F1,18 = 7.36, p= 0.015) and RELN (F1,18 = 6.68, p =0.028) compared to CON (Fig. 3). In contrast, DNMT1 binding to RELN, GAD1 and GAD2 body regions failed to show significant differences in ASD compared to CON (RELN (F1,17 =, p > 0.10), GAD1 (F1,17 =, p > 0.10) and GAD2 (F1,17 =, p > 0.10)). Measurements of human DNMTs 1, 3a, and 3b mRNAs have shown that the expression of DNMTs do not change with age (Colantuoni et al. 2011, http://braincloud.jhmi.edu/). The age range in our cohort varies from 16 to 60 years. Consistent with this report, we did not find any effect of age on diagnosis when analyzed by ANCOVA.
Interestingly, when we used ChIP to measure the binding of TETs -1, -2, and -3 to the promoter and gene body regions of GADs 1, 2 and RELN, no significant changes in binding of any of the TET proteins to the promoter or gene body regions of GADs 1, 2 or RELN were detected. 3.3. Comparison of 5-mC and 5-hmC enrichment in the promoter and gene body regions of GAD1, GAD2 and RELN
In order to better understand how the increased levels of MECP2 and DNMT1 binding to the GAD1, 2, and RELN promoters relate to methylation levels, we measured the amounts of 5mC and 5hmC in the same DNA regions. As shown in Fig. 4 (5mC-top), there is a trend towards 5mC depletion for GAD1 and no change in the levels of 5mC at the RELN and GAD2 promoters of ASD compared to CON. With respect to the 5hmC measurements (Fig. 4, bottom), there was no change in 5hmC level for any of these promoters. When these findings were expressed as a ratio of 5-hmC/5-mC (Fig. 5 top), the data show a statistically significant (F1,18 = 4,55, p=0.05) increase at the promoter region of GAD1 and a trend towards significance for RELN (F1,18 = 4.2, p=0.06). These data suggest a shift in the equilibrium towards hydroxymethylation in the ASD FC which is likely driven by the decreased steady state amounts of 5mC present in the promoter regions. Furthermore, when these measurements were conducted on the corresponding gene body regions of GAD1 and RELN, there were no significant differences between the ASD and CON samples (Fig. 5, bottom).
Fig. 4. The 5mC and 5hmC content of the RELN (−220 to +70 bp), GAD1 (−55 to +122 bp), and GAD2 (−1501 to −1310 bp) promoters.
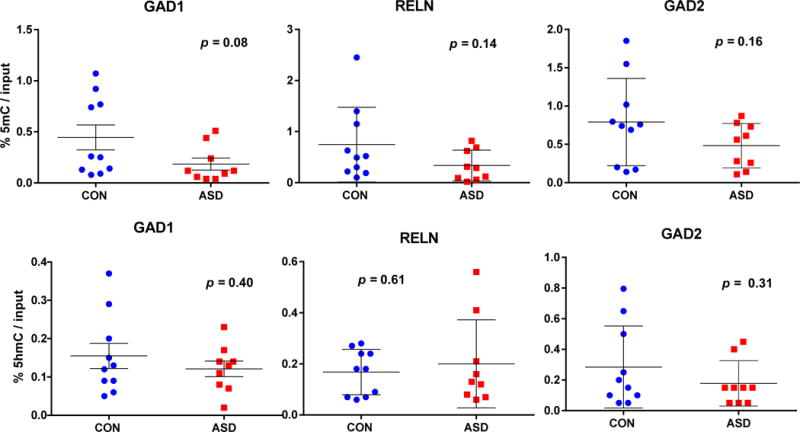
The 5mC (top panels) and 5hmC (bottom panels) content at each promoter fragment was measured using MeDIP and hMeDIP respectively. The differences in 5mC content at the RELN and GAD2 promoters were not significant (RELN, F1,17 = 2.43, p = 0.14; GAD2, F1,17 = 2.15, p = 0.16), although the values for GAD1 (F1,17 = 3.46, p = 0.08) trended towards a decrease relative to CON. In contrast, 5hmC content at each promoter was not significantly different between ASD and CON FC: GAD1, F1,17 = 0.73, p = 0.40; RELN, F1,17 = 0.268, p = 0.61; GAD2, F1,17 = 1.12, p = 0.31). There were no significant differences in 5mC and 5hmC content in the RELN (+562 to +763 bp), GAD1 (+656 to +856 bp) or GAD2 (+1293 to +1447 bp) gene body regions (see Supplementary Figure 1 for regions amplified). Two way ANOVA was used for statistical evaluation of the data. * indicates statistically significant differences (p < 0.05).
Fig. 5. The 5hmC to 5mC ratio at the RELN and GAD1 promoters and gene body regions.
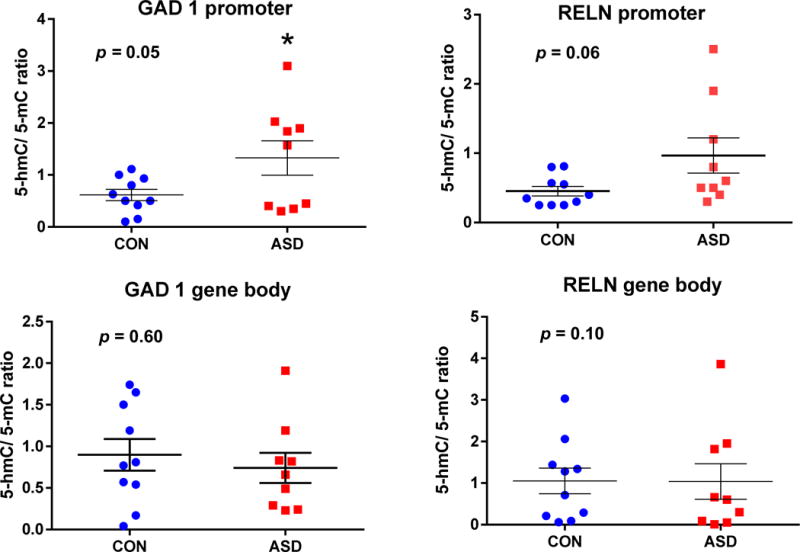
Previous studies have suggested that the ratio of 5hmC to 5mC ratio might be a better indicator of transcriptional activity at sites containing 5hmC and 5mC (4). When the 5mC and 5hmC data are expressed as a ratio, there is a significant increase in 5hmC/5mC for the GAD1 (F1,17 = 4.55, p = 0.05) promoter in ASD subjects (Fig. 5A). The RELN promoter ratio (F1,17 = 4.19, p = 0.06) trended towards significance (i.e. p < 0.1). In contrast, there were no differences between ASD and CON in the 5hmC/5mC ratio corresponding to either the GAD1 (F1,17 = 0.36, p = 0.60) or RELN (F1,17 = 0.001, p = 0.10) gene body regions (Fig. 5B). Two way ANOVA was used for the statistical evalevaluation of the data. * indicates statistically significant differences (p < 0.05).
3.4. Confounding variables
Further statistical analyses were conducted to determine the impact of confounding variables in the various mRNA measures, methylation and hydroxymethylation levels, and binding of MECP2 and DNMT1 to the assorted promoters and gene bodies. As indicated in Supplementary Fig. 1, average values for the confounding variables (sex, age, brain mass, PMI, RIN, and pH) showed no significant differences between CON and ASD groups. Ethnicity was a confounding variable for which we had insufficient information for testing. This was particularly the case in the CON group (see ethnicity, Supplementary Fig. 2). Results from ANOVA suggested possible interactions between PMI and GAD1, and GAD2 mRNA levels and also with the amount of DNMT1-binding to the RELN promoter. However, ANCOVA with PMI as covariate did not reveal a statistically significant correlation between PMI and GAD1 mRNA (F1,16 = 3.3, p = 0.092); GAD2 mRNA (F1,16 = 0.135, p = 0.72); or DNMT1-RELN binding (F1,17 = 3.56, p = 0.08). In addition, sex was also indicated as a potential confounder with the levels of BDNF-total mRNA and also the levels of 5hmC/5mC ratio in the GAD1 gene body. ANCOVAs revealed that the effect of sex remained significant for both BDNF-total mRNA (F1,17 = 10.73, p=0.005) and the GAD1-5hmC/5mC gene body ratio (F1,18 = 6.56, p= 0.021).
We found no differences in MECP2 and DNMT1 binding between ASD subjects who were treated (antipsychotics, antidepressants or mood stabilizers (n=7)), duration of treatment, and the few ASD (n=3) that were apparently un-treated at time of death. Hence, the study shows that a diagnosis of ASD is a significant indicator of increased MECP2 binding to the GAD1 and RELN promoters in cerebral cortex of ASD patients.
3.5. Pearson correlations
As indicated in the Statistical Analyses section of the Methods, we also analyzed our data for Pearson correlations between variables. Some of these correlations are suggestive. For example, the levels of GAD1 mRNA are inversely correlated with the amount of MeCP2-GAD1 promoter binding (r = −0.530, p = 0.024). Similarly, the amount of 5mC present in the GAD1 promoter correlates with the levels of DNMT1 mRNA (r = 0.487, p = 0.007). Interestingly, the amount of TET2 mRNA correlates with the hmC/mC ratio in the GAD1 promoter. One of the stronger correlations observed was between the amount of DNMT1 binding to the RELN promoter and the amount of DNMT1-binding to the GAD1 promoter (r = 0.753, p < 0.001).
4. Discussion
The overall goal of our studies is to elucidate epigenetic mechanisms associated with the pathogenesis of ASD. The objective of this approach is to provide a better understanding of the epigenetic landscape in multiple brain areas of idiopathic ASD. The current study represents a continuation of our previous research carried out using post-mortem CB of idiopathic ASD subjects (Zhubi et al., 2014b). Specifically, we have focused on the dynamics of DNA methylation marks in GABAergic target genes that are believed to contribute to their transcriptional regulation in the FC (BA9/10) of ASD subjects. Interestingly, results from both brain areas show overlapping conceptual similarities regarding the regulation of genes (RELN, GAD1, etc.) which are relevant to appreciating GABAergic influences contributing to ASD pathogenesis. However, we observed brain region-specific regional differences in these epigenetic processes as well.
We examined the expression of a series of target genes, some of which are genetically associated with ASD, for changes related to epigenetic mechanisms in the FC of ASD and CON. We detected a decrease in the mRNAs corresponding to RELN and GAD1 in FC of ASD brain. In addition, we failed to detect a decrease in the levels of the GABAA β3 receptor subunit mRNA, which has long been implicated as a susceptibility factor associated with both ASD and epilepsy (Kang et al., 2013). We also failed to detect a significant difference in the expression of OXTR in ASD FC even though it has been shown to be linked both genetically and epigenetically to ASD (Gregory et al., 2009; Harrison et al., 2015; King et al., 2015). In addition, the mRNA levels of BDNF-IV, -IX, and -Total, and GAD2 were unchanged in our post-mortem ASD FC with respect to typically developed subjects. We also analyzed the expression of mRNAs encoding various epigenetic proteins. Our results showed that while the mRNAs encoding DNMT1 and MECP2 did not change, expression of TET proteins 1, 2, and 3, were all increased in the FC of ASD subjects. We had previously demonstrated that TET1 was increased in the CB of ASD subjects (Zhubi et al., 2014b). Interestingly, another study (James et al., 2014) replicated our previous findings of increased TET proteins in the CB of ASD subjects.
We systematically compared our data between FC and CB to look for significant correlations between the data sets corresponding to these two brain regions. Table 3 provides a summary of the findings from both studies with respect to specific measures and brain areas studied. While a number of correlations between our data sets were identified, there were several comparisons that were different. For example, while MECP2 mRNA is increased in CB of ASD subjects, mRNA levels are not different in ASD FC. DNMT1 and MECP2 promoter binding increased in FC, while only MECP2 changed in CB. Moreover, the hmC/mC ratio was a true reflection of increased 5hmC in CB but the increased ratio in FC was driven largely by reduced levels of 5mC. The one exception to the lack of correlations was the finding that RELN promoter 5hmC content in the FC negatively trended with the RELN promoter 5hmC in the CB (r = −0.487, p = 0.066). Regarding the methylation data, a recent comparison of genome-wide methylation in different cortical areas and the CB showed that cerebellar methylation data is a consistent outlier when compared with all other brain regions (Illingworth et al., 2015).
Of particular interest in the current study is the finding that the binding of MECP2 and DNMT1 to the GAD1 and RELN promoters was approximately two fold higher in ASD FC as compared with controls. The increased binding of MECP2 to these promoters is not explained by altered levels of DNA methylation in these promoter regions as the levels of 5mC at these promoters is reduced. Additional factors, that may play a role in MeCP2 binding is phosphorylation. Alternatively, additional methyl domain containing proteins, such as MBD2, bind to MECP2, and restrict access of other proteins like TET1 to the promoter DNA (Ludwig et al., 2016). Other factors such as neuron-restrictive silencing factor (REST), may play a role in determining the binding specificity of MECP2 in neurons and non-neuronal cells (Zhao et al., 2017).
In the CB, we also showed increased binding of MECP2 to the RELN and GAD1 promoters but did not detect a difference in DNMT1 binding to these same regions (Table 2). There were no significant differences in binding of any of the TET proteins at either promoter as well. The increased amounts of TET1-3 mRNA expression suggests that there may be less 5mC content due to increased TET-mediated hydroxymethylation along with additional oxidation intermediates (Wen et al., 2014). Since we did not measure the levels of additional intermediates in the TET cascade such as fC or caC, we do not know if the loss of 5mC is due to its conversion to additional oxidative intermediates or is ultimately the result of DNA demethylation. Alternatively, the reduced 5mC content may be the result of reduced DNMT1-mediated DNA methylation.
Table 2.
Comparison of results obtained in different ASD brain regions relative to CON
| Measure | Frontal Cortex* | Cerebellum** |
|---|---|---|
| RELN mRNA | ↓ | ↓ |
| GAD67 mRNA | ↓ | ↓ |
| Dnmt1 mRNA | ↓ | n.m. |
| MeCP2 mRNA | n.c. | ↑ |
| TET1 mRNA | ↑ | ↑ |
| TET2 and TET3 mRNA | ↑ | n.m. |
| DNMT1 binding | ↑ | n.c. |
| MECP2 binding | ↑ | ↑ |
| 5mC | ↓ | n.c. |
| 5hmC | n.c. | ↑ |
| 5hmC/5mC | ↑ | ↑ |
Data are from current manuscript.
Data are from Zhubi et al., 2014b.
n.m. = not measured
n.c. = no change relative to CON
In addition, the shift towards the higher 5hmC/5mC ratio, while driven primarily by the reduction in 5mC levels in the promoter regions of RELN and GAD1, is indirectly supported by findings of elevated TET1, TET2, and TET3 in ASD FC as compared to CON. In the CB, we observed comparable 5mC content in the RELN and GAD1 promoters of both ASD and typically developed subjects (CON). In contrast, the 5hmC content proximal to the GAD1 and RELN promoters was increased in ASD CB. In both CB and FC, the ratio of 5hmC to 5mC is increased at the GAD1 and RELN promoters which was previously suggested to facilitate transcription (Mellén et al., 2012). However, more recent data indicate that MECP2 does not bind 5hmC (Gabel et al., 2015). In this latter study, the authors argue against a role for MECP2 binding to 5hmC and regulating transcription. It appears that the main determinant down-regulating the expression of these two promoters in the CB is the increased MECP2 binding to the respective promoter re gions. In FC, the mRNA down-regulation observed is accompanied by increased binding of both DNMT1 and MECP2 to the corresponding promoters. This suggests the possibility that DNMT1 is an additional factor that governs MECP2 binding to DNA in different brain structures or cell types. Moreover, it appears that the DNMT1-MECP2 complex has the capability of binding to DNA that contains reduced amounts of DNA methylation.
Transcriptome studies of ASD post-mortem brain tissue suggest that large numbers of mRNAs are mis-regulated as compared with matched typically developed subjects (Voineagu et al., 2011; Gupta et al., 2014; Ellis et al., 2016; Gokoolparsadh et al., 2016; Parikshak et al., 2016). Increasing evidence points to a complex interaction between the genome and the environment in a variety of psychiatric/neurological conditions including ASD (Ciernia and LaSale, 2016; Grayson and Guidotti, 2016). Because of this, both the ASD genome and epigenome are heterogeneous which could account for some of the transcriptome variability observed among patients. However, what is emerging from ongoing mechanistic studies across the world is that the pathophysiology of ASD may converge on common biological pathways (Williams and Casanova, 2011; Casanova, 2014; Ansel et al., 2017). The scope of our study was designed to provide information regarding epigenetic marks located at several genes down-regulated in ASD PFC. Our data support the view that aberrant DNA modifications and the binding of epigenetic proteins to selected promoters contributes to transcriptional changes observed in ASD brain. By comparing findings from both PFC and CB, we see that similar mechanisms appear to be operating in different brain regions. These studies need to be replicated in a larger ASD cohort to appreciate the extent to which these findings are critical to establishing the ASD phenotype.
1.1. Limitations of the current study
A major limitation of the current study is the number of subjects in our post-mortem brain cohort. With the sample size of 10 (CON) and 8 (ASD) there is reduced statistical power of detecting a true effect or an effect that may generalize across a study with a larger sample size (Button et al., 2013). A second limitation of our study is that we have chosen to study epigenetic changes at a selected group of candidate genes rather than taking a global unbiased epigenomics approach. We chose to study a number of candidate genes because of our long-standing interests in the relevance of RELN, GAD1, and GAD2 to the etiology of psychiatric disorders. Focusing on these genes allowed us to use our expertise in epigenetics to examine the regulation of these genes in post-mortem human tissue samples. While this approach allows us to infer some conclusions regarding the regulation of these genes, it does not permit us to conclude that these mechanisms are more generally operating abnormally in ASD vs. CON subjects. A third limitation of our study is that while we measured the levels of 5mC and 5hmC, we did not measure additional TET-oxidation products such as 5fC and 5caC. While these oxidation products are considerably less abundant than 5mC or 5hmC, they may provide information regarding additional intermediates in the DNA demethylation cascade. Another limitation of our study is the broad range of ages represented in our post-mortem cohort. While the levels of DNMT and TET mRNAs change little over age in the human PFC (Colantouni et al., 2011), these have not been measured in the ASD brain.
5. Conclusions
In the current study, we demonstrate that the mRNAs corresponding to the GABAergic-related mRNAs RELN and GAD1 are down-regulated in the FC of idiopathic ASD subjects relative to typically developed controls. In addition, the mRNAs encoding the epigenetic proteins TETs-1, -2, and -3 were increased, DNMT1 was decreased while MECP2 was unchanged. We demonstrate that both MECP2 and DNMT1 protein binding to the RELN and GAD1 promoters is increased in the FC of ASD subjects. Moreover, it seems likely that this increased binding may account for the decreased expression of both genes in ASD. Analysis of the levels of 5mC and 5hmC in the MECP2 and DNMT1 binding regions do not account for this increased binding. Data presented in the current manuscript are compared with similar findings described in a previous paper (Zhubi et al., 2014b) using the same cohort of ASD and CON subjects.
Supplementary Material
Highlights.
In the present study, we compared a small group of control or normal developed (N=10) and ASD (N=8) frontal cortices for the expression of specific mRNAs. The mRNA levels corresponding to RELN and GAD1 were down-regulated while TETs 1, 2, and 3 were up-regulated relative to normal developed subjects. There were no changes in DNMT1 or MECP2 mRNA levels.
We determined that there was increased binding of DNMT1 and MECP2 to the corresponding promoters of RELN, GAD1, and GAD2 in ASD subjects.
Analysis of the levels of 5mC and 5hmC in the MECP2 and DNMT1 binding regions of these promoters do not account for the increased binding at the RELN and GAD1 promoters.
These data are discussed in the context of a similar study carried out using the cerebella from the same cohort of normal developed and ASD subjects.
Acknowledgments
The authors would like to acknowledge the Autism Tissue Program and the Harvard Brain Tissue Resource Center for providing human brain tissue samples. The authors would also like to thank the families for their sacrifice and contribution to the research.
Funding
This work was supported in part by grants P50 AA022538 to AG and DRG and NIH 5R01 MH093348 and R01 MH101043 to AG. The Harvard Brain Tissue Resource Center is supported in part by NIH R24 MH-068855.
Abbreviations
- 5fC
5-formylcytosine
- 5caC
5-carboxycytosine
- 5mC
5-methylcytosine
- 5hmC
5-hydroxymethylcytosine
- ACTB
b-actin
- ASD
autism spectrum disorder
- BA
Brodmann area
- BDNF
brain derived neurotrophic factor
- BDNF
brain derived neurotrophic factor
- BDNF-IV
BDNF-promoter 4
- BDNF-IX
BDNF-promoter 9
- BDNF-Tot
BDNF-total
- CB
cerebellum
- ChIP
chromatin immunoprecipitation
- CON
controls (typically developed subjects)
- DNMT1
DNA methyltransferase 1
- FC
frontal cortex
- GABA
gamma-aminobutyric acid
- GAPDH
glyceraldehyde-3-phosphate dehydrogenase
- GABRB3
gamma-aminobutyric acid receptor b3
- GAD1
glutamate decarboxylase 67
- GAD2
glutamate decarboxylase 65
- hMeDIP
hydroxymethyl DNA immunoprecipitation
- IP
immunoprecipitation
- MECP2
methyl CpG binding protein 2
- MeDIP
methyl DNA immunoprecipitation
- OXTR
oxytocin receptor
- qRT-PCR
quantitative reverse transcription polymerase chain reaction
- RELN
reelin
- REST
Neuron restrictive-silencing factor
- RETT
Rett Syndrome
- TET
Tet methylcytosine dioxygenase
Footnotes
Publisher's Disclaimer: This is a PDF file of an unedited manuscript that has been accepted for publication. As a service to our customers we are providing this early version of the manuscript. The manuscript will undergo copyediting, typesetting, and review of the resulting proof before it is published in its final citable form. Please note that during the production process errors may be discovered which could affect the content, and all legal disclaimers that apply to the journal pertain.
References
- Abasolo N, Torrell H, Roig B, Moyano S, Vilella E, Martorell L. RT-qPCR study on post-mortem brain samples from patients with major psychiatric disorders: reference genes and specimen characteristics. J Psychiatr Res. 2011;45(11):1411–8. doi: 10.1016/j.jpsychires.2011.06.001. [DOI] [PubMed] [Google Scholar]
- Ansel A, Rosenzweig JP, Zisman PD, Melamed M, Gesundheit B. Variation in Gene Expression in Autism Spectrum Disorders: An Extensive Review of Transcriptomic Studies. Front Neurosci. 2017;10:601. doi: 10.3389/fnins.2016.00601. [DOI] [PMC free article] [PubMed] [Google Scholar]
- Ben-Ari B. Is birth a critical period in the pathogenesis of autism spectrum disorders? Nat Rev Neurosci. 2015;16(8):498–505. doi: 10.1038/nrn3956. [DOI] [PubMed] [Google Scholar]
- Berg AT, Plioplys S, Tuchman R. Risk and correlates of autism spectrum disorder in children with epilepsy: a community-based study. J Child Neurol. 2011;26:540–547. doi: 10.1177/0883073810384869. [DOI] [PMC free article] [PubMed] [Google Scholar]
- Blatt GJ, Fitzgerald CM, Guptill JT, Booker AB, Kemper TL, Bauman ML. Density and distribution of hippocampal neurotransmitter receptors in autism: an autoradiographic study. Journal of Autism Developmental Disorder. 2001;31:537–543. doi: 10.1023/a:1013238809666. [DOI] [PubMed] [Google Scholar]
- Button KS, Ioannidis JP, Mokrysz C, Nosek BA, Flint J, Robinson ES, Munafò MR. Power failure: why small sample size undermines the reliability of neuroscience. Nat Rev Neurosci. 2013;14(5):365–76. doi: 10.1038/nrn3475. [DOI] [PubMed] [Google Scholar]
- Casanova MF. Autism as a sequence: from heterochronic germinal cell divisions to abnormalities of cell migration and cortical dysplasias. Med Hypotheses. 2014;83(1):32–8. doi: 10.1016/j.mehy.2014.04.014. [DOI] [PMC free article] [PubMed] [Google Scholar]
- Chang SC, Pauls DL, Lange C, Sasanfar R, Santangelo SL. Common genetic variation in the GAD1 gene and the entire family of DLX homeobox genes and autism spectrum disorders. Am J Med Genet B Neuropsychiatr Genet. 2011;156(2):233–9. doi: 10.1002/ajmg.b.31148. [DOI] [PMC free article] [PubMed] [Google Scholar]
- Chen Y, Dong E, Grayson DR. Analysis of the GAD1 promoter: trans-acting factors and DNA methylation converge on the 5′ untranslated region. Neuropharmacology. 2011;60(7–8):1075–87. doi: 10.1016/j.neuropharm.2010.09.017. [DOI] [PubMed] [Google Scholar]
- Chen Y, Sharma RP, Costa RH, Costa E, Grayson DR. On the epigenetic regulation of the human reelin promoter. Nucleic Acids Res. 2002;30:2930–9. doi: 10.1093/nar/gkf401. [DOI] [PMC free article] [PubMed] [Google Scholar]
- Ciernia AV, LaSalle J. The landscape of DNA methylation amid a perfect storm of autism aetiologies. Nat Rev Neurosci. 2016;17(7):411–23. doi: 10.1038/nrn.2016.41. [DOI] [PMC free article] [PubMed] [Google Scholar]
- Colantuoni C, Lipska BK, Ye T, Hyde TM, Tao R, Leek JT, Colantuoni EA, Elkahloun AG, Herman MM, Weinberger DR, Kleinman JE. Temporal dynamics and genetic control of transcription in the human prefrontal cortex. Nature. 2011;478:519–23. doi: 10.1038/nature10524. [DOI] [PMC free article] [PubMed] [Google Scholar]
- D’Arcangelo G, Miao GG, Chen SC, Soares HD, Morgan JI, Curran T. A protein related to extracellular matrix proteins deleted in the mouse mutant reeler. Nature. 1995;374:719–23. doi: 10.1038/374719a0. [DOI] [PubMed] [Google Scholar]
- Dong E, Caruncho H, Liu WS, Smalheiser NR, Grayson DR, Costa E, Guidotti A. A reel-in-integrin receptor interaction regulates Arc mRNA translation in synaptoneurosomes. Proc Natl Acad Sci U S A. 2003;100:5479–84. doi: 10.1073/pnas.1031602100. [DOI] [PMC free article] [PubMed] [Google Scholar]
- Dong E, Tueting P, Matrisciano F, Grayson DR, Guidotti A. Behavioral and molecular neuroepigenetic alterations in prenatally stressed mice: relevance for the study of chromatin remodeling properties of antipsychotic drugs. Transl Psychiatry. 2016;6:e711. doi: 10.1038/tp.2015.191. [DOI] [PMC free article] [PubMed] [Google Scholar]
- Ellis SE, Panitch R, West AB, Arking DE. Transcriptome analysis of cortical tissue reveals shared sets of downregulated genes in autism and schizophrenia. Transl Psychiatry. 2016;6:e817. doi: 10.1038/tp.2016.87. [DOI] [PMC free article] [PubMed] [Google Scholar]
- Fatemi SH, Halt AR, Stary JM, Kanodia R, Schulz SC, Realmuto GR. Glutamic acid decarboxylase 65 and 67 kDa proteins are reduced in autistic parietal and cerebellar cortices. Biological Psychiatry. 2002;52(8):805–10. doi: 10.1016/S0006-3223(02)01430-0. [DOI] [PubMed] [Google Scholar]
- Fatemi SH, Folsom TD, Reutiman TJ, Thuras PD. Expression of GABA(B) receptors is altered in brains of subjects with autism. Cerebellum. 2009a;8(1):64–9. doi: 10.1007/s12311-008-0075-3. [DOI] [PMC free article] [PubMed] [Google Scholar]
- Fatemi SH, Reutiman TJ, Folsom TD, Thuras PD. GABA(A) receptor downregulation in brains of subjects with autism. J Autism Dev Disord. 2009b;39(2):223–30. doi: 10.1007/s10803-008-0646-7. [DOI] [PMC free article] [PubMed] [Google Scholar]
- Fatemi SH, Reutiman TJ, Folsom TD, Rooney RJ, Patel DH, Thuras PD. mRNA and protein levels for GABAA alpha4, alpha5, beta1 and GABABR1 receptors are altered in brains from subjects with autism. J Autism Dev Disord. 2010;40(6):743–50. doi: 10.1007/s10803-009-0924-z. [DOI] [PMC free article] [PubMed] [Google Scholar]
- Fatemi SH, Reutiman TJ, Folsom TD, Rustan OG, Rooney RJ, Thuras PD. Downregulation of GABAA receptor protein subunits α6, β2, δ, ε, γ2, θ, and ρ2 in superior frontal cortex of subjects with autism. J Autism Dev Disord. 2014;44(8):1833–45. doi: 10.1007/s10803-014-2078-x. [DOI] [PubMed] [Google Scholar]
- Fleige S, Pfaffl MW. RNA integrity and the effect on the real-time qRT-PCR performance. Mol Aspects Med. 2006;27:2–3. 126–39. doi: 10.1016/j.mam.2005.12.003. [DOI] [PubMed] [Google Scholar]
- Gabel HW, Kinde B, Stroud H, Gilbert CS, Harmin DA, Kastan NR, Hemberg M, Ebert DH, Greenberg ME. Disruption of DNA-methylation-dependent long gene repression in Rett syndrome. Nature. 2015;522(7554):89–93. doi: 10.1038/nature14319. 2015. [DOI] [PMC free article] [PubMed] [Google Scholar]
- Gokoolparsadh A, Sutton GJ, Charamko A, Green NF, Pardy CJ, Voineagu I. Searching for convergent pathways in autism spectrum disorders: insights from human brain transcriptome studies. Cell Mol Life Sci. 73(23):4517–4530. doi: 10.1007/s00018-016-2304-0. [DOI] [PMC free article] [PubMed] [Google Scholar]
- Grayson DR, Guidotti A. The dynamics of DNA methylation in schizophrenia and related psychiatric disorders. Neuropsychopharmacology. 2013;38(1):138–66. doi: 10.1038/npp.2012.125. [DOI] [PMC free article] [PubMed] [Google Scholar]
- Grayson DR, Guidotti A. Merging data from genetic and epigenetic approaches to better understand autistic spectrum disorder. Epigenomics. 2016;8(1):85–104. doi: 10.2217/epi.15.92. 2016. [DOI] [PMC free article] [PubMed] [Google Scholar]
- Gregory SG, Connelly JJ, Towers AJ, Johnson J, Biscocho D, Markunas CA, Lintas C, Abramson RK, Wright HH, Ellis P, Langford CF, Worley G, Delong GR, Murphy SK, Cuccaro ML, Persico A, Pericak-Vance MA. Genomic and epigenetic evidence for oxytocin receptor deficiency in autism. BMC Med. 2009;7:62. doi: 10.1186/1741-7015-7-62. [DOI] [PMC free article] [PubMed] [Google Scholar]
- Guidotti A, Auta J, Davis JM, Di-Giorgi-Gerevini V, Dwivedi Y, Grayson DR, Impagnatiello F, Pandey G, Pesold C, Sharma R, Uzunov D, Costa E. Decrease in reelin and glutamic acid decarboxylase67 (GAD67) expression in schizophrenia and bipolar disorder: a postmortem brain study. Arch Gen Psychiatry. 2000;57(11):1061–9. doi: 10.1001/archpsyc.57.11.1061. [DOI] [PubMed] [Google Scholar]
- Gupta S, Ellis SE, Ashar FN, Moes A, Bader JS, Zhan J, West AB, Arking DE. Transcriptome analysis reveals dysregulation of innate immune response genes and neuronal activity-dependent genes in autism. Nat Commun. 2014;5:5748. doi: 10.1038/ncomms6748. [DOI] [PMC free article] [PubMed] [Google Scholar]
- Guptill JT, Booker AB, Gibbs TT, Kemper TL, Bauman ML, Blatt GJ. [3H]-flunitrazepam-labeled benzodiazepine binding sites in the hippocampal formation in autism: a multiple concentration autoradiographic study. J Autism Dev Disord. 2007;37(5):911–20. doi: 10.1007/s10803-006-0226-7. [DOI] [PubMed] [Google Scholar]
- Harrison AJ, Gamsiz ED, Berkowitz IC, Nagpal S, Jerskey BA. Genetic variation in the oxytocin receptor gene is associated with a social phenotype in autism spectrum disorders. Am J Med Genet B Neuropsychiatr Genet. 2015;168(8):720–9. doi: 10.1002/ajmg.b.32377. [DOI] [PubMed] [Google Scholar]
- Illingworth RS, Gruenewald-Schneider U, De Sousa D, Webb S, Merusi C, Kerr AR, James KD, Smith C, Walker R, Andrews R, Bird AP. Inter-individual variability contrasts with regional homogeneity in the human brain DNA methylome. Nucleic Acids Res. 2015;43(2):732–44. doi: 10.1093/nar/gku1305. [DOI] [PMC free article] [PubMed] [Google Scholar]
- Impagnatiello F, Guidotti AR, Pesold C, Dwivedi Y, Caruncho H, Pisu MG, Uzunov DP, Smalheiser NR, Davis JM, Pandey GN, Pappas GD, Tueting P, Sharma RP, Costa E. A decrease of reelin expression as a putative vulnerability factor in schizophrenia. Proc Natl Acad Sci U S A. 1998;95(26):15718–23. doi: 10.1073/pnas.95.26.15718. [DOI] [PMC free article] [PubMed] [Google Scholar]
- James SJ, Shpyleva S, Melnyk S, Pavliv O, Pogribny IP. Elevated 5-hydroxymethylcytosine in the Engrailed-2 (EN-2) promoter is associated with increased gene expression and decreased MeCP2 binding in autism cerebellum. Transl Psychiatry. 2014;4:e460. doi: 10.1038/tp.2014.87. [DOI] [PMC free article] [PubMed] [Google Scholar]
- Kang JQ, Barnes G. A common susceptibility factor of both autism and epilepsy: functional deficiency of GABA A receptors. J Autism Dev Disord. 2013;43(1):68–79. doi: 10.1007/s10803-012-1543-7. 2013. [DOI] [PubMed] [Google Scholar]
- King LB, Walum H, Inoue K, Eyrich NW, Young LJ. Variation in the Oxytocin Receptor Gene Predicts Brain Region-Specific Expression and Social Attachment. Biol Psychiatry. 2015 doi: 10.1016/j.biopsych.2015.12.008. pii: S0006-3223(15)01044-6. [DOI] [PMC free article] [PubMed] [Google Scholar]
- Labouesse MA, Dong E, Grayson DR, Guidotti A, Meyer U. Maternal immune activation induces GAD1 and GAD2 promoter remodeling in the offspring prefrontal cortex. Epigenet-Epigenetics. 2015;10(12):1143–55. doi: 10.1080/15592294.2015.1114202. [DOI] [PMC free article] [PubMed] [Google Scholar]
- Ludwig AK, Zhang P, Hastert FD, Meyer S, Rausch C, Herce HD, Müller U, Lehmkuhl A, Hellmann I, Trummer C, Storm C, Leonhardt H, Cardoso MC. Binding of MBD proteins to DNA blocks Tet1 function thereby modulating transcriptional noise. Nucleic Acids Res. 2016 doi: 10.1093/nar/gkw1197. Epub ahead of print. [DOI] [PMC free article] [PubMed] [Google Scholar]
- Ma DQ, Whitehead PL, Menold MM, Martin ER, Ashley-Koch AE, Mei H, Ritchie MD, Delong GR, Abramson RK, Wright HH, Cuccaro ML, Hussman JP, Gilbert JR, Pericak-Vance MA. Identification of significant association and gene-gene interaction of GABA receptor subunit genes in autism. Am J Hum Genet. 2005;77(3):377–88. doi: 10.1086/433195. [DOI] [PMC free article] [PubMed] [Google Scholar]
- Mariani J, Coppola G, Zhang P, Abyzov A, Provini L, Tomasini L, Amenduni M, Szekely A, Palejev D, Wilson M, Gerstein M, Grigorenko EL, Chawarska K, Pelphrey KA, Howe JR, Vaccarino FM. FOXG1-Dependent Dysregulation of GABA/Glutamate Neuron Differentiation in Autism Spectrum Disorders. Cell. 2015;162(2):375–90. doi: 10.1016/j.cell.2015.06.034. [DOI] [PMC free article] [PubMed] [Google Scholar]
- Matrisciano F, Tueting P, Dalal I, Kadriu B, Grayson DR, Davis JM, Nicoletti F, Guidotti A. Epigenetic modifications of GABAergic interneurons are associated with the schizophrenia-like phenotype induced by prenatal stress in mice. Neuropharmacology. 2013;68:184–94. doi: 10.1016/j.neuropharm.2012.04.013. [DOI] [PMC free article] [PubMed] [Google Scholar]
- McCauley JL, Olson LM, Delahanty R, Amin T, Nurmi EL, Organ EL, Jacobs MM, Folstein SE, Haines JL, Sutcliffe JS. A linkage disequilibrium map of the 1-Mb 15q12 GABA(A) receptor subunit cluster and association to autism. Am J Med Genet B Neuropsychiatr Genet. 2004;131B(1):51–9. doi: 10.1002/ajmg.b.30038. [DOI] [PubMed] [Google Scholar]
- Mellén M, Ayata P, Dewell S, Kriaucionis S, Heintz N. MeCP2 binds to 5hmC enriched within active genes and accessible chromatin in the nervous system. Cell. 2012;151(7):1417–30. doi: 10.1016/j.cell.2012.11.022. [DOI] [PMC free article] [PubMed] [Google Scholar]
- Oblak AL, Gibbs TT, Blatt GJ. Decreased GABA(B) receptors in the cingulate cortex and fusiform gyrus in autism. Journal of Neurochemistry. 2010;114(5):1414–23. doi: 10.1111/j.1471-4159.2010.06858.x. [DOI] [PMC free article] [PubMed] [Google Scholar]
- Oblak AL, Rosene DL, Kemper TL, Bauman ML, Blatt GJ. Altered posterior cingulate cortical cyctoarchitecture, but normal density of neurons and interneurons in the posterior cingulate cortex and fusiform gyrus in autism. Autism Res. 2011;4(3):200–11. doi: 10.1002/aur.188. [DOI] [PMC free article] [PubMed] [Google Scholar]
- Parikshak NN, Swarup V, Belgard TG, Irimia M, Ramaswami G, Gandal MJ, Hartl C, Leppa V, Ubieta LT, Huang J, Lowe JK, Blencowe BJ, Horvath S, Geschwind DH. Genome-wide changes in lncRNA, splicing, and regional gene expression patterns in autism. Nature. 540(7633):423–427. doi: 10.1038/nature20612. [DOI] [PMC free article] [PubMed] [Google Scholar]
- Piton A, Jouan L, Rochefort D, Dobrzeniecka S, Lachapelle K, Dion PA, Gauthier J, Rouleau A. Analysis of the effects of rare variants on splicing identifies alterations in GABAA receptor genes in autism spectrum disorder individuals. Eur J Hum Genet. 2013;21(7):749–756. doi: 10.1038/ejhg.2012.243. [DOI] [PMC free article] [PubMed] [Google Scholar]
- Represa A, Ben-Ari Y. Trophic actions of GABA on neuronal development. Trends Neurosci. 2005;28:278–83. doi: 10.1016/j.tins.2005.03.010. [DOI] [PubMed] [Google Scholar]
- Richetto J, Chesters R, Cattaneo A, Labouesse MA, Gutierrez AM, Wood TC, Luoni A, Meyer U, Vernon A, Riva MA. Genome-Wide Transcriptional Profiling and Structural Magnetic Resonance Imaging in the Maternal Immune Activation Model of Neurodevelopmental Disorders. Cereb Cortex. 2016 doi: 10.1093/cercor/bhw320. [Epub ahead of print] [DOI] [PubMed] [Google Scholar]
- Trommsdorff M, Gotthardt M, Hiesberger T, Shelton J, Stockinger W, Nimpf J, Hammer RE, Richardson JA, Herz J. Reeler/Disabled-like disruption of neuronal migration in knockout mice lacking the VLDL receptor and ApoE receptor 2. Cell. 1999;97(6):689–701. doi: 10.1016/S0092-8674(00)80782-5. [DOI] [PubMed] [Google Scholar]
- Tuchman R, Rapin I. Epilepsy in Autism. Lancet Neurol. 2002;1(6):352–8. doi: 10.1016/S1474-4422(02)00160-6. [DOI] [PubMed] [Google Scholar]
- Voineagu I, Wang X, Johnston P, Lowe JK, Tian Y, Horvath S, Mill J, Cantor RM, Blencowe BJ, Geschwind DH. Transcriptomic analysis of autistic brain reveals convergent molecular pathology. Nature. 2011;474(7351):380–4. doi: 10.1038/nature10110. [DOI] [PMC free article] [PubMed] [Google Scholar]
- Wen L, Li X, Yan L, Tan Y, Li R, Zhao Y, Wang Y, Xie J, Zhang Y, Song C, Yu M, Liu X, Zhu P, Li X, Hou Y, Guo H, Wu X, He C, Li R, Tang F, Qiao J. Whole-genome analysis of 5-hydroxymethylcytosine and 5-methylcytosine at base resolution in the human brain. Genome Biol. 2014;15:R49. doi: 10.1186/gb-2014-15-3-r49. [DOI] [PMC free article] [PubMed] [Google Scholar]
- Williams EL, Casanova MF. Above genetics: lessons from cerebral development in autism. Transl Neurosci. 2011;2(2):106–120. doi: 10.2478/s13380-011-0016-3. [DOI] [PMC free article] [PubMed] [Google Scholar]
- Yip J, Soghomonian JJ, Blatt GJ. Decreased GAD67 mRNA levels in cerebellar Purkinje cells in autism: pathophysiological implications. Acta Neuropathologica. 2007;113(5):559–68. doi: 10.1007/s00401-006-0176-3. [DOI] [PubMed] [Google Scholar]
- Yip J, Soghomonian JJ, Blatt GJ. Decreased GAD65 mRNA levels in select subpopulations of neurons in the cerebellar dentate nuclei in autism: an in situ hybridization study. Autism Res. 2009;2(1):50–59. doi: 10.1002/aur.62. [DOI] [PMC free article] [PubMed] [Google Scholar]
- Zhao Y, Zhu M, Yu Y, Qiu L, Zhang Y, He L, Zhang J. Brain REST/NRSF Is Not Only a Silent Repressor but Also an Active Protector. Mol Neurobiol. 2017;54(1):541–550. doi: 10.1007/s12035-015-9658-4. [DOI] [PubMed] [Google Scholar]
- Zhubi A, Cook EH, Guidotti A, Grayson DR. Epigenetic mechanisms in autism spectrum disorder. Int Rev Neurobiol. 2014A;115:203–44. doi: 10.1016/B978-0-12-801311-3.00006-8. [DOI] [PubMed] [Google Scholar]
- Zhubi A, Chen Y, Dong E, Cook EH, Guidotti A, Grayson DR. Increased binding of MeCP2 to the GAD1 and RELN promoters may be mediated by an enrichment of 5-hmC in autism spectrum disorder (ASD) cerebellum. Transl Psychiatry. 2014b;4:e349. doi: 10.1038/tp.2013.123. [DOI] [PMC free article] [PubMed] [Google Scholar]
Associated Data
This section collects any data citations, data availability statements, or supplementary materials included in this article.