

Abstract
Chemoradiotherapy (CRT) with paclitaxel (PTX) and cisplatin (CP) is part of the standard of care for patients with locally advanced non-small cell lung cancer (NSCLC). Despite the high treatment intensity, many patients still develop local recurrence after treatment. Thus, there is a strong need to further improve CRT for lung cancer. One strategy is to co-deliver cytotoxic chemotherapy agents using biocompatible nanoparticles (NPs) which can limit off-target tissue toxicity and improve therapeutic efficacy. Herein, we report the development of dual-drug loaded nanoformulations that improve the efficacy of CRT for NSCLC by co-encapsulation of cisplatin (CP) and PTX in PLGA-PEG NPs. Mice bearing NSCLC xenografts given the dual-drug loaded NPs during CRT showed greater inhibition of tumor growth than free drug combinations or combinations of single-drug loaded NPs. These results indicate that using a NP co-delivery strategy for this common CRT regimen may improve clinical responses in NSCLC patients.
TOC image
Nanoparticles co-loaded with paclitaxel and cisplatin potently enhance chemoradiotherapy in non-small cell lung cancer models versus the conventional free drug combination by delivering a precise therapeutic ratio.
Introduction
Lung cancer is the leading cause of cancer mortality.1 Early manifestations of the disease can be treated via surgery. However, many NSCLC patients have locally advanced disease.2 In these cases, CRT, typically consisting of CP (or similar carboplatin), PTX, and thoracic radiation, is the standard treatment.3–5 Despite extensive clinical trials optimizing this CRT regimen, there are still high rates of local failure. Furthermore, the enhanced potency of this CRT combination leads to increases in side effects and off-target toxicity. Hence, there has been strong interest in further improving CRT for NSCLC.
As a possible solution, NP delivery of chemotherapeutic combinations has proven a viable strategy to both improve responses and reduce side effects. NPs can preferentially accumulate drugs within tumors and limit off-target site exposure. Furthermore, carefully engineered, dual-drug loaded NPs can deliver chemotherapies in a precise therapeutic ratio to take advantage of synergistic effects or overcome multi-drug resistance.6–8 For example, liposomal co-formulations of cytarabine and daunorubicin have greatly improved clinical efficacy and reduced side effects in patients with acute myeloid leukemia.9,10 Other preclinical, NP based drug combinations have shown similar improvements in efficacy and toxicity profiles versus free drugs.11–17
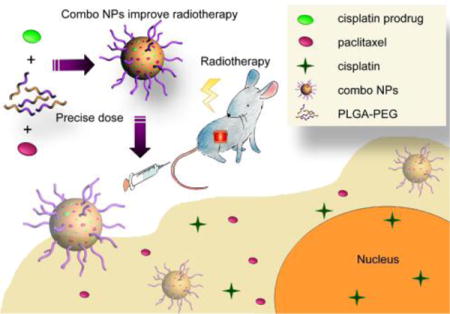
Given these advantages, we investigated NP co-delivery of the standard CP and PTX treatment regimen to improve CRT in murine models of NSCLC (Figure 1). We utilized FDA-approved poly(lactic acid-co-glycolic acid)-poly(ethylene glycol) (PLGA-PEG) NPs as our drug delivery system due to their excellent biocompatibility, high drug loading, ease of formulation, and potential for rapid clinical translation.18,19 PTX loads easily into the hydrophobic PLGA core, but hydrophilic CP shows poor encapsulation and low loading wt% within this environment. Therefore, to improve CP’s co-loading with PTX in the NP’s hydrophobic core, we employed a fatty acid modified CP prodrug (CPP) that has increased hydrophobicity (Figure S1).20 This NP co-delivery strategy showed superior reductions in NSCLC tumor growth rates versus conventional CRT.
Figure 1.

Co-encapsulation of CPP and PTX in PLGA-PEG NPs provisions a precise dose of drug to the tumor and efficiently potentiates CRT.
Results
NP Drug Loading and Release Kinetics
Biocompatible PLGA-PEG NPs encapsulate hydrophobic drugs, especially taxanes, within their hydrophobic PLGA core.18,19,21,22 However, hydrophilic CP shows poor loading efficiency within this hydrophobic environment. Therefore, we utilized a caprylic acid (C8 fatty acid) modified Pt(IV) prodrug strategy that increases CP’s loading into PLGA-PEG NPs. Upon release from the NP, the CPP‘s (PtIV) reduction by intracellular reductants (e.g., glutathione, ascorbate) produces active, square planar CP (PtII) (Figure S1).20,23–27
NPs were loaded with drugs during nanoprecipitation. We analyzed the loading wt% and encapsulation efficiency (%EE) of both CPP and PTX in single-drug loaded PLGA-PEG NPs at a range of feeding ratios (FR, 2 – 16 wt%) (Figure S2, Table S1). As expected, the hydrophobic CPP loaded efficiently with a maximum loading wt% reaching 1.9 ± 0.1% (16 %EE) at 10 wt% FR (Figure S2a). Increasing the initial FR past 10 wt% failed to further increase the amount of loaded CPP. %EE expectantly fell from a maximum of 33.4 ± 0.9% (at 2% FR) with increasing FRs. The PTX loading wt% reached maximum levels (2.8 ± 0.1%) at a FR of 12 wt%, and its %EE reached a maximum of 39.4 ± 1.0% (at 2% FR) (Figures S2b).
We next investigated the effects that co-encapsulation in a single nanoformulation had on each drugs’ loading (Figure 2, Table S2). Since CPP loaded maximally at a FR of 10 wt%, the CPP FR was held at this level, while the PTX dose varied. Maximum PTX loading (8 wt% FR) was approximately the same in the presence of CPP (2.3 ± 0.2%) versus when loaded alone (2.4 ± 0.2%). Similarly, CPP loading decreased only slightly (1.9 ± 0.1% to 1.7 ± 0.1%) with increased PTX FRs. Co-encapsulation and increasing PTX concentration also had a limited effect on particle size, polydispersity, and zeta potential (Figure 2c, Figure S3). This limited interdependence of loading allowed for facile production of uniform NPs at a range of CPP:PTX ratios (3:1 to 1:3).
Figure 2.
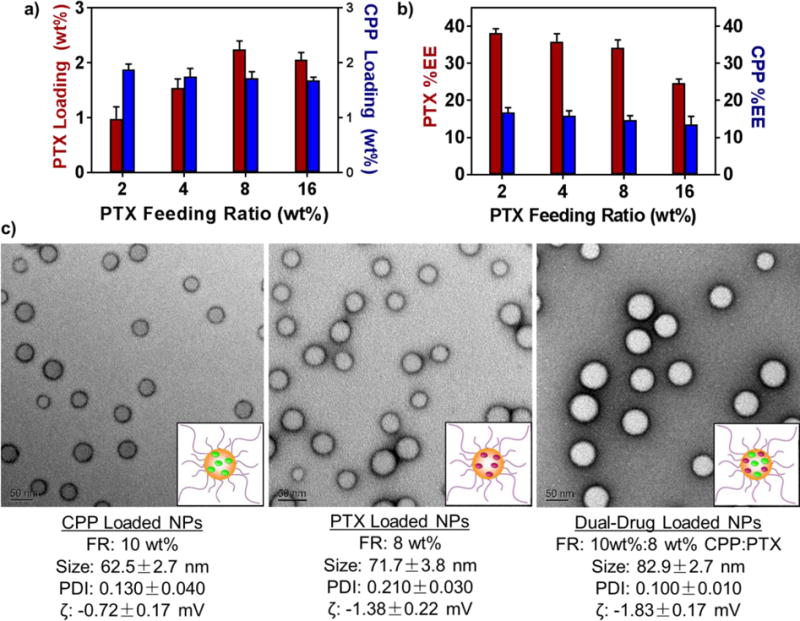
a) Drug loading (wt%) and b) encapsulation efficiency (%EE) in dual-drug loaded NPs. The FR of CPP was held constant at 10 wt%, while the PTX %FR was varied (2 – 16 wt%). c) TEM images and characterization data for NPs used in vivo. The dual-drug loaded NPs contained a loaded PTX:CPP molar ratio of 1:1.
We also determined whether co-loading both drugs into the NP would affect release kinetics under physiological sink conditions (Figure S4).28 In both single-drug and dual-drug loaded NPs, the encapsulated PTX always released faster than CPP. Moreover, co-loading drugs into a single nanoformulation slowed the release rates for both CPP (t1/2- 6.8 ± 0.1 h for single-drug loaded to 9.2 ± 0.3 h for dual-drug loaded) and PTX (t1/2- 3.6 ± 0.2 h for single-drug to 5.3 ± 0.1 h for dual-drug).
Comparison of NP In Vitro Cytotoxicity
We selected three representative NSCLC cell lines (344SQ, H460, and A549) and one small-cell lung cancer (SCLC) cell line (H69AR) to examine differences in potency between various nanoformulations (Figure 3a, Table S3). Across all cell types, the single-drug loaded CPP NPs greatly increased drug potency versus free CP (5 [A549] to 100 [H460] fold IC50 enhancements). However, this trend did not hold for single-drug loaded PTX NPs as their IC50 values slightly increased upon encapsulation (75% IC50 increase [A549] to 6-fold IC50 reduction [344SQ]).
Figure 3.
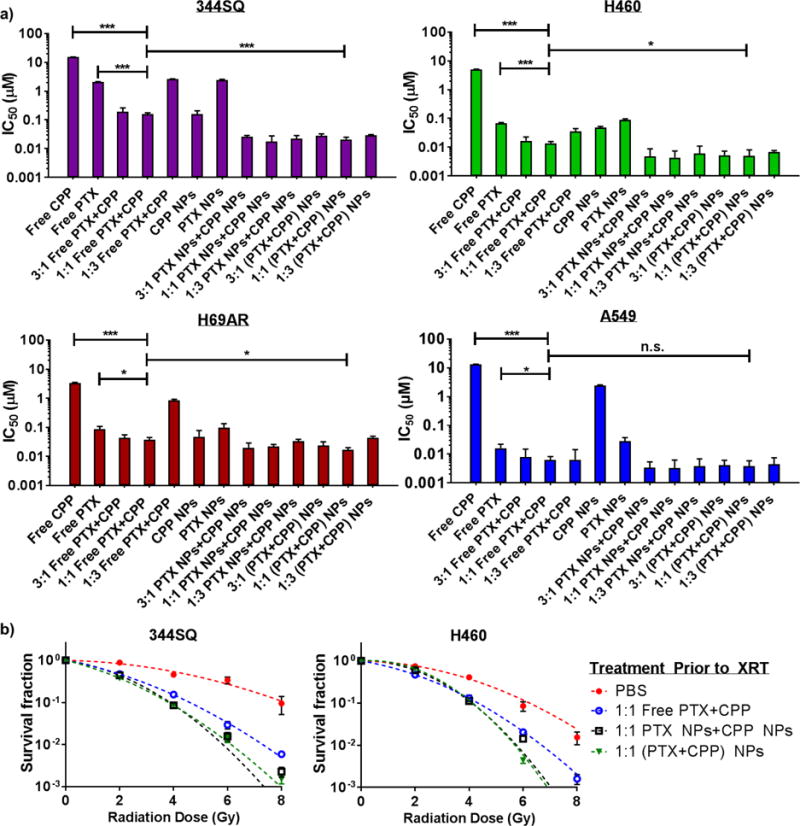
a) In vitro cytotoxicities of free and encapsulated chemotherapeutics in non-small cell (H460, 344SQ, and A549) and small cell (H69AR) lung cancer cell lines. (* p ≤ .05, ** p ≤ .01, *** p ≤ .001, n.s. = not significant). When a combination was used, a PTX:CPP ratio will be indicated at the beginning of each arm’s label. Free indicates non-encapsulated drugs, PTX NP + CPP NP indicates a mixture of single-drug loaded NPs, and (PTX+CPP) NPs indicates dual-drug loaded NPs. b) In vitro radiosensitizing efficiencies of small-molecule and encapsulated drugs.
We analyzed the IC50 concentrations of PTX:CPP combinations at ratios of 3:1, 1:1, and 1:3. For all cell lines, a drug ratio of 1:1 produced the greatest response. In the free drug arms, the 1:1 combination increased potencies versus PTX (the most potent, small molecule monotherapy) by 2.3 (H69AR) to 13.4 (344SQ) fold. Likewise, 1:1 mixtures of single-drug loaded NPs decreased required drug concentrations versus CPP NPs (the most potent NP monotherapy) by 2.2 (H69AR) to 10.9 (H460) fold. These IC50 enhancements were nearly identical for the 1:1 dual-drug loaded NPs compared to the CPP NPs alone (2.9 [H69AR] to 9.6 [H460] fold). However, at all ratios tested, there were no significant differences in the potency between mixtures of single-drug loaded NPs or the dual-drug loaded formulations. Since the PTX:CPP ratio of 1:1 generally produced the greatest cytotoxicity, we used this formulation in all further investigations.
In addition to chemotherapy, oncologists employ concurrent radiotherapy (XRT) to treat NSCLC3–5. Therefore, we investigated the ability of our NPs (1:1 PTX:CPP ratio) to radiosensitize two NSCLC cell lines (344SQ and H460) using the clonogenic survival assay (Figure 3b).15 Cells were treated with PTX:CPP formulations, exposed to increasing doses of radiation, and then plated to monitor colony formation. As expected, cells treated with any drug combination responded better to radiation treatment than the control arm (PBS). Both NPs (mixtures of single-drug loaded or dual-drug loaded) further reduced cell survival than the free drug combination at higher radiation doses (> 4 Gy). However, minimal difference existed between simply treating cells with a mixture of single-drug loaded NPs or dual-drug loaded NPs.
In Vivo Efficacy
We probed the in vivo CRT efficacy of our NPs against murine NSCLC xenograft models (Figure 4). Mice were treated with free drugs, mixed single-drug loaded NPs, or dual-drug loaded NPs at the same sub-therapeutic dose (50% MTD) to enable monitoring of tumor growth rate differences. The two NP arms outperformed the standard free drug, CRT combination by producing a statistically significant reduction in tumor growth. Furthermore, the dual-drug loaded NPs blunted tumor growth better than administration of a combination of single-drug loaded NPs in the 344SQ model (p < 0.05) and to a lesser, not statistically significant degree in the H460 model (p = 0.08).
Figure 4. In vivo.
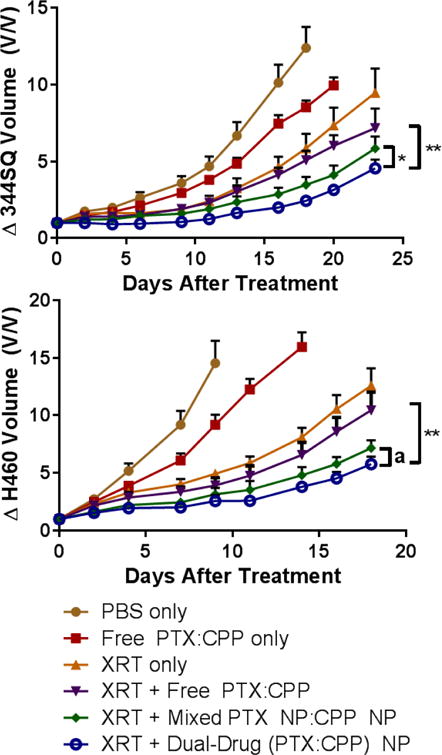
CRT efficacy comparison between free drugs and NP formulations in a) 344SQ and b) H460 xenograft models. (* p ≤ .05, ** p ≤ .01, a = .08). Mice were administered chemotherapies (1:1 PTX:CPP molar ratio, 5 mg/kg PTX and 2.3 mg/kg CP or 3.9 mg/kg CPP) once on day 0. Mice receiving XRT were irradiated with 5 Gy at 3, 24, and 48 h (15 Gy total) post chemotherapy administration. The data are represented as the change in tumor volume after tumors become palpable.
We analyzed tumor histology for cleaved caspase 3, a prognostic marker for early-stage apoptosis, in each treatment arm (Figure 5). Mice treated with NPs showed a greater degree of apoptosis than mice given CRT in free drug form. Moreover, the dual-drug loaded NPs produced apoptosis to a greater degree than using a mixture of single-drug loaded NPs (p < 0.01).
Figure 5.
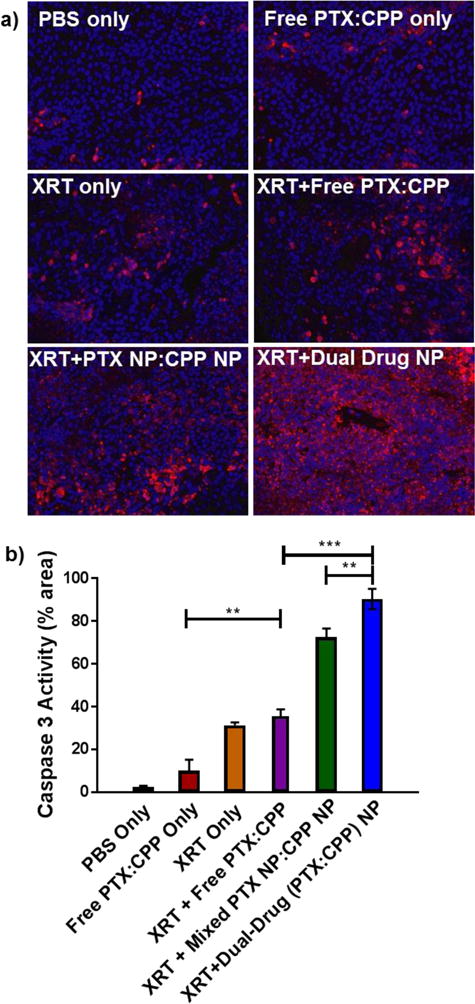
a) Fluorescent microscopy images of caspase 3 (red) activation in H460 xenograft tumors after treatment. Nuclei were stained with Hoechst stain (blue b) Quantified caspase 3 activity represented as a proportion of the total red fluorescence area. Elevated caspase 3 activity signifies apoptosis due to treatment (* p ≤ .05, ** p ≤ .01, *** p ≤ .001, n.s. = not significant)
We also analyzed tumor sections for the enhanced delivery of CP and formation of CP-DNA adducts via immunofluorescence (Figure S5–S6). The sections from NP treatment arms showed a significant increase in CP-DNA adduct formation versus the free drug combination corresponding to an increased delivery of CP. The appearance of apoptotic features in the tumor histology also qualitatively indicates enhanced killing of tumor cells using this regimen (Figure S7).
Aside from the tumor, PLGA-PEG NPs tend to biodistribute to the liver and kidneys.15,29–32 Therefore, we examined if our nanoformulations caused undue toxicity to these off-target organs. Although the combination had higher treatment potency in vivo, nephrotoxicity and hepatotoxicity remained low as indicated by normal creatine (Crea), blood urea nitrogen (BUN), alanine aminotransferase (ALT), and aspartate aminotransferase (AST) levels in the blood (Table S4). However, the body weight of the animals did expectantly decrease post XRT but recovered gradually to baseline levels within several days (Figure S8).
Discussion
CRT for locally advanced NSCLC uses a combination of platinum and taxane derivatives.3–5 This combination works synergistically to radiosensitize cancer cells. However, research advances in this field have largely been limited to determining optimal dosing regimens and protocols (e.g., radiation & chemotherapy order, fractionation, etc.). Moreover, this chemotherapy and XRT combination can be highly toxic to the large volumes of healthy tissue exposed during treatment.
NP co-delivery of chemotherapy combinations has several important advantages that can improve clinical responses and address these challenges.6–8 First, PLGA-PEG NPs improve the solubility and the pharmacokinetic profile of a wide range of small-molecule drugs.28,30,32,33 Moreover, they can be designed to accommodate several drugs, even with vastly different solubilities and stabilities, into a single nanoformulation. This allows for the delivery of precise ratios of drugs that can induce combination synergy and overcome multi-drug resistance mechanisms.9,10,34–36 Finally, NPs can preferentially deliver drugs to tumor beds and avoid toxicities associated with whole body exposure. Due to these reasons, we sought to develop a single nanoformulation that delivers an optimum dose of PTX and CP together for improved CRT (Figure 1).
We chose PLGA-PEG NPs as our delivery system due to their ease of encapsulation of a wide range of drugs during nanoprecipitation, excellent biocompatiblity, and potential for rapid clinical translation. The hydrophobic PLGA core is an especially excellent carrier for taxanes. However, hydrophilic CP loads poorly into these NPs’ cores.
To circumvent this, we employed a prodrug strategy (CPP) that utilizes fatty acid modified CP to increase the drug’s hydrophobicity and encapsulation into the PLGA core.20 Several previous studies have shown that most CPPs undergo conversion to active, square planar CP (PtII) upon reduction.20,23–26 Conveniently, cancer cells often have substantially elevated levels of biological reductants, especially glutathione37, that can rapidly convert CPPs into active CP.27,38–41 CPP conversion to CP tends to follow first-order kinetics with respect to the concentration of these reducing agents. Therefore, CPPs provide an ideal strategy to enable delivery of active CP to tumor cells via PLGA-PEG NPs.
NP Drug Loading and Release Kinetics
The octanoic acid modified CPP and PTX co-precipitated efficiently within PLGA NPs and did not significantly affect each other’s loading (Figure 2, Figure S2, Table S1–S2). This allowed for the facile synthesis of nanoformulations at a wide range of PTX:CPP ratios (3:1 to 1:3). Moreover, loading of both drugs into NPs did not substantially affect the vehicle’s properties (Figure 2, Figure S3). This broad loading adaptability of the PLGA-PEG system may allow for the delivery and screening of potentially synergistic drug ratios to achieve maximum therapeutic effect.
In contrast to drug loading and particle properties, the co-loaded drugs did slightly affect each other’s release rates (Figure S4). This is possibly due to increased interactions between the hydrophobic molecules within the PLGA core leading to greater retention. Provided the NP remains in circulation, this slower release profile could provide advantages in increasing the drugs’ circulation time. However, co-encapsulation only increases drug retention half-life by a few hours, which makes ascertaining the full effects of this slower release difficult.
Comparison of NP In Vitro Cytotoxicity
Loading of the CPP into NPs substantially increased CP’s observed cytotoxicity up to 100 fold versus the free drug (Figure 3, Table S3). This likely stems from improved delivery of CP into cells either via an increase in CPP passive cell permeability or NP phagocytosis and endosomolysis. Both effects circumvent common NSCLC resistance mechanisms, such as low expression of copper transporter 1, that block CP uptake.42 Encapsulation of PTX in NPs did not increase its potency, indicating PTX cellular permeation remains largely unaffected.
As expected, combining both drugs lowered the cumulative IC50, likely due to the drugs differing mechanisms of action. CP induces DNA double strand breaks, while PTX promotes microtubule stabilization. Together, these drugs have at least an additive effect and can overcome drug resistance. Encapsulation of the drug combination in NPs further enhanced the cytotoxic effects, likely due to the increased potency and delivery of the CP component. However, delivering the combination either by mixing single-drug loaded NPs or co-encapsulation in a single NP showed no differences in cytotoxicity. This suggests no advantage in an in vitro setting to co-encapsulation. As there are no barriers to delivery of a specific drug ratio or differences in pharmacokinetics in a culture flask, the advantages of co-encapsulation, such as equal extravasation of a specific drug ratio into the tumor bed, would not be evident unless applied in vivo.
In Vivo Efficacy
The dual-drug loaded NPs (1:1 PTX:CPP) outperformed a mixture of single-drug loaded NPs in vivo for both 344SQ (p < 0.05) and H460 (p = 0.08) (Figure 4). Even more promising, the combination loaded NPs greatly retarded tumor growth rates compared to the free drug combination with XRT (p ≤ 0.01 for both cell lines). It should be noted that the observed rapid growth rates of these tumors in all treatment arms stem from their high degree of aggressiveness and the sub-therapeutic dose administered to the animals (~50% MTD). Histologic analysis of tumor caspase 3 activity reciprocated these results with the combination NPs inducing the greatest early stage apoptosis (Figure 5).
Compared to the dual-drug loaded NPs, both the free drug combination and mixtures of single-drug loaded NPs likely do not expose the tumors to both drugs in the right ratio which leads to differences in efficacy. Indeed, the delivery of the specific 1:1 PTX:CPP drug combination via a single nanoformulation was likely the causative factor in the increased apoptosis. The different physiochemical and pharmacokinetic properties of free CP and PTX likely shift both the dose and ratio of drug that eventually reaches the tumor when compared to dual-drug loaded NPs. At least part of this effect for CP is evident in the substantially increased CP-DNA adduct formation seen in tumors treated with dual-drug loaded NPs (Figure S5–S6). However, the discrepancy in efficacy between mixed single-drug loaded and dual-drug loaded NPs is not abundantly clear.
Comparison of the single-drug loaded NP properties provides a few possible explanations (Figure 2). First, the PTX NPs skewed smaller than the CPP NPs. Since size affects extravasation, this could cause the unequal tumor accumulation of one NP versus the other and shift the ratio of drug dose.29 Second, the increased drug retention within the dual-drug loaded NPs may allow more of the drug to be delivered to the target site instead of escaping prior to NP permeation into the tumor.28 Regardless, a full examination of the causative factors for the increased efficacy was outside the scope of this study, but ongoing work within the lab seeks to fully address possible mechanisms.
Conclusions
Co-encapsulation of CP and PTX in a single nanoformulation increases CRT’s efficacy against NSCLC. This improved efficacy likely arises from enhanced dosing of the tumor with increased concentrations and precise ratios of drug compared to the free small molecules. The incorporation of biocompatible and easily synthesized PLGA-PEG NPs in this CRT regimen makes this system capable of rapid adaptation as a clinical tool. Therefore, we hope this research lays the ground work for further investigations on these formulations in NSCLC treatment.
Experimental
Additional experimental details on the materials used, cell culture techniques, tumor section staining and synthesis of prodrug precursors are provided in the Supplementary Information.
Preparation of single/dual-drug loaded PLGA-PEG NPs
PTX and/or CPP-loaded loaded PLGA-PEG NPs with different molar ratios were prepared via nanoprecipitation. PLGA-PEG (5 mg) and drugs at varying feeding ratios (w/w% to polymer, FR) were dissolved in acetonitrile (200 μL). A 1:1 molar ratio of PTX:CPP was generated in dual-drug loaded NPs using a FR of 8 wt% PTX and 10 wt% CPP. Single-drug loaded NPs used in vivo were generated with these same FRs. The organic solution was then added dropwise to deionized water (4 mL) under constant stirring. The NPs were purified by filter centrifugation using an Amicron Ultra-4 filter (MWCO- 30 kDa) at 1000×g for 15 min (Millipore, Billerica, MA, USA). The PLGA-PEG NPs were washed 3 times with deionized water) then suspended in PBS.
Drug-loading determination
The amount of loaded CPP and PTX was measured using a Shimadzu SPD-M20A high-performance liquid chromatography (HPLC) instrument equipped with a diode array detector and a reverse-phase GP-C18 column (Sepax Technology Inc., Newark, DE, USA). NPs (10 μL) were mixed with acetonitrile (50 μL) and left overnight at 5 °C to dissolve the NP and drugs. Drugs were eluted using a binary solvent system (A:B, A- H2O, B- CH3CN, flow rate- 0.25 mL/min) that linearly increased from 0% to 100% B over 20 min (0–20 min), held at 100% B for an additional 5 min (20–25 min), then reduced to 50% B for the final 5 min (25–30 min). Drug elution was monitored at 227 nm for PTX and 245 nm for CPP. Retention times were: PTX- 11.9 min and CPP- 12.9 min. Drug concentrations were determined using area under the curve integration compared with drug standard curves. The limit of detection was estimated to be ~1 μM for CP.
In Vitro Release of CPPs and PTX from PLGA-PEG NPs
In vitro drug-release profiles were recorded under physiological sink conditions.28 NP solutions (2.2mg/mL,500 μL) were loaded into Slide-A-Lyzer MINI dialysis microtubes (20 kDa MWCO, Pierce, Rockford, IL, USA) and dialyzed against a large excess of PBS (1 L) stirring at 37 °C. At the indicated times, 10 μL of residual NP test solution was removed from the microdialysis tube and dissolved in acetonitrile (60 μL). The remaining chemotherapy concentrations were determined using the above HPLC method.
In Vitro Cytotoxicity of PLGA-PEG NPs
H460, 344SQ, A549 (5,000 cells/well), and H69AR (10,000 cells/well) were plated in a 96-well plate and incubated overnight. Cells were then dosed with different drug formulations at varying doses (10−9 – 10−5 M) in RPMI-1640 media. After 72 h incubation, cell viabilities were determined using a 3-(4,5-dimethylthiazol-2-yl)-5-(3-carboxymethoxyphenyl)-2-(4-sulfophenyl)-2H-tetrazolium (MTS) cell viability assay (Promega). The absorbance at 490 nm was recorded using a 96-well plate reader (Infinite 200 Pro, Tecan i-control) to determine response. The IC50 values were calculated by fitting the dose-dependent cell viabilities to a four-parameter logistic model using MasterPlex 2010 software pack (MiraiBio Group, Hitachi Solutions America, Ltd.).
Clonogenic survival assay.15
Cells (106) were seeded in a 75 cm2 flask overnight before treatment. Cells were treated with the predetermined therapeutic dose (i.e., IC50) of small-molecule or encapsulated drugs for 3–4 h and washed three times with cold PBS. Cells were then trypsinized and re-suspended in cold complete culture medium. Cell mixtures with densities ranging from 100 to 10,000 cells/mL were transferred to 6-well plates (2 mL/well). After 3–4 h, cells were irradiated with varying radiation doses (0, 2, 4, 6, or 8 Gy) from an X-RAD 320 (Precision X-ray) machine operating at 320 kVp and 12.5 mA. Fourteen days after irradiation, cell clones were fixed with paraformaldehyde (4 v/v%) and stained with crystal violet. Colonies containing 30 cells or more were counted, and surviving fractions were determined for both lines. The surviving fraction (SF) was calculated from the plating efficiency (PE) according to the following equations:
The best-fit line for survival fraction was plotted on a log scale versus the radiation dose (D) and fit with the following linear-quadratic formula:
where α is the linear parameter and β is the quadratic parameter.
In Vivo Anticancer efficacy of PLGA-PEG NPs
A murine, lung cancer xenograft model was generated by s.c. injection of 1 × 10⁶ 344SQ or H460 cells (100 μL of 1 × 10⁷ cells/mL, 50% v/v Matrigel®) into the left flank of female, athymic, nude mice. Tumors were allowed to grow to a volume 150–200 mm3 before initiating treatment. Mice were divided into six groups (5 – 6 mice per group) and treated once on day 0 via tail vein injection with either PBS (200μL), free CP (2.3 mg/kg) and PTX (5.0 mg/kg) formulated in cremophor EL, mixtures of single-drug loaded CPP NPs (3.9 mg/kg) and PTX NPs (5.0 mg/kg), and dual-drug loaded NPs with CPP (3.9 mg/kg) and PTX (5.0 mg/kg) NPs. Mice in CRT groups received 3 × 5 Gy X-ray irradiation 3 h, 24 h and 48 h after i.v. administration of chemotherapeutic agents using a Precision X-RAD 320 (Precision X-Ray, Inc) machine operating at 320 kVp and 12.5 mA. The dose rate at a source-subject distance of 70 cm was 0.5 Gy min−1. Mice upper bodies were lead-shielded to protect most organs. Body weight and tumor volume were monitored every 2 days. The tumor volume was calculated using: (L×W2)/2, with W being smaller than L. Mice were sacrificed when tumor dimensions reached > 2 cm in one direction.
Immunofluorescent Staining for Active Caspase 3 and CP-DNA Adducts
Tumors were collected 2 days post treatment from the 344SQ model, fixed in neutral buffered formalin (4% v/v) at 4 °C for 24 h, then ethanol (70% v/v) at 4 °C for another 24 h. The tumor sections were de-paraffinized, antigen recovered, blocked with BSA (1% w/v), incubated overnight with a 1:400 dilution of cleaved caspase-3 (Asp175) antibodies (Cell Signaling Technology, MA), and then stained with Alexa Fluor® 594 Goat Anti-Rabbit IgG (1:2000, Life Technology, CA). For CP-DNA adduct formation, sections were incubated overnight with a 1:300 dilution of anti-CP-DNA antibody (CP9/19, Abcam, MA). The sections were counter-stained with VECTASHIELD mounting media containing DAPI (Vector Laboratories, Burlingame, CA). Tumor sections were imaged using an Olympus IX 81 inverted wide-field light microscope in the Microscopy Services Laboratory at the UNC Medical School.
Statistical analysis
All experiments were performed three times (n=3) and expressed as mean ± SD for in vitro or mean ± SEM for in vivo studies. Statistical differences were determined using two-tailed Student’s t-test. The significance level was taken as 95% (P<0.05).
Supplementary Material
Acknowledgments
This work was supported by National Institutes of Health/National Cancer Institute (R01CA178748-01, R21 CA182322, and U54CA198999 for Carolina Center of Cancer Nanotechnology Excellence (CCNE)-Nano Approaches to Modulate Host Cell Response for Cancer Therapy). Jing Tian is supported by the Natural Science Foundation of Tianjin (Grant No. 15JCYBJC21100) and the Science & Technology Development Fund of Tianjin Education Commission for Higher Education (No. 20110511). Zachary Rodgers is supported by the Carolina Cancer Nanotechnology T32 Training Program (C-CNTP, NIH- 1T32CA196589).
Footnotes
Electronic Supplementary Information (ESI) available: [details of any supplementary information available should be included here]
References
- 1.Torre LA, Siegel RL, Jemal A. In: Lung Cancer and Personalized Medicine: Current Knowledge and Therapies. Ahmad A, Gadgeel S, editors. Springer International Publishing; Cham: 2016. pp. 1–19. [Google Scholar]
- 2.Goldstraw P, Ball D, Jett JR, Le Chevalier T, Lim E, Nicholson AG, Shepherd FA. Lancet. 2011;378:1727–1740. doi: 10.1016/S0140-6736(10)62101-0. [DOI] [PubMed] [Google Scholar]
- 3.Johnson DH, Schiller JH, Bunn PA. J Clin Oncol. 2014;32:973–982. doi: 10.1200/JCO.2013.53.1228. [DOI] [PubMed] [Google Scholar]
- 4.Salama JK, Vokes EE. J Clin Oncol. 2013;31:1029–1038. doi: 10.1200/JCO.2012.44.5064. [DOI] [PubMed] [Google Scholar]
- 5.Vokes EE, Herndon JE, Kelley MJ, Cicchetti MG, Ramnath N, Neill H, Atkins JN, Watson DM, Akerley W, Green MR. J Clin Oncol. 2007;25:1698–1704. doi: 10.1200/JCO.2006.07.3569. [DOI] [PubMed] [Google Scholar]
- 6.Ma L, Kohli M, Smith A. ACS Nano. 2013;7:9518–9525. doi: 10.1021/nn405674m. [DOI] [PMC free article] [PubMed] [Google Scholar]
- 7.Hu CMJ, Zhang L. Biochem Pharmacol. 2012;83:1104–1111. doi: 10.1016/j.bcp.2012.01.008. [DOI] [PubMed] [Google Scholar]
- 8.Greco F, Vicent MJ. Adv Drug Deliv Rev. 2009;61:1203–1213. doi: 10.1016/j.addr.2009.05.006. [DOI] [PubMed] [Google Scholar]
- 9.Raut L. South Asian J Cancer. 2015;4:38. doi: 10.4103/2278-330X.149950. [DOI] [PMC free article] [PubMed] [Google Scholar]
- 10.Lancet JE, Cortes JE, Hogge DE, Tallman MS, Kovacsovics TJ, Damon LE, Komrokji R, Solomon SR, Kolitz JE, Cooper M, Yeager AM, Louie AC, Feldman EJ. Blood. 2014;123:3239–3246. doi: 10.1182/blood-2013-12-540971. [DOI] [PMC free article] [PubMed] [Google Scholar]
- 11.Shiao Y, Chiu H, Wu P, Huang Y. ACS Appl Mater Interfaces. 2014;6:21832–21841. doi: 10.1021/am5026243. [DOI] [PubMed] [Google Scholar]
- 12.Kolishetti N, Dhar S, Valencia PM, Lin LQ, Karnik R, Lippard SJ, Langer R, Farokhzad OC. Proc Natl Acad Sci U S A. 2010;107:17939–44. doi: 10.1073/pnas.1011368107. [DOI] [PMC free article] [PubMed] [Google Scholar]
- 13.Miao L, Guo S, Zhang J, Kim WY, Huang L. Adv Funct Mater. 2014;24:6601–6611. doi: 10.1002/adfm.201401076. [DOI] [PMC free article] [PubMed] [Google Scholar]
- 14.Liao L, Liu J, Dreaden EC, Morton SW, Shopsowitz KE, Hammond PT, Johnson JA. J Am Chem Soc. 2014;136:5896–5899. doi: 10.1021/ja502011g. [DOI] [PMC free article] [PubMed] [Google Scholar]
- 15.Au KM, Min Y, Tian X, Zhang L, Perello V, Caster JM, Wang AZ. ACS Nano. 2015;9:8976–8996. doi: 10.1021/acsnano.5b02913. [DOI] [PMC free article] [PubMed] [Google Scholar]
- 16.Tian J, Min Y, Rodgers Z, Wan X, Qiu H, Mi Y, Tian X, Wagner KT, Caster JM, Qi Y, Roche K, Zhang T, Cheng J, Wang AZ. Nanomedicine Nanotechnology, Biol Med. 2017;13:1301–1307. doi: 10.1016/j.nano.2016.11.007. [DOI] [PMC free article] [PubMed] [Google Scholar]
- 17.Guo S, Lin CM, Xu Z, Miao L, Wang Y, Huang L. ACS Nano. 2014;8:4996–5009. doi: 10.1021/nn5010815. [DOI] [PMC free article] [PubMed] [Google Scholar]
- 18.Danhier F, Ansorena E, Silva JM, Coco R, Le Breton A, Préat V. J Control Release. 2012;161:505–522. doi: 10.1016/j.jconrel.2012.01.043. [DOI] [PubMed] [Google Scholar]
- 19.Pavot V, Berthet M, Rességuier J, Legaz S, Handké N, Gilbert SC, Paul S, Verrier B. Nanomedicine. 2014;9:2703–2718. doi: 10.2217/nnm.14.156. [DOI] [PubMed] [Google Scholar]
- 20.Johnstone TC, Lippard SJ. Inorg Chem. 2013;52:9915–9920. doi: 10.1021/ic4010642. [DOI] [PMC free article] [PubMed] [Google Scholar]
- 21.Kim TY. Clin Cancer Res. 2004;10:3708–3716. doi: 10.1158/1078-0432.CCR-03-0655. [DOI] [PubMed] [Google Scholar]
- 22.Hrkach J, Von Hoff D, Ali MM, Andrianova E, Auer J, Campbell T, De Witt D, Figa M, Figueiredo M, Horhota A, Low S, McDonnell K, Peeke E, Retnarajan B, Sabnis A, Schnipper E, Song JJ, Song YH, Summa J, Tompsett D, Troiano G, Van Geen Hoven T, Wright J, LoRusso P, Kantoff PW, Bander NH, Sweeney C, Farokhzad OC, Langer R, Zale S. Sci Transl Med. 2012;4:128ra39–128ra39. doi: 10.1126/scitranslmed.3003651. [DOI] [PubMed] [Google Scholar]
- 23.Hall MD, Dillon CT, Zhang M, Beale P, Cai Z, Lai B, Stampfl APJ, Hambley TW. J Biol Inorg Chem. 2003;8:726–732. doi: 10.1007/s00775-003-0471-6. [DOI] [PubMed] [Google Scholar]
- 24.Hall MD, Mellor HR, Callaghan R, Hambley TW. J Med Chem. 2007;50:3403–3411. doi: 10.1021/jm070280u. [DOI] [PubMed] [Google Scholar]
- 25.Kelland L. Nat Rev Cancer. 2007;7:573–584. doi: 10.1038/nrc2167. [DOI] [PubMed] [Google Scholar]
- 26.Dhar S, Kolishetti N, Lippard SJ, Farokhzad OC. Proc Natl Acad Sci. 2011;108:1850–1855. doi: 10.1073/pnas.1011379108. [DOI] [PMC free article] [PubMed] [Google Scholar]
- 27.Wexselblatt E, Gibson D. J Inorg Biochem. 2012;117:220–229. doi: 10.1016/j.jinorgbio.2012.06.013. [DOI] [PubMed] [Google Scholar]
- 28.Sethi M, Sukumar R, Karve S, Werner ME, Wang EC, Moore DT, Kowalczyk SR, Zhang L, Wang AZ. Nanoscale. 2014;6:2321–7. doi: 10.1039/c3nr05961h. [DOI] [PMC free article] [PubMed] [Google Scholar]
- 29.Caster JM, Yu SK, Patel AN, Newman NJ, Lee ZJ, Warner SB, Wagner KT, Roche KC, Tian X, Min Y, Wang AZ. Nanomedicine Nanotechnology Biol Med. doi: 10.1016/j.nano.2017.03.002. [DOI] [PMC free article] [PubMed] [Google Scholar]
- 30.Rafiei P, Haddadi A. Int J Nanomedicine. 2017;12:935–947. doi: 10.2147/IJN.S121881. [DOI] [PMC free article] [PubMed] [Google Scholar]
- 31.Semete B, Booysen L, Kalombo L, Ramalapa B, Hayeshi R, Swai HS. Int J Pharm. 2012;424:115–120. doi: 10.1016/j.ijpharm.2011.12.043. [DOI] [PubMed] [Google Scholar]
- 32.Li M, Panagi Z, Avgoustakis K, Reineke J. Int J Nanomedicine. 2012;7:1345–1356. doi: 10.2147/IJN.S23758. [DOI] [PMC free article] [PubMed] [Google Scholar]
- 33.Rafiei P, Haddadi A. Pharm Nanotechnol. 2017;5:3–23. doi: 10.2174/2211738505666161230110108. [DOI] [PubMed] [Google Scholar]
- 34.Lehár J, Krueger AS, Avery W, Heilbut AM, Johansen LM, Price ER, Rickles RJ, Short GF, III, Staunton JE, Jin X, Lee MS, Zimmermann GR, Borisy AA. Nat Biotechnol. 2009;27:864–864. doi: 10.1038/nbt.1549. [DOI] [PMC free article] [PubMed] [Google Scholar]
- 35.Tallarida RJ. Genes Cancer. 2011;2:1003–1008. doi: 10.1177/1947601912440575. [DOI] [PMC free article] [PubMed] [Google Scholar]
- 36.Jia J, Zhu F, Ma X, Cao ZW, Li YX, Chen YZ. Nat Rev Drug Discov. 2009;8:111–28. doi: 10.1038/nrd2683. [DOI] [PubMed] [Google Scholar]
- 37.Hong R, Han G, Fernández JM, Kim B, Forbes NS, Rotello VM. J Am Chem Soc. 2006;128:1078–1079. doi: 10.1021/ja056726i. [DOI] [PubMed] [Google Scholar]
- 38.Lemma K, Berglund J, Farrell N, Elding LI. J Biol Inorg Chem. 2000;5:300–6. doi: 10.1007/pl00010658. [DOI] [PubMed] [Google Scholar]
- 39.Kratochwil NA, Bednarski PJ. Arch Pharm (Weinheim) 1999;332:279–85. doi: 10.1002/(sici)1521-4184(19998)332:8<279::aid-ardp279>3.0.co;2-1. [DOI] [PubMed] [Google Scholar]
- 40.Kratochwil NA, Bednarski PJ. J Cancer Res Clin Oncol. 1999;125:690–6. doi: 10.1007/s004320050335. [DOI] [PMC free article] [PubMed] [Google Scholar]
- 41.Zhu Z, Wang Z, Hao Y, Zhu C, Jiao Y, Chen H, Wang YM, Yan J, Guo Z, Wang X. Chem Sci. 2016;7:2864–2869. doi: 10.1039/c5sc04049c. [DOI] [PMC free article] [PubMed] [Google Scholar]
- 42.Min Y, Mao CQ, Chen S, Ma G, Wang J, Liu Y. Angew Chemie Int Ed. 2012;51:6742–6747. doi: 10.1002/anie.201201562. [DOI] [PubMed] [Google Scholar]
Associated Data
This section collects any data citations, data availability statements, or supplementary materials included in this article.