

Abstract
We present a critical review of microfluidic technologies and material effects on the analyses of circulating tumour cells (CTCs) selected from the peripheral blood of cancer patients. CTCs are a minimally invasive source of clinical information that can be used to prognose patient outcome, monitor minimal residual disease, assess tumour resistance to therapeutic agents, and potentially screen individuals for the early diagnosis of cancer. The performance of CTC isolation technologies depends on microfluidic architectures, the underyling principles of isolation, and the choice of materials. In this review, we present a critical review of the fundamental principles used in these technologies and discuss their performance. We also give context to how CTC isolation technologies enable downstream analysis of selected CTCs in terms of detecting genetic mutations and gene expression that could be used to gain information that may affect patient outcome.
TOC image

1. Circulating tumour cells – A biological context
Cancer metastasis causes 90% of all cancer-related deaths.1,2 The metastatic process occurs via cancer cells released from the primary tumour or metastatic sites and can circulate through the lymphatic system or in the peripheral blood (circulating tumour cells – CTCs), then potentially invade and colonize a distal site, seeding the metastases that can lead to patient death.1,3–5
It has been theorized that CTCs can undergo an epithelial-to-mesenchymal transition (EMT), where tumour cells lose their epithelial character and morph into a mesenchymal type cell.6,7 CTCs in the EMT state are more mobile and capable of escaping the tumour; some remain viable during circulation; have the ability to invade distal tissues; and can possess stem cell capacity.6,8–13 The EMT process is also thought to be reversible so that mesenchymal CTCs can revert to an epithelial cell, which has been shown to be critical for metastasis.14–16 Thus, CTCs with an intermediate epithelial-mesenchymal character have been suggested to be effectors of metastasis.17,18
Detecting metastasis is an important step in diagnosing tumour stage and predicting survival.19,20 Current imaging techniques are not capable of identifying early micro-metastases or small clusters of tumour cells due to their size.3,21–23 Bone marrow has also been utilized as a source of disseminated tumour cells.3,20 However, unlike blood draws, bone marrow biopsies are highly invasive and not suitable for routine and frequent testing of the patient’s cancer.24
The selection of CTCs directly from blood (i.e., liquid biopsy) has received significant attention as a minimally invasive test that could serve as a screening tool for cancer and/or provide a frequent insight into the effectiveness of chemotherapy. This liquid biopsy could be especially beneficial for monitoring cancers that are anatomically inaccessible or have a high risk of post-biopsy complications, such as pancreatic ductal adenocarcinoma (PDAC) and lung cancer. Additionally, molecular profiling of CTCs can help identify drug resistance prior to implementing a therapy regimen – e.g., therapies targeting the epidermal growth factor (EGFR) are not suitable for patients with a mutated KRAS gene.25 Potentially, further molecular or proteomic analysis of CTCs could aid in the discovery of new therapeutic targets for precision medicine.18
Numerous technologies have been developed over the past decade to isolate CTCs from blood. The primary challenge in CTC analysis has been the low abundance of CTCs (1–3,000 CTCs/mL)26 against the high background of blood cells (109 red blood cells (RBCs)/mL; 107 white blood cells (WBCs)/mL).27 CTCs must be discerned by a unique property that specifically differentiates CTCs from blood cells. This can be a biological marker, such as a unique protein signature, or a physical property, such as cell size.
The identification of a CTC-specific marker is complicated by inter-patient and intra-patient heterogeneity in tumour biology, particularly with respect to EMT.18 For example, CTCs were initially defined as negative for the WBC-specific CD45 surface protein and positive for the epithelial cell adhesion molecule (EpCAM) surface protein and cytokeratin (CK) cytoskeletal proteins. Yet recent studies have identified mesenchymal CTCs that do not fit this definition due to EMT downregulation of EpCAM and CK markers.28–30
In this review, we focus on CTC analyses from a technological and material perspective. Because the underlying mechanisms employed by technologies, especially microfluidic ones, and the associated materials used for their construction are extremely diverse, it has become increasingly difficult to gain a clear perspective on evaluating and comparing the performance of different CTC selection platforms.18 For this reason, we have focused this review on different microfluidic technologies for CTC analysis developed over the past decade and the materials from which they were generated.
Microfluidics are comprised of fluid channels typically <100 μm in size and allow for the accurate manipulation of cells. For CTC analysis, this can be used to carefully control the interaction of blood cells with CTC-specific recognition elements immobilized along the microfluidic surfaces, such as antibodies (Abs). Further, by conducting the CTC selection assay within a microfluidic device, the assay can be automated and packaged in a low-cost, sample-in-answer-out format to realize point-of-care testing.
Microfluidics, however, suffer from CTC-specific challenges. For example, the high surface-to-volume ratio in microfluidic channels requires special attention to engineer devices that reduce non-specific artifacts, especially when dealing with whole blood.31 This has led to the development of unique materials, surface chemistries, bioassay designs, and microstructures for CTC analysis. An additional challenge is that microfluidics, as its name implies, analyzes extremely small volume sizes (pL – nL) and thus, can be incompatible with high throughput processing of 1–7.5 mL blood samples, which is required for searching for rare cells based on sampling statistics.
We could not exhaustively cover every technology in the literature due to the field’s sustained acceleration – ~650 microfluidic-based articles regarding CTCs were reported in 2016 alone (Fig. 1). Therefore, of the publications available at the time of this manuscript’s submission, we will focus on representative technologies with significant clinical demonstrations that illustrate the fundamental principles of CTC isolation technologies, such as microfluidic architecture design, the choice of material, and their impact on device performance. We will also highlight how aspects of these technologies enable a number of downstream analyses that can be performed using CTCs, which extends the information content of CTCs beyond enumeration (Fig. 2). It is also interesting to note that CTC technologies can be adapted to other rare cell selection applications such as detection of circulating myeloma cells (CMCs) and circulating leukemic cells (CLCs).24,32–34
Figure 1.
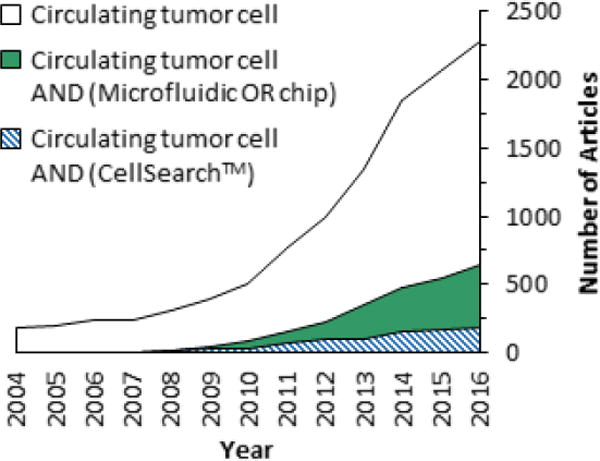
A Scopus survey of articles published from 2004 to 2016 that reference CTCs in general or specifically the subject of CTCs and CellSearch™ or microfluidics. Scopus results were restricted to articles only and used the fields specified in the legend.
Figure 2.
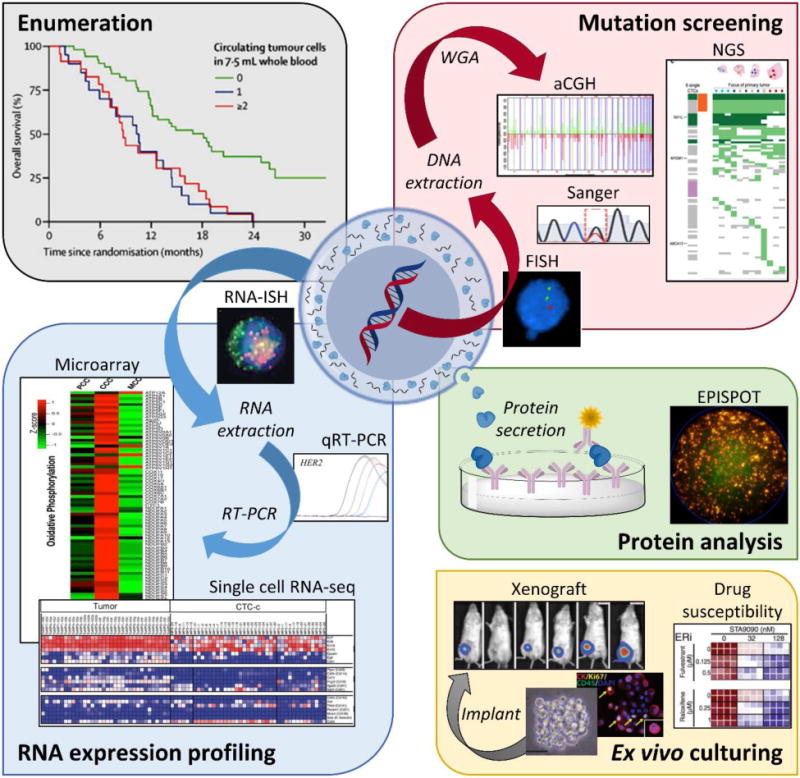
Applications of CTC analyses including enumeration,258 genomic mutation screening (FISH,34 Sanger sequencing,41 aCGH,218 and NGS),97 RNA expression profiling (RNA-ISH,28 qRT-PCR,259 expression microarrays,231 and single cell RNA-seq),260 protein analysis (EPISPOT),261 and ex vivo culturing (CTC expansion, xenograft models, and drug susceptibility).111 Adapted from Pantel and Speicher.215 Abbreviations: FISH – fluorescence in situ hybridization; WGA – whole genome amplification; aCGH – array comparative genomic hybridization; NGS – Next Generation Sequencing; RNA-ISH – fluorescence RNA in situ hybridization; qRT-PCR – quantitative reverse transcription polymerase chain reaction; EPISPOT – epithelial immunospot. Figure panels reproduced from reference41 with permission from Wiley, copyright 2015; reference218 with permission from Elseveir, copyright 2009; reference97 with permission from Nature Publishing Group, copyright 2014; reference28 with permission from The American Association for the Advancement of Science, copyright 2013; reference231 with permission from Nature Publishing Group, copyright 2014; and reference111 with permission from The American Association for the Advancement of Science, copyright 2014.
2. Properties of CTCs
Isolation technologies can exploit either the CTCs’ biological and/or physical properties to discriminate them from highly abundant RBCs and WBCs. Biological properties are, for example, the expression of proteins not expressed in other blood components. Technologies employing physical properties seek to discriminate CTCs based on size, deformability, density, or dielectric properties, amongst others. Some technologies have emerged that exploit a combination of properties (i.e., hybrid systems), and we will provide examples of such systems.
2.1. Biological properties
The ubiquitous biological property used for CTC isolation is the presence of EpCAM. Circulating EpCAM(+) cells are generally absent in the blood of healthy donors and patients with non-malignant diseases with only few exceptions,35 and this affords technologies that use Abs or aptamers to affinity-select CTCs with high specificity. The resultant purity of the CTC isolate depends on subtle aspects in the selection process that will be discussed throughout this review.
EpCAM-based CTC selection was first employed by the CellSearch™ CTC Test26 and followed by microfluidic approaches.36 The most recent research has documented, however, the presence of clinically relevant CTCs that express low levels of or do not express EpCAM, namely those with mesenchymal or stem cell characteristics.28,29 Thus, a number of additional markers in addition to EpCAM, including N-Cadherin, O-Cadherin, VCAM-1, ICAM-1, CEA, hMUC1, EphB4, CD44, CD133, CD146, PSMA, HER2, EGFR, TROP-2, and FAPα have been explored for CTC selection.28,29,37–41 Some of these markers lack specificity due to expression on normal blood cells, benign cells, and/or endothelial cells, while other markers are co-expressed with EpCAM and thereby provide little additional benefit to the assay.40,42,43 Other markers are specific for a certain cancer type, such as the prostate specific membrane antigen (PSMA) for prostate cancer.29
Yu et al. targeted EpCAM, EGFR, and the human epidermal growth factor receptor 2 (HER2) to simultaneously select epithelial and mesenchymal CTCs from breast cancer patients using a herringbone microfluidic technology (discussed below) with 41% of patients having detectable CTC levels.28 Witek et al. recently demonstrated that the fibroblast activation protein-α (FAPα) was a highly specific marker for mesenchymal CTCs and demonstrated high orthogonality to EpCAM selection (90% of CTCs did not co-express EpCAM and FAPα). Using the sinusoidal microfluidic device (discussed below), the authors detected CTCs in 100% of patients with ovarian, colorectal, prostate, and pancreatic cancers and 80% of breast cancer patients.29 Such results strongly suggest that assays exclusively selecting EpCAM(+) CTCs are not adequate.
2.2. Physical properties
CTCs can be discriminated using microfluidics from blood cells via their unique physical properties, e.g., size, deformability, density, or dielectric properties.44,45 In general, physical-based technologies isolate CTCs with reduced assay time compared to biological enrichment but at a cost of lower purity, which can complicate CTC identification and deter molecular analyses.
Physical-based separations are in most cases independent of epithelial, mesenchymal, or stem cell biological properties. Dielectrophoretic properties of CTCs have been shown to be fairly constant over 80 cancer cell lines, including those of a mesenchymal phenotype.46 However, mesenchymal CTCs have high cell deformability due to changes in the cytoskeletal proteins and have an increased likelihood of passing through physical entrapments, which may provide bias for epithelial CTC recovery.47,48 The consistency of CTC size, once thought to be 15–25 μm in diameter,49 has also been called into question with CTC clusters exceeding 25 μm50 and evidence of “small” CTCs similar in size to WBCs.27,51–56 Size discrimination also limits the translation of these technologies to blood-based cancers such as leukemia and myeloma due to the fact that their size is similar to WBCs.24,32,33
Lastly, we note that even if a technology exploits a physical property of the target, it is still necessary to confirm CTC identity by immunostaining due to the high WBC background. Immunostaining uses fluorescent Abs to target biological markers. A microfiltration technology achieved clinical sensitivities of 33–97% when surveying CK(+) CTCs, but the inclusion of mesenchymal markers Vim and FAPα increased these clinical sensitivities to 67–100%.57
2.3. Figures-of-merit for CTC technologies
To draw an informative comparison between CTC isolation technologies, the following figures-of-merit will be used:
Recovery: the assay’s efficiency in selecting CTCs.
Purity: the ratio of CTCs to the total number of cells in the isolate.
Throughput: the volumetric rate for processing blood samples.
Clinical sensitivity: the assay’s ability to correctly identify patients with the disease.
Clinical specificity: the assay’s ability to avoid false positives for patients without the disease.
Clinical yield: The median number of CTCs isolated from patients with a defined cancer type and stage.
We have compiled a table comparing several technologies based on these figures-of-merit (Table 1). It should be noted that there are discrepancies in how some figures-of-merit are defined. Some reports define purity as the ratio of CTCs to WBCs in the isolate, which would yield higher purities than if defined herein. Some reports normalize clinical CTC yields to 7.5 mL blood, others to 1 mL. The majority of studies report clinical yields as median and ranges of CTC counts rather than averages and standard deviations to reflect the non-Gaussian nature of small sample sizes. Moreover, not all of these metrics were reported in text but only graphically. Thus, we have taken care to convert the reported figures-of-merit to the same definition and extracted data from published graphs via image processing. Because these figures-of-merit are unique to the CTC field, we will provide further definition here.
Table 1.
Figures-of-merit and results from clinical studies for representative technologies that isolate CTCs by biological and/or physical properties, and demonstrations of CTC analyses beyond enumeration.
| Technology (Principle) |
Target | Throughput | Recovery | Purity [WBCs/mL] |
Clinical Studies | Beyond Enumeration* | References** | ||||||
|---|---|---|---|---|---|---|---|---|---|---|---|---|---|
| Cell Line† | Medium | Efficiency | Cancer type‡ | Range (Median) CTCs/mL | Sensitivity | ||||||||
|
CellSearch™ (Biological) |
Ab-EpCAM | NA - Dedicated laboratories | SKBR3+++ T47D+++ BT20++ MDA-MB-231+ |
Blood (CellSave™) |
≥85% 75% 44% 12% |
CTC Test:
0.01–0.1% [103–104] Profile Kit: 21–95% [200–1000] |
CTC Test | Profile Kit |
CTC
Test Molecular (FACS or single cell picking + CNV sequencing) Profile Kit Molecular (RT-PCR, Sanger) Cytogenetics (FISH) |
26,78,79,87,216,222,226,264–266 | |||
| M-Breast (N=75) | 0–57 (4) | 4–2432 (116) | NR | ||||||||||
| NSCLC (N=71) | 0–53 (4) | 5–1801 (145) | |||||||||||
| Others (N=90/52) | 0–10 (NR)/0–17 (NR) | 12%/63% | |||||||||||
| CTC Test | |||||||||||||
| M-Breast (N=422) | 0–3150 (11 mean) | 26% | |||||||||||
| M-Colorectal (N=196) | 0–14 (0.1 mean) | 17% | |||||||||||
| M-Lung (N=99) | 0–290 (4 mean) | 14% | |||||||||||
| M-Ovarian (N=29) | 0–14 (0.8 mean) | 23% | |||||||||||
| M-Pancreatic (N=16) | 0–4 (0.3 mean) | 5% | |||||||||||
| M-Prostate (N=123) | 0–435 (10 mean) | 41% | |||||||||||
| Non-cancer (N=199) | 0–0.4 (0 mean) | – | |||||||||||
| Healthy (N=145) | 0–0.1 (0 mean) | ||||||||||||
|
| |||||||||||||
|
CTC Chip
(Biological) |
Ab-EpCAM | 1 mL/h | H1650++++ SKBR3+++ PC3++ T24+ |
PBS | 76±8% 74±5% 80±6% 76±7% |
34±8% [233–9000] |
Breast (N=10) | 5–176 (78) | 100% |
Clinical Molecular (RT-PCR, EGFR mutations) |
36,267 | ||
| Colon (N=10) | 0–375 (57) | 90% | |||||||||||
| NSCLC (N=55) | 5–1281 (73) | 100% | |||||||||||
| Pancreatic (N=15) | 9–831 (120) | 100% | |||||||||||
| L-Prostate (N=7) | 25–174 (103) | 100% | |||||||||||
| M-Prostate (N=19) | 16–292 (50) | 100% | |||||||||||
| Healthy (N=20) | 0–0 (0) | – | |||||||||||
|
| |||||||||||||
|
GEDI Micropillar
Chip
(Biological and Physical - Size) |
Ab–PSMA | 1 mL/h | LNCaP++++ | PBS Blood |
97±3% 85±5% |
62±2% [10] |
Prostate (N=4) | NR (27 ±4 mean) | ND** |
Cell
line Molecular (RT-PCR, NGS CNV sequencing from single nuclei) Drug susceptibility (on-chip culture) |
39,49,73,137,138,268 | ||
| Prostate (N=30) | 0–1200 (54) | NR | |||||||||||
| Healthy (N=10) | 0–22 (3) | – | |||||||||||
| Ab-EpCAM/ hMUC1 |
Capan-1+++ PANC-1++ |
PBS | 70±3% 61±3% |
NR | PDAC (N=1) | 102–135 (NA) | – | ||||||
| Ab-EpCAM | ND | NR | PDAC (N=11)*** | 0–59 (9) | 73% | ||||||||
| Cystic lesion (N=21)*** | 0–22 (0) (4 mean) | 33% | |||||||||||
| Healthy (N=19)*** | 0–3 (0) | – | |||||||||||
| Ab-HER2 | SK-BR-3+++ | Blood | 78±22% | NR | M-Breast (N=5) | 31–115 (74 mean) | ND° | ||||||
| MCF-7++ | 25±6% | M-Gastric (N=4) | 33–224 (120 mean) | ||||||||||
| MDA-MB-468− | 6±13% | Healthy (N=3) | NR-NR (5 mean) | – | |||||||||
|
| |||||||||||||
|
Sinusoidal
Chip (Biological) |
Ab-EpCAM/ Ab-FAPα |
1.5 mL/h |
EpCAM SKBR3+++ SKBR3+++ FAPα Hs578T++ Hs578T++ |
Blood PBS Blood PBS |
77±2% 85±4% 75±8% 76±8% |
~90% [3±3] |
EpCAM | FAPα |
Clinical CTC release (enzymatic) Molecular (RT-PCR, PCR-LDR, Sanger) Cytogenetic (FISH) Cell line Expansion (culture) Antigen expression (Flow cytometry) |
24,29,31,34,74,159 | |||
| M-Breast (N=10) | 1–278 (48) | 0.5–179 (24) | 80% | ||||||||||
| M-Colorectal (N=5) | 7–111 (17) | 10–280 (24) | 100% | ||||||||||
| M-Ovarian (N=9) | 42–680 (100) | 4–137 (32) | 100% | ||||||||||
| CR prostate (N=5) | 2–39 (9) | 13–27 (18) | 100% | ||||||||||
| M-PDAC (N=11) | 4–105 (20) | 6–83 (17) | 100% | ||||||||||
| Non-cancer (N=6) | 0.5–4 (3) | 0–4 (2) | – | ||||||||||
| Healthy (N=11) | 0–1 (0) | – | – | ||||||||||
| Ab-EpCAM | L-PDAC (N=4) | 9–19 (11) | – | 100% | |||||||||
|
Clinical
Recoveries EpCAM: M-PDAC (N=3) FAPα: M-PDAC (N=3) |
87±2% 79±7% |
M-PDAC (N=4) | 9–95 (51) | – | 100% | ||||||||
| Healthy (N=4) | 0–2 (0) | – | – | ||||||||||
| PDX-PDAC† | |||||||||||||
| Pre BKM120 (N=8) | 28–254 (106) | – | 100% | ||||||||||
| Post BKM120 (N=8) | 0–317 (9) | – | 63% | ||||||||||
| Pre vehicle (N=4) | 17–172 (94) | – | 100% | ||||||||||
| Post vehicle (N=8) | 22–582 (48) | – | 100% | ||||||||||
| No tumour (N-5) | 0–4 (0) | – | – | ||||||||||
| Ab-CD33/CD34/CD117 | KG-1++++ | PBS | 64±4% | 88–99% specificity | AML (N=39) | 0–2684 (90) | 79%– | ||||||
| Healthy (N=3) | 0–4 (1) | ||||||||||||
|
| |||||||||||||
|
Herringbone
Chip (Biological) |
Ab-EpCAM | 1–1.5 mL/h | SKBR3+++ PC3++ MDA-MB-231+ |
Blood | 97±1% 92±5% 3±1% |
14±0.1% [~5600] |
M-Prostate (N=15) | 0.6–3168 (63) | 93% |
Clinical CTC release (enzymatic, mechanical, thermal) Molecular (RT-PCR, Sanger, NGS RNAseq) Cell line Cytogenetic (FISH) Expansion (culture) |
28,41,65,75,141,142,174,269 | ||
| Healthy (N=10) | 0–8 (1) | – | |||||||||||
| L-Prostate (N=19) | 38–222 (95), PSA+ | 56% | |||||||||||
| M-Prostate (N=36) | 14–653 (32), PSA+ | 64% | |||||||||||
| M-Prostate (N=25) | 0–165 (7), PSA+/PSMA+ | 72% | |||||||||||
| NB508 | Blood | 35±3% | 1.7±2.1% | Pancreatic mouse model | 20–5469 (310) | – | |||||||
| Ab-EpCAM/ HER2/EGFR |
PC3 MDA-MB-231 |
Blood | 94±2% 94±2% |
NR | Breast (N=17) Breast (N=8) Lung (N=8) Healthy (N=6) |
0-NR (NR) 0–45 (4) 0–5 (4) 0–0.9 (0.1) |
41% 88% 88%- |
||||||
| 12 Ab mixture | SK-MEL-28 | Blood | 90% | 0–0.77% | Melanoma (N=41)‡ | 0–53 (3) | 79% | ||||||
| Healthy (N=10) | 0–0.8 (0.4) | – | |||||||||||
|
| |||||||||||||
|
Si
Nanopillar Chip (Biological) |
Ab-EpCAM | 1 mL/h | MCF-7++++ PC3++ T24+ |
Blood | >95% | ND | L-Prostate (N=2) | 0–3 | ND† |
Clinical CTC release (thermal) Molecular (Single cell WGA and Sanger, NGS WES, NGS WGS) Cell line Expansion (culture) |
52,128,147,148,150,167 | ||
| M-CS Prostate (N=20) | 0–3 (1) | ND† | |||||||||||
| M-CR Prostate (N=14) | 0–33 (3.5) | ND† | |||||||||||
| L-Prostate (N=31) | 0–10 (0.9 mean) | ND‡ | |||||||||||
| M-Prostate (N=117) | 0–21 (2.4 mean) | ND‡ | |||||||||||
| Healthy | ND | – | |||||||||||
| Lysis and biotin-Ab labelling then 1 mL/h | CFPAC-1++++ AsPC-1+++ BxPC-3++ PANC-1++ |
Blood | 93±4% 88±2% 86±3% 65±5% |
ND | PDAC – Stage 1 (N=3) | 0–0 (0) | 0% | ||||||
| PDAC – Stage 2 (N=28) | 0–1.5 (0.25) | 61% | |||||||||||
| PDAC – Stage 3 (N=14) | 0–2.25 (0.25) | 79% | |||||||||||
| PDAC – Stage 4 (N=27) | 0–12 (1.25) | 96% | |||||||||||
| Non-PDAC (N=28) | 0–0.25 (0) | 4%* | |||||||||||
|
| |||||||||||||
|
Ephesia
Chip (Biological) |
Ab-EpCAM | RosetteSep WBC removal then 3 mL/h | MCF-7++++ SKBR3+++ PC3++ A549+ |
PBS | >90% >90% 79±7% 19±7% |
NR [<100] | M-Breast (N=5)** | 0–35 (7) | 75% | CTC release
(magnetic) Cell line Molecular (qPCR) Expansion (culture) |
60 | ||
| M-Prostate (N=8)** | 0–5 (2) | 80% | |||||||||||
| Healthy (N=10) | 0–0 (0) | – | |||||||||||
|
| |||||||||||||
|
Velocity
valley (Biological) |
Ab-EpCAM | Labelling then 0.6–2 mL/h*** | VCaP++++ SKBR3+++ |
PBS | 97±4% 95±3% |
4–19%
[75–400]° |
Prostate (N=21) | 14–116 (43) | 100% | CTC release (magnetic,
aptamer anti-sense) Cell line Integrated chemotaxis assay |
114,115 | ||
| Healthy (N=3) | 0–0 (0) | – | |||||||||||
| VX2 cell line xenograft (N=6) | 3–26 (17) | – | |||||||||||
|
Magnetic
ranking (Biological) |
Labelling then 0.6 mL/h | SKBR3+++ PC3++ MDA-MB-231+ |
Blood (CellSave™) | 97±3% 90±2% 90±3% |
4–5% [2000] |
L-Prostate (N=14)°° | 2–10 (4) | 100% | 118,119 | ||||
| M-CR-Prostate (N=10)°° | 1–5 (2) | 100% | |||||||||||
| Healthy (N=9)°° | 0–0.6 (0.2) | – | |||||||||||
|
| |||||||||||||
|
Micro-Hall (Biological) |
Ab-EpCAM/ HER2/EGFR/ MUC1 |
~3 h assay time | MDA-MB-231+ | Lysed and concentrated blood | 90% | NA Detection only |
Breast, stage IIIC (N=9) | 0.4–25 (7) | 91% | – | 121 | ||
| Breast, stage IV (N=11) | 1.5–31 (8) | ||||||||||||
| Healthy (N=15) | 0–1 (NR) | – | |||||||||||
|
| |||||||||||||
| Halloysite Nanotubes (Biological) | Ab-EpCAM/ PSMA + E-selectin |
Ficoll then 4.8 mL/h |
ND (~50% efficiency selecting KG1a++++ cells via CD34 selection) |
50–80% [3–60]°°° |
Breast (N=3) | 17–60 (60) | 100% |
Clinical Short term culture, drug susceptibility |
153,154 | ||||
| Lung (N=2) | 11–31 | 100% | |||||||||||
| Other cancers (N=2) | 13–30 | 100% | |||||||||||
| Healthy (N=8) | 0–4 (0) | – | |||||||||||
| BT20++++ | Buffy coat | 82±19% | NR | M-Breast (N=3)°°°° | 1495–2534 (2534) | 100% | |||||||
| M-Prostate (N=2)°°°° | 3155–53370 | 100% | |||||||||||
| M-Colorectal (N=1)°°°° | 1039 | 100% | |||||||||||
| M-Renal (N=1)°°°° | 4951 | 100% | |||||||||||
| Healthy (N=4) | 6.6±9 | – | |||||||||||
|
| |||||||||||||
|
iChip (Biological + Physical) |
Ab-EpCAM +
size (posiChip) |
Labelling then 8 mL/h |
SKBR3+++ PC3-9++ MDA-MB-231+ MCF10A-LBX1+/− |
Blood | 99±4% 90±5% 78±8% 11 ±3% |
0.02–43% [1500] | M-Breast (N=12) | 0–3.7 (0.4) | 42% |
Clinical
–posIchip Molecular (RT-PCR, Sanger) Clinical –negIchip Molecular (RT-PCR, Single cell RNA-seq, RNA-ISH, FISH) Expansion (3D culture, drug susceptibility, xenograft) Proteomics (Multiplexed mass spectrometry) |
21,107,111,145,232,270 | ||
| M-Colorectal (N=2) | 0.3–1.1 | 50% | |||||||||||
| M-Lung (N=2) | 0–1.2 | 50% | |||||||||||
| M-Pancreatic (N=6) | 0–1.4 (0.5) | 50% | |||||||||||
| M-Prostate (N=20) | 0–611 (1.4) | 75% | |||||||||||
| CR-Prostate (N=41) | 0.5–610 (3.2) | 90% | |||||||||||
| Healthy (N=13) | 0–0.3 (0.2) | – | |||||||||||
| Ab-CD45/ CD15/CD66b + size (negiChip) |
MCF10A MCF10A-LBX1 NB408 |
Blood | 97±2% 97±2% 95±3% |
<0.1% [32000] |
Glioblastoma, progressive (N=23) | 0–33 (12) | 58% | ||||||
| Glioblastoma, stable (N=43) | 0–30 (2) | 29% | |||||||||||
| Healthy (N=6) | 0–6.4 (1.9) | – | |||||||||||
| Pancreatic mouse model (N=11) | 0–1694 (118) | NR | |||||||||||
| M-Breast (N=19)† | 0.2–43.5 (1.6) | 81% | |||||||||||
|
| |||||||||||||
|
ApoStream™ (Physical) |
DEP | ~1 h assay time | SKOV3 MDA-MB-231 4–23 cells spiked |
Blood + Ficoll | 75
±3% 71 ±2% 68 ±10% |
~0.1–1%‡ [~10000] |
L-Breast (N=47)* | 0–5.7 (0.6 mean) | 54% |
Clinical Molecular (ice-COLD-PCR) Cytogenetic (FISH) |
66,209–214 | ||
| M-Breast (N=167)* | 1–2000 (29) | 93% | |||||||||||
| M-Pancreatic (N=18)* | 0–9 (2)** | 61% | |||||||||||
| Renal cell carcinoma (N=23)* | 0–5 (0.8) | 30% | |||||||||||
| M-NSCLC adenocarcinoma (N=14) | 0.4–64.9 (9.2) | 79%*** | |||||||||||
| M-NSCLC squamous (N=6) | 0–0.5 (0) | 0%*** | |||||||||||
| M-Ovarian (N=6) | 0–0.7 (0.3) | 0%*** | |||||||||||
| M-Breast (N=20) | 0–4.8 (0.8) | 15%*** | |||||||||||
| Healthy (N=20) | 0–1.9 (0.3) | –** | |||||||||||
|
| |||||||||||||
|
Dean
Flow Fractionation (Physical) |
Size Deformability |
3 mL/h | HeLa,
MDA-MB-231, MCF-7 |
0.5X blood | 85% | 7±9%° [440±320] |
M-Lung (N=20) | 5–88 (31) | 100% |
Cell
line Expansion (culture) Clinical Molecular (ice-COLD-PCR, Sanger) Cytogenetic (FISH) |
206,207 | ||
| Healthy (N=20) | 0.3–1.3 (0.7) | – | |||||||||||
| Lysis then 12 mL/h |
MCF-7, MDA-MB-231, T24 | Lysed and 2X concentrated blood | 71–88% | 0.1–86%°° [9–29824] |
Lung (N=15) | 12–459 (97) | 100% | ||||||
| Breast (N=15) | 12–322 (44) | 100% | |||||||||||
| Healthy (N=10) | 0–7 (NR) | – | |||||||||||
|
| |||||||||||||
|
Vortex
Chip (Physical) |
Size Deformability |
24 mL/h (Vortex) | MCF-7 M395 PC-3 |
0.1X blood | 8–26% ~20% 9±1% |
57–95% [1–13] |
Breast (N=4) | 3–7 (5) | 50% |
Cell
line Molecular (RT-PCR) Expansion (culture) |
56,204,271 | ||
| Lung (N=8) | 3–42 (26) | 88% | |||||||||||
| Healthy (N=4) | 2–5 (3) | – | |||||||||||
| 24 mL/h† (Vortex HT) |
MCF-7 | 0.1X blood | 28–37%‡ | 20±14% [1–93] |
M-Breast (N=22)* | 0.8–23.8 (4.1) | 86% | ||||||
| M-Lung (N=15)* | 0.5–24.2 (3.5) | 73%** | |||||||||||
| Healthy (N=10) | 0.0–1.3 (0.5) | – | |||||||||||
|
| |||||||||||||
|
2D Parylene
Microfilters (Physical) |
Size Deformability |
Fixation then 225 mL/h |
J82/ T24/ MCF-7/ SK-BR-3/ MDA-MB-231 |
0.5X blood + 1% formalin | NR; ≥1/5 cells recovered in 28/29 tests | NR | M-Bladder (N=6) | 0–6 (0) | 50% |
Clinical Molecular (qPCR telomerase activity) Expansion (fibroblast culture) |
57,80,196,200 | ||
| M-Breast (N=11) | 0.1–8 (3) | 100% | |||||||||||
| M-Colorectal (N=12) | 0–3 (1) | 83% | |||||||||||
| M-Prostate (N=28) | 0–24 (9) | 96% | |||||||||||
| Healthy (N=10) | 0–0 (0) | – | |||||||||||
| Fixation then 200 mL/h | CAF-23 | 0.5X blood + 1% formalin | 95±3% | NR | CK(+) | FAPα(+) | |||||||
| L-Breast (N=13) | 0–1.9 (0.4) | 0–0.3 (0) | 85% | ||||||||||
| M-Breast (N=34) | 0–13.1 (1.7) | 0–15.6 (0.5) | 100% | ||||||||||
| M-Colorectal (N=6) | 0–37.9 (0.3) | 0.1–3.7 (0.5) | 100% | ||||||||||
| L-Prostate (N=3) | 0–0.1 (0) | 0–0.4 (0.1) | 67% | ||||||||||
| NR | PC3 | Blood + Ficoll | 71±11% | ~0.1%*** [103] |
M-CR Prostate (N=215) | NA – High telomerase activity was detected in 48% of patients | |||||||
| DU145 | 68±8% | ||||||||||||
|
| |||||||||||||
|
3D PEGDA
Microfilters (Physical) |
Size Deformability |
6 mL/h | MCF-7 HT29 U87 |
PBS | 98±1% 90±3% 62±5% |
~0.01–0.1%° [800–8000] |
Healthy (N=7) | 0–0 (0) | 0–0 (0) | – | 197 | ||
| M-Lung (N=8) | 0–3 (1) | 75% | |||||||||||
| M-Other cancers (N=6) | 0–1 (0.5) | 67% | |||||||||||
| Healthy (N=6) | 0–0 (0) | – | |||||||||||
|
| |||||||||||||
| Cluster chip (Physical) | Size (CTC clusters) |
2.5 mL/h |
MDA-MB-231 ≥4 cells in cluster 3 cells 2 cells 1 cell |
Blood | >90% 70% 41% 0% |
NR (only relative purity reported) | Breast (N=27) Melanoma (N=20) Prostate (N=13) |
Clusters/mL NR (0.5 mean) NR (0.2 mean) NR (0.3 mean) |
41% 30% 31% |
Clinical Molecular (RT-PCR-NGS) |
50 | ||
Cell line antigen expression: −no detectable expression,
1000–15000 (low),
15000–50000 (moderate),
50000–150000 (high),
>150000 (very high) molecules per cell.
Abbreviations: AML (acute myeloid leukemia), CR (castration resistant), CS (castration sensitive), L (localized), M (metastatic), NSCLC (non-small cell lung cancer), PDAC (pancreatic ductal adenocarcinoma), PDX (patient derived xenograft), SCCHN (squamous cell carcinoma of the head and neck).
Only abbreviation not in main text: FACS (fluorescence activated cell sorting).
Some data is not reported (NR), not determined (ND), or not applicable (NA) to the technology.
CTCs were detected in 90% of clinical samples, but thresholds for positivity were not established from controls.
Peripheral blood samples were collected in CellSave™ tubes.
CTCs were detected in 100% of clinical samples, but thresholds for positivity were not reported from controls.
PDAC-PDX mouse models were treated with BKM120, a phosphatidylinositol-3-kinase inhibitor, versus vehicle control.
Patients were in treatment. A median (range) CTC count/mL was 10 (4–53) for pre-treatment patients (N=21) with 100% clinical sensitivity.
CTCs were detected in 1/2 (50%), 6/10 (60%), and (93%) for L-, M-CS, and M-CR prostate cancer samples, respectively.†,
Thresholds for positivity were not established from controls.
Clinical sensitivity was established at a threshold of 1 CTC per 4 mL; 1/28 non-adenocarcinoma controls detected positive for CTCs (96.4% specificity).
Reported CTC counts were normalized to a 7.5 mL blood draw, but the volume processed for each sample was not explicitly reported by the authors.
In two reports,117,119 RBCs were lysed, and WBCs were removed by magnetic negative affinity-selection against CD15 before anti-EpCAM labelling.
From prostate patients (N=5), 74±22 WBCs/mL were observed at 19% purity by Mohamadi, et al.114 For the VX2 cell line rabbit xenograft,115 ~400 WBCs/mL were observed (0.4% WBC recovery assuming 106 WBCs/mL). Purity for Muhanna, et al115 was calculated to be 4% using 400 WBCs/mL and the median of 17 total CTCs/mL observed in xenograft samples.
Peripheral blood samples were collected in CellSave™ tubes.
Purity was assessed by counting EpCAM(−)/DAPI(+) cells 5 days after isolation.
Patients had advanced, stage IV disease.
To retain viability, CTCs were identified by immunostaining against EpCAM and HER2 only.
The authors reported a 99.33 ±0.56% reduction in WBC counts and assumed 1600000 WBCs/mL (10720 ±8960 WBCs/mL). Dividing the highest median CTC count reported by this number yielded a purity of 0.3 ±0.3%.
CTC counts reported in this table were normalized to a 7.5 mL blood draw, but the volume processed for each sample was not explicitly reported by the authors.
The authors only stained for CK and CD45, noted a large number of cells that did not stain for either marker, and suggested the presence of abundant mesenchymal CTCs.
Without taking into false positives from healthy donors, 100%, 33%, 83%, and 95% of patients with M-NSCLC-adenocarcinoma, M-NSCLC-squamous, M-ovarian, and M-breast cancers, respectively, had at least 1 CTC detected per sample. However, if thresholds for positivity are established by either the maximum number of CTCs detected in a healthy patient (1.9 CTCs/mL) or mean + 3 standard deviations (1.8 CTCs/mL), 79%, 0%, 0%, and 15% of these patients tested positive for CTCs by the assay.
A ratio of CTCs/WBCs of ~10% and background cell counts of 441 ±320 WBCs/mL were reported.206 By dividing the highest reported median CTC count by the average WBC count yielded a purity of 6.6 ±8.8%.
Both CTC counts and WBC counts (5246 ±6575 WBCs/mL) were reported for each sample, and the range reported is derived directly from this data. Average purity was 9 ±19%.207
In a third generation device, Vortex High Throughput (Vortex HT), the chip’s architecture was altered for improved trapping dynamics, and volumetric throughput was doubled to 48 mL/h. However, each sample was processed through the chip twice to improve recovery, reducing effective throughput to the original 24 mL/h.
Recovery values reflect two rounds of processing, as was performed for clinical samples.
41% of the cells classified as CTCs were DAPI(+)/CK(−)/CD45(−) and were discriminated from WBCs solely by nuclear size (>9 μm) and nuclear-to-cytoplasmic ratio (>0.8). Lack of CK positivity (epithelial marker) was subsequently interrogated by staining for EpcAM (epithelial marker) and vimentin and N-cadherin (mesenchymal markers). 6% of all CTCs stained positive for the mesenchymal markers. Within the reported clinical data, 42% of all purported CTCs did not express any epithelial or mesenchymal markers but were classified as CTCs based on nuclear staining alone.
An 80% clinical sensitivity was reported, but lung cancer patients #14, #23, #37, and #38 had <1.25 CTCs/mL, yielding a 73% sensitivity (11/15 patients detected positive).
A 1500-fold enrichment was achieved, corresponding to a WBC level on the order of 103 WBCs/mL.
A clearance efficiency (percentage of unclogged pores per mL blood) of 96% was reported with 104–105 pores. Thus, we assumed impurities in the range of 800–8,000 WBCs/mL and calculated purity based on the highest median count of CTCs acquired from clinical samples.
2.3.1. Recovery – Translating measurements to clinical samples
All but two sets of recoveries reported in Table 1 were determined by spiking cultured cancer cells into buffer or blood, enumerating the recovered cells, and calculating recovery based on the estimated number of cells spiked. However, spiking experiments are not without shortcomings.
Spiking experiments do not account for matrix effects. Compared to buffer, blood is more viscous, exhibits non-Newtonian properties where viscosity decreases under shear, and contains a concentrated suspension of cells that can infer unpredictable cell-cell collisions.56 Even the use of healthy blood may not accurately account for cancer patients’ blood. Cancer increases blood clotting (thrombosis is the second most frequent cause of death for cancer patients),58 which depletes fibrinogen, decreases plasma viscosity, increases sedimentation rates,59 and may have significant effects on the fluid dynamics occurring during CTC selection. Chemotherapy and radiation treatment may also contribute to thrombosis and alter the production of blood cells altogether.59
Cell line recoveries are regarded as a technology’s ability to retrieve a subpopulation of clinical CTCs (e.g., highly epithelial CTCs versus CTCs in EMT transition)36,39,60 even though cell line recoveries may not directly translate to performance for highly heterogeneous CTCs from clinical samples.61 Cell lines are relatively uniform in size, phenotype, and selection antigen expression, although these parameters can vary due to culture conditions.56,62 For relevant affinity-selection assays, we have noted the cell line’s antigen expression as low (1,000–15,000 molecules per cell), moderate (15,000–50,000), high (50,000–150,000), and very high (>150,000) along with recoveries in Table 1.
Lastly, the accuracy and precision in spiking clinically relevant levels of cells (typically 1–100 CTCs/mL) is governed by Poisson statistics with 10–50% variance in the spiking process;63 our lab has observed spiking recoveries with standard deviations of 14–30%.34 Some researchers have reduced this variability by counting spiked cells on the cap of a blood sample prior to mixing63 or by using a micromanipulator to physically pick individual cells for spiking.64
Rather than relying on spike level, two methods have been devised to account for lost CTCs during spiking. One method, termed a “true mass balance”, effluent blood is collected in a shallow microfluidic channel so that pre-labelled cultured cells can be identified by fluorescence.32,50,65 While the method ensures reliability, it can be laborious requiring one to interrogate 50 cm2 (~3 microscope slides) to identify a few cells amongst 250 μL of blood,50 or ~3,000,000 blood cells,66 and the method cannot be used to assess recovery from clinical samples.
Nair et al. proposed a “self-referencing” method in which CTCs not recovered by a device are infused through an identical second device, third device, etc. The serial devices sequentially deplete all CTCs from the sample. Recoveries were shown to be similar to spiking recoveries, but variance in the measurement was reduced from 35% to 6%.34 Most critically, the self-referencing method could be used to determine recovery of patient-derived CTCs in clinical samples without prior knowledge of CTC abundance.29
2.3.2. Purity – Clarifying the metric
Purity is defined as the percent of CTCs isolated with respect to all cells (CTCs + WBCs) in the isolate. While the number of background WBCs should be approximately constant for a given surface composition, microfluidic design, and assay parameters, CTC counts and thereby purity can be heavily biased by experimental design (spiking level of cells) or in clinical samples due to disease stage. These factors can lead to a metric that is difficult to interpret. For example, consider that the following purity values were measured: (i) 10% purity with 10 WBCs/mL (1 CTC/mL),67 (ii) 38% purity with 800 WBCs/mL (500 CTCs/mL),32 (iii) 62% with 20 WBCs/mL (30 CTCs/mL),49 and (iv) 99% with 3,000 WBCs/mL (300,000 CTCs/mL).32 Given such biases, we have derived WBC counts per mL blood in addition to purity values for comparison.
2.3.3. Throughput – How much blood is necessary?
Initial studies indicated that 5–10 mL blood was needed for CTC analysis.68 The 7.5 mL benchmark was largely driven by the first FDA-approved CellSearch™ CTC Test, which set CTC positivity thresholds at ≥3–5 CTCs in a 7.5 mL blood volume.19,69,70 As detailed in Table 1 and discussed later, from a set blood volume, the number of CTCs collected by a device is intimately connected to the technology’s performance, specifically CTC recovery and clinical yield. This can require technologies with low clinical yield to process large blood volumes to collect enough material for analysis, especially molecular profiling of CTCs.
For example, intravenous CTC recovery by the Gilupi CellCollector®, an anti-EpCAM Ab-coated medical guidewire inserted in vivo into the patient’s cubital vein, established prognostic thresholds for prostate cancer patients at 3 CTCs per 1–1.5 liters of blood.71 Separately, leukapheresis has been employed to pre-concentrate CTCs in patients’ blood before analysis with the CellSearch™ CTC Test, effectively increasing the probed blood volume from 7.5 mL to 60.2 mL. For 10 PDAC patients with early and late stage cancer, ≥3 CTCs were detected in 67% and 100% of samples, respectively, with CTC pre-concentration by leukapheresis, as compared to only 17% and 50% using a standard 7.5 mL blood draw.72 Although possible, such gains are made at the cost of a more burdensome test for the patient and more elaborate workflow.18 Several newer technologies29,36,65,73–79 have achieved much higher CTC yields using a standard blood draw volume than the CellSearch™ CTC Test; on the order of 10–100 CTCs/mL (Table 1).
With the development of highly sensitive CTC isolation technologies, results suggest that only 1–2 mL of blood is needed for CTC analyses, except for studies requiring molecular analysis where more genetic material is preferred. As a final note, volumetric throughput may not reflect a technology’s sample processing throughput if the blood is pre-processed, e.g., RBC lysis or Ficoll density gradient centrifugation to obtain a concentrated suspension of WBCs and CTCs (buffy coat), both of which incur cell loss ranging from 20–33%.80–82 We have adjusted throughputs for dilutions and concentrations in Table 1.
2.3.4. Clinical specificity and sensitivity
CTC assays are typically first tested against negative controls, most commonly healthy donors or patients with benign disease.35 This data is then used to establish threshold levels above which the patients are considered positive, thereby setting clinical specificity. Cancer patients that are correctly identified as CTC positive determines the clinical sensitivity.
3. Magnetic affinity-selection – From CellSearch™ to microfluidics
3.1. Clinical utility of the CellSearch™ CTC Test
The CellSearch™ CTC Test (Fig. 3A), while not a microfluidic technology, remains the only CTC assay cleared by the FDA as a prognostic tool for patients with metastatic breast, colorectal, or prostate cancer. Blood is collected into a CellSave™ tube, which contains the anti-coagulant EDTA and a proprietary stabilizer/fixative that preserves the blood for 96 h. RBCs are removed by Ficoll centrifugation, and the buffy coat is spiked with a ferrofluid, which is a suspension of magnetic nanoparticles functionalized with anti-EpCAM Abs. Magnetically-labelled CTCs are then extracted by applying a magnetic field, immunostained against CK proteins, CD45, and the DAPI nuclear stain, resuspended in the MAGNEST® magnetic chamber, which positions CTCs on a planar surface, and imaged with a fluorescence microscope. CTCs are identified based on a particular staining pattern: CK(+)/CD45(−)/DAPI(+).26,63
Figure 3.
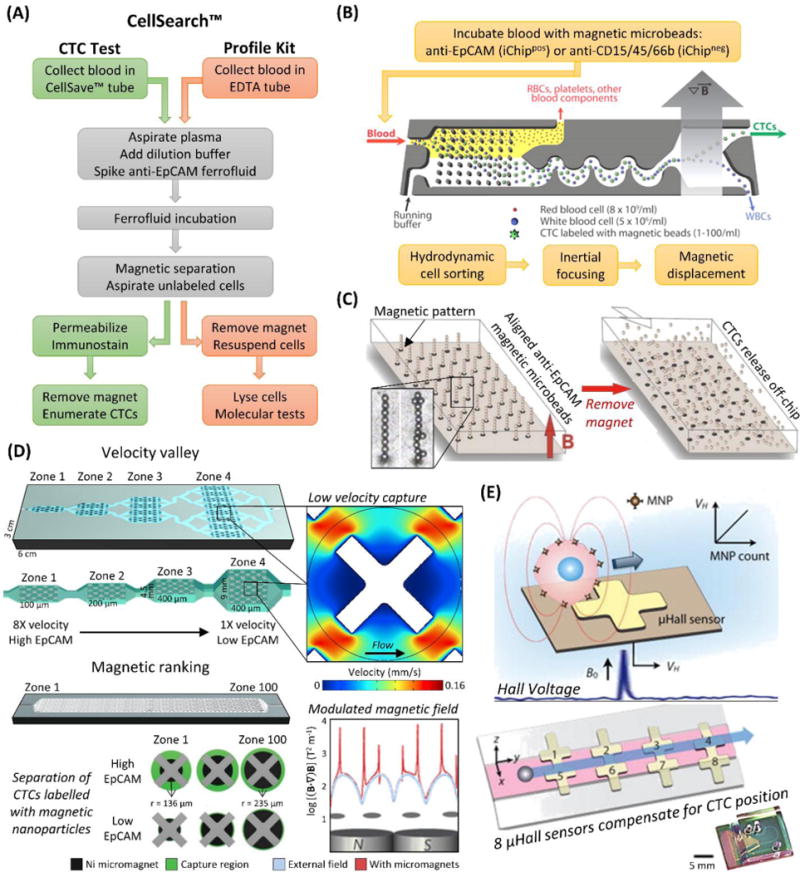
Magnetic CTC isolation technologies. (A) Workflow of the CellSearch™ CTC Test versus the CellSearch™ Profile Kit. (B) Workflow and diagram of the iChip, here shown in positive selection mode. The blood is debulked, the remaining cells are focused, and magnetically labelled cells (CTCs in positive selection mode, WBCs in negative selection) are preferentially forced into a separate outlet.107 (C) A diagram of the Ephesia microfluidic technology, which aligns anti-EpCAM magnetic microbeads into solid supports for CTC isolation that can be released by removing the magnetic field.33,60 (D) Velocity valley114,116 and magnetic ranking118 technologies for isolating magnetically labelled CTCs in zones of varying velocity or magnetic field strength, respectively, which provides phenotypic ranking of CTC antigen (e.g., EpCAM) expression in addition to enumeration. X-shaped microstructures reduce fluid velocity so magnetic forces can provide efficient CTC recovery. (E) The μHall device detects CTCs labelled with magnetic nanoparticles passing over a μHall sensor, which induces a voltage proportional to antigen expression. The sample stream (pink) is focused over 8 staggered μHall sensors that compensate for variable CTC position.121 Figure panels reproduced from reference107 with permission from The American Association for the Advancement of Science, copyright 2013; reference114 with permission from Wiley, copyright 2015; reference118 with permission from Nature Publishing Group, copyright 2017; and reference121 with permission from The American Association for the Advancement of Science, copyright 2012.
Clinical studies have shown reduced progression free survival and overall survival for patients with metastatic breast, prostate, or colorectal cancers that have ≥5 CTCs, ≥5 CTCs, or ≥3 CTCs per 7.5 mL blood, respectively.19,69,70 In other cancers, such as ovarian83 and pancreatic,84 CTC yields are lower (Table 1), and the test has not been FDA-approved.
Despite FDA-approval for the aforementioned cancers, the CellSearch™ Test has not been widely adopted by the clinical community; neither ASCO (American Society of Clinical Oncology) nor the NCCN (National Comprehensive Cancer Network) currently recommend routine use of this technology.85 A recent phase III clinical trial by the Southwest Oncology Group (SWOG S0500 study) found that changing therapy according to the test’s results did not affect a high-risk patient’s overall or progression free survival.86
The CellSearch™ CTC Test is considered a “gold standard,” yet there are limitations in the method. (i) A decade has passed since its FDA approval, and the results secured by several different technologies29,36,65,73–77 and the CellSearch™ Profile Kit78,79 have indicated that the test’s recovery of CTCs in patient samples is low; other technologies have recovered orders of magnitude higher CTC counts from only 1–2 mL of blood (Table 1). Several studies compared their technology with the CTC Test and confirmed increased performance (Fig. 4).73,78,79 (ii) The CTC Test does not monitor mesenchymal CTCs, which have been implicated in therapy resistance.28,29 For example, the CTC Test has been shown to have poor (2%) recovery for mesenchymal breast cancer cell lines;87 these results were subsequently debated,88–91 but we note that mesenchymal EpCAM(−) CTCs have been identified in breast cancers92–94 as well as for PDAC,95 for which the CTC Test had only 19% clinical sensitivity.26 (iii) The CTC Test enriches fixed CTCs with a high background of contaminating WBCs (0.01–0.1% purity; 103–104 WBCs/mL).96 The poor purity can likely be sourced to the diffusion-based, nonspecific-prone magnetic separation; the non-microfluidic MagSweeper technology67,97–99 applies convective fluid forces (like those used in microfluidic technologies31,32) during magnetic separation to generate purities of 10 ±6% (~10 WBCs/mL)67 with CTC yields similar to CellSearch™.66,102,103
Figure 4.
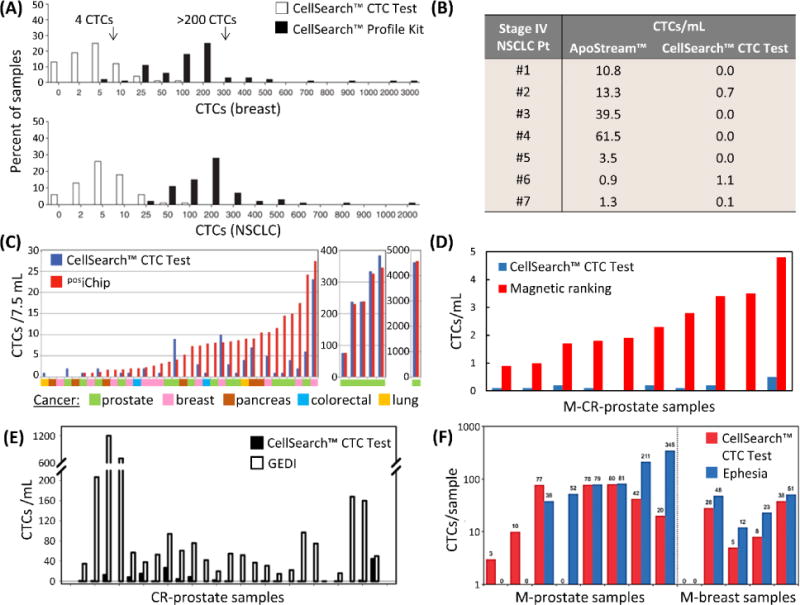
Direct comparisons to the CellSearch™ CTC Test by (A) the CellSearch™ Profile Kit,78 (B) Apostream™,214 (C) the posiChip,107 (D) the magnetic ranking microfluidic device,118 (E) the GEDI micropillar device,73 and (F) the Ephesia microfluidic device.60 Note that magnetic ranking and Ephesia technologies collected blood in CellSave™ tubes in comparisons,60,118 and the GEDI device selected PSMA(+) CTCs, whereas the CTC Test targeted EpCAM(+) CTCs. In this study, Kirby et al. noted that 60% (median) of CTCs were PSMA(+)/EpCAM(+), indicating the GEDI yields were roughly 10-fold greater than by the CellSearch™ CTC Test.73 Figure panels reproduced from reference78 with permission from Nature Publishing Group, copyright 2010; reference107 with permission from The American Association for the Advancement of Science, copyright 2013; and reference118 with permission from Nature Publishing Group, copyright 2017.
3.2. CellSearch™ Profile Kit
The CellSearch™ Profile Kit, a modified version of the CTC Test that is not FDA-approved, was designed to extract genetic material f6rom CTCs for molecular testing. The workflow for the two tests are similar (Fig. 3A), differing only in that the Profile Kit collects the blood sample into an EDTA tube, presumably because the proprietary fixative/stabilizer in the CellSave™ tube compromises genetic material, and CTCs are not immunostained but rather lysed. Flores et al. modified this protocol by immunostaining the CTCs that were recovered by the Profile Kit78 and showed, along with others,79 that the Profile Kit recovered 30–100 times more CTCs than the CTC Test with the additional benefit that nonspecific cell counts were reduced to 200–1,000 background cells per test.78 Flores et al. compared the performance of an EDTA tube versus CellSave™ and saw no difference in performance for the Profile Kit, even up to 72 h after the blood draw.78 Another report observed similar performance using EDTA tubes but only if maintained at 4°C;100 whereas others observed that assay performance decreased within several hours using an EDTA tube at room temperature, which was the reason for the CellSave™ tube’s use for stabilizing blood during shipping.100–102
CTC recovery by affinity-selection is highly dependent on the integrity of the Ab binding epitope of the target antigen. Compromising this integrity would reduce the number of bound anti-EpCAM functionalized nanoparticles ( ) and the magnetic susceptibility of the CTC ( ) utilized to magnetically pull CTCs from solution:
| (1) |
where is the magnetic susceptibility of the ferrofluid; is the ferrofluid nanoparticle’s radius; and is the CTC’s radius.
From the results of Flores et al.,78 and assuming is the same between an EDTA tube and CellSave™ tube, a factor contributing to the difference in CTC recovery could be that the solution in CellSave™ tube increases blood viscosity by 18%. Increased viscosity imparts a higher fluidic drag that resists magnetic separation, making it more difficult to separate CTCs with low EpCAM expression (low and ). By switching to an EDTA tube, the Profile Kit may be recovering such CTCs. However, that would imply the CTC Test would recover less nonspecifically labeled WBCs,104–106 which was not observed in comparison to the Profile Kit.104–106 It was also suggested that extensive handling during the CellSearch™ immunostaining process breaks apart “fragile” CTCs while the cytospin protocol used for the Profile Kit was milder, the Profile Kit detected a significant number (1–480 per sample) of proliferative CTCs, which were missed by the CTC Test (1–8 per sample).78
3.3. CTC-iChip – Microfluidic magnetic separation
The iChip107,108 (Fig. 3B) is a microfluidic technology that uses magnetic affinity-based CTC isolation.82,155 Blood is first incubated in a static, diffusion-limited environment with Ab-coated magnetic microbeads. The, the iChip uses several concepts to isolate CTCs:107 (i) the blood is “debulked” by deterministic lateral displacement,109 a hydrodynamic technique that depletes cells smaller than 8 μm (monocytes, lymphocytes, RBCs, and platelets) and cells larger than 30 μm;50,107 (ii) the remaining cells are aligned into a single line by inertial focusing;107,110 and (iii) a magnetic field is applied to separate labelled cells from non-labelled cells.107 Blood debulking integrates a conventional laboratory procedure (RBC lysis or Ficoll centrifugation) in a microfluidic format, thereby minimizing CTC loss,81,107 while inertial focusing mates the debulking preparatory step with the primary mechanism of magnetic CTC separation.
The iChip can operate in positive-selection (posiChip), where anti-EpCAM magnetic microbeads target epithelial CTCs, or negative-selection (negiChip), where WBCs are labelled and depleted using microbeads conjugated to anti-CD45, anti-CD15,107 and anti-CD66b Abs.108,111 The posiChip yielded high cell line recovery (78–99% depending on EpCAM expression, Table 1) and better results than the CellSearch™ CTC Test at low disease burden (Fig. 4); median CTC counts ranged from 0.4–3.2 CTCs/mL for breast, colorectal, lung, pancreatic, and prostate cancers (Table 1). The posiChip achieved an order of magnitude improvement in average purity over negiChip selection (1,500 WBCs/mL versus 32,000 WBCs/mL, respectively).107 Due to the negiChip’s low purity, a fluorescence microscope equipped with a micromanipulator was required to pick individual CTCs for downstream analyses (Table 1).
3.4. Ephesia – Magnetic microbeads as a microfluidic solid support
Ephesia (Fig. 3C) uses anti-EpCAM magnetic microbeads but operates in a unique format – a large microfluidic chamber patterned with microdots of magnetic ink by contact-printing, and the ink concentrates magnetic fields that align the microbeads in a self-assembled architecture. This self-assembly process simplifies device fabrication and antibody immobilization. As the assembly process is reversible, CTCs bound to the microbeads can be released and eluted off-chip by simply removing the external magnet.33,60,112 The challenge with the Ephesia technology has been the strength of microbead assembly versus fluidic force.60 This has created three issues: (i) limited throughput, (ii) limited shear forces (discussed below) available to disrupt nonspecific WBC binding, and (iii) incompatibility with whole blood, thereby requiring sample pre-processing.
Throughput was improved from the first generation design (~10 μL/h, 1 mm/s velocity)33 by enlarging the device and processing the sample in parallel through four large bead-filled chambers connected by a bifurcation network (3 mL/h, also 1 mm/s).113 Secondly, blood was pre-processed either by Ficoll density gradient centrifugation33,60 or RosetteSep™ immunoprecipitation, which uses tethered Abs to cross-link WBCs and increase their density for selective centrifugation.60 WBCs were likely abundant when blood was prepared by Ficoll because the nonspecific recovery of 0.2%60 to 2%33 of WBC cell lines would yield impurities on the order of 10,000–100,000 WBCs/mL. In contrast, the front-end RosetteSep™ WBC removal process increased purity substantially with <100 WBCs per sample. In paired tests, CTC yields (Table 1, Fig. 4) were generally concordant to CellSearch™ when using CellSave™ tubes and the RosetteSep™ process.60
3.5. Phenotypic ranking of magnetically labelled CTCs
Velocity valley and magnetic ranking microfluidic technologies114–119 (Fig. 3D) isolate magnetic affinity-labelled CTCs in different zones of the device depending on antigen (e.g., EpCAM114–119 HER2,114,117 EGFR,117, MUC1,114 N-Cadherin118) expression level, thus correlating disease progression with CTC phenotype,114,118 similar to CTC immunophenotyping29 and RNA-ISH analysis.28
Whole blood,114–118 RBC lysed blood,117,118 or RBC lysed and WBC-depleted blood117,119 was spiked with Ab-coated114–116,118 or aptamer-coated117,119 (discussed below) magnetic nanoparticles. The sample was infused through a series of microfluidic chambers, and an external magnetic field pulled both free magnetic nanoparticles and labelled CTCs onto the device surface.117 To accomplish efficient CTC recovery by this method,114 magnetic forces must overcome strong fluid forces, which could be achieved by pumping sample at volumetric flow rate of 0.05 mL/h.114 To increase volumetric throughput, X-shaped microstructures were fabricated to locally create a fluid velocity of 3–30 μm/s within the X-microstructure crevices while maintaining overall throughput of 0.6 mL/h115–119 to 2 mL/h.114 In contrast, Chen, et al. applied a magnetic field to 500 μm deep microfluidic chambers, which were not occupied by X-microstructures, and viscous drag at the microfluidic surface reduced velocities below 30 μm/s; recoveries were 79 ±18% for magnetically-labeled COLO205 cells (high EpCAM expression) spiked in blood at 2.5 mL/h.120
Varying fields of magnetic or fluid force were used to selectively recover CTCs with a certain EpCAM expression and nanoparticle loading (Eq. (1)), thus imparting phenotypic ranking of CTCs. Velocity valley devices employed microfluidic chambers either in bifurcation (doubling chamber width)114,115 or with doubled chamber height38,40,41 to create zones with decreasing fluid force (Fig. 3D). This enabled selective recovery of CTCs with high EpCAM expression upstream and low EpCAM CTCs downstream. Comparatively, increasing chamber width incurred additional nonspecific artifacts,116 while increasing chamber height could affect CTC recovery.118 The magnetic ranking technology altered magnetic field strength to zonally select CTCs. Circular Ni micromagnets patterned beneath the X-microstructures concentrated an external magnetic field around the edge of the micromagnet. By successively increasing the micromagnet radius,118 higher field strengths120 recovered low EpCAM CTCs downstream (see capture regions in Fig. 3D, which include effects of radially increasing fluid velocity).118 While not using variable micromagnet sizes to impart phenotypic ranking, Chen, et al. applied Ni micromagnets to the aforementioned 500 μm deep microfluidic chambers to amplify magnetic field strengths and increase COLO205 recovery to 98 ±9%.120
Both velocity valley and magnetic ranking devices have achieved ≥90% recovery for cell lines with low to very high EpCAM expression (Table 1) with clear discernment of EpCAM expression by recovery zone. Median clinical yields for prostate cancer were 43 CTCs/mL (100% sensitivity)114 using velocity valley, and 3 CTCs/mL (100% sensitivity) by magnetic ranking of samples collected in CellSave™ tubes, providing superior results to paired CellSearch™ CTC Tests (Fig. 4).118 Nonspecifically bound cells have ranged from 74–2,000 WBCs/mL.114–118
Using the velocity valley technology, subsequent reports have released CTCs to measure cell migration in chemotaxis gradients119 and to re-capture EpCAM(+) CTCs for secondary ranking against HER2.117 The benefit of phenotypic ranking for EpCAM expressing CTC was fully apparent in cell line xenografts, which showed EpCAM downregulation after implantation,115 but the identification of EpCAM(−) CTCs in addition to low EpCAM expressing CTCs would require simultaneous phenotypic ranking against additional mesenchymal markers.
3.6. Sensing magnetically labelled CTCs
The μHall sensor was designed to detect rather than isolate magnetically labelled CTCs. When a CTC labelled with super-paramagnetic anti-EpCAM nanoparticles was passed over a μHall sensor (Fig. 3E), a local magnetic field was generated that caused the current flowing between two contact pads to shift closer towards one of two transverse detection pads. This generated a voltage signal that was proportional to the strength of the CTC’s magnetic field and the distance between the detector and the magnetic CTC. The effect of CTC position on voltage signal was mitigated by: (i) Sheath flow channels, which compressed CTC position into the middle of a microchannel; (ii) chevron grooves creating a convective flow pattern that moved CTCs close to the micropatterned detectors; and (iii) a set of eight μHall detectors staggered along the microchannel to mathematically correct for variations in CTC position. The voltage signal was linearly proportional to the number of magnetic nanoparticles and could be used to measure antigen expression.121
Using the μHall sensor with several Abs, including EGFR and HER2, in addition to anti-EpCAM for magnetic-labelling, Issadore et al. demonstrated 91% clinical sensitivity in detecting CTCs from advanced ovarian cancer (Table 1), a substantial increase compared to the CellSearch™ CTC Test. A significant benefit of this method, especially compared to fluorescence-based flow cytometry, is the low magnetic background as RBCs were lysed before the assay was performed. This allowed a concentrated suspension of cells to be processed rapidly (~105 cells/s; 3.25 mL/h)121 but not sorted.
4. Microfluidic-Based Biological CTC selection
4.1. Materials and microfluidics
In magnetic affinity-selection assays, commercially available magnetic microbeads are coated with Abs, and these products have been optimized for both high binding affinity (related to in Eq. (1)) and low nonspecific adsorption artifacts.112 In comparison, affinity agents such as Abs, aptamers, or peptides can be conjugated to microfluidic channels to enable affinity-selection. The efficiency of substrate modifications and conjugation reactions can have a direct relationship to CTC recovery.31
4.1.1. Physical dynamics of CTC/Ab binding
A high surface density of active affinity agents on microfluidic channels (e.g., approaching a monolayer of Abs) ensures that when a CTC contacts and rolls along a microfluidic surface, binding reactions can occur with a probability ( ) of CTC recovery given by:122
| (2) |
where the forward binding constant ( ) is a function of how often Ab-antigen interactions occur and how probable a given binding event will occur considering the balance of the Ab-antigen binding kinetics with the reaction time. Recovery should: (i) Decrease as the cell’s velocity ( ) is increased due to shorter reaction times; and (ii) increase with the surface density of antigens expressed on the CTC ( ). As the CTC rolls over the surface with increasing length ( ), increases leading to higher recovery, assuming the surface is sufficiently modified with affinity agent. A more subtle aspect of Eq. (2) is that if multiple Abs targeting different CTC subtypes are immobilized to the microfluidic as a mixed layer, the surface density of each antibody ( ) is effectively decreased, and the recovery of each subtype can decrease.
Secondly, after binding with affinity agents on the surface, the adhesion force of the CTC to the microfluidic ( ) must be large enough to retain CTCs amidst fluidic shear forces ( );
| (3) |
where is the surface density of active affinity agents, is the cell’s contact area to the surface, is Boltzmann’s constant, is absolute temperature, is the extent of bond stretch before breaking the antigen/Ab association, is the bond’s dissociation constant, and is an adjustable fitting parameter. Increasing by ensuring a large (active capture element surface density) prevents an occurrence where a captured CTC is removed from the surface by hydrodynamic shear force, , especially when antigen expression level of the CTC ( ) is low.31,36,125,126 To provide a frame of reference for the magnitude of , a 15 μm CTC bound to a microfluidic surface decorated with Abs and experiencing a of 40 dynes/cm2 would require ~1,100 Ab-antigen bonds to be retained (see Table 1 for typical antigen levels).24,124
4.1.2. Materials for microfabrication, and methods for activation
Silicon, glass, and polydimethylsiloxane (PDMS) are the most common substrates for CTC microfluidics largely due to the availability of well-established methods for fabrication and surface-modifications. Some technologies use silicon as a substrate; for example, silicon can be etched by an electrochemical redox reaction involving HF and silver nitrate to produce nanotexturing that improves CTC adherence relative to a flat surface.127,128 It is common to produce a negative tone of the microfluidic device in a silicon master, then cast and cure PDMS over the silicon master to form the microfluidic device. The casting process can be conducted repeatedly, generating multiple devices from a single master.
PDMS devices are activated by oxygen plasma to generate silanol groups, irreversibly bonded to similarly activated glass, then modified with a series of chemicals for Ab immobilization. Silanol groups on activated PDMS surfaces (or glass/silicon substrates) are commonly modified with 3-mercaptopropyltrimethoxysilane (MPTMS) to generate sulfhydryl surface groups, after which N-(γ-maleimidobutyryloxy) succinimide ester (GMBS) is used to link the sulfhydryl groups to primary amine residues (lysines, arginines) of proteins, such as neutravidin molecules that can specifically bind biotinylated Abs.36,49,65,128 This multi-step process leads to a stable bond (covalent or protein-mediated) between the microfluidic surface and CTC-specific Abs, which can retain the Ab activity compared to physical adsorption.129 These conjugation reactions are widely established,130 but because microfluidic surface-to-volume ratios can be very high, the Ab concentrations required to yield a 5–10 –fold reagent excess can be on the order of 0.5–1 mg/mL.31
PDMS casting can reduce photolithography requirements by replicating devices from a single silicon master, but the curing can reduce device production rates. Methods such as hot embossing and injection moulding can produce devices at higher production rates and with tighter tolerances (Table 2).131 Such mass production methods are crucial when translating CTC technologies into the clinic because each device must be disposed after a single assay to mitigate sample carryover artefacts.132 Thermoplastics such as polymethylmethacrylate (PMMA; acrylic glass), polycarbonate (PC), and cyclic olefin copolymer (COC),33,131 microstructure design131 and Ab immobilization methods31,133 differ from lithography-based materials (Table 2) and can have an impact on the CTC isolation process.
Table 2.
The properties of materials generally used to manufacture positive-affinity CTC selection devices, focusing on properties that affect the rate and cost of production, assay efficiency, CTC identification, and CTC viability.
| Metric | Criterion | Material†
|
References | ||||
|---|---|---|---|---|---|---|---|
| Silicon | PDMS | COC | PMMA | PC | |||
| Manufacturing | Fabrication method for master mould | – | Lithography | Micromilling or LiGA | 131,272 | ||
| Material for master | – | Silicon or photoresist | Brass or nickel | ||||
| Time for device replication | Hours | Minutes to hours | Minutes (hot embossing) to seconds (injection moulding) | ||||
| Scalability for mass manufacturing | Poor | Moderate | Excellent | ||||
| Cost per device in mass production | High | Moderate | Low | ||||
|
| |||||||
| Ab attachment | Method for chemical modification | O2 plasma and alkoxysilane | UV/ozone or O2 plasma and EDC/NHS | , | |||
| Fidelity/reproducibility | Excellent | Excellent | Moderate to poor | ||||
|
| |||||||
| Immuno-phenotyping | Autofluorescence | Very low‡ | Very low* | Low | Low | Very high | 34,35 |
|
| |||||||
| Biocompatibility | Cytotoxicity (24 h viability) | Excellent (−) | Excellent (98%) | Excellent (98%) | Moderate (89%) | Excellent (98%) | |
| Adsorption of hydrophobic molecules** | – | 20% | 0% | 20% | 0% | ||
| CO2 permeability*** | – | 3489 | 1.77 | 2.33 | 22.23 | ||
| O2 permeability*** | – | 695 | 0.765 | 0.0653 | 2.96 | ||
PDMS [poly(dimethylsiloxane)]; COC [cyclic olefin copolymer]; PMMA [poly(methyl methacrylate)]; PC [poly(carbonate)].
Silicon substrate is non-transparent but suitable for fluorescence immunophenotyping.
COC autofluorescence is very low prior to UV/ozone modification.
Results were for 7-ethoxycoumarin, and similar results were found for testosterone.
Permeability units are , and values reported in the table are scaled by a factor of 10−13.
Soper et al. developed methods for Ab immobilization in thermoplastic-based microfluidics.133 Thermoplastics can be exposed to UV/ozone irradiation to oxidize the thermoplastic surfaces. In this process, a microfluidic device is placed beneath a quartz, low pressure Hg arc lamp that emits 185 nm and 254 nm UV radiation and forms a steady state of atomic oxygen and ozone that can oxidize an array of thermoplastics, even materials such as COC that are entirely composed of saturated hydrocarbons. The oxidized devices are thermally fused with a cover plate to seal the microchannels. Then, the surface carboxylic acid groups are reacted with 1-ethyl-3-(3-dimethylaminopropyl)carbodiimide (EDC) and N-hydroxysuccinimide (NHS) coupling reagents to form a succinimide ester intermediate that reacts with primary amine containing Abs,29,31,125,134 as well as DNA linkers34,133 and small molecules such as fluorescent dyes.135 By several surface analyses, it was observed that carboxylic acids were most efficiently generated in COC devices,31,135 which resulted in improved CTC recovery and purity compared to devices fabricated in PMMA. The polymer chains of PMMA were suspected to fragment during oxidation and rearrange during thermal assembly, burying carboxylic acids into the bulk substrate.31
COC was found to be more transparent to the UV radiation compared to PMMA, generating uniform exposure to the reactive oxygen species throughout the microchannel’s depth (150 μm deep, 25 μm wide). UV absorption by PMMA resulted in deeper portions of the PMMA microchannels that were essentially not activated.31 More recently, COC’s UV transparency has been exploited to activate pre-assembled COC devices, where the UV radiation penetrates through the cover plate and forms oxidizing species in the air sealed within the microchannels.29,136
4.2. Microfluidic strategies for CTC affinity-selection
Microfluidic devices for CTC affinity-selection utilize affinity agents attached to microchannel surfaces to bind and retain CTCs according to Eqs. (2) and (3). Unique microfluidic architectures have been designed to encourage or prolong interactions between the surface-confined affinity agents and the CTCs,123 while also disrupting WBC and RBC interactions with the affinity probes.
4.2.1. Micropillar devices
An example of a micropillared device is the “CTC Chip” (Fig. 5A), which was comprised of 78,000 micropillars (100 μm diameter, 50 μm spacing) fabricated by etching silicon and sealed with adhesive tape. Every third row of microposts was staggered to form an equilateral triangular array that encouraged the collision of CTCs with polyclonal anti-EpCAM Abs immobilized on the micropost surfaces. The device was tested against several cell lines and showed 74–80% recovery regardless of the cell’s EpCAM expression (Table 1).36 In contrast, others have found that cell line recovery decreased with decreasing antigen expression60 in accordance with Eq. (2).122 The CTC Chip’s flow rate was limited to 1–2 mL/h (0.5–0.9 mm/s velocity), above which recovery dropped36 due to the short rolling distance along the Ab-decorated pillar.29,123
Figure 5.
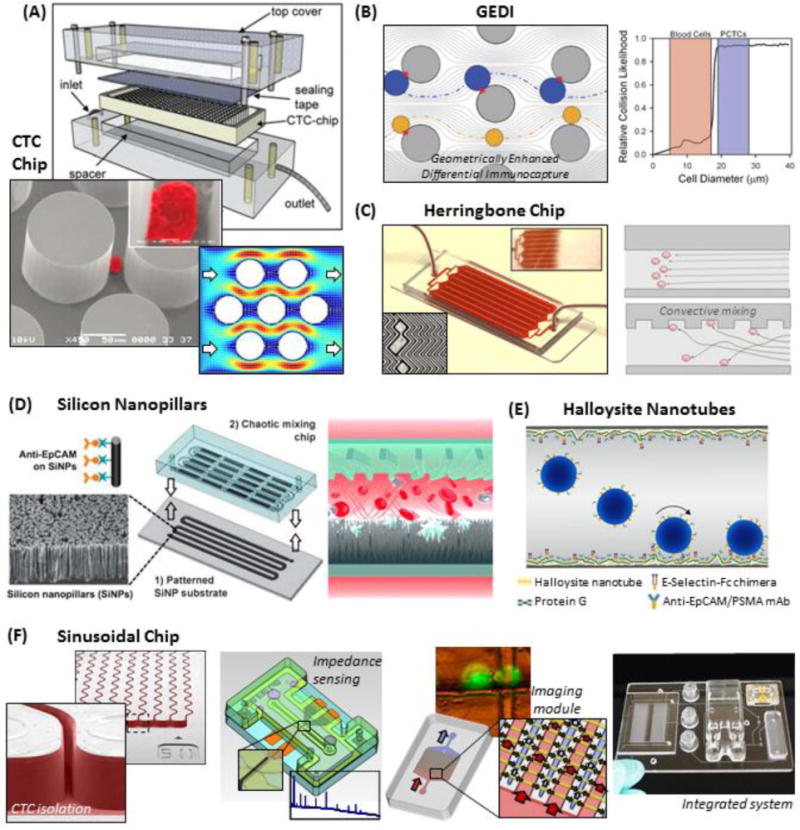
Positive-affinity microfluidic selection. (A) Assembly of the silicon CTC chip, SEM of a pseudo-coloured cell isolated on the Ab-coated micropillars, and simulated fluid velocity field in the device.36 (B) The GEDI device arranges micropillars to hydrodynamically induce a strong bias towards recovering cells >15–18 μm (blue) and minimizing smaller WBC (yellow) interactions.49 (C) The herringbone chip uses convective mixing to encourage CTCs to interact with Ab-coated surfaces.65 (D) A schematic of the silicon nanopillar chip, where a convective mixing chamber is attached to a nano-textured, Ab-coated Si substrate.128 (E) Polyurethane tubing is nano-textured with naturally occurring halloysite nanotubes and coated with Abs and selectins.262 (F) The thermoplastic-based sinusoidal chip uses narrow, Ab-coated microchannels to isolate CTCs.24 CTC release34,125 enables off-chip enumeration and viability testing by an impedance sensor and a microfluidic imaging module,74 which are integrated to a fluidic motherboard. Figure panels reproduced from reference36 with permission from Nature Publishing Group, copyright 2007; reference128 with permission from Wiley, copyright 2011; and reference74 with permission from American Chemical Society, copyright 2013.
Clinical samples were tested for several cancers with median CTC yields higher than previously reported for the CellSearch™ CTC Test (Table 1). Patients with localized prostate cancer had detectable CTC counts,36 indicating that early cancer detection may be feasible.18 The CTC Chip had a purity of 34 ±8% (~233 WBCs/mL),36 later reported to be 9% (~9,000 WBCs/mL).65 In microfluidics, two primary factors can contribute to nonspecific WBC retention. The low fluid shear stress (maximally 0.4–0.8 dynes/cm2) during blood infusion,36 which may be too weak to disrupt nonspecific interactions. In addition, due to the equilateral arrangement, low shear regions behind the micropillars (Fig. 5A), where flow velocities were <0.05 mm/s,36 can act as stagnate zones (low ) for nonspecific WBC binding.29,123
A second micropillar device, termed the geometrically enhanced differential immunocapture (GEDI) device49 (Fig. 5B) used 5,000 silicon micropillars of similar dimensions to the CTC Chip (80 μm diameter, 100 μm spacing). While the device was operated at lower shear stress (~0.1 dynes/cm2)73 compared to the CTC chip, the GEDI device achieved higher purity (62 ±2%, ~10 WBCs/mL for anti-PSMA Ab selection49 but not quantified for anti-EpCAM, hMUC1,39 or HER2137 selection) by staggering each row of the microposts in a manner that developed hydrodynamic lift forces. These lift forces strongly encouraged pillar collisions for cells >15–18 μm but discouraged interactions of cells <15–18 μm with the Ab-coated micropillars.39,49 As a consequence, smaller cells were recovered with lower efficiency (~30% recovery for 13 μm BxPC-3 cells; 60–70% for cells >15 μm).27,39,51–56
Clinical research with the GEDI device has largely used the highly specific J591 monoclonal Ab that targeted PSMA(+) CTCs for prostate cancer.49,73 The authors demonstrated a 2–400 fold increase in CTC recoveries relative to the CellSearch™ CTC Test (Fig. 4),73 but because thresholds for positivity were not reported from healthy controls, clinical sensitivity was not determined.49,73 Because PSMA(+) CTCs have variable EpCAM expression with only ~60% of CTCs reported to be PSMA(+)/EpCAM(+),73 after adjustment to exclude PSMA(+)/EpCAM(−) CTCs based on the reported results, the GEDI device’s yields were still approximately 10-fold greater than the CellSearch™ CTC Test. More recently, CTCs isolated by anti-EpCAM selection found that 33% of patients with pre-cancerous pancreatic lesions had detectable CTCs. These results were very promising to potentially identify patients that are at risk for developing PDAC.138 Hypoglycosylated mucin 1 (hMUC1),39 another marker of epithelial CTCs,139 has been targeted, but hMUC1 and EpCAM expression was correlative in pancreatic cancer cell lines; there was no improvement in cell line recovery.39
4.2.2. Chaotic mixing CTC selection devices
In 2002, Stroock et al. reported a microfluidic consisting of staggered herringbone grooves entrenched into a large microchannel. These grooves created low fluidic resistance along the microchannel’s axial direction,140 thereby creating lateral movement of the fluid and generating microvortices and convective flow. A version of this geometry, the herringbone CTC Chip (Fig. 5C), was utilized by Stott et al. to enhance the encounter rate of CTCs with the Ab-coated surfaces, thereby acting to improve CTC recovery. These herringbone devices were replicated from a silicon master into PDMS and attached to glass substrates, and the entire device was coated with monoclonal anti-EpCAM Abs.65
The herringbone device exhibited >90% recovery for PC3 cells (moderate EpCAM expression; Table 1) compared to ~68% recovery from the CTC Chip at approximately the same throughput. Later reports indicated low (~3%) recovery of MDA-MB-231 cells (low EpCAM expression),41 which was not observed for the CTC Chip.36 The herringbone device also generated a purity of 14% (~5,600 WBCs/mL)65,141,142 compared to 9% (~9,000 WBCs/mL) for the CTC Chip.65 This WBC background could be attributed to low shear stagnate regions of fluid within the crevices of the herringbone grooves.143,144 The herringbone chip has been used in numerous clinical demonstrations (Table 1) with high median CTC counts, especially for prostate cancer, and clinical sensitivities ranging between 56% – 93%.28,41,65,75,141,142,145
4.2.3. Nano-texturing Ab-coated surfaces
Wang et al.128 attached a PDMS convective mixer to a nano-textured silicon surface (Fig. 5D). The nanotexturing used chemical wet etching (ionic Ag and hydrofluoric acid solution)127 of silicon substrates to produce 12–15 μm long silicon nanowires;128,146–148 alternatively, a matrix of poly(lactic-co-glycolic acid) (PLGA) nanofibers was deposited on a laser microdissection slide by electrospinning.148–150 Nanotexturing improved the adhesion of microvilli and invadopodia of CTCs to Ab-decorated surfaces.128,146,149
In most cases, these nanotextured substrates were functionalized with streptavidin, and an un-functionalized PDMS convective mixer was bonded to the nanotextured substrate to create the microfluidic channel; only one microfluidic surface was activated for CTC binding.128,147,148,150 Early reports functionalized the streptavidin-coated device with biotinylated Abs prior to sample processing.128,146,147,149,150 Relative to a flat surface, such as those used in the herringbone device by Stott et al.,65 nano-textured surfaces produced a 70% increase in cell line recovery and >95% absolute recovery, even for cell lines with low EpCAM expression.128,150 Recently, a modified assay has been reported, which consists of pre-labelling a RBC lysed blood sample with biotinylated Abs and recovering the labeled cells with the streptavidin-coated device.52,148 Cell line recoveries were shown to be 65–93% depending on EpCAM expression (Table 1).148
When testing 33 patients with metastatic prostate cancer, the nano-textured chaotic mixer device generated median clinical CTC yields of 1 CTC/mL, although slightly higher CTC counts (3.5 CTCs/mL median) were observed for castration resistant prostate cancer, CRPC (Table 1). The device also performed similar to the CellSearch™ CTC Test,128 but thresholds for positivity and clinical sensitivities were not reported. In another study of 72 PDAC patients, clinical sensitivity increased from 0%, 61%, 79%, to 96% for stages I, II, III, to IV PDAC, respectively. The median recoveries were 0, 0.25, 0.25, and 1.25 CTCs/mL for these stages; 28 patients with non-PDAC were assessed in this report, and 1 false positive was observed at the threshold of 0.25 CTCs/mL (Table 1).148 Purity was not reported for the nanotextured device.151 However, a similar study that used anti-CD146 Abs coated to electrospun nanofibers showed high nonspecific binding.150
Hughes et al.152,153 also employed nanotexturing for CTC isolation with halloysite nanotubes (Fig. 5E), an aluminosilicate mineral that naturally forms hollow tubular structures (40–200 nm in diameter, ~1 μm length). The use of this material offered simplified fabrication compared to chemical etching. Poly(urethane) microtubes (300 μm ID, 50 cm length) were dynamically coated with poly(L-lysine), a positively-charged coating that electrostatically bonded the negatively-charged outer surfaces of the halloysite nanotubes. This coating resulted in a heterogeneous and incomplete nanotexturing (~50% of the microtube surface). Protein G, which is negatively charged at physiological pH and binds the Fc region of Abs to control Ab orientation during immobilization, was incubated152,153 before introducing anti-EpCAM (or anti-PSMA) Abs, along with ~10% E-selectin-IgG chimera fusion protein.152,153
Selectins are naturally expressed on inflamed endothelium, cause CTCs and (to a lesser degree) WBCs to transiently adhere during rolling along surfaces, and are linked to the formation of metastases. Cell interactions with selectins effectively reduce cell velocity and lengthen cell-Ab interactions to improve recovery (see Eq. (2)), which permits higher throughput (4.8 mL/h; 4.5 dynes/cm2) compared to Abs alone.152,153 The incorporation of selectins improved the recovery to 50% for a leukemia cell line.135 However, selectin binding is highly dependent on the presence of Ca2+ ions, which would be chelated by the use of EDTA or citrate anti-coagulants in blood samples. This method then requires the use of heparin blood collection tubes or, as the authors demonstrated, Ficoll preparation and resuspension of the buffy coat in Ca2+ supplemented phosphate buffer,152 which requires user intervention that can result in cell loss.80–82,107 For clinical samples, the recovered CTCs were released into a culture dish using proteolytic enzymes (discussed below) and identified by EpCAM or PSMA immunostaining 5 days later, whereas WBCs were identified by DAPI nuclear staining alone (CD45 immunostaining was not included in some studies).152–154 To secure more information, the expression of CK (and/or Vim) could have been confirmed.
While halloysite nano-texturing was noted to improve purity (66%; 3–60 WBCs/mL), the coating did not significantly improve CTC recovery, CTC yields were generally higher than the CellSearch™ CTC Test.153 However, it is difficult to compare purities obtained by the halloysite technology to other technologies because WBCs were not identified immediately; rather, WBCs were identified after 5 days in culture,153 and WBCs can senesce, reducing in number, in standard culture.30 In a study where CTCs were analyzed 4 h after recovery, higher CD45(+) WBC counts were evident, but purity was not quantified.154 The halloysite technology has also been used to assess CTC drug susceptibility in patients with advanced, stage IV breast, prostate, colorectal, or renal cancers (Table 1) by dosing aliquots of buffy coat with therapy agents 24 h prior to processing the samples; the effects of the therapeutics were monitored via reduction in the number of recovered CTCs. The additional 24 h incubation did not affect the recovery of BT-20 cells (82 ±19%, very high EpCAM expression),154 but this recovery did not include cell loss during buffy coat preparation.80
Lastly, several interesting chemistries have been detailed with the halloysite nanotube technology. For example, cell lines have been recovered with the nanotubes using only E-selectin without an anti-EpCAM antibody by first coating the halloysite nanotubes with an anionic surfactant that neutralizes the positively charged aluminol inner surfaces of the nanotubes. Electrostatic or hydrophobic interactions selectively bind cancer cells versus neutrophils and were suggested to be associated with an extracellular matrix specific to cancer cells.155 In another example, the halloysite nanotubes were coated with liposomes containing doxorubicin, which were functionalized with E-selectin to cause liposomal-CTC binding and selective chemotherapy delivery to the CTCs.156
4.2.4. CTCs selection using sinusoidal microchannels
The sinusoidal technology (Fig. 5E) used a Z-configuration fluidic network, which had a compact footprint by using straight inlet and outlet channels poised perpendicular to the Ab-coated sinusoidal microchannels used for CTC isolation. The sinusoidal microchannels had a narrow width (25 μm)29,125,157 that was 5–10 μm larger than CTCs to encourage CTC-Ab interactions but large enough to clear WBCs, and the sinusoidal pattern was estimated to provide centrifugal forces that push CTCs towards the Ab-coated surfaces.123,125 In comparison to collisions with discrete micropillars, where low velocities and low shear stress prolong an otherwise limited CTC-Ab interaction,36 the continuous design of the sinusoidal microchannels affords uninterrupted CTC rolling.29,122,123
Due to CTCs’ long rolling distances in the sinusoidal device,29,123 high recovery (~80%) of CTC cell lines with moderate antigen expression and >95% for cell lines with high EpCAM expression was observed at a linear velocity of 2 mm/s.29,34,74,125,134 This recovery has also been validated for clinical CTCs in metastatic PDAC patient samples (79–87% recovery) using the self-referencing method.29 The ability to operate at high linear velocity without sacrificing CTC recovery enabled high throughput (1.5 mL/h) sample processing as well as high shear stress (14 dynes/cm2 on average, 40 dynes/cm2 maximally)31 that generated high purity (~90%, 3 ±3 WBCs/mL averaged from 66 clinical samples).29,31,74 The applied shear stress was orders of magnitude higher than comparable devices36 but within the physiological range for arteries,158 and high CTC viability (>85%) was observed in the sinusoidal technology.34 Other researchers have also generated high purity by increasing shear stress (~30 WBCs/mL at 1.25 dynes/cm2 in a simple microfluidic chamber) but typically at the cost of recovery (14%).32
The sinusoidal technology has been used in several clinical studies (Table 1).24,29,31,34,74 Clinical sensitivity of 100% was achieved by anti-EpCAM selection for PDAC patients with localized (median 11 CTCs/mL) or metastatic (55 CTCs/mL) disease,74 and CTCs were successfully isolated from patient-derived xenograft (PDX) PDAC mouse models.31,159 Longitudinal studies of PDX PDAC models showed decreasing CTC burden (from 106 to 9 CTCs/mL) that correlated with tumour size following therapeutic treatment.159
Witek et al. recently selected CTCs by targeting both EpCAM and FAPα,29 a mesenchymal surface protein29,30,57,160,161 that showed high orthogonality to EpCAM expressing CTCs (90% of FAPα CTCs did not express EpCAM). The use of multiple devices, each coated with a different affinity-selection Ab, avoided dilution in Ab surface densities (Eq. 2) and enabled downstream analysis of each CTC subtype separately. By targeting both markers, 100% clinical sensitivity for a range of cancers (colorectal, ovarian, prostate, and PDAC) and 80% for breast cancer (Table 1) was found.29
The recovery in the sinusoidal device was dependent on cell size due to several factors that affect the number of cell-Ab interactions.123 The acute myeloid leukemia (AML) KG-1 cell line (12–15 μm cell diameter; very high target antigen expression) was selected with 65% recovery,34 and T cell recovery (7–8 μm cell diameter; moderate expression) was 10%.31
The sinusoidal chip has the ability to increase throughput from the current processing rate (1.5 mL/h) by inserting more sinusoidal channels in parallel without increasing shear stress or sacrificing CTC recovery. By placing 10 times more channels in parallel and elongating the inlet/outlet channels, 15 mL/h throughput can be achieved. However, in these high volumetric flow rate devices, flow non-uniformity can develop, imparting variable CTC recovery.74 A method has been proposed to correct this non-uniformity, which involves tapering the size of the input/output channels.123,162
4.3. Microfluidic catch and release
Recently, several strategies reported the ability to release CTCs after surface affinity-selection. This “catch and release” strategy is important to enable several analyses such as: CTC enumeration and viability testing by label-less impedance detection,29,125 flow cytometry,34 and automated microscopy;24,65 CTC culturing34,41,111,153,163 and xenograft transplantation;111 FISH cytogenetic analysis;34,65 protein secretion assays;164 and single cell molecular profiling.41,97 Assays that use magnetic beads as the solid support for the affinity-selection Abs have the advantage that the recovered CTCs can be released into solution by simply removing the magnetic field.26,33,99 In contrast, positive-affinity-selection devices typically attach Abs directly to the microfluidic surfaces, and the CTC-Ab-surface complex must be selectively broken in order to release the enriched CTCs.
Microfluidic-based CTC isolation and release should address the following requirements: (i) Maintain highly efficient and specific CTC recovery; (ii) efficiently release CTCs; (iii) maintain viability of the selected CTCs; (iv) compatible with a broad range of analyses following release; and (v) simple workflow and instrumental requirements. While laser microdissection has been used to release CTCs,52,148,150,165–167 the technique is laborious, expensive, and yields non-viable CTCs.150,163 In general, three methods have been pursued to release CTCs: enzymatic digestion of the affinity agent; linkers between the affinity agent and microfluidic surface that can be specifically cleaved; and polymeric coatings that can be degraded or externally manipulated.
4.3.1. Digest the affinity agent
Adams et al. used the proteolytic enzyme trypsin to digest the Ab-antigen complex (Fig. 6A) and detected the released cells via a label-less impedance electrical sensor.29,125 Approximately 95% of cells were released with no evidence of cell damage.125 Others have employed similar strategies and achieved high viability of the released CTCs143,164 and cultured viable patient-derived CTCs.153,154 However, trypsin-based CTC release has not functioned well for silicon nanowire technology with release efficiency ranging from 10%163 to 60% and <10% viability.167
Figure 6.
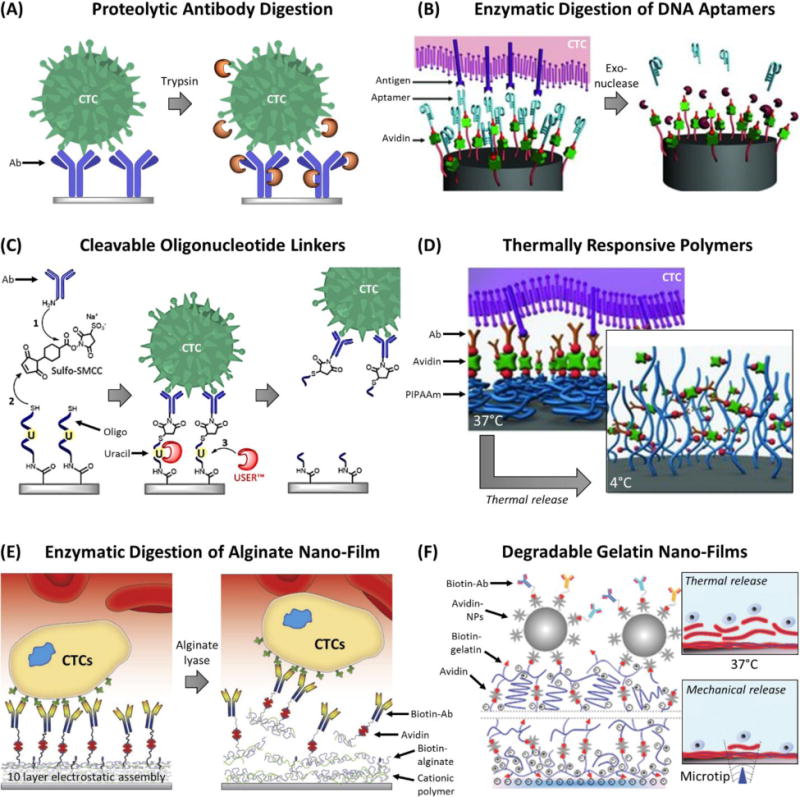
Strategies to release CTCs after microfluidic affinity-selection. (A) Proteolytic digestion of Ab-antigen complex.125 (B) Exonuclease digestion of DNA aptamers.163 (C) Uracil-specific enzymatic digestion of oligonucleotide linkers that anchor Abs to surfaces.34 (D) Thermally responsive polymer that internalizes the attached Abs when cooled.167 (E) Electrostatic assembly of nano-films containing biotinylated-alginate that can be enzymatically digested.174 (F) Gelatin nano-films assembled by avidin cross-linking that can be thermally melted or locally dissociated by mechanically tapping with a microtip.41 Figure panels reproduced from reference163 with permission from Wiley, copyright 2013; reference167 with permission from Wiley, copyright 2013; reference174 with permission from Elsevier, copyright 2015; and reference41 with permission from Wiley, copyright 2015.
Trypsinization has limitations. Proteolytic digestion can damage fluorescent Abs, which precludes on-chip immunostaining, and the method is not compatible with formaldehyde fixation, which is used for DAPI staining and/or to stabilize CTCs for off-chip imaging because trypsin cannot digest the cross-linked proteins generated by formaldehyde fixation.34,74
As an alternative to Abs, the use of DNA or RNA aptamers for affinity-selection enables several mechanisms for CTC release.168,169 Aptamers are short (70–200 nts)170 single-stranded oligonucleotides that are generated by challenging random oligonucleotide libraries against recombinant proteins, target cells, or tissues by the use of systematic evolution of ligands by exponential enrichment (SELEX).171 The resultant aptamers possess unique 3D structural conformations with high affinity (dissociation constants comparable to Abs, ranging from 0.1 to 50 nM) for their antigens,170 e.g., EpCAM, HER2, or PSMA.168
Compared to Abs, aptamers offer several benefits for CTC enrichment: (i) exceptional stability when lyophilized, which eliminates the cold storage requirement and limited shelf life of devices modified with Abs; (ii) chemical synthesis strategies offer superior batch-to-batch reproducibility and the incorporation of diverse functional groups for surface immobilization strategies; and (iii) lower cost,168–170,172 although scaled mass production has yet to be realized.170 Aptamers are not without challenges. Oligonucleotide aptamers, especially RNA aptamers, are susceptible to nuclease degradation in biological matrices such as blood.168,170,172 Thus, chemically modified aptamers with enhanced stability have been developed by incorporating modified or unnatural nucleic acids to obscure nuclease recognition,168–170 which then require unique polymerases for production.170 The largest drawback for aptamers, however, has been their limited commercial availability (see review by Bruno170). Despite their advantages, from 2010 to 2016, 6–17 publications per year169 utilized aptamer-functionalized microfluidic devices for CTC isolation (Figure 1).
To accomplish CTC release after affinity-selection with aptamers, the aptamer’s antigen-binding structure can be disrupted by infusing the complementary (anti-sense) oligonucleotide sequence,117 or exonucleases can be used to digest the aptamer and release CTCs (Fig. 6B). Shen et al. functionalized a streptavidin-coated, silicon nanowire device with biotinylated aptamers generated by systematic evolution of ligands by exponential enrichment (SELEX) against the A549 non-small cell lung cancer (NSCLC) cell line. A549 cells were isolated from blood with 70–80% recovery and released by exonuclease digestion with ~85% efficiency and ~80% viability. Additionally, the majority of WBCs not bound to aptamers remained on-chip; WBC counts in the isolate were reduced by ~92.5% after release (the WBC background was 300–1,500 WBCs/mL). The authors proposed a second round of selection and release to reduce WBC contamination,163 which has been proposed by others as well.66,173 Inefficiencies in the recovery and release processes, however, did reduce CTC yields.67,69,163
In a separate aptamer demonstration, Zhao et al.32 used the herringbone technology and a process called rolling circle amplification to amplify a DNA aptamer tethered to the microfluidic surface. This process generated a multivalent aptamer coating on the herringbone surface that was comprised of long (10–100 μm) DNA molecules with repeating aptamer units targeting the protein tyrosine kinase 7 (PKT7), an antigen that can be used to monitor ~30% of AML patients. The multivalent surface isolated a leukemic cell line from blood with purity of 38% (~1,000 WBCs/mL) and recovery of ~60% relative to an Ab-modified herringbone device (8% purity, ~2,300 WBCs/mL; ~20% recovery). A 10 min infusion of concentrated exonuclease released 68% of cells (66% viable),32 potentially due to the aptamer’s high valency.
4.3.2. Cleavable linkers
DNA oligonucleotides have been used as linkers to covalently attach maleimide-labelled mAbs (3′-sulfhydryl modification) with a carboxylic acid-modified thermoplastic surface (5′-amino modification) (Fig. 6C). As both 5′ and 3′ ends of the DNA linker were chemically bound to another functionality and were not accessible to exonucleases, an internal uracil residue was added into the linker that could be specifically digested and cleaved with the two-enzyme Uracil Specific Excision Reagent, USER™. Cell line recoveries were ~80% using the linkers, no different than without the linker, and after a 15–30 min enzyme incubation, CTCs were released with ~90% efficiency and >85% cell viability. Longer incubations were necessary to release cell lines with high antigen expression, presumably as more Ab-antigen complexes needed to be cleaved to release the cell.34
A drawback of this method was a more complex workflow created by the need for formation of the linker-Ab complex on the microfluidic substrate. An additional limitation was the cost of the USER™ enzyme, especially in comparison to methods that employ inexpensive enzymes such as alginate lyase (see below).174
Other linkers utilized photo-cleavable moieties that are cut upon UV exposure. The challenge here is the effects of intense 365 nm, UV-A exposure (7.2 MJ/m2)164 on a CTC’s DNA integrity175 must be considered in addition to viability.164
4.3.3. Polymer coatings for severing the binding complex from microfluidic surfaces
Hou et al. grafted silicon nanowires with thermally-responsive poly(N-isopropylacrylamide) (PNIPAm) polymer brushes (Fig. 6D) that are hydrophobic for cell attachment at 37 °C but rearranged and became hydrophilic at 4 °C.167 The authors biotinylated the polymer and functionalized the hydrogel with biotinylated anti-EpCAM Abs via an avidin bridge (Fig. 6D). The recovery of MCF-7 cells was assessed in a static chamber incubated at 37 °C.167 Both recovery and specificity were similar to previous reports using silicon nanowires146 with ~95% of cells released by cooling the substrate to 4°C. PNIPAm-coated silicon nanowires were later incorporated within a PDMS chaotic mixer device. An NSCLC cell line (H1975, high EpCAM expression) was spiked into whole blood, and ~76% of cells were recovered and subsequently released with a purity of 3–6% (2,400–5,000 WBCs/mL). A second round of recovery and release was used to increase the purity (88–99%).147 Seven NSCLC patients (stage III–IV) were tested, and 2–17 CTCs/mL (median 6 CTCs/mL) were recovered.147
In a micropillar device, Hatch et al. constructed an alginate hydrogel by cross-linking (via EDC/NHS coupling) carboxylic acid-containing alginate polymer with a four-armed, amine-terminated PEG cross-linker and anti-CD34 Abs, which targeted endothelial progenitor cells for tissue engineering. As the entire hydrogel was negatively charged, divalent cations were critical to electrostatically stabilize the surface during cell recovery; EDTA-chelation was then used to destabilize the coating and release the isolated cells. While release efficiency was not assessed, recovery and viability were ~33% and 90%, respectively. WBC binding to the alginate hydrogel was 8,000–9,000 WBCs/mL (74% purity),176 which has been seen for another alginate hydrogel.177 Like the halloysite nanotube technology discussed above, the chelation release mechanism precludes the use of EDTA and citrate anti-coagulants for blood samples, requiring heparin blood collection tubes or manual pre-processing of the blood. A different biotinylated alginate hydrogel by Shah et al. avoided this latter constraint by photo-cross-linking the hydrogel pm a flat surface and CTCs were isolated by anti-EpCAM selection with similar recovery as standard Ab-immobilization methods, but hydrogels not modified with Abs exhibited a relative recovery of ~10%,178 indicating similar nonspecific artifacts as those reported by Hatch et al.176 Enzymatic digestion of the hydrogel with alginate lyase released cells with 99% efficiency.
To avoid channel clogging during polymerization, the Stott group developed a method to deposit polymer coatings in the herringbone chip using a layer-by-layer approach.41,174 A bulk polymer solution was infused into the herringbone microfluidic device, and a nano-layer film of polymer was stabilized on the surface while the bulk polymer was washed away without the risk of clogging. Li and coworkers used this technique to coat ten alternating layers of negatively charged biotinylated alginate and cationic, amine-containing polymers (Fig. 6E) onto an O2 plasma-modified silanol surface.174 With a final functionalization of streptavidin and biotinylated anti-EpCAM Abs, PC3 prostate cancer cells were isolated with 79% recovery and 53% purity (~3,500 WBCs/mL,174 similar to previous reports),65 and CTCs were recovered from four lung cancer patients at 3–5 CTCs/mL.174
In a second layer-by-layer demonstration by Reátegui et al., four layers of biotinylated gelatin proteins were stabilized by alternating layers of streptavidin (Fig. 6F) and capped with biotinylated anti-EpCAM Abs. Unlike the previous layer-by-layer method, PC3 cell line recovery was 20% with the coating alone, and a final layer of streptavidin-coated polystyrene nanoparticles was necessary to achieve >90% recovery. Clinical samples were processed using a mixture of EpCAM, EGFR, and HER2 Abs (Table 1). Notably, the nano-coating reduced non-specific cell adhesion from 3,500 to 1,300 WBCs/mL,41 and release was enabled by two methods. The gelatin coating was melted at 37°C for 10 min to release all cells (88% viability, 93% efficiency).41 A second release technique used an 80 μm, vibrating microtip to depress on the PDMS substrate, which produced an inertial force throughout the microfluidic channel but only within 145–215 μm of the microtip. This technique was utilized to locally dissociate cells from the substrate and was useful to exclude the majority of contaminant WBCs from further analyses.41 The selective release required a fluorescence microscope customized with a vibrating microtip to locally release immunophenotyped CTCs.41
5. Selecting CTCs by their physical properties
5.1. CTC filtration – Size and deformability
The selection of CTCs by size (Fig. 7A) is a technique that dates back to the 1960s.179,180 Later methods, initially termed isolation by size of epithelial tumour cells (ISET37,165,166,181–188 and ScreenCell),189 filtered blood that was first subjected to red blood cell lysis and fixation. Fixation of the cells eliminated deformability, thereby improving recovery165 by PC membranes used for size selection, which were track-etched to produce 8 μm pores.184,185 Because the track-etching process is random, porosity of the PC membranes is kept low (<2%)190 to minimize cell loss through fused pores. The challenges with filtration are low CTC recoveries (~50%) and clogging of the filters as the pores become occupied by highly abundant WBCs.186,191 An example of microfilter clogging is shown in Fig. 7B(iii).192 To mitigate the issue of filter clogging, the ISET technology uses 10 filters to process 10 mL of lysed blood (diluted 10 fold), each processing 1 mL of a blood sample.181,187,188 In several side-by-side comparisons with CellSearch™, the ISET technology recovered similar numbers of CTCs with variable improvement in clinical sensitivity.181,187,188
Figure 7.
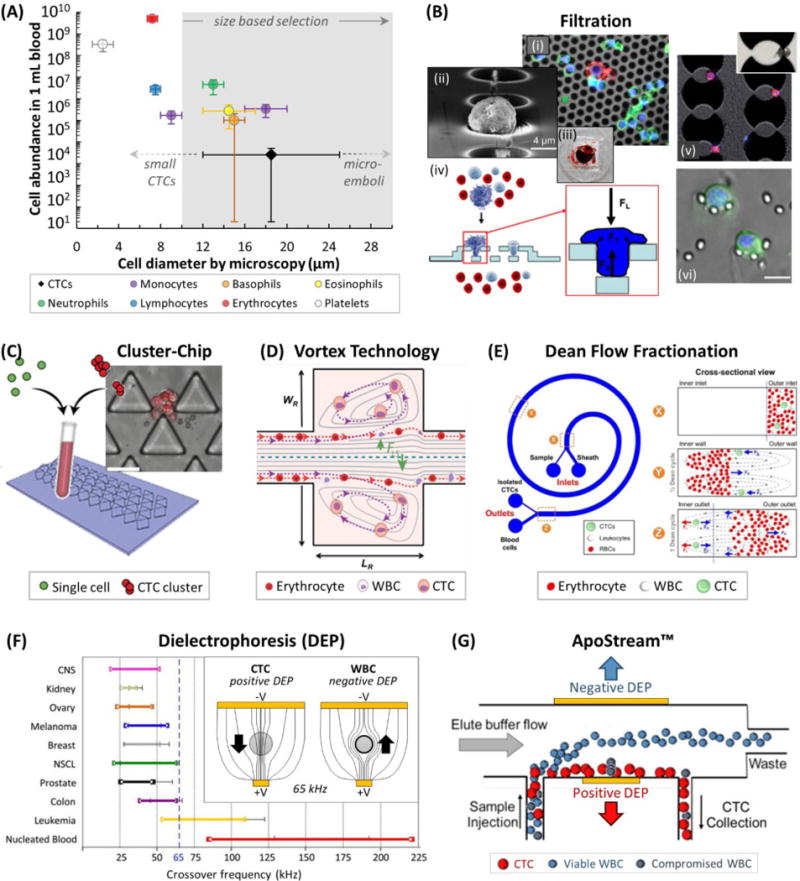
(A) Cell abundance versus cell diameter of blood cells27 and CTCs,78 and common size ranges for CTC discrimination.190,206 Note that WBC sizes can be smaller in free solution than when plated for microscopy.55,56 (B) (i) A CK(+)/DAPI(+) CTC (red and blue) amongst CD45(+)/DAPI(+) WBCs (green and blue) on a Si filter membrane.193 (ii) SEM of a fixed CTC on a 2D parylene-C membrane.195 (iii) Picture of a clogged filter after processing 7.5 mL of blood.192 (iv) Schematic of a 3D parylene-C membrane.190 (v) Brightfield and fluorescence images of MCF-7 cells filtered after size enlargement with anti-EpCAM microbeads.194 (vi) Images of CTCs trapped in a micropillar-based filtration device.198 (C) The Cluster-Chip collects CTC clusters specifically due to their size.50 (D) The Vortex Technology hydrodynamically traps large CTCs in side channels at high flow rates.56 (E) Dean Flow Fractionation is a hydrodynamic centrifugation method for size-dependent separation of CTCs.206 (F) Dielectrophoretic crossover frequencies for cancer cell lines, leukemia cell lines, and WBCs.263 (inset) Working principle of DEP showing field lines for positive and negative DEP experienced by CTCs and WBCs at 65 kHz, respectively.208 (G) Schematic of the ApoStream™ technology for DEP-flow field fractionation of CTCs.66 Figure panels reproduced from reference195 with permission from Elsevier, copyright 2007; reference192 with permission from Nature Publishing Group, copyright 2014; reference190 with permission from Springer, copyright 2011; reference198 with permission from Elsevier, copyright 2010; reference50 with permission from Nature Publishing Group, copyright 2015; reference206 with permission from Nature Publishing Group, copyright 2013; reference263 with permission from AIP Publishing, copyright 2013; and reference66 with permission from AIP Publishing, copyright 2012.
Modern filter membranes have utilized lithographic methods to precisely pattern pores into silicon193,194 and polymers such as parylene-C,190,195,196 poly(ethylene glycol diacrylate) (PEGDA),197 and PDMS.198 However, the cost for filter fabrication has ranged from extremely expensive palladium microfilters199 to multi-stage deep reactive ion etching (DRIE) for each set of silicon or parylene-C microfilters190,193 and replication of a lithographically-patterned master by PEGDA photo-polymerization197 or PDMS casting.198
Filtration methods generally achieve much higher throughput than positive affinity-selection (Table 1), being limited only by the fluidic force that can be imposed on a trapped CTC without the CTC deforming and passing through the pore197 or the CTC being mechanically damaged.190 For example, Lin and coworkers used a parylene-C microfilter196 (16,000 pores, 8 μm diameter; Fig. 7B(ii))195 to process 7.5 mL of formalin-fixed blood in 2 min (see Table 1 for clinical results, which showed a 45% increase in clinical sensitivity compared to paired CellSearch™ CTC Tests).196 Fixation was critical because under these fluidic pressures, live cell lines were mechanically lysed.190
To reduce the tension and stress on the trapped CTCs, a 2D parylene-C slot microfilter80 and a 3D parylene-C microfilter190 have been designed. The 2D microfilter was an array of 30,401 slots, each 6 μm wide and ~25 μm long that filled ~18% of the filter’s surface area, thereby reducing the pressure gradient that can damage trapped CTCs (~90% cell viability was retained). The slot microfilter has been combined with Ficoll centrifugation blood pre-processing to isolate ~70% of spiked cells from blood (Table 1) but with modest purity (1,500-fold enrichment;80 >103 WBCs from a 7.5 mL sample200). Although, the purity was sufficient to perform a quantitative PCR (qPCR) assay for telomerase activity on samples that had ≥5 CTCs per sample by paired CellSearch™ enumeration.200 Additionally, the slot microfilter was coated with PNIPAm to enable thermal release of the recovered CTC fraction, increasing the efficiency of a reverse flow release to 77 ±5% from only 6 ±1% for a bare parylene-C substrate.201
In a separate report, the 3D microfilter (Fig. 7B(iv)) was fabricated by multiple DRIE processes and was composed of two surfaces patterned with 7,000 pores (8–9 μm diameter) that were offset, creating a fluidic conduit through the 6.5 μm spacing between the layers. A CTC that passed through the top pore then rested on the bottom surface, which along with other mechanisms physically supported and reduced tension on the CTC. Smaller and/or more deformable cells squeezed through the 6.5 μm gap between the layers and escaped the filter. Unfixed MCF-7 cells could be recovered (~86%) from 1 mL blood (diluted 10 fold) in 3–5 min, but 4,500–11,000/mL of WBCs were retained, causing the filter to clog if more than 1 mL of blood was processed.190
In contrast, a 2D silicon-based membrane (Fig. 7B(i)) with 100,000 pores (10 μm diameter) per device recovered about 80% of live MCF-7 cells from 1 mL blood (diluted 2 fold).193 Similar to the parylene-C slot microfilter,80 this technology’s ability to isolate unfixed cells may be attributed to the high number of pores, a large proportion of which likely remained open as WBCs (~200–6,000/mL) were retained.193
Kim et al. fabricated a system of micropillars that were “hollowed” with a large internal open chamber that was connected on either side by two sequential 8 μm channel gaps, i.e., 8 μm “pores” (Fig. 7B(v)). CTCs passed through the first pore and became trapped in the chamber, where fluidic stress was reduced by 23% at the second gap and reduced the probability that CTCs would escape. The authors found that ~85% of unfixed MCF-7 cells (17 μm diameter) easily squeezed through both 8 μm pore structures,194 which is surprising given retention of live MCF-7 cells in 10 μm pores under a trans-membrane pressure differential that was two orders of magnitude greater than in the chambers used by Kim et al.193 In order to retain live MCF-7 cells in the micropillar system, Kim et al. labelled the cells with 3 μm anti-EpCAM beads to increase their diameter to 23 μm, which provided 92% recovery. This method was designed to improve recovery and purity by selectively amplifying the size of CTCs, but WBCs still remained (~350/mL) outside the micropillars194 where shear stress was likely too weak to disrupt nonspecific interactions.
Low purity of the CTC isolates has been the most persistent obstacle in filtration-based technologies. Yet one filtration method detailed by Tan et al.198,202 achieved purities that rival some positive-affinity-selection technologies.29,31,39,49,67,74 Using PDMS casting, the authors fabricated a 20 μm deep microfluidic channel filled with cell traps, sets of three 3–4 μm posts spaced by 5 μm in an arc shape (Fig. 7B(vi)). Blood samples (diluted 3 fold) from five cancer patients were processed, and larger CTCs were trapped (10–42 CTCs/mL; median 18). WBCs were effectively cleared through the traps, and high purities were reported (89%, 2–6 WBCs/mL). Some technical aspects remain to be resolved for this technology: (i) Due to the microchannel’s small dimensions, the device has low sample throughput (0.23 mL/h),202 and (ii) the recovery of cell lines spiked into blood or clinical CTCs should be determined to add to the recoveries from phosphate buffer (~80%).198,202
Differing from other filtration technologies, a method specifically catered to isolating micro-emboli or clusters of CTCs (defined as ≥2 joined CTCs) was developed by Sarioglu and coworkers (Cluster-Chip; Fig. 7C). CTC clusters have been associated with increased metastatic potential and poor patient prognosis but are even rarer than single CTCs (~1–5 per 10 mL blood).50 CTC clusters have been identified in other technologies as well.22,65,74,165,193
The Cluster-Chip created a 12 μm gap between the bases of two triangular micropillars, where the passing blood then split around the top of another triangular micropillar. A cluster of CTCs attempting to split around the micropillar would be retained by cell-cell junctions; recovery increased with the number of CTCs in the cluster (Table 1). The authors demonstrated improved recovery of CTC clusters compared to 5 μm PC membranes.50 The rarity of CTC clusters was evident as the Cluster-Chip detected them in 30–41% of 58 cancer patients (4 mL blood). Further, CTC clusters could be released in an unspecified elution volume by reversing the flow direction and increasing flow rate 10-fold to 250 mL/h. The authors noted that release efficiency was temperature dependent and best at 4°C, which purportedly reduced nonspecific cell adhesion.50 However, purity of the cluster isolate was not discussed, and it is not clear to what degree the stagnant flow regions behind the triangular pillars or stagnant regions generated by large clusters, which may obstruct flow, retained contaminating WBCs. As in other reports,107 a micromanipulator was used to physically select CTC clusters for molecular transcriptional analysis50 and for investigating the ability of CTC clusters to traverse through constricting blood vessels.203
5.2. Hydrodynamic size separation
Technologies have been developed that use hydrodynamic forces to select CTCs based on size and deformability without the use of any physical structures. This strategy can reduce the risk of device clogging and improve purity. Here, we discuss two examples of such hydrodynamic size selection.
The Vortex technology (Fig. 7D) is comprised of 856 to 16204 parallel microfluidic channels, each being long and narrow except for occasional short segments of side channels that abruptly enlarge the channel width by a factor of roughly 25. As a sample is infused through the central channels, high volumetric flow rates (~30 mL/h per channel) align cells at an equilibrium position closer to the wall.56 This is known as the Segré-Silderberg effect and is in part due to a shear-gradient force ( ) that displaces cells away from the channel’s midline:
| (4) |
where is a dimensionless lift coefficient; is the fluid’s density; is the fluid’s maximum velocity; is the channel’s width or smallest axial dimension; and is the cell’s diameter. As the cell approaches the wall, a lift force is generated that counters and pushes the cell back towards the center of the channel:
| (5) |
The balance of Eqs. (4) and (5) establishes an equilibrium axial position for cells that depends primarily on the cell’s diameter, with smaller cells displaced closer to the channel wall than larger cells. Once the cells reach a side channel where the channel abruptly widens (i.e., channel height is now the smallest dimension), alone now propels the cell into the trap with a velocity that scales by after taking into account Stokes fluidic drag force. Hence, larger cells (CTCs) move laterally faster, and because the side channel is relatively short, smaller cells such as WBCs are less likely to enter the side channel. Uniquely, at these very high volumetric flow rates, circulating vortices form in the side channels that can effectively trap CTCs if they enter the side channel by ,56,205 unless too many CTCs enter and push one another out of the vortex (theoretical limit of 40 CTCs per channel).56 To release the trapped cells, the flow rate can be reduced (0.75 mL/h per channel), at which point the vortices discontinue and the cells elute off-chip205 in a volume of 300 μL.204
The first Vortex report demonstrated a recovery of 23% of MCF-7 cells spiked into WBCs that were pre-purified by red blood cell lysis. The spike ratio was 1:102 CTC:WBC (1:106 to 1:107 is expected in a clinical sample) and the purity was 6.6% (~6,500 WBCs/mL).205 In more recent studies, the central channel’s dimensions were fine-tuned for initial cell focusing and the side-channels were lengthened. The recovery of MCF-7 cells spiked into 10X diluted whole blood were 8–26% with similar results from lysed blood,56 and two rounds of processing were used to increase recovery to 28–37%.204 Variability in the recovery between experiments was suspected to be due to variability in cell properties through culture.56,204 Clinical sensitivities of 50% and 88%56,204 were achieved for breast and lung cancer patients, respectively (Table 1). However, in one report, nucleated cells that neither stained for epithelial nor mesenchymal markers were also counted as CTCs;204 the source of CTCs that do not possess either phenotype is not clear. Sensitivities based on CK(+) or Vim(+) CTCs was not provided. Purities of 57–95% (0.5–12.7 WBCs/mL)56 and 1–60% (1.4–92.5 WBCS/mL)204 have been achieved in the latest reports.
Another hydrodynamic size separation technology utilizes Dean Flow Fractionation (Fig. 7E). When fluid was infused around a curved channel at high flow rates (6 mL/h), centrifugal forces pushed fluid in the center of the channel outward, causing two recirculation profiles to form in the top and bottom of the channel, i.e., Dean vortices. To utilize these Dean vortices for size separation, a blood sample (diluted 2-fold) was infused into the device, and blood components were pushed to the outer wall of a spiral channel by a sheathing buffer flow. The channel then spiraled for ~10 cm, which provided enough time for the blood cells to make one full recirculation and return to the outer edge of the channel. However, larger cells (presumably CTCs) experienced a wall-induced lift force ( ) as they approached the channel’s inner edge, thereby slowing their rotation and causing them to achieve only one-half of a full recirculation. Thus, at the outlet, CTCs resided on the inner side of the channel, where they were skimmed to a separate outlet.
Likely due to random cell-cell interactions, ~1% of WBCs were retained, so the CTC effluent was fed into a second rendition of the device to achieve ~85% cell line recoveries, 100% sensitivity for 20 lung cancer patients (Table 1), and a purity of 0.1-10% (~440 ±320 WBCs/mL). Interestingly, a wide size range of CTCs were isolated, including 10 μm CTCs that theoretically should not have been recovered by Dean Flow Fractionation, suggesting that either cell deformability206 or cell-cell interactions should be included in the underlying theory. The latest generation of the device eliminated the fluid dynamical effects from RBCs by first performing RBC lysis of the blood sample then centrifugation and resuspension in buffer, which also pre-concentrated the sample for increased throughput (12 mL/h).207 Despite the additional lysis step,81,82 Warkiani, et al. observed similar cell line recoveries (71–81%) at low spike levels.207 median CTC yields from lung and breast cancer patients were 97 and 44 CTCs/mL recovered, respectively (Table 1), but a higher level of WBCs was also observed with 5,250 ±6,570 WBCs/mL (range of 9 to 29,824 WBCs/mL) contaminating the CTC fraction.207
5.3. Dielectrophoretic (DEP) separations
When an AC voltage is imposed across two electrodes of different sizes, asymmetric field lines are generated that are concentrated (higher field strength) towards the smaller electrode. A biological cell will shift position in response to this field, either with or against the gradient depending on the cell’s physical properties (Fig. 7F, inset).
At low AC frequencies, buffer ions accumulate on the cell membrane’s surface and form a capacitive layer, excluding field lines from the cell’s interior and repelling the cell away from high field regions (negative DEP). At high AC frequencies, the field shifts too frequently for the capacitive layer to build, and the electric field passes through the cell’s interior and due to its cytosolic ions, shifting the cell towards the higher field (positive DEP). Negative or positive DEP only occurs if the cell’s membrane is intact and the cytosolic conductivity (~1,400 mS/m) is greater than the buffer conductivity (~30 mS/m), so the buffer is kept isotonic using non-conductive osmolytes such as sucrose. However, these buffers induce osmotic stress that can cause leakage of cytosolic ions over time.208
DEP separations are performed by adjusting the AC field frequency; each cell has a characteristic DEP crossover frequency that marks the transition from negative to positive DEP as the AC frequency is increased. Physically, differences in the crossover frequency relate to the cell membrane’s surface area, with larger surface areas requiring more ions and thus lower field frequencies to form capacitance. Not only are CTCs larger, but a CTC’s membrane is intricately folded with a surface area ~60% greater than a WBC of the same size. For CTCs, this increased surface area results from the CTC transitioning from an epithelial matrix with many cell-cell junctions to a liquid blood matrix. This endows CTCs with a DEP crossover frequency of 20–75 kHz (compiled from over 80 tumour cell lines, Fig. 7F), whereas 15 types of WBCs were found to possess crossover frequencies >85 kHz.208 At 45–65 kHz, CTCs were attracted toward or only slightly repelled from the smaller electrode, whereas WBCs were strongly repelled.66,208
Many forms of DEP separations have been performed, such as DEP trapping by the DEPArray™.208 Another rendition is DEP-flow field fractionation (Apostream™, Fig. 7G). Here, a dilute buffy coat was infused into and focused to the bottom of a flow chamber using a sucrose sheathing buffer. Cells that passed over the DEP electrodes were sorted into different positions with respect to the electrodes due to DEP forces, sedimentation, and wall lift forces; CTCs exited through a bottom outlet while WBCs levitated and passed into a waste outlet. Using DEP-flow field fractionation, both epithelial and mesenchymal CTC cell lines have been recovered with ~70% efficiency,66 and clinical results have been promising (Table 1)209–214 with substantially higher CTC yields for M-NSCLC adenocarcinoma patients compared to the CellSearch™ CTC Test (Fig. 4). However, clinical sensitivities for M-NSCLC squamous, M-ovarian, and M-breast cancers were low (Table 1).214 Challenges with DEP techniques include the need for pre-processing, for example RBC removal, and purity of ~0.3% (~10,000 WBCs/mL).66 While all viable WBCs should experience negative DEP at 45–65 kHz and levitate, approximately 0.1% of WBCs in blood are nearing the end of their lifespan and have weakened membrane integrity that make them susceptible to osmotic stress (ion leakage) and will not form a capacitive layer; these dying or dead WBCs appear in the CTC fraction.208 Gupta et al. did improve purity to ~10% (a few hundred WBCs/mL) by a second round of DEP, but recovery dropped to ~50%.66
6. Beyond CTC enumeration
CTC enumeration is an invaluable tool in patient prognosis and evaluation, monitoring patients in remission for relapse, and potentially for screening.215 However, CTC enumeration alone does not provide the information needed to guide changes in clinical/therapeutic actions that can affect patient outcome.86,215 As such, several downstream analyses for CTCs have been explored (Fig. 2 and Table 1).
CTCs can be screened for genetic mutations in known oncogenes, such as clinically actionable mutations in the KRAS, EGFR, HER2, and estrogen receptor (ER) genes.18 Several genomic analyses have been conducted, including: fluorescence in situ hybridization (FISH) imaging of cytogenetic abnormalities,34,51,65,78,79,212,216 array comparative genomic hybridization (aCGH) to assess copy number variations (CNVs);217–219 modified PCR protocols such as ice-COLD-PCR (improved and complete enrichment – co-amplification at lower denaturation temperature – PCR) that selectively amplify rare mutated DNA in the presence of wild-type down to a level of 0.05% abundance;207,213,220 DNA Sanger sequencing to identify somatic single nucleotide variants (SSNVs; i.e., point mutations), insertions, and/or deletions in a limited number of oncogenes at a sensitivity of ~5%;29,41,79 ligase detection reaction (LDR) for detecting SSNVs with improved sensitivity (~0.01%);29,221 and Next Generation Sequencing (NGS), which can range in coverage from simultaneously sequencing tens to hundreds of oncogenic exons29,217 to the entire exome.97,222
Studies have compared CTC genomes with the primary and metastatic tumours; the biological implications have been thoroughly reviewed by Pantel and Speicher.215 In brief, the emerging view is that mutational patterns may differ between individual CTCs and the primary tumour, indicating that some CTCs may possess enhanced metastatic potential.215 Securing genetic information from CTCs is not easy, however. A number of technical difficulties need to be considered when analyzing only a few copies of the genome, especially a single cell. Whole genome amplification (WGA) by isothermal multiple-displacement amplification is commonly performed. While many polymerases have proofreading capabilities and high fidelity for DNA replication, errors such as allelic dropout, random and potentially recurrent base-copying errors, and distortion of CNVs can occur.223,224
Lohr et al. performed whole exome sequencing (WES) to identify SSNVs in single CTCs isolated from patients with metastatic prostate cancer (high disease burden) using the MagSweeper technology. However, amplification errors could not be differentiated from true SSNVs using only one CTC. For “single cell” analysis, it was necessary to combine high quality NGS sequences from ≥5 single CTCs (consensus sequencing) to eliminate the random amplification errors and accurately identify SSNVs common to these CTCs. Due to variable success of WGA (11–100%), it was estimated that a minimum of 10 CTCs would need to be pooled for successful sequencing. Consequently, the authors noted that microfluidic technologies might be required to acquire sufficient starting material to apply NGS to a broad range of localized and metastatic cancers.97
mRNA analysis offers the advantage of multiple transcripts of a single gene to assist in overcoming copy limitations associated with genomic DNA.215 mRNA transcripts can be reverse transcribed into complementary DNA and amplified by PCR (RT-PCR),225 giving rise to an abundance of material for downstream processing. Transcripts expressed at >10 copies per CTC can be reliably sequenced.224,225 Techniques for CTC transcriptional analysis include: fluorescence-based RNA-ISH;28 quantitative RT-PCR (qRT-PCR);75,107,216,226–230 RT-PCR36 followed by Sanger sequencing;39,65,107 multiplexed microarray analysis;30,98,231 and NGS-based whole transcriptome RNA sequencing (RNAseq).50,67,111,141 Amongst several important observations,215 RNA sequencing has identified mesenchymal features in CTCs28,231 and unique transcription profiles associated with metastatic potential and therapy resistance.98,141,229,231
Multiplexed proteomic analysis of CTCs is largely inhibited by mass limitations as well, requiring sequential ex vivo expansion of CTCs in culture to accumulate sufficient protein input for mass spectrometry.232 Alternative methods for analyzing rare CTCs without expansion are restricted by the number of proteins targeted.233 Using the epithelial immunospot (EPISPOT) assay, proteins such as CKs or PSA that are secreted from viable, RosetteSep™-enriched CTCs are detected via a sandwich immunoassay.234 EPISPOT has analyzed CTCs derived from patients with breast, prostate,235 and colorectal cancers236 as well as patients with benign colon diseases.35 Microwells have been used to conduct single cell western blots,237 which may prove useful for investigating heterogeneity in protein expression between individual CTCs for select protein markers. However, methods for profiling single CTC proteomes that offer high multiplexing capability and discovery-level applicability of mass spectrometry233 without also incurring the associated limitations of ex vivo culturing have yet to emerge.
Ex vivo expansion of patient-derived CTCs has been extensively explored as an avenue to test drug susceptibility of the tumour.115,190 Examples include 2D culturing of CTCs that morph into an epithelial morphology on a collagen adhesion matrix,30 the deposition of RBC-lysed blood into 2D microwells for short-term expansion of CTCs238 and drug susceptibility testing,239 3D culturing of tumour cell spheres111 and organoids,240 implantation of CTCs in immunocompromised mice for xenograft studies,111,241–243 and the recent establishment of the first immortalized cell line (CTC-MCC-41) from patient-derived colon cancer CTCs.241 In particular, studies242,243 have demonstrated the ability of some CTCs to form metastases.215 However, as discussed by Ignatiadis et al., there are fundamental limitations to these studies, such as the lack of interactions between the tumour and host immune system and a disposition in selecting highly aggressive CTC subclones that may not recapitulate the entire spectrum of CTC subtypes.5
7. Conclusions and outlook
In this review, we presented examples of microfluidic technologies used to isolate CTCs from cancer patients’ blood using either biological or physical characteristics of CTCs. For these microfluidic technologies, performance was evaluated using the following analytical figures of merit: purity, throughput, recovery, and clinical yield as well as clinical sensitivity/specificity. We discussed the materials chemistry underlying the platform design, fluid dynamics that affect CTC recovery, and methods for addressing CTC heterogeneity. From the informational content contained in this review, the question can be asked: Is there a technology that can provide the necessary operational metrics for every cancer disease (>100 different diseases) and any clinical scenario (screening for early detection, matching patients to the appropriate therapy – precision medicine, response to therapy, or disease recurrence)?
Of the platforms discussed (with the exception of the CellSearch™ CTC Test), all have been relegated to research and not adopted into clinical practice due in part to the fact that none are approved by the US-FDA; the CellSearch™ CTC Test is the only technology with FDA-approval for breast, colorectal, and prostate cancer. While many new microfluidic technologies are being commercialized (see Ferreira, et al.244), the development of technologies with varying degree of improvement in terms of performance relative to the FDA-approved test will require a clear definition of the clinical question targeted by the technology in order to be adopted by the medical community.
The choice of a particular CTC isolation technology will be driven primarily by the clinical question being addressed to provide a clear path for FDA approval. For example, the molecular profiling of CTCs using clinically relevant genetic markers will require technologies that can generate high purity in the CTC isolate; recovery, because 1 g of tumour tissue can generate 106 CTCs per day, is not the only metric of significance.245 While single cell assays can relax the need for high purity to accommodate follow-up molecular assays, it requires instrumentation to “pick” the CTCs in sufficient quantities to improve the quality of the molecular information garnered from the assay. Also, eliminating the need for sample pre-processing prior to CTC selection is critical because it can reduce sample loss and cross-contamination, especially when operated in a high volume clinical laboratory.
Whatever the clinical question being addressed, clinical trials using CTCs and the isolation technology will require thousands of tests to validate the assay and answer the clinical question with sufficient statistical significance. If microfluidics is the platform of choice for the CTC analysis, the chip must be produced in high numbers at low cost and with tight tolerances generating an assay that is highly reproducible. Devices that can utilize a substrate material that takes advantage of existing production pipelines, such as those used for the manufacturing of CDs, DVDs and Blu-ray discs, are attractive.246
Devices exploiting physical CTC isolation are generally simpler to produce and requires a less complicated assay workflow, but because the CTC purity is typically low, the CTCs must be identified via immunophenotyping amongst a large background of WBCs and the CTCs “picked” from the device. Biological CTC isolation platforms, on the other hand, provide the ability to select a more specifically defined CTC type and an isolate of higher purity making these platforms amenable to molecular analyses such as NGS, mRNA expression profiling, or FISH, to name a few. In addition, with sufficient purity, biological CTC assays can feed directly into the molecular analysis pipeline multiple CTCs with a defined phenotype to improve data quality.97 However, biological CTC assays have a more challenging workflow requiring mAb immobilization chemistries and release strategies that are robust. Also, it is clear that to provide sufficient clinical sensitivity, the use of a single mAb assay is not advisable due to the intrinsic heterogeneity of the tumour microenvironment.
Molecular profiling of CTCs against panels of clinically relevant oncogene biomarkers, such as KRAS and EGFR mutations, can potentially be important in the near-term. Some mutational assays are already recommended by several governing bodies for making clinical decisions. A CTC isolation technology could be used as a sample preparation platform to secure genetic material for existing assays, thereby replacing the need for invasive solid tissue biopsies. For example, KRAS testing is already recommended for patients with colorectal or lung cancer considering anti-EGFR monoclonal antibody treatment.247,248 For CTC technologies supplying such information, clinical yield will be important so as to provide a sufficient number of CTCs and that also recapitulate tumor microenvironment.97 Further, high purity of the CTC isolate greatly simplifies molecular profiling by removing WBC-derived genetic material.
While it is clear that downstream molecular profiling of CTCs can provide information associated with the tumour, little research has been dedicated toward integrating CTC microfluidic isolation platforms with enumeration and molecular profiling capabilities (Fig. 5E).74,164 A sample-to-answer microfluidic system with full process automation will facilitate dissemination of CTC-based assays into the clinic because it can eliminate the need for manual handling of samples, therefore providing higher sample processing throughput at potentially lower cost. Such systems have already been instrumental in identifying patients with drug resistant bacterial infection.249 By similar integration pathways, it is possible that in the future, CTC technologies could be mated with new technologies that are emerging to sequence genetic material without amplification.136,250–252 Lastly, the integration of CTC analysis with emerging diagnostics based on circulating cell-free tumour DNA5,253–255 and exosomes255–257 will continue to be explored potentially as a source of complementary information for the monitoring and management of cancer patients throughout the various stages of disease progression and treatment.215,254
Acknowledgments
We acknowledge financial support from the NIH (NIBIB: P41-EB020594 and NCI - IMAT: R21-CA173279), and JMJ thanks the ACS Division of Analytical Chemistry, the Society for Analytical Chemists of Pittsburgh, the Chemical and Biological Microsystems Society, and the University of North Carolina at Chapel Hill for funding.
References
- 1.Weigelt B, Peterse JL, van’t Veer LJ. Nat Rev Cancer. 2005;5:591–602. doi: 10.1038/nrc1670. [DOI] [PubMed] [Google Scholar]
- 2.Mehlen P, Puisieux A. Nat Rev Cancer. 2006;6:449–458. doi: 10.1038/nrc1886. [DOI] [PubMed] [Google Scholar]
- 3.Pantel K, Brakenhoff RH. Nat Rev Cancer. 2004;4:448–456. doi: 10.1038/nrc1370. [DOI] [PubMed] [Google Scholar]
- 4.Lu J, Steeg PS, Price JE, Krishnamurthy S, Mani SA, Reuben J, Cristofanilli M, Dontu G, Bidaut L, Valero V, Hortobagyi GN, Yu D. Cancer research. 2009;69:4951–4953. doi: 10.1158/0008-5472.CAN-09-0099. [DOI] [PubMed] [Google Scholar]
- 5.Ignatiadis M, Lee M, Jeffrey SS. Clinical cancer research: an official journal of the American Association for Cancer Research. 2015;21:4786–4800. doi: 10.1158/1078-0432.CCR-14-1190. [DOI] [PubMed] [Google Scholar]
- 6.Chaffer CL, Weinberg RA. Science. 2011;331:1559–1564. doi: 10.1126/science.1203543. [DOI] [PubMed] [Google Scholar]
- 7.Thiery JP, Acloque H, Huang RY, Nieto MA. Cell. 2009;139:871–890. doi: 10.1016/j.cell.2009.11.007. [DOI] [PubMed] [Google Scholar]
- 8.Charafe-Jauffret E, Ginestier C, Iovino F, Wicinski J, Cervera N, Finetti P, Hur MH, Diebel ME, Monville F, Dutcher J, Brown M, Viens P, Xerri L, Bertucci F, Stassi G, Dontu G, Birnbaum D, Wicha MS. Cancer research. 2009;69:1302–1313. doi: 10.1158/0008-5472.CAN-08-2741. [DOI] [PMC free article] [PubMed] [Google Scholar]
- 9.Pang R, Law WL, Chu AC, Poon JT, Lam CS, Chow AK, Ng L, Cheung LW, Lan XR, Lan HY, Tan VP, Yau TC, Poon RT, Wong BC. Cell stem cell. 2010;6:603–615. doi: 10.1016/j.stem.2010.04.001. [DOI] [PubMed] [Google Scholar]
- 10.Marcato P, Dean CA, Pan D, Araslanova R, Gillis M, Joshi M, Helyer L, Pan L, Leidal A, Gujar S, Giacomantonio CA, Lee PW. Stem cells. 2011;29:32–45. doi: 10.1002/stem.563. [DOI] [PubMed] [Google Scholar]
- 11.Mani SA, Guo W, Liao MJ, Eaton EN, Ayyanan A, Zhou AY, Brooks M, Reinhard F, Zhang CC, Shipitsin M, Campbell LL, Polyak K, Brisken C, Yang J, Weinberg RA. Cell. 2008;133:704–715. doi: 10.1016/j.cell.2008.03.027. [DOI] [PMC free article] [PubMed] [Google Scholar]
- 12.Morel AP, Lievre M, Thomas C, Hinkal G, Ansieau S, Puisieux A. PloS one. 2008;3:e2888. doi: 10.1371/journal.pone.0002888. [DOI] [PMC free article] [PubMed] [Google Scholar]
- 13.Gal A, Sjoblom T, Fedorova L, Imreh S, Beug H, Moustakas A. Oncogene. 2008;27:1218–1230. doi: 10.1038/sj.onc.1210741. [DOI] [PubMed] [Google Scholar]
- 14.Ocana OH, Corcoles R, Fabra A, Moreno-Bueno G, Acloque H, Vega S, Barrallo-Gimeno A, Cano A, Nieto MA. Cancer cell. 2012;22:709–724. doi: 10.1016/j.ccr.2012.10.012. [DOI] [PubMed] [Google Scholar]
- 15.Tsai JH, Donaher JL, Murphy DA, Chau S, Yang J. Cancer cell. 2012;22:725–736. doi: 10.1016/j.ccr.2012.09.022. [DOI] [PMC free article] [PubMed] [Google Scholar]
- 16.Tsuji T, Ibaragi S, Shima K, Hu MG, Katsurano M, Sasaki A, Hu GF. Cancer research. 2008;68:10377–10386. doi: 10.1158/0008-5472.CAN-08-1444. [DOI] [PMC free article] [PubMed] [Google Scholar]
- 17.Tam WL, Weinberg RA. Nature medicine. 2013;19:1438–1449. doi: 10.1038/nm.3336. [DOI] [PMC free article] [PubMed] [Google Scholar]
- 18.Alix-Panabières C, Pantel K. Nat Rev Cancer. 2014;14:623–631. doi: 10.1038/nrc3820. [DOI] [PubMed] [Google Scholar]
- 19.Cristofanilli M, Hayes DF, Budd GT, Ellis MJ, Stopeck A, Reuben JM, Doyle GV, Matera J, Allard WJ, Miller MC, Fritsche HA, Hortobagyi GN, Terstappen LW. Journal of clinical oncology: official journal of the American Society of Clinical Oncology. 2005;23:1420–1430. doi: 10.1200/JCO.2005.08.140. [DOI] [PubMed] [Google Scholar]
- 20.Stathopoulou A, Vlachonikolis I, Mavroudis D, Perraki M, Kouroussis C, Apostolaki S, Malamos N, Kakolyris S, Kotsakis A, Xenidis N, Reppa D, Georgoulias V. Journal of clinical oncology: official journal of the American Society of Clinical Oncology. 2002;20:3404–3412. doi: 10.1200/JCO.2002.08.135. [DOI] [PubMed] [Google Scholar]
- 21.Aceto N, Bardia A, Miyamoto DT, Donaldson MC, Wittner BS, Spencer JA, Yu M, Pely A, Engstrom A, Zhu H, Brannigan BW, Kapur R, Stott SL, Shioda T, Ramaswamy S, Ting DT, Lin CP, Toner M, Haber DA, Maheswaran S. Cell. 2014;158:1110–1122. doi: 10.1016/j.cell.2014.07.013. [DOI] [PMC free article] [PubMed] [Google Scholar]
- 22.Hou JM, Krebs MG, Lancashire L, Sloane R, Backen A, Swain RK, Priest LJ, Greystoke A, Zhou C, Morris K, Ward T, Blackhall FH, Dive C. Journal of clinical oncology: official journal of the American Society of Clinical Oncology. 2012;30:525–532. doi: 10.1200/JCO.2010.33.3716. [DOI] [PubMed] [Google Scholar]
- 23.Zhou Z, Qutaish M, Han Z, Schur RM, Liu Y, Wilson DL, Lu ZR. Nat Commun. 2015;6:7984. doi: 10.1038/ncomms8984. [DOI] [PMC free article] [PubMed] [Google Scholar]
- 24.Jackson JM, Taylor JB, Witek MA, Hunsucker SA, Waugh JP, Fedoriw Y, Shea TC, Soper SA, Armistead PM. Analyst. 2016;141:640–651. doi: 10.1039/c5an01836f. [DOI] [PMC free article] [PubMed] [Google Scholar]
- 25.Joosse SA, Gorges TM, Pantel K. EMBO molecular medicine. 2015;7:1–11. doi: 10.15252/emmm.201303698. [DOI] [PMC free article] [PubMed] [Google Scholar]
- 26.Allard WJ, Matera J, Miller MC, Repollet M, Connelly MC, Rao C, Tibbe AGJ, Uhr JW, Terstappen LWMM. Clinical cancer research: an official journal of the American Association for Cancer Research. 2004;10:6897–6904. doi: 10.1158/1078-0432.CCR-04-0378. [DOI] [PubMed] [Google Scholar]
- 27.Young B. Wheater’s functional histology: a text and colour atlas. 5th. Churchill Livingstone/Elsevier; London, England: 2006. [Google Scholar]
- 28.Yu M, Bardia A, Wittner BS, Stott SL, Smas ME, Ting DT, Isakoff SJ, Ciciliano JC, Wells MN, Shah AM, Concannon KF, Donaldson MC, Sequist LV, Brachtel E, Sgroi D, Baselga J, Ramaswamy S, Toner M, Haber DA, Maheswaran S. Science. 2013;339:580–584. doi: 10.1126/science.1228522. [DOI] [PMC free article] [PubMed] [Google Scholar]
- 29.Witek MA, Aufforth RD, Wang H, Kamande JW, Jackson JM, Pullagurla SR, Hupert ML, Usary J, Wysham WZ, Bae-Jump V, Carey LA, Gehrig PA, Milowsky MI, Perou CM, Soper JT, Whang YE, Yeh JJ, Martin G, Soper SA. Under review 2016 [Google Scholar]
- 30.Lu J, Fan T, Zhao Q, Zeng W, Zaslavsky E, Chen JJ, Frohman MA, Golightly MG, Madajewicz S, Chen WT. International Journal of Cancer. 2010;126:669–683. doi: 10.1002/ijc.24814. [DOI] [PMC free article] [PubMed] [Google Scholar]
- 31.Jackson JM, Witek MA, Hupert ML, Brady C, Pullagurla S, Kamande J, Aufforth RD, Tignanelli CJ, Torphy RJ, Yeh JJ, Soper SA. Lab on a Chip. 2014;14:106–117. doi: 10.1039/c3lc50618e. [DOI] [PMC free article] [PubMed] [Google Scholar]
- 32.Zhao W, Cui CH, Bose S, Guo D, Shen C, Wong WP, Halvorsen K, Farokhzad OC, Teo GSL, Phillips JA, Dorfman DM, Karnik R, Karp JM. Proceedings of the National Academy of Sciences of the United States of America. 2012:19626–19631. doi: 10.1073/pnas.1211234109. [DOI] [PMC free article] [PubMed] [Google Scholar]
- 33.Saliba AE, Salas L, Psychari E, Minc N, Simon D, Bidard FC, Mathiot C, Pierga JY, Frasier V, Salamero J, Saada V, Farace F, Vieh P, Malaquin L, Viovy JL. Proceedings of the National Academy of Sciences of the United States of America. 2010;107:14524–14529. doi: 10.1073/pnas.1001515107. [DOI] [PMC free article] [PubMed] [Google Scholar]
- 34.Nair SV, Witek MA, Jackson JM, Lindell MAM, Hunsucker SA, Sapp T, Perry E, Hupert ML, Bae-Jump V, Gehrig PA, Wysham WZ, Armistead PM, Voorhees P, Soper SA. Chem Commun. 2015;51:3266–3269. doi: 10.1039/c4cc09765c. [DOI] [PMC free article] [PubMed] [Google Scholar]
- 35.Pantel K, Deneve E, Nocca D, Coffy A, Vendrell JP, Maudelonde T, Riethdorf S, Alix-Panabieres C. Clinical chemistry. 2012;58:936–940. doi: 10.1373/clinchem.2011.175570. [DOI] [PubMed] [Google Scholar]
- 36.Nagrath S, Sequist LV, Maheswaran S, Bell DW, Irimia D, Ulkus L, Smith MR, Kwak EL, Digumarthy S, Muzikansky A, Ryan P, Balis UJ, Tompkins RG, Haber DA, Toner M. Nature. 2007;450:1235–1239. doi: 10.1038/nature06385. [DOI] [PMC free article] [PubMed] [Google Scholar]
- 37.Sabile A, Louha M, Bonte E, Poussin K, Vona G, Mejean A, Chretien Y, Bougas L, Lacour BR, Capron F, Roseto A, Brechot C, Paterlini-Brechot P. Am J Clin Pathol. 1999;112:171–178. doi: 10.1093/ajcp/112.2.171. [DOI] [PubMed] [Google Scholar]
- 38.Mikolajczyk SD, Millar LS, Tsinberg P, Coutts SM, Zomorrodi M, Pham T, Bischoff FZ, Pircher TJ. Journal of oncology. 2011;2011:252361. doi: 10.1155/2011/252361. [DOI] [PMC free article] [PubMed] [Google Scholar]
- 39.Thege FI, Lannin TB, Saha TN, Tsai S, Kochman ML, Hollingsworth MA, Rhim AD, Kirby BJ. Lab on a Chip. 2014;14:1775–1784. doi: 10.1039/c4lc00041b. [DOI] [PubMed] [Google Scholar]
- 40.Mostert B, Kraan J, Bolt-de Vries J, van der Spoel P, Sieuwerts AM, Schutte M, Timmermans AM, Foekens R, Martens JWM, Gratama JW, Foekens JA, Sleijfer S. Breast Cancer Res Tr. 2011;127:33–41. doi: 10.1007/s10549-010-0879-y. [DOI] [PubMed] [Google Scholar]
- 41.Reategui E, Aceto N, Lim EJ, Sullivan JP, Jensen AE, Zeinali M, Martel JM, Aranyosi AJ, Li W, Castleberry S, Bardia A, Sequist LV, Haber DA, Maheswaran S, Hammond PT, Toner M, Stott SL. Advanced materials. 2015;27:1593–1599. doi: 10.1002/adma.201404677. [DOI] [PMC free article] [PubMed] [Google Scholar]
- 42.Agrawal B, Krantz MJ, Parker J, Longenecker BM. Cancer research. 1998;58:4079–4081. [PubMed] [Google Scholar]
- 43.Duda DG, Cohen KS, di Tomaso E, Au P, Klein RJ, Scadden DT, Willett CG, Jain RK. Journal of clinical oncology: official journal of the American Society of Clinical Oncology. 2006;24:1449–1453. doi: 10.1200/JCO.2005.04.2861. [DOI] [PMC free article] [PubMed] [Google Scholar]
- 44.Alix-Panabières C, Schwarzenbach H, Pantel K. Annual review of medicine. 2012;63:199–215. doi: 10.1146/annurev-med-062310-094219. [DOI] [PubMed] [Google Scholar]
- 45.Williams A, Balic M, Datar R, Cote R. Minimal Residual Disease and Circulating Tumor Cells in Breast Cancer, Springer. 2012:87–95. [Google Scholar]
- 46.Gascoyne PRC, Shim S, Noshari J, Becker FF, Stemke-Hale K. Electrophoresis. 2013;34:1042–1050. doi: 10.1002/elps.201200496. [DOI] [PMC free article] [PubMed] [Google Scholar]
- 47.Zhang W, Kai K, Choi DS, Iwamoto T, Nguyen YH, Wong H, Landis MD, Ueno NT, Chang J, Qin L. Proceedings of the National Academy of Sciences of the United States of America. 2012;109:18707–18712. doi: 10.1073/pnas.1209893109. [DOI] [PMC free article] [PubMed] [Google Scholar]
- 48.Karimi A, Yazdi S, Ardekani AM. Biomicrofluidics. 2013;7:21501. doi: 10.1063/1.4799787. [DOI] [PMC free article] [PubMed] [Google Scholar]
- 49.Gleghorn JP, Pratt ED, Denning D, Liu H, Bander NH, Tagawa ST, Nanus DM, Giannakakou PA, Kirby BJ. Lab on a Chip. 2010;10:27–29. doi: 10.1039/b917959c. [DOI] [PMC free article] [PubMed] [Google Scholar]
- 50.Sarioglu AF, Aceto N, Kojic N, Donaldson MC, Zeinali M, Hamza B, Engstrom A, Zhu H, Sundaresan TK, Miyamoto DT, Luo X, Bardia A, Wittner BS, Ramaswamy S, Shioda T, Ting DT, Stott SL, Kapur R, Maheswaran S, Haber DA, Toner M. Nat Methods. 2015;12:685–+. doi: 10.1038/nmeth.3404. [DOI] [PMC free article] [PubMed] [Google Scholar]
- 51.Werner SL, Graf RP, Landers M, Valenta DT, Schroeder M, Greene SB, Bales N, Dittamore R, Marrinucci D. J Circ Biomarkers. 2015;4:1–13. doi: 10.5772/60725. [DOI] [PMC free article] [PubMed] [Google Scholar]
- 52.Jiang RZ, Lu YT, Ho H, Li B, Chen JF, Lin M, Li FQ, Wu K, Wu HJ, Lichterman J, Wan HL, Lu CL, OuYang W, Ni M, Wang LL, Li GB, Lee T, Zhang XQ, Yang JT, Rettig M, Chung LWK, Yang HM, Li KC, Hou Y, Tseng HR, Hou S, Xu X, Wang J, Posadas EM. Oncotarget. 2015;6:44781–44793. doi: 10.18632/oncotarget.6330. [DOI] [PMC free article] [PubMed] [Google Scholar]
- 53.Marrinucci D, Bethel K, Kolatkar A, Luttgen MS, Malchiodi M, Baehring F, Voigt K, Lazar D, Nieva J, Bazhenova L, Ko AH, Korn WM, Schram E, Coward M, Yang X, Metzner T, Lamy R, Honnatti M, Yoshioka C, Kunken J, Petrova Y, Sok D, Nelson D, Kuhn P. Phys Biol. 2012;9:016003. doi: 10.1088/1478-3975/9/1/016003. [DOI] [PMC free article] [PubMed] [Google Scholar]
- 54.Nieva J, Wendel M, Luttgen MS, Marrinucci D, Bazhenova L, Kolatkar A, Santala R, Whittenberger B, Burke J, Torrey M, Bethel K, Kuhn P. Phys Biol. 2012;9:016004. doi: 10.1088/1478-3975/9/1/016004. [DOI] [PMC free article] [PubMed] [Google Scholar]
- 55.Schmid-Schonbein GW, Shih YY, Chien S. Blood. 1980;56:866–875. [PubMed] [Google Scholar]
- 56.Sollier E, Go DE, Che J, Gossett DR, O’Byrne S, Weaver WM, Kummer N, Rettig M, Goldman J, Nickols N, McCloskey S, Kulkarni RP, Di Carlo D. Lab on a Chip. 2014;14:63–77. doi: 10.1039/c3lc50689d. [DOI] [PubMed] [Google Scholar]
- 57.Ao Z, Shah SH, Machlin LM, Parajuli R, Miller PC, Rawal S, Williams AJ, Cote RJ, Lippman ME, Datar RH, El-Ashry D. Cancer research. 2015;75:4681–4687. doi: 10.1158/0008-5472.CAN-15-1633. [DOI] [PubMed] [Google Scholar]
- 58.Khorana AA. Am Soc Hematol Educ Program. 2012;2012:626–630. doi: 10.1182/asheducation-2012.1.626. [DOI] [PubMed] [Google Scholar]
- 59.Caine GJ, Stonelake PS, Lip GYH, Kehoe ST. Neoplasia. 2002;4:465–473. doi: 10.1038/sj.neo.7900263. [DOI] [PMC free article] [PubMed] [Google Scholar]
- 60.Autebert J, Coudert B, Champ J, Saias L, Guneri ET, Lebofsky R, Bidard FC, Pierga JY, Farace F, Descroix S, Malaquin L, Viovy JL. Lab on a Chip. 2015;15:2090–2101. doi: 10.1039/c5lc00104h. [DOI] [PubMed] [Google Scholar]
- 61.Bagnall JS, Byun S, Begum S, Miyamoto DT, Hecht VC, Maheswaran S, Stott SL, Toner M, Hynes RO, Manalis SR. Sci Rep. 2015;5:18542. doi: 10.1038/srep18542. [DOI] [PMC free article] [PubMed] [Google Scholar]
- 62.Sieverts H, Alabaster O, Goldschmidts W, Magrath I. Cancer research. 1986;46:1182–1188. [PubMed] [Google Scholar]
- 63.Tibbe AG, Miller MC, Terstappen LW. Cytometry Part A: the journal of the International Society for Analytical Cytology. 2007;71:154–162. doi: 10.1002/cyto.a.20369. [DOI] [PubMed] [Google Scholar]
- 64.Watanabe M, Serizawa M, Sawada T, Takeda K, Takahashi T, Yamamoto N, Koizumi F, Koh Y. Journal of translational medicine. 2014;12:143. doi: 10.1186/1479-5876-12-143. [DOI] [PMC free article] [PubMed] [Google Scholar]
- 65.Stott SL, Hsu CH, Tsukrov DI, Yu M, Miyamoto DT, Waltman BA, Rothenberg SM, Shah AM, Smas ME, Korir GK, Floyd FP, Gilman AJ, Lord JB, Winokur D, Springer S, Irimia D, Nagrath S, Sequist LV, Lee RJ, Isselbacher KJ, Maheswaran S, Haber DA, Toner M. Proceedings of the National Academy of Sciences of the United States of America. 2010;107:18392–18397. doi: 10.1073/pnas.1012539107. [DOI] [PMC free article] [PubMed] [Google Scholar]
- 66.Gupta V, Jafferji I, Garza M, Melnikova VO, Hasegawa DK, Pethig R, Davis DW. Biomicrofluidics. 2012;6:24133. doi: 10.1063/1.4731647. [DOI] [PMC free article] [PubMed] [Google Scholar]
- 67.Cann GM, Gulzar ZG, Cooper S, Li R, Luo SJ, Tat M, Stuart S, Schroth G, Srinivas S, Ronaghi M, Brooks JD, Talasaz AH. PloS one. 2012;7:e49144. doi: 10.1371/journal.pone.0049144. [DOI] [PMC free article] [PubMed] [Google Scholar]
- 68.den Toonder J. Lab on a Chip. 2011;11:375–377. doi: 10.1039/c0lc90100h. [DOI] [PubMed] [Google Scholar]
- 69.Cohen SJ, Punt CJ, Iannotti N, Saidman BH, Sabbath KD, Gabrail NY, Picus J, Morse M, Mitchell E, Miller MC, Doyle GV, Tissing H, Terstappen LW, Meropol NJ. Journal of clinical oncology: official journal of the American Society of Clinical Oncology. 2008;26:3213–3221. doi: 10.1200/JCO.2007.15.8923. [DOI] [PubMed] [Google Scholar]
- 70.de Bono JS, Scher HI, Montgomery RB, Parker C, Miller MC, Tissing H, Doyle GV, Terstappen LW, Pienta KJ, Raghavan D. Clinical cancer research: an official journal of the American Association for Cancer Research. 2008;14:6302–6309. doi: 10.1158/1078-0432.CCR-08-0872. [DOI] [PubMed] [Google Scholar]
- 71.Theil G, Fischer K, Krahn T, Schumann A, Haubold K, Stresemann A, Hada MR, Hegel K, Luecke K, Fornara P. Journal of clinical oncology: official journal of the American Society of Clinical Oncology. 2014:32. [Google Scholar]
- 72.Fischer JC, Niederacher D, Topp SA, Honisch E, Schumacher S, Schmitz N, Zacarias Fohrding L, Vay C, Hoffmann I, Kasprowicz NS, Hepp PG, Mohrmann S, Nitz U, Stresemann A, Krahn T, Henze T, Griebsch E, Raba K, Rox JM, Wenzel F, Sproll C, Janni W, Fehm T, Klein CA, Knoefel WT, Stoecklein NH. Proc Natl Acad Sci U S A. 2013;110:16580–16585. doi: 10.1073/pnas.1313594110. [DOI] [PMC free article] [PubMed] [Google Scholar]
- 73.Kirby BJ, Jodari M, Loftus MS, Gakhar G, Pratt ED, Chanel-Vos C, Gleghorn JP, Santana SM, Liu H, Smith JP, Navarro VN, Tagawa ST, Bander NH, Nanus DM, Giannakakou P. PloS one. 2012;7:e35976. doi: 10.1371/journal.pone.0035976. [DOI] [PMC free article] [PubMed] [Google Scholar]
- 74.Kamande JW, Hupert ML, Witek MA, Wang H, Torphy RJ, Dharmasiri U, Njoroge SK, Jackson JM, Aufforth RD, Snavely A, Yeh JJ, Soper SA. Anal Chem. 2013;85:9092–9100. doi: 10.1021/ac401720k. [DOI] [PMC free article] [PubMed] [Google Scholar]
- 75.Stott SL, Lee RJ, Nagrath S, Yu M, Miyamoto DT, Ulkus L, Inserra EJ, Ulman M, Springer S, Nakamura Z, Moore AL, Tsukrov DI, Kempner ME, Dahl DM, Wu CL, Iafrate AJ, Smith MR, Tompkins RG, Sequist LV, Toner M, Haber DA, Maheswaran S. Science Translational Medicine. 2010;2:25ra23. doi: 10.1126/scitranslmed.3000403. [DOI] [PMC free article] [PubMed] [Google Scholar]
- 76.Earhart CM, Hughes CE, Gaster RS, Ooi CC, Wilson RJ, Zhou LY, Humke EW, Xu LY, Wong DJ, Willingham SB, Schwartz EJ, Weissman IL, Jeffrey SS, Neal JW, Rohatgi R, Wakeleebe HA, Wang SX. Lab on a Chip. 2014;14:78–88. doi: 10.1039/c3lc50580d. [DOI] [PMC free article] [PubMed] [Google Scholar]
- 77.Fan T, Zhao Q, Chen JJ, Chen WT, Pearl ML. Gynecologic oncology. 2009;112:185–191. doi: 10.1016/j.ygyno.2008.09.021. [DOI] [PMC free article] [PubMed] [Google Scholar]
- 78.Flores LM, Kindelberger DW, Ligon AH, Capelletti M, Fiorentino M, Loda M, Cibas ES, Janne PA, Krop IE. Brit J Cancer. 2010;102:1495–1502. doi: 10.1038/sj.bjc.6605676. [DOI] [PMC free article] [PubMed] [Google Scholar]
- 79.Melnikova V, Zhang Y, Pace M, Garza M, Sukumaran S, Zhao S, Woo J, Davis D. Presented in part at EORTC/NCI/AACR Molecular Targets and Cancer Therapeutics. Berlin, Germany: 2010. [Google Scholar]
- 80.Xu T, Lu B, Tai YC, Goldkorn A. Cancer research. 2010;70:6420–6426. doi: 10.1158/0008-5472.CAN-10-0686. [DOI] [PMC free article] [PubMed] [Google Scholar]
- 81.Wu YQ, Deighan CJ, Miller BL, Balasubramanian P, Lustberg MB, Zborowski M, Chalmers JJ. Methods. 2013;64:169–182. doi: 10.1016/j.ymeth.2013.09.006. [DOI] [PMC free article] [PubMed] [Google Scholar]
- 82.Yang L, Lang JC, Balasubramanian P, Jatana KR, Schuller D, Agrawal A, Zborowski M, Chalmers JJ. Biotechnology and bioengineering. 2009;102:521–534. doi: 10.1002/bit.22066. [DOI] [PMC free article] [PubMed] [Google Scholar]
- 83.Ghazani AA, Castro CM, Gorbatov R, Lee H, Weissleder R. Neoplasia. 2012;14:388–395. doi: 10.1596/neo.12696. [DOI] [PMC free article] [PubMed] [Google Scholar]
- 84.Khoja L, Backen A, Sloane R, Menasce L, Ryder D, Krebs M, Board R, Clack G, Hughes A, Blackhall F, Valle JW, Dive C. Brit J Cancer. 2012;106:508–516. doi: 10.1038/bjc.2011.545. [DOI] [PMC free article] [PubMed] [Google Scholar]
- 85.Febbo PG, Ladanyi M, Aldape KD, De Marzo AM, Hammond ME, Hayes DF, Iafrate AJ, Kelley RK, Marcucci G, Ogino S, Pao W, Sgroi DC, Birkeland ML. J Natl Compr Cancer Network. 2011;9(Suppl 5):S1–32. doi: 10.6004/jnccn.2011.0137. [DOI] [PubMed] [Google Scholar]
- 86.Smerage JB, Barlow WE, Hortobagyi GN, Winer EP, Leyland-Jones B, Srkalovic G, Tejwani S, Schott AF, O’Rourke MA, Lew DL, Doyle GV, Gralow JR, Livingston RB, Hayes DF. Journal of clinical oncology: official journal of the American Society of Clinical Oncology. 2014;32:3483–3489. doi: 10.1200/JCO.2014.56.2561. [DOI] [PMC free article] [PubMed] [Google Scholar]
- 87.Sieuwerts AM, Kraan J, Bolt J, van der Spoel P, Elstrodt F, Schutte M, Martens JW, Gratama JW, Sleijfer S, Foekens JA. Journal of the National Cancer Institute. 2009;101:61–66. doi: 10.1093/jnci/djn419. [DOI] [PMC free article] [PubMed] [Google Scholar]
- 88.Hayes DF, Cristofanilli M. Journal of the National Cancer Institute. 2009;101:894–895. doi: 10.1093/jnci/djp115. [DOI] [PubMed] [Google Scholar]
- 89.Van Laere SJ, Elst H, Peeters D, Benoy I, Vermeulen PB, Dirix LY. Journal of the National Cancer Institute. 2009;101:895–896. doi: 10.1093/jnci/djp116. [DOI] [PubMed] [Google Scholar]
- 90.Connelly M, Wang YX, Doyle GV, Terstappen L, Mccormack R. Journal of the National Cancer Institute. 2009;101:895–895. doi: 10.1093/jnci/djp117. [DOI] [PubMed] [Google Scholar]
- 91.Sieuwerts AM, Kraan J, Bolt-De Vries J, Van der Spoel P, Elstrodt F, Smid M, Timmermans M, Mostert B, Schutte M, Martens JWM, Gratama JW, Sleijfer S, Foekens JA. Journal of the National Cancer Institute. 2009;101:896–897. doi: 10.1093/jnci/djn419. [DOI] [PMC free article] [PubMed] [Google Scholar]
- 92.Nielsen TO, Parker JS, Leung S, Voduc D, Ebbert M, Vickery T, Davies SR, Snider J, Stijleman IJ, Reed J, Cheang MC, Mardis ER, Perou CM, Bernard PS, Ellis MJ. Clin Cancer Res. 2010;16:5222–5232. doi: 10.1158/1078-0432.CCR-10-1282. [DOI] [PMC free article] [PubMed] [Google Scholar]
- 93.Prat A, Perou CM. Mol Oncol. 2011;5:5–23. doi: 10.1016/j.molonc.2010.11.003. [DOI] [PMC free article] [PubMed] [Google Scholar]
- 94.Sorlie T, Perou CM, Tibshirani R, Aas T, Geisler S, Johnsen H, Hastie T, Eisen MB, van de Rijn M, Jeffrey SS, Thorsen T, Quist H, Matese JC, Brown PO, Botstein D, Lonning PE, Borresen-Dale AL. Proceedings of the National Academy of Sciences of the United States of America. 2001;98:10869–10874. doi: 10.1073/pnas.191367098. [DOI] [PMC free article] [PubMed] [Google Scholar]
- 95.Rhim AD, Mirek ET, Aiello NM, Maitra A, Bailey JM, McAllister F, Reichert M, Beatty GL, Rustgi AK, Vonderheide RH, Leach SD, Stanger BZ. Cell. 2012;148:349–361. doi: 10.1016/j.cell.2011.11.025. [DOI] [PMC free article] [PubMed] [Google Scholar]
- 96.Smirnov DA, Zweitzig DR, Foulk BW, Miller MC, Doyle GV, Pienta KJ, Meropol NJ, Weiner LM, Cohen SJ, Moreno JG, Connelly MC, Terstappen LWMM, O’Hara SM. Cancer research. 2005;65:4993–4997. doi: 10.1158/0008-5472.CAN-04-4330. [DOI] [PubMed] [Google Scholar]
- 97.Lohr JG, Adalsteinsson VA, Cibulskis K, Choudhury AD, Rosenberg M, Cruz-Gordillo P, Francis JM, Zhang CZ, Shalek AK, Satija R, Trombetta JJ, Lu D, Tallapragada N, Tahirova N, Kim S, Blumenstiel B, Sougnez C, Lowe A, Wong B, Auclair D, Van Allen- EM, Nakabayashi M, Lis RT, Lee GSM, Li T, Chabot MS, Taplin ME, Taplin ME, Clancy TE, Loda M, Regev A, Meyerson M, Hahn WC, Kantoff PW, Golub TR, Getz G, Boehm JS, Love JC. Nat Biotechnol. 2014;32:479–484. doi: 10.1038/nbt.2892. [DOI] [PMC free article] [PubMed] [Google Scholar]
- 98.Powell AA, Talasaz AH, Zhang HY, Coram MA, Reddy A, Deng G, Telli ML, Advani RH, Carlson RW, Mollick JA, Sheth S, Kurian AW, Ford JM, Stockdale FE, Quake SR, Pease RF, Mindrinos MN, Bhanot G, Dairkee SH, Davis RW, Jeffrey SS. PloS one. 2012;7:e33788. doi: 10.1371/journal.pone.0033788. [DOI] [PMC free article] [PubMed] [Google Scholar]
- 99.Talasaz AH, Powell AA, Huber DE, Berbee JG, Roh KH, Yu W, Xiao WZ, Davis MM, Pease RF, Mindrinos MN, Jeffrey SS, Davis RW. Proceedings of the National Academy of Sciences of the United States of America. 2009;106:3970–3975. doi: 10.1073/pnas.0813188106. [DOI] [PMC free article] [PubMed] [Google Scholar]
- 100.Deng G, Herrler M, Burgess D, Manna E, Krag D, Burke JF. Breast Cancer Res. 2008;10:R69. doi: 10.1186/bcr2131. [DOI] [PMC free article] [PubMed] [Google Scholar]
- 101.Gutman S, Scott P. Department of Health and Human Services - Food and Drug Administration, 2003, 510(k) K030596 Substantial Equivalence Determination Decision Summary [Google Scholar]
- 102.Qin JB, Alt JR, Hunsley BA, Williams TL, Fernando MR. Cancer Cell Int. 2014;14:23. doi: 10.1186/1475-2867-14-23. [DOI] [PMC free article] [PubMed] [Google Scholar]
- 103.Hoshino K, Huang YY, Lane N, Huebschman M, Uhr JW, Frenkel EP, Zhang X. Lab on a Chip. 2011;11:3449–3457. doi: 10.1039/c1lc20270g. [DOI] [PMC free article] [PubMed] [Google Scholar]
- 104.Xu H, Aguilar ZP, Yang L, Kuang M, Duan H, Xiong Y, Wei H, Wang A. Biomaterials. 2011;32:9758–9765. doi: 10.1016/j.biomaterials.2011.08.076. [DOI] [PMC free article] [PubMed] [Google Scholar]
- 105.Santhosh PB, Ulrih NP. Cancer letters. 2013;336:8–17. doi: 10.1016/j.canlet.2013.04.032. [DOI] [PubMed] [Google Scholar]
- 106.Mi Y, Li K, Liu Y, Pu KY, Liu B, Feng SS. Biomaterials. 2011;32:8226–8233. doi: 10.1016/j.biomaterials.2011.07.040. [DOI] [PubMed] [Google Scholar]
- 107.Ozkumur E, Shah AM, Ciciliano JC, Emmink BL, Miyamoto DT, Brachtel E, Yu M, Chen PI, Morgan B, Trautwein J, Kimura A, Sengupta S, Stott SL, Karabacak NM, Barber TA, Walsh JR, Smith K, Spuhler PS, Sullivan JP, Lee RJ, Ting DT, Luo X, Shaw AT, Bardia A, Sequist LV, Louis DN, Maheswaran S, Kapur R, Haber DA, Toner M. Science Translational Medicine. 2013;5:179ra147. doi: 10.1126/scitranslmed.3005616. [DOI] [PMC free article] [PubMed] [Google Scholar]
- 108.Karabacak NM, Spuhler PS, Fachin F, Lim EJ, Pai V, Ozkumur E, Martel JM, Kojic N, Smith K, Chen PI, Yang J, Hwang H, Morgan B, Trautwein J, Barber TA, Stott SL, Maheswaran S, Kapur R, Haber DA, Toner M. Nat Protoc. 2014;9:694–710. doi: 10.1038/nprot.2014.044. [DOI] [PMC free article] [PubMed] [Google Scholar]
- 109.Huang LR, Cox EC, Austin RH, Sturm JC. Science. 2004;304:987–990. doi: 10.1126/science.1094567. [DOI] [PubMed] [Google Scholar]
- 110.Di Carlo D, Irimia D, Tompkins RG, Toner M. Proceedings of the National Academy of Sciences of the United States of America. 2007;104:18892–18897. doi: 10.1073/pnas.0704958104. [DOI] [PMC free article] [PubMed] [Google Scholar]
- 111.Yu M, Bardia A, Aceto N, Bersani F, Madden MW, Donaldson MC, Desai R, Zhu H, Comaills V, Zheng Z, Wittner BS, Stojanov P, Brachtel E, Sgroi D, Kapur R, Shioda T, Ting DT, Ramaswamy S, Getz G, Iafrate AJ, Benes C, Toner M, Maheswaran S, Haber DA. Science. 2014;345:216–220. doi: 10.1126/science.1253533. [DOI] [PMC free article] [PubMed] [Google Scholar]
- 112.Svobodova Z, Kucerova J, Autebert J, Horak D, Bruckova L, Viovy JL, Bilkova Z. Electrophoresis. 2014;35:323–329. doi: 10.1002/elps.201300196. [DOI] [PubMed] [Google Scholar]
- 113.Saias L, Autebert J, Malaquin L, Viovy JL. Lab on a Chip. 2011;11:822–832. doi: 10.1039/c0lc00304b. [DOI] [PubMed] [Google Scholar]
- 114.Mohamadi RM, Besant JD, Mepham A, Green B, Mahmoudian L, Gibbs T, Ivanov I, Malvea A, Stojcic J, Allan AL, Lowes LE, Sargent EH, Nam RK, Kelley SO. Angew Chem Int Ed Engl. 2015;54:139–143. doi: 10.1002/anie.201409376. [DOI] [PubMed] [Google Scholar]
- 115.Muhanna N, Mephame A, Mohamadi RM, Chan H, Khan T, Akens M, Besant JD, Irish J, Kelley SO. Nanomed-Nanotechnol. 2015;11:1613–1620. doi: 10.1016/j.nano.2015.04.017. [DOI] [PubMed] [Google Scholar]
- 116.Besant JD, Mohamadi RM, Aldridge PM, Li Y, Sargent EH, Kelley SO. Nanoscale. 2015;7:6278–6285. doi: 10.1039/c5nr00797f. [DOI] [PubMed] [Google Scholar]
- 117.Labib M, Green B, Mohamadi RM, Mepham A, Ahmed SU, Mahmoudian L, Chang IH, Sargent EH, Kelley SO. J Am Chem Soc. 2016;138:2476–2479. doi: 10.1021/jacs.5b10939. [DOI] [PubMed] [Google Scholar]
- 118.Poudineh M, Aldridge P, Ahmed S, Green BJ, Kermanshah L, Nguyen V, Tu C, Mohamadi RM, Nam RK, Hansen A, Sridhar SS, Finelli A, Fleshner NE, Joshua AM, Sargent EH, Kelley SO. Nat Nanotechnol. 2017;12:274–+. doi: 10.1038/nnano.2016.239. [DOI] [PubMed] [Google Scholar]
- 119.Poudineh M, Labib M, Ahmed S, Nguyen LNM, Kermanshah L, Mohamadi RM, Sargent EH, Kelley SO. Angew Chem Int Edit. 2017;56:163–168. doi: 10.1002/anie.201608983. [DOI] [PubMed] [Google Scholar]
- 120.Chen P, Huang YY, Hoshino K, Zhang JXJ. Sci Rep. 2015:5. doi: 10.1038/srep08745. [DOI] [PMC free article] [PubMed] [Google Scholar]
- 121.Issadore D, Chung J, Shao HL, Liong M, Ghazani AA, Castro CM, Weissleder R, Lee H. Science Translational Medicine. 2012;4:141ra192. doi: 10.1126/scitranslmed.3003747. [DOI] [PMC free article] [PubMed] [Google Scholar]
- 122.Chang KC, Hammer DA. Biophys J. 1999;76:1280–1292. doi: 10.1016/S0006-3495(99)77291-7. [DOI] [PMC free article] [PubMed] [Google Scholar]
- 123.Jackson JM, Witek MA, Soper SA. In: Circulating Tumor Cells: Isolation and Analysis. Fan H, editor. John Wiley & Sons; 2016. pp. 85–119. [Google Scholar]
- 124.Bell GI. Science. 1978;200:618–627. doi: 10.1126/science.347575. [DOI] [PubMed] [Google Scholar]
- 125.Adams AA, Okagbare PI, Feng J, Hupert ML, Patterson D, Goettert J, McCarley RL, Nikitopoulos D, Murphy MC, Soper SA. J Am Chem Soc. 2008;130:8633–8641. doi: 10.1021/ja8015022. [DOI] [PMC free article] [PubMed] [Google Scholar]
- 126.Dharmasiri U, Adams AA, Witek M, Soper SA. Annu Rev Anal Chem. 2010;3:409–431. doi: 10.1146/annurev.anchem.111808.073610. [DOI] [PubMed] [Google Scholar]
- 127.Peng KQ, Yan YJ, Gao SP, Zhu J. Advanced materials. 2002;14:1164–1167. [Google Scholar]
- 128.Wang ST, Liu K, Liu JA, Yu ZTF, Xu XW, Zhao LB, Lee T, Lee EK, Reiss J, Lee YK, Chung LWK, Huang JT, Rettig M, Seligson D, Duraiswamy KN, Shen CKF, Tseng HR. Angewandte Chemie, International Edition. 2011;50:3084–3088. doi: 10.1002/anie.201005853. [DOI] [PMC free article] [PubMed] [Google Scholar]
- 129.Butler JE, Ni L, Brown WR, Joshi KS, Chang J, Rosenberg B, Voss EW., Jr Molecular Immunology. 1993;30:1165–1175. doi: 10.1016/0161-5890(93)90135-x. [DOI] [PubMed] [Google Scholar]
- 130.Hermanson GT. Bioconjugate techniques, Academic Press, San Diego. 1996 [Google Scholar]
- 131.Hupert ML, Jackson JM, Wang H, Witek MA, Kamande J, Milowsky MI, Whang YE, Soper SA. Microsystem Technologies. 2014;20:1815–1825. doi: 10.1007/s00542-013-1941-6. [DOI] [PMC free article] [PubMed] [Google Scholar]
- 132.Soper SA, Brown K, Ellington A, Frazier B, Garcia-Manero G, Gau V, Gutman SI, Hayes DF, Korte B, Landers JL, Larson D, Ligler F, Majumdar A, Mascini M, Nolte D, Rosenzweig Z, Wang J, Wilson D. Biosens Bioelectron. 2006;21:1932–1942. doi: 10.1016/j.bios.2006.01.006. [DOI] [PubMed] [Google Scholar]
- 133.Soper SA, Hashimoto M, Situma C, Murphy MC, McCarley RL, Cheng YW, Barany F. Methods. 2005;37:103–113. doi: 10.1016/j.ymeth.2005.07.004. [DOI] [PubMed] [Google Scholar]
- 134.Dharmasiri U, Balamurugan S, Adams AA, Okagbare PI, Obubuafo A, Soper SA. Electrophoresis. 2009;30:3289–3300. doi: 10.1002/elps.200900141. [DOI] [PMC free article] [PubMed] [Google Scholar]
- 135.O’Neil CE, Jackson JM, Shim SH, Soper SA. Anal Chem. 2016;88:3686–3696. doi: 10.1021/acs.analchem.5b04472. [DOI] [PMC free article] [PubMed] [Google Scholar]
- 136.Uba FI, Pullagurla SR, Sirasunthorn N, Wu J, Park S, Chantiwas R, Cho YK, Shin H, Soper SA. Analyst. 2015;140:113–126. doi: 10.1039/c4an01439a. [DOI] [PMC free article] [PubMed] [Google Scholar]
- 137.Galletti G, Sung MS, Vahdat LT, Shah MA, Santana SM, Altavilla G, Kirby BJ, Giannakakou P. Lab on a Chip. 2014;14:147–156. doi: 10.1039/c3lc51039e. [DOI] [PMC free article] [PubMed] [Google Scholar]
- 138.Rhim AD, Thege FI, Santana SM, Lannin TB, Saha TN, Tsai S, Maggs LR, Kochman ML, Ginsberg GG, Lieb JG, Chandrasekhara V, Drebin JA, Ahmad N, Yang YX, Kirby BJ, Stanger BZ. Gastroenterology. 2014;146:647–651. doi: 10.1053/j.gastro.2013.12.007. [DOI] [PMC free article] [PubMed] [Google Scholar]
- 139.Krawczyk N, Meier-Stiegen F, Banys M, Neubauer H, Ruckhaeberle E, Fehm T. Bio Med Res Int. 2014;2014:R15. doi: 10.1155/2014/415721. [DOI] [PMC free article] [PubMed] [Google Scholar]
- 140.Stroock AD, Dertinger SKW, Ajdari A, Mezic I, Stone HA, Whitesides GM. Science. 2002;295:647–651. doi: 10.1126/science.1066238. [DOI] [PubMed] [Google Scholar]
- 141.Yu M, Ting DT, Stott SL, Wittner BS, Ozsolak F, Paul S, Ciciliano JC, Smas ME, Winokur D, Gilman AJ, Ulman MJ, Xega K, Contino G, Alagesan B, Brannigan BW, Milos PM, Ryan DP, Sequist LV, Bardeesy N, Ramaswamy S, Toner M, Maheswaran S, Haber DA. Nature. 2012;487:510–513. doi: 10.1038/nature11217. [DOI] [PMC free article] [PubMed] [Google Scholar]
- 142.Luo X, Mitra D, Sullivan RJ, Wittner BS, Kimura AM, Pan SW, Hoang MP, Brannigan BW, Lawrence DP, Flaherty KT, Sequist LV, McMahon M, Bosenberg MW, Stott SL, Ting DT, Ramaswamy S, Toner M, Fisher DE, Maheswaran S, Haber DA. Cell Rep. 2014;7:645–653. doi: 10.1016/j.celrep.2014.03.039. [DOI] [PMC free article] [PubMed] [Google Scholar]
- 143.Sheng W, Ogunwobi OO, Chen T, Zhang J, George TJ, Liu C, Fan ZH. Lab on a Chip. 2014;14:89–98. doi: 10.1039/c3lc51017d. [DOI] [PMC free article] [PubMed] [Google Scholar]
- 144.Wang S, Thomas A, Lee E, Yang S, Cheng X, Liu Y. Analyst. 2016;141:2228–2237. doi: 10.1039/c6an00236f. [DOI] [PMC free article] [PubMed] [Google Scholar]
- 145.Miyamoto DT, Zheng Y, Wittner BS, Lee RJ, Zhu H, Broderick KT, Desai R, Fox DB, Brannigan BW, Trautwein J, Arora KS, Desai N, Dahl DM, Sequist LV, Smith MR, Kapur R, Wu CL, Shioda T, Ramaswamy S, Ting DT, Toner M, Maheswaran S, Haber DA. Science. 2015;349:1351–1356. doi: 10.1126/science.aab0917. [DOI] [PMC free article] [PubMed] [Google Scholar]
- 146.Wang S, Wang H, Jiao J, Chen KJ, Owens GE, Kamei K, Sun J, Sherman DJ, Behrenbruch CP, Wu H, Tseng HR. Angewandte Chemie, International Edition. 2009;48:8970–8973. doi: 10.1002/anie.200901668. [DOI] [PMC free article] [PubMed] [Google Scholar]
- 147.Ke Z, Lin M, Chen JF, Choi JS, Zhang Y, Fong A, Liang AJ, Chen SF, Li Q, Fang W, Zhang P, Garcia MA, Lee T, Song M, Lin HA, Zhao H, Luo SC, Hou S, Yu HH, Tseng HR. ACS nano. 2015;9:62–70. doi: 10.1021/nn5056282. [DOI] [PMC free article] [PubMed] [Google Scholar]
- 148.Ankeny JS, Court CM, Hou S, Li Q, Song M, Wu D, Chen JF, Lee T, Lin M, Sho S, Rochefort MM, Girgis MD, Yao J, Wainberg ZA, Muthusamy VR, Watson RR, Donahue TR, Hines OJ, Reber HA, Graeber TG, Tseng HR, Tomlinson JS. Brit J Cancer. 2016;114:1367–1375. doi: 10.1038/bjc.2016.121. [DOI] [PMC free article] [PubMed] [Google Scholar]
- 149.Zhang NA, Deng YL, Tai QD, Cheng BR, Zhao LB, Shen QL, He RX, Hong LY, Liu W, Guo SS, Liu K, Tseng HR, Xiong B, Zhao XZ. Advanced materials. 2012;24:2756–2760. doi: 10.1002/adma.201200155. [DOI] [PubMed] [Google Scholar]
- 150.Hou S, Zhao LB, Shen QL, Yu JH, Ng C, Kong XJ, Wu DX, Song M, Shi XH, Xu XC, OuYang WH, He RX, Zhao XZ, Lee T, Brunicardi FC, Garcia MA, Ribas A, Lo RS, Tseng HR. Angewandte Chemie, International Edition. 2013;52:3379–3383. doi: 10.1002/anie.201208452. [DOI] [PMC free article] [PubMed] [Google Scholar]
- 151.Yu X, He R, Li S, Cai B, Zhao L, Liao L, Liu W, Zeng Q, Wang H, Guo SS, Zhao XZ. Small. 2013;9:3895–3901. doi: 10.1002/smll.201300169. [DOI] [PubMed] [Google Scholar]
- 152.Hughes AD, King MR. Langmuir. 2010;26:12155–12164. doi: 10.1021/la101179y. [DOI] [PubMed] [Google Scholar]
- 153.Hughes AD, Mattison J, Western LT, Powderly JD, Greene BT, King MR. Clinical chemistry. 2012;58:846–853. doi: 10.1373/clinchem.2011.176669. [DOI] [PubMed] [Google Scholar]
- 154.Hughes AD, Marshall JR, Keller E, Powderly JD, Greene BT, King MR. Cancer letters. 2014;352:28–35. doi: 10.1016/j.canlet.2013.08.026. [DOI] [PMC free article] [PubMed] [Google Scholar]
- 155.Mitchell MJ, Castellanos CA, King MR. J Biomed Mater Res Part A. 2015;103:3407–3418. doi: 10.1002/jbm.a.35445. [DOI] [PMC free article] [PubMed] [Google Scholar]
- 156.Mitchell MJ, Castellanos CA, King MR. J Nanomater. 2012;2012:831263. doi: 10.1155/2012/831263. [DOI] [PMC free article] [PubMed] [Google Scholar]
- 157.Dharmasiri U, Njoroge SK, Witek M, Adebiyi MG, Kamande JW, Hupert ML, Barany F, Soper SA. Anal Chem. 2011;83:2301–2309. doi: 10.1021/ac103172y. [DOI] [PMC free article] [PubMed] [Google Scholar]
- 158.Papaioannou TG, Stefanadis C. Hellenic J Cardiol. 2005;46:9–15. [PubMed] [Google Scholar]
- 159.Torphy RJ, Tignanelli CJ, Kamande JW, Moffitt RA, Herrera Loeza SG, Soper SA, Yeh JJ. PloS one. 2014;9:e89474. doi: 10.1371/journal.pone.0089474. [DOI] [PMC free article] [PubMed] [Google Scholar]
- 160.Liu F, Qi L, Liu B, Liu J, Zhang H, Che D, Cao J, Shen J, Geng J, Bi Y, Ye L, Pan B, Yu Y. PloS one. 2015;10:e0116683. doi: 10.1371/journal.pone.0116683. [DOI] [PMC free article] [PubMed] [Google Scholar]
- 161.O’Brien P, O’Connor BF. Biochimica et biophysica acta. 2008;1784:1130–1145. doi: 10.1016/j.bbapap.2008.01.006. [DOI] [PubMed] [Google Scholar]
- 162.Jackson JM, Hupert ML, Soper SA. Journal of Power Sources. 2014;269:274–283. [Google Scholar]
- 163.Shen QL, Xu L, Zhao LB, Wu DX, Fan YS, Zhou YL, OuYang WH, Xu XC, Zhang Z, Song M, Lee T, Garcia MA, Xiong B, Hou S, Tseng HR, Fang XH. Advanced materials. 2013;25:2368–2373. doi: 10.1002/adma.201300082. [DOI] [PMC free article] [PubMed] [Google Scholar]
- 164.Deng YL, Zhang Y, Sun S, Wang ZH, Wang MJ, Yu BQ, Czajkowsky DM, Liu BY, Li Y, Wei W, Shi QH. Sci Rep. 2014;4:7499. doi: 10.1038/srep07499. [DOI] [PMC free article] [PubMed] [Google Scholar]
- 165.Vona G, Sabile A, Louha M, Sitruk V, Romana S, Schutze K, Capron F, Franco D, Pazzagli M, Vekemans M, Lacour B, Brechot C, Paterlini-Brechot P. Am J Pathol. 2000;156:57–63. doi: 10.1016/S0002-9440(10)64706-2. [DOI] [PMC free article] [PubMed] [Google Scholar]
- 166.Pinzani P, Salvadori B, Simi L, Bianchi S, Distante V, Cataliotti L, Pazzagli M, Orlando C. Human pathology. 2006;37:711–718. doi: 10.1016/j.humpath.2006.01.026. [DOI] [PubMed] [Google Scholar]
- 167.Hou S, Zhao H, Zhao L, Shen Q, Wei KS, Suh DY, Nakao A, Garcia MA, Song M, Lee T, Xiong B, Luo S-C, Tseng H-R, Yu H-h. Advanced materials. 2013;25:1547–1551. doi: 10.1002/adma.201203185. [DOI] [PMC free article] [PubMed] [Google Scholar]
- 168.Dickey DD, Giangrande PH. Methods. 2016;97:94–103. doi: 10.1016/j.ymeth.2015.11.020. [DOI] [PMC free article] [PubMed] [Google Scholar]
- 169.Zhao Y, Xu D, Tan W. Integr Biol (Camb) 2017;9:188–205. doi: 10.1039/c6ib00239k. [DOI] [PubMed] [Google Scholar]
- 170.Bruno JG. Molecules. 2015;20:6866–6887. doi: 10.3390/molecules20046866. [DOI] [PMC free article] [PubMed] [Google Scholar]
- 171.Sharma TK, Bruno JG, Dhiman A. Biotechnol Adv. 2017;35:275–301. doi: 10.1016/j.biotechadv.2017.01.003. [DOI] [PubMed] [Google Scholar]
- 172.Zhu Q, Liu G, Kai M. Molecules. 2015;20:20979–20997. doi: 10.3390/molecules201219739. [DOI] [PMC free article] [PubMed] [Google Scholar]
- 173.Chudziak J, Burt DJ, Mohan S, Rothwell DG, Mesquita B, Antonello J, Dalby S, Ayub M, Priest L, Carter L, Krebs MG, Blackhall F, Dive C, Brady G. Analyst. 2016;141:669–678. doi: 10.1039/c5an02156a. [DOI] [PubMed] [Google Scholar]
- 174.Li W, Reategui E, Park MH, Castleberry S, Deng JZ, Hsu B, Mayner S, Jensen AE, Sequist LV, Maheswaran S, Haber DA, Toner M, Stott SL, Hammond PT. Biomaterials. 2015;65:93–102. doi: 10.1016/j.biomaterials.2015.06.036. [DOI] [PMC free article] [PubMed] [Google Scholar]
- 175.Sage E, Girard PM, Francesconi S. Photoch Photobio Sci. 2012;11:74–80. doi: 10.1039/c1pp05219e. [DOI] [PubMed] [Google Scholar]
- 176.Hatch A, Hansmann G, Murthy SK. Langmuir. 2011;27:4257–4264. doi: 10.1021/la105016a. [DOI] [PMC free article] [PubMed] [Google Scholar]
- 177.Plouffe BD, Brown MA, Iyer RK, Radisic M, Murthy SK. Lab on a Chip. 2009;9:1507–1510. doi: 10.1039/b823523f. [DOI] [PubMed] [Google Scholar]
- 178.Shah AM, Yu M, Nakamura Z, Ciciliano J, Ulman M, Kotz K, Stott SL, Maheswaran S, Haber DA, Toner M. Anal Chem. 2012;84:3682–3688. doi: 10.1021/ac300190j. [DOI] [PMC free article] [PubMed] [Google Scholar]
- 179.Fleischer RL, Price PB, Symes EM. Science. 1964;143:249–250. doi: 10.1126/science.143.3603.249. [DOI] [PubMed] [Google Scholar]
- 180.Seal SH. Cancer-Am Cancer Soc. 1964;17:637–642. doi: 10.1002/1097-0142(196405)17:5<637::aid-cncr2820170512>3.0.co;2-i. [DOI] [PubMed] [Google Scholar]
- 181.Krebs MG, Hou JM, Sloane R, Lancashire L, Priest L, Nonaka D, Ward TH, Backen A, Clack G, Hughes A, Ranson M, Blackhall FH, Dive C. J Thorac Oncol. 2012;7:306–315. doi: 10.1097/JTO.0b013e31823c5c16. [DOI] [PubMed] [Google Scholar]
- 182.Vona G, Beroud C, Benachi A, Quenette A, Bonnefont JP, Romana S, Munnich A, Vekemans M, Dumez Y, Lacour B, Paterlini-Brechot P. Am J Pathol. 2002;160:51–58. doi: 10.1016/S0002-9440(10)64348-9. [DOI] [PMC free article] [PubMed] [Google Scholar]
- 183.Vona G, Estepa L, Beroud C, Damotte D, Capron F, Nalpas B, Mineur A, Franco D, Lacour B, Pol S, Brechot C, Paterlini-Brechot P. Hepatology. 2004;39:792–797. doi: 10.1002/hep.20091. [DOI] [PubMed] [Google Scholar]
- 184.Kahn HJ, Presta A, Yang LY, Blondal J, Trudeau M, Lickley L, Holloway C, McCready DR, Maclean D, Marks A. Breast Cancer Res Tr. 2004;86:237–247. doi: 10.1023/B:BREA.0000036897.92513.72. [DOI] [PubMed] [Google Scholar]
- 185.Zabaglo L, Ormerod MG, Parton M, Ring A, Smith IE, Dowsett M. Cytometry Part A: the journal of the International Society for Analytical Cytology. 2003;55:102–108. doi: 10.1002/cyto.a.10071. [DOI] [PubMed] [Google Scholar]
- 186.Rostagno P, Moll JL, Bisconte JC, Caldani C. Anticancer research. 1997;17:2481–2485. [PubMed] [Google Scholar]
- 187.Farace F, Massard C, Vimond N, Drusch F, Jacques N, Billiot F, Laplanche A, Chauchereau A, Lacroix L, Planchard D, Le Moulec S, Andre F, Fizazi K, Soria JC, Vielh P. Brit J Cancer. 2011;105:847–853. doi: 10.1038/bjc.2011.294. [DOI] [PMC free article] [PubMed] [Google Scholar]
- 188.Hofman V, Ilie MI, Long E, Selva E, Bonnetaud C, Molina T, Venissac N, Mouroux J, Vielh P, Hofman P. International Journal of Cancer. 2011;129:1651–1660. doi: 10.1002/ijc.25819. [DOI] [PubMed] [Google Scholar]
- 189.Desitter I, Guerrouahen BS, Benali-Furet N, Wechsler J, Janne PA, Kuang Y, Yanagita M, Wang L, Berkowitz JA, Distel RJ, Cayre YE. Anticancer research. 2011;31:427–441. [PubMed] [Google Scholar]
- 190.Zheng SY, Lin HK, Lu B, Williams A, Datar R, Cote RJ, Tai YC. Biomed Microdevices. 2011;13:203–213. doi: 10.1007/s10544-010-9485-3. [DOI] [PMC free article] [PubMed] [Google Scholar]
- 191.Lara O, Tong XD, Zborowski M, Chalmers JJ. Exp Hematol. 2004;32:891–904. doi: 10.1016/j.exphem.2004.07.007. [DOI] [PubMed] [Google Scholar]
- 192.Zhou MD, Hao SJ, Williams AJ, Harouaka RA, Schrand B, Rawal S, Ao Z, Brennaman R, Gilboa E, Lu B, Wang SW, Zhu JY, Datar R, Cote R, Tai YC, Zheng SY. Sci Rep. 2014;4:7392. doi: 10.1038/srep07392. [DOI] [PMC free article] [PubMed] [Google Scholar]
- 193.Lim LS, Hu M, Huang MC, Cheong WC, Gan AT, Looi XL, Leong SM, Koay ES, Li MH. Lab on a Chip. 2012;12:4388–4396. doi: 10.1039/c2lc20750h. [DOI] [PubMed] [Google Scholar]
- 194.Kim MS, Sim TS, Kim YJ, Kim SS, Jeong H, Park JM, Moon HS, Kim SI, Gurel O, Lee SS, Lee JG, Park JC. Lab on a Chip. 2012;12:2874–2880. doi: 10.1039/c2lc40065k. [DOI] [PubMed] [Google Scholar]
- 195.Zheng S, Lin H, Liu JQ, Balic M, Datar R, Cote RJ, Tai YC. J Chromatogr A. 2007;1162:154–161. doi: 10.1016/j.chroma.2007.05.064. [DOI] [PubMed] [Google Scholar]
- 196.Lin HK, Zheng S, Williams AJ, Balic M, Groshen S, Scher HI, Fleisher M, Stadler W, Datar RH, Tai YC, Cote RJ. Clinical cancer research: an official journal of the American Association for Cancer Research. 2010;16:5011–5018. doi: 10.1158/1078-0432.CCR-10-1105. [DOI] [PMC free article] [PubMed] [Google Scholar]
- 197.Tang Y, Shi J, Li S, Wang L, Cayre YE, Chen Y. Sci Rep. 2014;4:6052. doi: 10.1038/srep06052. [DOI] [PMC free article] [PubMed] [Google Scholar]
- 198.Tan SJ, Lakshmi RL, Chen PF, Lim WT, Yobas L, Lim CT. Biosens Bioelectron. 2010;26:1701–1705. doi: 10.1016/j.bios.2010.07.054. [DOI] [PubMed] [Google Scholar]
- 199.Yusa A, Toneri M, Masuda T, Ito S, Yamamoto S, Okochi M, Kondo N, Iwata H, Yatabe Y, Ichinosawa Y, Kinuta S, Kondo E, Honda H, Arai F, Nakanishi H. PloS one. 2014;9:e88821. doi: 10.1371/journal.pone.0088821. [DOI] [PMC free article] [PubMed] [Google Scholar]
- 200.Goldkorn A, Ely B, Tangen CM, Tai YC, Xu T, Li HL, Twardowski P, Van Veldhuizen PJ, Agarwal N, Carducci MA, Monk JP, Garzotto M, Mack PC, Lara P, Higano CS, Hussain M, Vogelzang NJ, Thompson IM, Cote RJ, Quinn DI. International Journal of Cancer. 2015;136:1856–1862. doi: 10.1002/ijc.29212. [DOI] [PMC free article] [PubMed] [Google Scholar]
- 201.Ao Z, Parasido E, Rawal S, Williams A, Schlegel R, Liu S, Albanese C, Cote RJ, Agarwal A, Datar RH. Lab on a Chip. 2015;15:4277–4282. doi: 10.1039/c5lc01024a. [DOI] [PMC free article] [PubMed] [Google Scholar]
- 202.Tan SJ, Yobas L, Lee GYH, Ong CN, Lim CT. Biomed Microdevices. 2009;11:883–892. doi: 10.1007/s10544-009-9305-9. [DOI] [PubMed] [Google Scholar]
- 203.Au SH, Storey BD, Moore JC, Tang Q, Chen YL, Javaid S, Sarioglu AF, Sullivan R, Madden MW, O’Keefe R, Haber DA, Maheswaran S, Langenau DM, Stott SL, Toner M. Proceedings of the National Academy of Sciences of the United States of America. 2016;113:4947–4952. doi: 10.1073/pnas.1524448113. [DOI] [PMC free article] [PubMed] [Google Scholar]
- 204.Che J, Yu V, Dhar M, Renier C, Matsumoto M, Heirich K, Garon EB, Goldman J, Rao J, Sledge GW, Pegram MD, Sheth S, Jeffrey SS, Kulkarni RP, Sollier E, Di Carlo D. Oncotarget. 2016;7:12748–12760. doi: 10.18632/oncotarget.7220. [DOI] [PMC free article] [PubMed] [Google Scholar]
- 205.Hur SC, Mach AJ, Di Carlo D. Biomicrofluidics. 2011;5:022206. doi: 10.1063/1.3576780. [DOI] [PMC free article] [PubMed] [Google Scholar]
- 206.Hou HW, Warkiani ME, Khoo BL, Li ZR, Soo RA, Tan DS, Lim WT, Han J, Bhagat AA, Lim CT. Sci Rep. 2013;3:1259. doi: 10.1038/srep01259. [DOI] [PMC free article] [PubMed] [Google Scholar]
- 207.Warkiani ME, Khoo BL, Wu LD, Tay AKP, Bhagat AAS, Han J, Lim CT. Nat Protoc. 2016;11:134–148. doi: 10.1038/nprot.2016.003. [DOI] [PubMed] [Google Scholar]
- 208.Gascoyne PR, Shim S. Cancers. 2014;6:545–579. doi: 10.3390/cancers6010545. [DOI] [PMC free article] [PubMed] [Google Scholar]
- 209.Le Du F, Duose DY, Dettman EJ, Summer JA, Chavez-MacGregor M, Barcenas CH, Brewster AM, Ricardo AH, Valero V, Gonzalez-Angulo AM, Reuben JM, Ueno NT. Cancer research. 2015;75 P4-01-10. [Google Scholar]
- 210.Hoch U, Fry DG, Chia YL, Caygill K, Hannah AL, Perez EA, Cortez J, Awada A, O’Shaughnessy J, Twelves C, Rugo HS, Im S-A, Xu B, Anderes K, Davis DW. Presented in part at American Society of Clinical Oncology Annual Meeting. Chicago, IL; 2013. [Google Scholar]
- 211.Varadhachary G, Abbruzzese J, Shroff R, Melnikova V, Gupta V, Neal C, Garza M, Hasegawa DK, Anderes KL, Davis D, Wolff RA. Cancer research. 2013;73:1449. [Google Scholar]
- 212.Gorin M, Ball M, Davis D, Pierorazio P, Hammers H, Pienta K, Allaf M. Presented in part at American Urology Association Annual Meeting. New Orleans, LA: 2015. [Google Scholar]
- 213.Tran HT, Melnikova V, Tsao AS, Fossella FV, Johnson FM, Papadimitrakoupoulou V, Richardson K, Lewis ME, Legendre B, Anderes KL, Davis DW, Heymach JV. Molecular Cancer Therapeutics. 2013;12:C29. [Google Scholar]
- 214.O’Shannessy DJ, Davis DW, Anderes K, Somers EB. Biomark Insights. 2016;11:7–18. doi: 10.4137/BMI.S35075. [DOI] [PMC free article] [PubMed] [Google Scholar]
- 215.Pantel K, Speicher MR. Oncogene. 2015:1216–1224. doi: 10.1038/onc.2015.192. [DOI] [PubMed] [Google Scholar]
- 216.Punnoose EA, Atwal SK, Spoerke JM, Savage H, Pandita A, Yeh RF, Pirzkall A, Fine BM, Amler LC, Chen DS, Lackner MR. PloS one. 2010;5:e12517. doi: 10.1371/journal.pone.0012517. [DOI] [PMC free article] [PubMed] [Google Scholar]
- 217.Heitzer E, Auer M, Gasch C, Pichler M, Ulz P, Hoffmann EM, Lax S, Waldispuehl-Geigl J, Mauermann O, Lackner C, Hofler G, Eisner F, Sill H, Samonigg H, Pantel K, Riethdorf S, Bauernhofer T, Geigl JB, Speicher MR. Cancer research. 2013;73:2965–2975. doi: 10.1158/0008-5472.CAN-12-4140. [DOI] [PubMed] [Google Scholar]
- 218.Paris PL, Kobayashi Y, Zhao Q, Zeng W, Sridharan S, Fan T, Adler HL, Yera ER, Zarrabi MH, Zucker S, Simko J, Chen WT, Rosenberg J. Cancer letters. 2009;277:164–173. doi: 10.1016/j.canlet.2008.12.007. [DOI] [PubMed] [Google Scholar]
- 219.Mathiesen RR, Fjelldal R, Liestol K, Due EU, Geigl JB, Riethdorf S, Borgen E, Rye IH, Schneider IJ, Obenauf AC, Mauermann O, Nilsen G, Christian Lingjaerde O, Borresen-Dale AL, Pantel K, Speicher MR, Naume B, Baumbusch LO. International Journal of Cancer. 2012;131:E405–E415. doi: 10.1002/ijc.26444. [DOI] [PubMed] [Google Scholar]
- 220.Milbury CA, Li J, Makrigiorgos GM. Nucleic Acids Res. 2011;39:e2. doi: 10.1093/nar/gkq899. [DOI] [PMC free article] [PubMed] [Google Scholar]
- 221.Khanna M, Park P, Zirvi M, Cao WG, Picon A, Day J, Paty P, Barany F. Oncogene. 1999;18:27–38. doi: 10.1038/sj.onc.1202291. [DOI] [PubMed] [Google Scholar]
- 222.Ni X, Zhuo M, Su Z, Duan J, Gao Y, Wang Z, Zong C, Bai H, Chapman AR, Zhao J, Xu L, An T, Ma Q, Wang Y, Wu M, Sun Y, Wang S, Li Z, Yang X, Yong J, Su XD, Lu Y, Bai F, Xie XS, Wang J. Proceedings of the National Academy of Sciences of the United States of America. 2013;110:21083–21088. doi: 10.1073/pnas.1320659110. [DOI] [PMC free article] [PubMed] [Google Scholar]
- 223.Navin NE. Genome biology. 2014;15:452. doi: 10.1186/s13059-014-0452-9. [DOI] [PMC free article] [PubMed] [Google Scholar]
- 224.Van Loo P, Voet T. Current opinion in genetics & development. 2014;24:82–91. doi: 10.1016/j.gde.2013.12.004. [DOI] [PubMed] [Google Scholar]
- 225.Sandberg R. Nat Methods. 2014;11:22–24. doi: 10.1038/nmeth.2764. [DOI] [PubMed] [Google Scholar]
- 226.Sieuwerts AM, Mostert B, Bolt-de Vries J, Peeters D, de Jongh FE, Stouthard JM, Dirix LY, van Dam PA, Van Galen A, de Weerd V, Kraan J, van der Spoel P, Ramirez-Moreno R, van Deurzen CH, Smid M, Yu JX, Jiang J, Wang Y, Gratama JW, Sleijfer S, Foekens JA, Martens JW. Clinical cancer research: an official journal of the American Association for Cancer Research. 2011;17:3600–3618. doi: 10.1158/1078-0432.CCR-11-0255. [DOI] [PubMed] [Google Scholar]
- 227.Seiden MV, Kantoff PW, Krithivas K, Propert K, Bryant M, Haltom E, Gaynes L, Kaplan I, Bubley G, DeWolf W, et al. Journal of clinical oncology: official journal of the American Society of Clinical Oncology. 1994;12:2634–2639. doi: 10.1200/JCO.1994.12.12.2634. [DOI] [PubMed] [Google Scholar]
- 228.Xi L, Nicastri DG, El-Hefnawy T, Hughes SJ, Luketich JD, Godfrey TE. Clinical chemistry. 2007;53:1206–1215. doi: 10.1373/clinchem.2006.081828. [DOI] [PubMed] [Google Scholar]
- 229.Antonarakis ES, Lu C, Wang H, Luber B, Nakazawa M, Roeser JC, Chen Y, Mohammad TA, Chen Y, Fedor HL, Lotan TL, Zheng Q, De Marzo AM, Isaacs JT, Isaacs WB, Nadal R, Paller CJ, Denmeade SR, Carducci MA, Eisenberger MA, Luo J. The New England journal of medicine. 2014;371:1028–1038. doi: 10.1056/NEJMoa1315815. [DOI] [PMC free article] [PubMed] [Google Scholar]
- 230.Attard G, Swennenhuis JF, Olmos D, Reid AH, Vickers E, A’Hern R, Levink R, Coumans F, Moreira J, Riisnaes R, Oommen NB, Hawche G, Jameson C, Thompson E, Sipkema R, Carden CP, Parker C, Dearnaley D, Kaye SB, Cooper CS, Molina A, Cox ME, Terstappen LW, de Bono JS. Cancer research. 2009;69:2912–2918. doi: 10.1158/0008-5472.CAN-08-3667. [DOI] [PubMed] [Google Scholar]
- 231.LeBleu VS, O’Connell JT, Gonzalez Herrera KN, Wikman H, Pantel K, Haigis MC, de Carvalho FM, Damascena A, Domingos Chinen LT, Rocha RM, Asara JM, Kalluri R. Nature cell biology. 2014;16:992–1003. doi: 10.1038/ncb3039. [DOI] [PMC free article] [PubMed] [Google Scholar]
- 232.Jordan NV, Bardia A, Wittner BS, Benes C, Ligorio M, Zheng Y, Yu M, Sundaresan TK, Licausi JA, Desai R, O’Keefe RM, Ebright RY, Boukhali M, Sil S, Onozato ML, Iafrate AJ, Kapur R, Sgroi D, Ting DT, Toner M, Ramaswamy S, Haas W, Maheswaran S, Haber DA. Nature. 2016;537:102–106. doi: 10.1038/nature19328. [DOI] [PMC free article] [PubMed] [Google Scholar]
- 233.Heath JR, Ribas A, Mischel PS. Nat Rev Drug Discovery. 2016;15:204–216. doi: 10.1038/nrd.2015.16. [DOI] [PMC free article] [PubMed] [Google Scholar]
- 234.Alix-Panabieres C. Recent results in cancer research Fortschritte der Krebsforschung Progres dans les recherches sur le cancer. 2012;195:69–76. doi: 10.1007/978-3-642-28160-0_6. [DOI] [PubMed] [Google Scholar]
- 235.Alix-Panabières C, Vendrell JP, Pelle O, Rebillard X, Riethdorf S, Muller V, Fabbro M, Pantel K. Clinical chemistry. 2007;53:537–539. doi: 10.1373/clinchem.2006.079509. [DOI] [PubMed] [Google Scholar]
- 236.Deneve E, Riethdorf S, Ramos J, Nocca D, Coffy A, Daures JP, Maudelonde T, Fabre JM, Pantel K, Alix-Panabieres C. Clinical chemistry. 2013;59:1384–1392. doi: 10.1373/clinchem.2013.202846. [DOI] [PubMed] [Google Scholar]
- 237.Hughes AJ, Spelke DP, Xu ZC, Kang CC, Schaffer DV, Herr AE. Nat Methods. 2014;11:749–755. doi: 10.1038/nmeth.2992. [DOI] [PMC free article] [PubMed] [Google Scholar]
- 238.Khoo BL, Lee SC, Kumar P, Tan TZ, Warkiani ME, Ow SG, Nandi S, Lim CT, Thiery JP. Oncotarget. 2015;6:15578–15593. doi: 10.18632/oncotarget.3903. [DOI] [PMC free article] [PubMed] [Google Scholar]
- 239.Khoo BL, Grenci G, Jing T, Lim YB, Lee SC, Thiery JP, Han J, Lim CT. Sci Adv. 2016;2:e1600274. doi: 10.1126/sciadv.1600274. [DOI] [PMC free article] [PubMed] [Google Scholar]
- 240.Gao D, Vela I, Sboner A, Iaquinta PJ, Karthaus WR, Gopalan A, Dowling C, Wanjala JN, Undvall EA, Arora VK, Wongvipat J, Kossai M, Ramazanoglu S, Barboza LP, Di W, Cao Z, Zhang QF, Sirota I, Ran L, MacDonald TY, Beltran H, Mosquera JM, Touijer KA, Scardino PT, Laudone VP, Curtis KR, Rathkopf DE, Morris MJ, Danila DC, Slovin SF, Solomon SB, Eastham JA, Chi P, Carver B, Rubin MA, Scher HI, Clevers H, Sawyers CL, Chen Y. Cell. 2014;159:176–187. doi: 10.1016/j.cell.2014.08.016. [DOI] [PMC free article] [PubMed] [Google Scholar]
- 241.Cayrefourcq L, Mazard T, Joosse S, Solassol J, Ramos J, Assenat E, Schumacher U, Costes V, Maudelonde T, Pantel K, Alix-Panabières C. Cancer research. 2015;75:892–901. doi: 10.1158/0008-5472.CAN-14-2613. [DOI] [PubMed] [Google Scholar]
- 242.Hodgkinson CL, Morrow CJ, Li Y, Metcalf RL, Rothwell DG, Trapani F, Polanski R, Burt DJ, Simpson KL, Morris K, Pepper SD, Nonaka D, Greystoke A, Kelly P, Bola B, Krebs MG, Antonello J, Ayub M, Faulkner S, Priest L, Carter L, Tate C, Miller CJ, Blackhall F, Brady G, Dive C. Nature medicine. 2014;20:897–903. doi: 10.1038/nm.3600. [DOI] [PubMed] [Google Scholar]
- 243.Baccelli I, Schneeweiss A, Riethdorf S, Stenzinger A, Schillert A, Vogel V, Klein C, Saini M, Bauerle T, Wallwiener M, Holland-Letz T, Hofner T, Sprick M, Scharpff M, Marme F, Sinn HP, Pantel K, Weichert W, Trumpp A. Nat Biotechnol. 2013;31:539–544. doi: 10.1038/nbt.2576. [DOI] [PubMed] [Google Scholar]
- 244.Ferreira MM, Ramani VC, Jeffrey SS. Mol Oncol. 2016;10:374–394. doi: 10.1016/j.molonc.2016.01.007. [DOI] [PMC free article] [PubMed] [Google Scholar]
- 245.Butler TP, Gullino PM. Cancer Res. 1975;35:512–516. [PubMed] [Google Scholar]
- 246.Soper SA, Ford SM, Qi S, McCarley RL, Kelly K, Murphy MC. Anal Chem. 2000;72:642A–651A. doi: 10.1021/ac0029511. [DOI] [PubMed] [Google Scholar]
- 247.Di Fiore F, Blanchard F, Charbonnier F. Brit J Cancer. 2007;96:1166–1169. doi: 10.1038/sj.bjc.6603685. [DOI] [PMC free article] [PubMed] [Google Scholar]
- 248.Lievre A, Bachet JB, Le Corre D. Cancer research. 2006;66:3992–3995. doi: 10.1158/0008-5472.CAN-06-0191. [DOI] [PubMed] [Google Scholar]
- 249.Wang H, Chen HW, Hupert ML, Chen PC, Datta P, Pittman TL, Goettert J, Murphy MC, Williams D, Barany F, Soper SA. Angew Chem Int Edit. 2012;51:4349–4353. doi: 10.1002/anie.201200732. [DOI] [PMC free article] [PubMed] [Google Scholar]
- 250.Levy-Sakin M, Ebenstein Y. Current opinion in biotechnology. 2013;24:690–698. doi: 10.1016/j.copbio.2013.01.009. [DOI] [PubMed] [Google Scholar]
- 251.Lam ET, Hastie A, Lin C, Ehrlich D, Das SK, Austin MD, Deshpande P, Cao H, Nagarajan N, Xiao M, Kwok PY. Nat Biotechnol. 2012;30:771–776. doi: 10.1038/nbt.2303. [DOI] [PMC free article] [PubMed] [Google Scholar]
- 252.Uba FI, Hu B, Weerakoon-Ratnayake K, Oliver-Calixte N, Soper SA. Lab on a Chip. 2015;15:1038–1049. doi: 10.1039/c4lc01254b. [DOI] [PMC free article] [PubMed] [Google Scholar]
- 253.Pantel K, Alix-Panabières C. Cancer research. 2013;73:6384–6388. doi: 10.1158/0008-5472.CAN-13-2030. [DOI] [PubMed] [Google Scholar]
- 254.Kidess E, Jeffrey SS. Genome medicine. 2013;5:70. doi: 10.1186/gm474. [DOI] [PMC free article] [PubMed] [Google Scholar]
- 255.Gold B, Cankovic M, Furtado LV, Meier F, Gocke CD. J Mol Diagn. 2015;209-224 doi: 10.1016/j.jmoldx.2015.02.001. [DOI] [PMC free article] [PubMed] [Google Scholar]
- 256.Thery C, Ostrowski M, Segura E. Nat Rev Immunol. 2009;9:581–593. doi: 10.1038/nri2567. [DOI] [PubMed] [Google Scholar]
- 257.Braicu C, Tomuleasa C, Monroig P, Cucuianu A, Berindan-Neagoe I, Calin GA. Cell death and differentiation. 2015;22:34–45. doi: 10.1038/cdd.2014.130. [DOI] [PMC free article] [PubMed] [Google Scholar]
- 258.Valle JW, Wasan H, Lopes A, Backen AC, Palmer DH, Morris K, Duggan M, Cunningham D, Anthoney DA, Corrie P, Madhusudan S, Maraveyas A, Ross PJ, Waters JS, Steward WP, Rees C, Beare S, Dive C, Bridgewater JA. Lancet Oncol. 2015;16:967–978. doi: 10.1016/S1470-2045(15)00139-4. [DOI] [PMC free article] [PubMed] [Google Scholar]
- 259.Strati A, Markou A, Parisi C, Politaki E, Mavroudis D, Georgoulias V, Lianidou E. BMC Cancer. 2011;11:422. doi: 10.1186/1471-2407-11-422. [DOI] [PMC free article] [PubMed] [Google Scholar]
- 260.Ting DT, Wittner BS, Ligorio M, Vincent Jordan N, Shah AM, Miyamoto DT, Aceto N, Bersani F, Brannigan BW, Xega K, Ciciliano JC, Zhu H, MacKenzie OC, Trautwein J, Arora KS, Shahid M, Ellis HL, Qu N, Bardeesy N, Rivera MN, Deshpande V, Ferrone CR, Kapur R, Ramaswamy S, Shioda T, Toner M, Maheswaran S, Haber DA. Cell Rep. 2014;8:1905–1918. doi: 10.1016/j.celrep.2014.08.029. [DOI] [PMC free article] [PubMed] [Google Scholar]
- 261.Kuske A, Gorges TM, Tennstedt P, Tiebel AK, Pompe R, Preisser F, Prues S, Mazel M, Markou A, Lianidou E, Peine S, Alix-Panabieres C, Riethdorf S, Beyer B, Schlomm T, Pantel K. Sci Rep. 2016;6:39736. doi: 10.1038/srep39736. [DOI] [PMC free article] [PubMed] [Google Scholar]
- 262.Hughes AD, Mattison J, Powderly JD, Greene BT, King MR. J Visualized Exp. 2012:e4248. doi: 10.3791/4248. [DOI] [PMC free article] [PubMed] [Google Scholar]
- 263.Shim S, Stemke-Hale K, Noshari J, Becker FF, Gascoyne PRC. Biomicrofluidics. 2013;7:011808. doi: 10.1063/1.4774307. [DOI] [PMC free article] [PubMed] [Google Scholar]
- 264.Jiang Y, Palma JF, Agus DB, Wang Y, Gross ME. Clinical chemistry. 2010;56:1492–1495. doi: 10.1373/clinchem.2010.143297. [DOI] [PubMed] [Google Scholar]
- 265.Mohlendick B, Bartenhagen C, Behrens B, Honisch E, Raba K, Knoefel WT, Stoecklein NH. PloS one. 2013;8:e67031. doi: 10.1371/journal.pone.0067031. [DOI] [PMC free article] [PubMed] [Google Scholar]
- 266.Neves RP, Raba K, Schmidt O, Honisch E, Meier-Stiegen F, Behrens B, Mohlendick B, Fehm T, Neubauer H, Klein CA, Polzer B, Sproll C, Fischer JC, Niederacher D, Stoecklein NH. Clinical chemistry. 2014;60:1290–1297. doi: 10.1373/clinchem.2014.222331. [DOI] [PubMed] [Google Scholar]
- 267.Maheswaran S, Sequist LV, Nagrath S, Ulkus L, Brannigan B, Collura CV, Inserra E, Diederichs S, Lafrate AJ, Bell DW, Digumarthy S, Muzikansky A, Irimia D, Settleman J, Tompkins RG, Lynch TJ, Toner M, Haber DA. The New England journal of medicine. 2008;359:366–377. doi: 10.1056/NEJMoa0800668. [DOI] [PMC free article] [PubMed] [Google Scholar]
- 268.Pratt ED, Stepansky A, Hicks J, Kirby BJ. Anal Chem. 2014;86:11013–11017. doi: 10.1021/ac503453v. [DOI] [PubMed] [Google Scholar]
- 269.Miyamoto DT, Lee RJ, Stott SL, Ting DT, Wittner BS, Ulman M, Smas ME, Lord JB, Brannigan BW, Trautwein J, Bander NH, Wu CL, Sequist LV, Smith MR, Ramaswamy S, Toner M, Maheswaran S, Haber DA. Cancer Discov. 2012;2:995–1003. doi: 10.1158/2159-8290.CD-12-0222. [DOI] [PMC free article] [PubMed] [Google Scholar]
- 270.Sullivan JP, Nahed BV, Madden MW, Oliveira SM, Springer S, Bhere D, Chi AS, Wakimoto H, Rothenberg SM, Sequist LV, Kapur R, Shah K, Iafrate AJ, Curry WT, Loeffler JS, Batchelor TT, Louis DN, Toner M, Maheswaran S, Haber DA. Cancer Discov. 2014;4:1299–1309. doi: 10.1158/2159-8290.CD-14-0471. [DOI] [PMC free article] [PubMed] [Google Scholar]
- 271.Che J, Mach AJ, Go DE, Talati I, Ying Y, Rao J, Kulkarni RP, Di Carlo D. PloS one. 2013;8:e78194. doi: 10.1371/journal.pone.0078194. [DOI] [PMC free article] [PubMed] [Google Scholar]
- 272.Madou MJ. Fundamentals of microfabrication and nanotechnology. 3rd. CRC Press; Boca Raton, FL: 2012. [Google Scholar]
- 273.van Midwoud PM, Janse A, Merema MT, Groothuis GMM, Verpoorte E. Anal Chem. 2012;84:3938–3944. doi: 10.1021/ac300771z. [DOI] [PubMed] [Google Scholar]
- 274.Stern SA, Shah VM, Hardy BJ. J Polym Sci Pol Phys. 1987;25:1263–1298. [Google Scholar]
- 275.Stern SA, Bhide BD. J Appl Polym Sci. 1989;38:2131–2147. [Google Scholar]
- 276.Brandrup J, Immergut EH, Grulke EA. Polymer handbook. 4th. Wiley, New York: Chichester; 2004. [Google Scholar]
- 277.Hu CC, Lee KR, Ruaan RC, Jean YC, Lai JY. J Membrane Sci. 2006;274:192–199. [Google Scholar]
- 278.Chiou JS, Paul DR. J Appl Polym Sci. 1987;34:1037–1056. [Google Scholar]
- 279.Massey LK. Permeability properties of plastics and elastomers: a guide to packaging and barrier materials. 2nd. Plastics Design Library/William Andrew Pub; Norwich, NY, USA: 2003. [Google Scholar]