Abstract
The gene encoding the Insulin-like Growth Factor 2 mRNA binding protein 2/IMP2 is amplified and overexpressed in many human cancers, accompanied by a poorer prognosis. Mice lacking IMP2 exhibit a longer lifespan and a reduced tumor burden at old age. Herein we show in a diverse array of human cancer cells that IMP2 overexpression stimulates and IMP2 elimination diminishes proliferation by 50–80%. In addition to its known ability to promote the abundance of Insulin-like Growth Factor 2/IGF2, we find that IMP2 strongly promotes IGF action, by binding and stabilizing the mRNA encoding the DNA binding protein HMGA1, a known oncogene. HMGA1 suppresses the abundance of IGF binding protein 2/IGFBP2 and Grb14, inhibitors of IGF action. IMP2 stabilization of HMGA1 mRNA plus IMP2 stimulated IGF2 production synergistically drive cancer cell proliferation and account for IMP2’s tumor promoting action. IMP2’s ability to promote proliferation and IGF action requires IMP2 phosphorylation by mTOR.
Research organism: Human
eLife digest
Some types of cancers develop when genes known as oncogenes or tumor promoters become faulty, and are present at abnormally high levels or inappropriately turned on. For example, cancer cells often have extra copies of the gene IMP2 and therefore produce too much the IMP2 protein. Previous research has shown that mice that lack the IMP2 protein develop fewer cancers and live longer, while patients whose cancers make too much IMP2 have a poorer prognosis.
In healthy cells, the IMP2 protein normally helps to make new gene products by stabilising certain newly produced RNA molecules – the precursors of proteins, and in some cases by promoting the translation of these RNAs into proteins. For example, IMP2 binds to the mRNA that encodes the protein IGF2, which is a protein that helps cells to grow and is commonly produced in large quantities by cancer cells. However, until now it was not clear whether IMP2 only acts by increasing the production of IGF2 or also contributes to cancer growth in other ways.
Using a range of human cancer cell lines, and healthy mouse cells, Dai et al. first confirmed that without IMP2, cancer cells made less IGF2 and grew less quickly. When IGF2 was added to the cells lacking IMP2, it only partially restored their ability to grow. Further experiments revealed that cells without IMP2 had increased levels of proteins that counteract the effects of IGF2. Usually, IMP2 binds and stabilizes the mRNA that encodes the oncogenic protein HMGA1, which is known to regulate the number of ‘anti-IGF2 proteins’. However, without IMP2, the HMGA1 levels drop, which causes an increase of the anti-IGF2 proteins.
This indicates that IMP2 promotes cancer cell growth both by enabling cells to produce more IGF2 and by suppressing inhibitors of IGF2 action. This suggests that cancer patients whose tumors have abnormally high levels of IMP2 may be especially sensitive to drugs that target and inhibit IGF2.
Introduction
The insulin-like growth factor 2 (IGF2) mRNA-binding proteins (IGF2BP1-3 or IMP1-3) are a family of RNA binding proteins that participate in post-transcriptional gene regulation (Nielsen et al., 1999; Yisraeli, 2005); notably, SNPs in the second intron of the human IMP2 gene are associated with increased risk for Type 2 Diabetes (Saxena et al., 2007). IMPs enable translation of RNAs containing the IGF2 leader 3 5’UTR by internal ribosomal entry (Dai et al., 2011) and also bind to the IGF2 mRNA 3’UTR; IMP1 but not IMP2 participates in IGF2 RNA splicing (Dai et al., 2013). The IMPs contain six RNA binding motifs, two RRM domains followed by four KH domains and each are substrates for mTOR, which phosphorylates one (IMP1/3) (Dai et al., 2013) or two (IMP2) (Dai et al., 2011) serine residues in the segment that links the second RRM domain with the first KH domain. In RD rhabdomyosarcoma cells, the concurrent dual phosphorylation of IMP2 Ser162 and Ser164 is inhibited by rapamycin coincident with inhibition of IMP2 binding to the IGF2 leader 3 5’UTR (Dai et al., 2011) and IGF2 leader 3 mRNA translation by internal ribosomal entry.
In the mouse embryo, all three IMPs are expressed coordinately starting ~e10.5 coincident with the onset of IGF action; the expression of Igf2, Imp1 and Imp3 is largely extinguished before birth (Nielsen et al., 1999), whereas Imp2 is widely expressed postnatally (Dai et al., 2011). Despite their architectural and sequence similarity, functional differences between the IMPs exist, as displayed most emphatically by the phenotypes of Imp-deficient mice. Imp1 null mice are ~40% smaller than wildtype with aberrant intestinal development and ~50% mortality at p3 (Hansen et al., 2004). Imp1 null mouse embryo fibroblasts (MEFs) exhibit deficient Igf2 RNA splicing and translation and greatly slowed proliferation; the latter is rescued entirely by exogenous IGF2. In contrast, Imp2 null mice are nearly normal in size through weaning, lean and slightly small as adults, highly resistant to diet-induced obesity and long lived (Dai et al., 2015). Investigating the prolonged lifespan of Imp2 deficient mice, necropsy of an apparently healthy cohort at ~845–850 d age revealed the presence of malignant tumors in 4/6 Imp2+/+ mice but in 0/6 Imp2−/− mice (Dai et al., 2015), raising the possibility that IMP2 contributes to tumorigenesis.
Herein we demonstrate that although the oncofetal IMPs are commonly reexpressed in human cancers, IMP2 is usually much more abundant in most human cancers than its paralogs IMP1or IMP3 (Bell et al., 2013, Lederer et al., 2014); moreover, the IMP2 gene is amplified at a high frequency in several common solid tumors, a phenomenon rarely seen with the IMP1 or IMP3 genes. We show that IMP2 overexpression promotes, and IMP2 deficiency strongly inhibits the proliferation of both MEFs and an array of human tumor-derived cell lines. Beyond its known ability to promote IGF2 translation, IMP2 controls the abundance of the oncogenic transcriptional regulator HMGA1 (Fedele and Fusco, 2010; Ozturk et al., 2014; Sumter et al., 2016) by binding and stabilizing HMGA1 mRNA. In turn, HMGA1, another oncofetal protein, suppresses the transcription of Igfbp2, a high affinity extracellular IGF binding protein (Diehl et al., 2009; Hoeflich et al., 1999), and also reduces Grb14, an inhibitor of IGF1R and Insulin Receptor signaling (Desbuquois et al., 2013). IMP2’s stabilization of HMGA1 mRNA together with its stimulation of IGF2 mRNA translation act synergistically to promote cell proliferation through mitogenic signaling by the IGF1R and the type A Insulin Receptor.
Results
IMP2 is widely overexpressed in human cancers
Data generated by the TCGA research network (http://cancergenome.nih.gov/) indicates that amplification of the IMP2 gene is a relatively common event in comparison to amplification of IMP1 and IMP3 (Figure 1A), occurring in ~35–50% of squamous lung cancers, ~15–27% of ovarian cancers and in 15–20% of head and neck, esophageal, cervical and uterine cancers. Moreover, the absolute abundance of IMP2 mRNA in all but a few cancers far exceeds that of the IMP1 and IMP3 paralogues (Figure 1B), even in those cancers wherein the fold amplification of IMP1/IMP3 RNA over their level in the normal tissue is much greater than that of IMP2. Thus, IMP2 is nearly always the most abundant IMP paralogue in human cancers and its overexpression occurs at a high frequency.
Figure 1. The IMP2 gene is amplified and overexpressed in many cancers and drives proliferation.
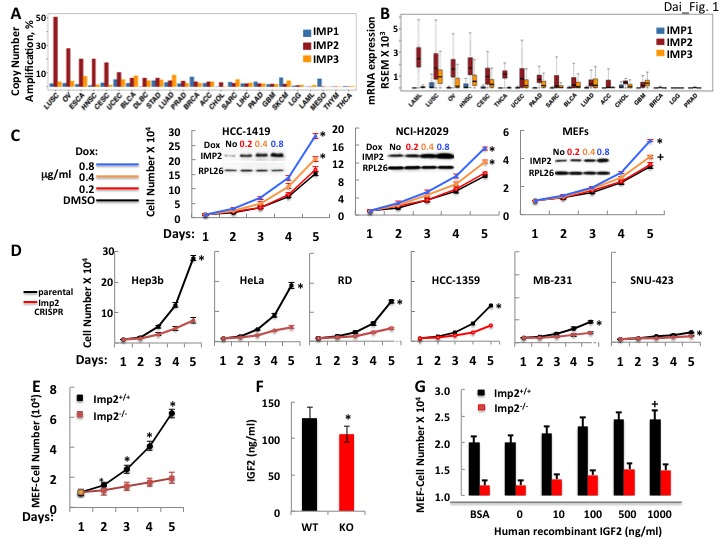
(A) The frequency of IMP1,2,3 gene copy number amplification in various cancers. Data from TCGA. (B) IMP1, 2 and 3 mRNA levels in various cancers. Data from TCGA. (C) IMP2 overexpression enhances proliferative rate. A vector encoding an IMP2 cDNA downstream of a doxycycline sensitive promoter was stably expressed in HCC-1419, NCI-H2029 and MEFs. Cells were treated with Doxycycline at the doses indicated and cell number was determined daily. +p<0.05, *p<0.01 vs DMSO. (D) CRISPR-mediated inactivation of the IMP2 genes slows proliferation. The Hep3b, HeLa, RD, HCC-1359, MB-231 and SNU-423 cell lines were transfected with Cas9/CRISPR and a guide RNA directed at either GFP (black) or IMP2 (red) sequences. Unselected polyclonal cell mixtures were plated in replicate and cell number was determined daily. *p<0.01 vs Imp2 CRISPR. (E) Imp2−/− MEFs proliferate more slowly than Imp2+/+ MEFs. Littermate embryos from Imp2+/− ± were harvested at e12.5–13.5 to derive Imp2+/+ and Imp2−/− MEFs. Polyclonal mixtures were plated in replicate at passage 4 and cell number was determined daily. *p<0.01 vs Imp2−/−. (F) Imp2−/− MEFs produce less medium IGF2 than Imp2+/+ MEFs. Aliquots of the medium were taken at day 3 from the MEF cultures in Figure 1E and assayed for IGF2 polypeptide. *p<0.01 vs Imp2+/+. (G) Supramaximal IGF2 does not restore the slower proliferation of Imp2−/− MEFs to that of Imp2+/+ MEFs. Imp2+/+ and Imp2−/− MEFs were plated in replicate in standard culture medium with the addition of BSA (1 ug/ml) or various amounts of human recombinant IGF2 and cell number was determined 48 hr later. +p<0.05 vs BSA.
IMP2 overexpression enhances and IMP2 deletion reduces proliferation of human cancer cell lines and mouse embryo fibroblasts (MEFs)
IMP2 polypeptide was overexpressed in several cancer-derived cell lines and in wildtype mouse embryo fibroblasts (MEFs). In each instance, IMP2 overexpression increased proliferation in a dose-dependent manner (Figure 1C). Reciprocally, we used the CRISPR-Cas9 to inactivate the IMP2 gene in a diverse cohort of human cancer cell lines; parental controls used a GFP-directed guide. Each of the lines lacking IMP2 expression showed a substantial (52–78%) reduction in the rate of proliferation (Figure 1D). Similarly, Imp2–/– MEFs uniformly displayed less rapid growth, proliferating at ~19–25% the rate of Imp2+/+ cells (Figure 1E). Seeking the mechanism(s) by which loss of IMP2 slows the proliferation we chose to focus on MEFs, which are less genetically heterogeneous than the cancer cells, but comparably responsive to IMP2 overexpression and elimination. IGF2 production by Imp2–/– MEFs is reduced by about 19% compared with Imp2 +/+ MEFs controls (Figure 1F), however saturating amounts of exogenous IGF2 do not rescue the proliferation of Imp2−/− MEFs (Figure 1G). This contrasts sharply with the response of Imp1−/− MEFs to IGF2, which restores their proliferative rate to 100% the level of Imp1+/+ MEFs (Dai et al., 2013). Thus, the modest decrease of IGF2 production caused by Imp2 inactivation contributes minimally to the slowed proliferation of Imp2−/− MEFs.
We applied deep sequencing to RNA extracted from lysates and from anti-IMP2 immunoprecipitates from Imp2+/+ and Imp2−/− MEFs (Supplementary file 1). We also subjected triplicate aliquots of Imp2−/− and Imp2+/+ MEFs to whole cell mass spectroscopic analysis using Tandem Mass Tag (TMT) Technology which yielded the quantitative estimation of the abundance of 7964 polypeptides (Supplementary file 2). The bioinformatic analysis of the RNAs enriched in the IMP2 immunoprecipitates (Huang et al., 2009), as well as the comparisons of the RNAome and proteome of Imp2+/+ and Imp2−/− MEFs by GSEA (Subramanian et al., 2005) did not point to dominant mechanisms or specific elements that might underlie the slowed proliferation of the Imp2−/− MEFs. Seeking polypeptides involved in growth factor signaling and cell cycle progression whose altered abundance (Supplementary file 2) might underlie the slower proliferative rate of the Imp2−/− MEFs, we observed that the abundance of IGFBP2 (Diehl et al., 2009; Hoeflich et al., 1999) and Grb14 (Desbuquois et al., 2013) polypeptides, potential inhibitors of IGF1R and insulin receptor-A signaling, are increased 24.7- and 8.6-fold respectively in the Imp2−/− MEF proteome; Among cell cycle components, the largest difference is a 4.5 fold greater abundance of the cdk inhibitor Cdkn1a/p21Cip1 (Warfel and El-Deiry, 2013) in the Imp2−/− MEFs. The differential abundance of IGFBP2, Grb14 and p21Cip1 was confirmed by immunoblot, whereas the abundance of IMP1 and IMP3 proteins is not altered by deletion of Imp2 (Figure 2A).
Figure 2. Overexpression of the Grb14 and IGFBP2 polypeptides is mostly responsible for the slowed proliferation of Imp2−/− MEFs.
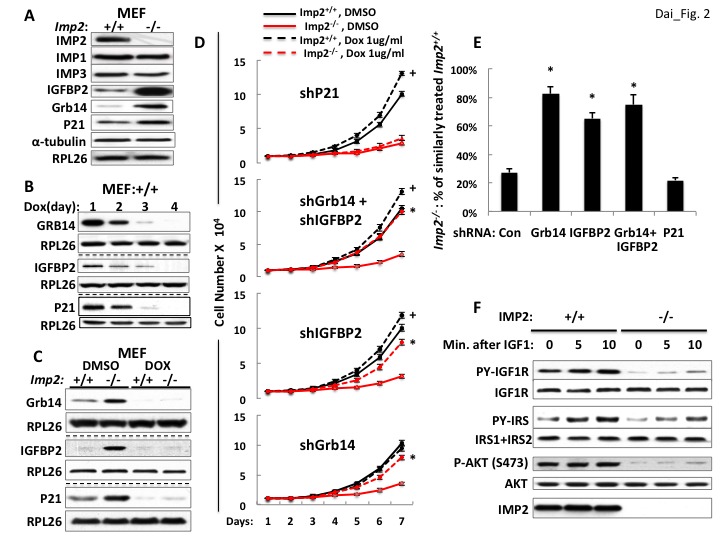
(A) Imp2−/− MEFs exhibit increased abundance of the IGFBP2, Grb14 and P21Cip1 polypeptides as compared with Imp2+/+ MEFs but unaltered levels of IMP1 and IMP3. (B) Time course of shRNA-mediated depletion of Grb14, Igfbp2 and P21Cip1 from Imp2+/+ MEF. (C) The effect of shRNA expression on the Grb14, IGFBP2 and P21Cip1 polypeptides in Imp2+/+ and Imp2−/− MEFs. Polyclonal populations of Imp2+/+ and Imp2−/− MEFs stably expressing shRNAs directed at Grb14, Igfbp2 or P21Cip1 were extracted 72 hr after addition of doxycycline. (D) Depletion of the Grb14 and IGFBP2 increases proliferation of Imp2−/− MEFs preferentially as compared with Imp2+/+ MEFs. Polyclonal populations of Imp2+/+ (black) and Imp2−/− (red) MEFs stably expressing shRNAs directed at Grb14, Igfbp2, Grb14 and Igfbp2 or P21Cip1 were plated in replicate and DMSO (solid) or doxycycline (dashed) was added eight hours thereafter. The cell number was determined following day (=day 1) and daily thereafter. + = p < 0.05, Dox vs DMSO, Imp2+/+; *=p < 0.01 Dox vs DMSO, Imp2−/−. (E) The shRNAs against Grb14, Igfbp2 or both restore the proliferation of Imp2−/− MEFs close to that of the correspondingly treated Imp2+/+ MEFs, but p21Cip1 shRNA does not. The increase in cell number at day 7 as shown in Figure 2D for Imp2+/+ and Imp2−/− MEFs was recalculated as follows: the bar labeled ‘Con’ represents the increase in cell number at day 7 of Imp2−/− MEFs treated with DMSO divided by the increase in cell number at day 7 of DMSO-treated Imp2+/+ MEFs, multiplied by 100. The other bars represent the same calculation for the doxycycline-treated Imp2+/+ and Imp2−/− MEFs stably expressing shRNAs directed at Grb14, Igfbp2, Grb14 and Igfbp2 or P21Cip1. *=p < 0.01 vs Con. (F) IGF1R signaling is impaired in Imp2−/− MEFs. Imp2+/+ and Imp2−/− MEFs, serum starved overnight were rinsed in serum-free DMEM and stimulated immediately thereafter by addition of human recombinant IGF1 (30 nM). Extracts were prepared before and at the times shown thereafter; the extracts and IPs of IGF1R and IRS1 +IRS2 therefrom were subjected to immunoblots as indicated.
Depletion of Grb14 and IGFBP2 each partially rescue Imp2−/− MEF proliferation but depletion of p21Cip1 does not
Lentiviral encoded, doxycycline-inducible shRNAs against Grb14, Igfbp2 and p21Cip1 were each stably expressed in both Imp2+/+ and Imp2−/− MEFs. Induction of shRNA expression reduced the abundance of the target polypeptides progressively over the initial 4 days (Figure 2B), with levels in the Imp2−/− MEFs becoming almost as low as in the Imp2+/+ MEFs by day 3 (Figure 2C). As regards proliferation, Imp2+/+ MEFs containing shRNA against Grb14 proliferated at the same rate whether treated with DMSO or doxycycline, increasing in number ~10 fold over seven days; Imp2−/− MEFs containing shRNA against Grb14 treated with DMSO increased in number by ~3.5 fold, however treatment with doxycycline increased Imp2−/− MEF numbers ~8 fold over the same interval, that is, they proliferated at ~80% the rate of the Imp2+/+ MEFs (Figure 2D, bottom).
A similar response is observed with depletion of IGFBP2; doxycycline treatment of Imp2+/+ MEFs containing shRNA against Igfbp2 increased proliferation slightly (~20%) over treatment with DMSO whereas doxycycline treatment of Imp2−/− MEFs containing shRNA against Igfbp2 increased cell number from ~30% to ~68% that of similarly-treated Imp2+/+ MEFs. (Figure 2D, second from bottom, 2E). Concurrent depletion of Grb14 and IGFBP2 from Imp2−/− MEFs restored their proliferation to ~75% that of similarly treated Imp2+/+ MEFs (Figure 2D, second from top, 2E). In contrast, depletion of p21Cip1 from Imp2+/+ and Imp2−/− MEFs increased their proliferation by 1.33 and 1.36 fold respectively (Figure 2D, top, 2E). Thus, reversal of the 4.5 fold increased abundance of p21Cip1does not enable any rescue of Imp2−/− MEF proliferation.
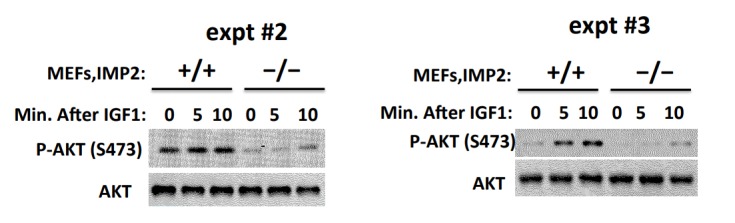
We hypothesize that overexpression of Grb14 and IGFBP2 slow proliferation of Imp2−/− MEFs through inhibition of IGF1R and Type A insulin receptor-initiated signal transduction. To evaluate the signaling capacity of the IGF1R, Imp2+/+ and Imp2−/− MEFs were deprived of serum overnight, rinsed and incubated in fresh serum-free medium and stimulated briefly with IGF1 (30 nM); although the abundance of the IGF1R and InsR beta subunits does not differ, the IGF1-induced increase in IGF1R beta subunit tyrosine phosphorylation in Imp2−/− MEFs is substantially reduced as compared with Imp2+/+ MEFs, as is the overall tyrosine phosphorylation of IRS1 +IRS2 and activation of Akt assessed by phosphorylation at Ser473 (Figure 2F). Thus IGF1R signaling is impeded in the Imp2 null MEFs.
Increased Igfbp2 gene transcription and reduced Grb14 polypeptide degradation underlies their overabundance in Imp2−/− MEFs
Surprisingly, the Igfbp2 and Grb14 mRNAs are not among the 636 mRNAs 1.5-fold or more enriched in the IMP2 immunoprecipitates (Supplementary file 1) from Imp2+/+ MEFs, i.e., Igfbp2- and Grb14-mRNAs are not IMP2 clients. The abundance of Igfbp2 mRNA in Imp2−/− MEFs is increased 18.6 (RNAseq; Supplementary file 1) to 21.7 (by QPCR; Figure 3A, top) fold and its half life is prolonged ~1.7 fold (10.1 hr vs 5.9 hr) over Imp2+/+ MEFs (Figure 3B, top); although there is also some increase in polysomal abundance (Figure 3C, top), the markedly increased abundance of the IGFBP2 polypeptide in Imp2−/− MEFs is attributable primarily to increased Igfbp2 gene transcription. In contrast, Grb14 mRNA is approximately 70% lower (RNAseq: Supplementary file 1; QPCR: Figure 3A,middle) and its half-life is ~40% shorter (3.89 hr vs 6.03 hr; Figure 3B, middle) in Imp2−/− versus Imp2+/+ MEFs. Although there is a ~ 2.5 fold increase in Grb14 mRNA polysomal abundance in the Imp2−/− MEFs (Figure 3C, middle), the primary mechanism for ~9 fold increased polypeptide abundance is post-translational, a marked prolongation of Grb14 polypeptide half-life from ~2 hr to ~31 hr (Figure 3D, middle); p21Cip1 follows a pattern generally similar to Grb14 (Figure 3A–E, bottom).
Figure 3. IGFBP2 polypeptide overabundance in Imp2−/− MEFs is due to increased gene transcription whereas Grb14 polypeptide overabundance is due to markedly slower polypeptide degradation.
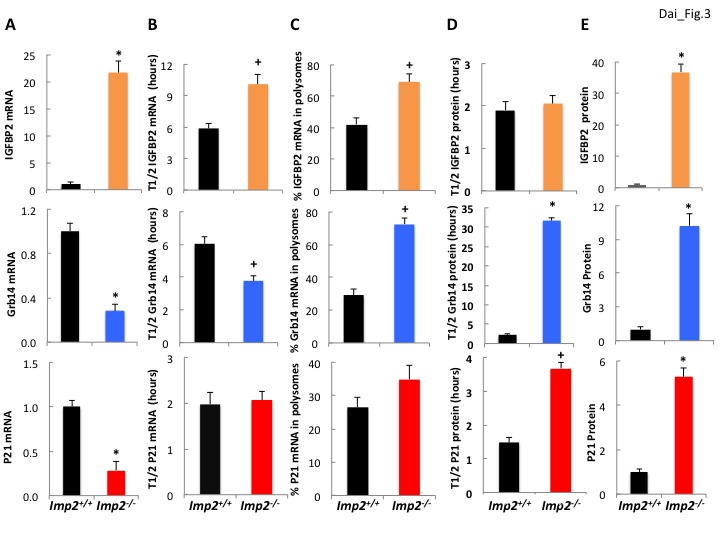
(A) Igfbp2, Grb14 and P21 mRNA abundance in Imp2+/+ and Imp2−/− MEFs. RNA was extracted from Imp2+/+ and Imp2−/− MEFs and the abundance of Grb14, Igfbp2, P21, Gapdh and Actb mRNA was determined by QPCR. The difference in Ct value between the Imp2+/+ and Imp2−/− MEFs was converted to a numerical fraction; the value for the abundance of the Imp2+/+ MEFs was set to 1.0 (black bars) and the relative abundance of the Imp2−/− MEFs is shown in colored bars. Values determined by genome-wide RNAseq are found in Supplementary file 2. (B) The turnover of Igfbp2, Grb14 and P21 mRNAs in Imp2+/+ and Imp2−/− MEFs. Actinomycin 1 uM was added to rapidly growing Imp2+/+ (black) and Imp2−/− (colored) MEFs; RNA was extracted at 0,2,4,6,8,10, 12 hr thereafter and the abundance of Grb14, Igfbp2, P21, Gapdh and Actb was determined by QPCR. The rate of decline was determined by least squares and the time representing a 50% decrease of the initial value is shown. (C) The percentage of Igfbp2, Grb14 and P21 mRNAs residing in polysomes in Imp2+/+ and Imp2−/− MEFs. Total RNA and post-mitochondrial extracts were prepared from equal numbers of rapidly growing Imp2+/+ (black) and Imp2−/− (colored) MEFs; the post-mitochondrial extracts were subjected to sucrose density gradient centrifugation. Total RNA and RNA extracted from the pooled polysomal fractions was quantified by QPCR and the ratio of polysomal/total RNA X 100 was determined for Grb14, Igfbp2 and P21. (D) The turnover of the IGFBP2, Grb14 and P21 polypeptides in Imp2+/+ and Imp2−/− MEFs. Cycloheximide 250 μM, was added to rapidly growing Imp2+/+ (black) and Imp2−/− (colored) MEFs; extracts prepared at t = 0 and every hour for 12 hr were subjected to SDS-PAGE and immunoblot for Grb14, IGFBP2 and P21. Relative abundance was determined by densitometry; the rate of decline was calculated as in 3B. (E) The abundance of the IGFBP2, Grb14 and P21 polypeptides in Imp2+/+ and Imp2−/− MEFs. Extracts prepared from rapidly growing Imp2+/+ and Imp2−/− MEFs were subjected to SDS-PAGE and the relative abundance of Grb14, IGFBP2 and P21 was determined by immunoblot; the values for Imp2+/+ were set to 1.0 (black) and the relative value for Imp2−/− is shown in the colored bars. Values determined by MS are found in Supplementary file 2. For all sections, +p<0.05, *=p < 0.01 vs Imp2+/+.
Addition of IGF2 or depletion of Grb14 from IMP2 deficient human cancer cells partially restores their proliferation toward parental levels, often additively
As in MEFs, deletion of IMP2 from the cancer cell lines is accompanied by a marked increase in the abundance of Grb14 and IGFBP2 (Figure 4A), and overexpression of IMP2 reduces the abundance of both the IGFBP2 and Grb14 polypeptides (Figure 4B). Notably, IMP2 deletion from the human cancer cells causes a much greater decrease in IGF2 production than in MEFs, ranging from ~35–50% of parental levels (Figure 4C). Consequently, we attempted to overcome both the relative deficiency of IGF2 as well as the ability of IGFBP2 overabundance to sequester IGF2 by the addition of an excess of IGF2. The effect of adding exogenous IGF2 and shRNA-induced Grb14 depletion, singly and in combination, on the proliferation of the parental and IMP2 deficient cancer cell lines shown in Figure 4D. Depletion of Grb14 from parental cancer cells increased proliferation by only 1.04–1.12 fold whereas Grb14 depletion from the IMP2-deficient variants increased their proliferation by 1.5–2.09 fold. Similarly, addition of saturating amounts of IGF2 to the parental and IMP2 deficient cancer cells causes a substantially greater fractional increase in cell number in each of the IMP2 deficient variants than in the parental cells (except IMP2 deficient SNU-423, bottom right). Excess IGF2 alone however, like Grb14 depletion, restores total cell number of the IMP2 deficient variants only partially toward the parental levels; in the IMP2 deficient HeLa (Figure 4D, middle left), MB-231 (Figure 4D, middle right) and Hep3b cells (Figure 4D, top left), combining depletion of Grb14 with the addition of IGF2 restores cell numbers of the IMP2 deficient variants to 72%, 79% and 96% of the parental levels. Thus in these three lines the large majority of the IMP2-stimulated proliferation is mediated by enhancing the production and action of IGF2. The IMP2 deficient variants of RD (Figure 4D, bottom left) and HCC1359 cells (Figure 4D, top right) exhibit a more modest additivity suggesting the contribution of other IMP2-regulated proliferative regulators. Only in the SNU-423 cells (Figure 4D, bottom right) did the parental cells show a more robust proliferative response to IGF2 than did the IMP2 deficient variant (2.44 fold vs. 1.63 fold). Nevertheless, IMP2 deficient SNU-423 cells responded to depletion of Grb14 with a greater increase in proliferation than the parental SNU-423 cells (1.5 fold vs 1.12 fold). We conclude that the pro-proliferative effect of IMP2 in most cancer derived cell lines is mediated predominantly by upregulation of IGF2 production and suppression of Grb14 and IGFBP2 polypeptide abundance which together facilitate IGF2 signaling.
Figure 4. The ability of IMP2 to drive the proliferation of human cancer cells is mostly due to IMP2 regulation of IGF2, Grb14 and IGFBP2 abundance.
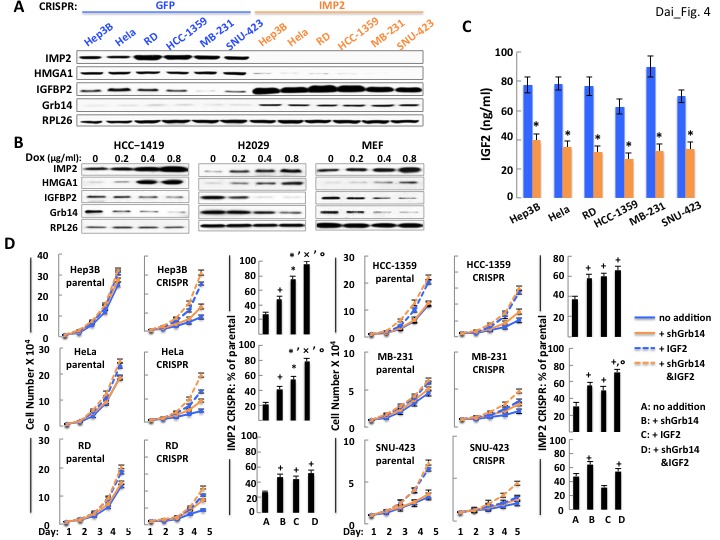
(A) CRISPR mediated deletion of IMP2 from human cancer cell lines causes markedly increased abundance of IGFBP2 and Grb14. Extracts prepared from the six cell lines shown in Figure 1D were subjected to SDS-PAGE and immunoblot as indicated. (B) Overexpression of IMP2 in human cancer cell lines and MEFs reduces the abundance of IGFBP2 and Grb14. Extracts prepared from the HCC-1419, NCI-H2029 and MEFs stably overexpressing doxycycline-sensitive cDNAs for IMP2, as shown in Figure 1C were immunoblotted for IGFBP2 and Grb14. (C) CRISPR mediated deletion of IMP2 from human cancer cell lines reduces production of IGF2. Aliquots of the medium from the cells depicted in Figure 1D were taken at day five and assayed for IGF2; the level in the cell-free medium (approximately 7 ng/ml) has been subtracted. *=p < 0.01 vs parental. (D) Exogenous IGF2 and depletion of Grb14 increases proliferation of IMP2-deficient cancer cells in a preferential and often additive manner as compared with the parental cells. The variants of the Hep3b, HeLa, RD, HCC-1359, MB-231 and SNU-423 cell lines shown in Figure 1D, which had been transfected with Cas9/CRISPR and a guide RNA directed at either GFP (parental) or IMP2 (CRISPR) sequences, were infected with Lentiviral vectors encoding a Doxycycline responsive shRNA against Grb14. The cells were grown in the presence of DMSO (blue solid line, ‘no addition’), DMSO and IGF2 (500 ng/ml, blue dashed line, ‘+IGF2’), Doxycycline (orange solid line, ‘+shGrb14’), or Doxycycline and IGF2 (orange dashed line, ‘+shGrb14 and IGF2’). Cell number was determined daily. The bar graphs show the increase in cell number at day 5 of the cells designated ‘CRISPR’ divided by the increase in cell number at day 5 of the comparably treated ‘parental’ cells, multiplied by 100. + = p < 0.05, *=p < 0.01 vs A; x =<0.01 vs B; °=p < 0.05 vs C.
Reduced HMGA1 underlies the increased abundance of IGFBP2 and Grb14 and the slower proliferation of IMP2 deficient MEFs and tumor cells
Because the increase in Igfbp2 mRNA induced by IMP2 deficiency is due primarily to increased gene transcription, we inquired whether elimination of IMP2 significantly alters the abundance of any of the IMP2 client RNAs encoding transcription factors (TFs). The RNAseq from Imp2+/+ and Imp2−/− MEFs (Supplementary file 1) detected 810 of 1457 mouse TFs at AnimalTFDB (http://www.bioguo.org/AnimalTFDB/index.php), many more than did the proteomic analysis (275/1457); among the 636 RNAs enriched ≥1.5X in the IMP2 IP are 64 that encode TFs, of which 14 show a three-fold or greater decreased abundance in Imp2−/− MEFs as compared with Imp2+/+ MEFs (none show a comparably increased abundance; Supplementary file 1). Only one of polypeptides encoded by these 14 mRNAs, HMGA1 was detected in the proteomic analysis (Supplementary file 2), and the abundance of HMGA1 polypeptide was approximately 60% lower in the Imp2−/− than in the Imp2+/+ MEFs. We confirmed by PCR that HMGA1 mRNA is specifically enriched in the IMP2 IP,~2 fold from MEFs and ~5 fold from RD cells (Figure 5A); RNA seq indicates that IMP2 binds primarily to the 3’UTR of the Hmga1 RNA (Figure 5—figure supplement 1). Hmga1 mRNA in Imp2−/− MEFs is 90% lower than Imp2+/+ MEFs (Figure 5B; Supplementary file 1) primarily because of faster mRNA turnover; the half life of Hmga1 mRNA, ~3.5 hr in Imp2+/+ MEFs is reduced to 0.4 hr in Imp2−/− MEFs (Figure 5C). The reduction in the HMGA1 polypeptide (Figure 5F) is somewhat ameliorated by a 1.8 fold increase in Hmga1 mRNA polysomal abundance (Figure 5D).
Figure 5. A decreased level of Hmga1, an IMP2 client mRNA, causes the upregulation of IGFBP2 and Grb14 abundance and the slowed proliferation of IMP2 deficient MEFs and RD cells.
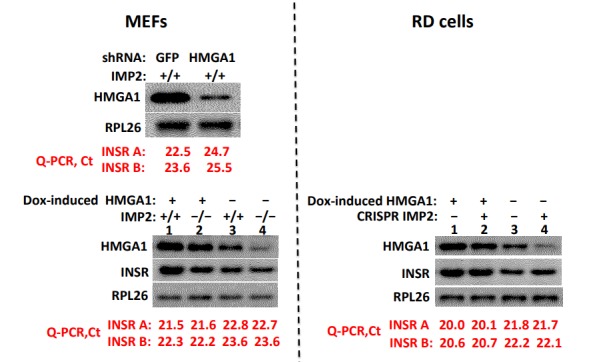
(A) IMP2 binds Hmga1 mRNA. IPs were prepared from extracts of Imp2+⁄+ and Imp−⁄− MEFs (left pair) and from RD cells (right pair) with anti-IMP2 antibody (black) or nonimmune IgG (orange). The relative enrichment of HMGA1 mRNA in each IP is quantified by real time RT-PCR. (B) Hmga1 mRNA abundance in Imp2+/+ and Imp2−/− MEFs. RNA was extracted from Imp2+/+ and Imp2−/− MEFs and the abundance of HMGA1 mRNA was determined by QPCR. The abundance in Imp2−/− MEFs relative to Imp2+/+ MEFs (set to 1.0, black bars) is shown in the red bar. (C) The turnover of Hmga1 mRNAs in Imp2+/+ and Imp2−/− MEFs. The t1/2 of Hmga1 mRNA turnover was determined as in Figure 3B. (D) The percentage of Hmga1mRNAs residing in polysomes in Imp2+/+ and Imp2−/− MEFs. Determined as in Figure 3C. (E) The turnover of the HMGA1 polypeptides in Imp2+/+ and Imp2−/− MEFs. The t1/2 of HMGA1 polypeptide turnover determined as in Figure 3D. (F) The abundance of the HMGA1polypeptides in Imp2+/+ and Imp2−/− MEFs. The relative abundance of HMGA1was determined by quantitation of extract immunoblots. Values determined by MS are found in Supplementary file 2. For Figure 5B–F, +p<0.05, *p<0.01 vs Imp2+/+. (G) IGFBP2 mRNA is regulated by the abundance of HMGA1 polypeptide. IGFBP2 mRNA in RD cells and Imp2+/+ MEFs stably expressing doxycycline-inducible shRNAs against HMGA1 (left set) or doxycycline-inducible HMGA1 cDNAs (right set). Doxycycline = colored bars; DMSO = black bars. (H) HMGA1 binds the Igfbp2 but not the Grb14 promoter. MEFs (~10 million) were washed and protein was cross-linked to DNA using formaldehyde. ChIP was performed as described in Methods using antibodies to HMGA1 (black) or nonimmune IgG (red). (I) Both IGFBP2 and Grb14 protein levels are regulated by HMGA1 polypeptide abundance. Immunoblots were performed using MEFs extracted 72 hr after doxycycline induction of Hmga1 shRNA (left) or induction of HMGA1 cDNA expression (right). (J) HMGA1 overexpression restores the proliferation of Imp2−/− MEFs close to that of the similarly treated Imp2+/+ MEFs. Parental MEFs or MEFs stably expressing a doxycycline-inducible HMGA1 overexpressing MEF cells were treated with doxycycline and cell number was measured daily. The bar graphs were calculated as in Figure 2E. (K) The HMGA1 overexpression restores the proliferation of IMP2 CRISPR RD cells nearly identical to similarly treated parental RD cells. As in Figure 5J.
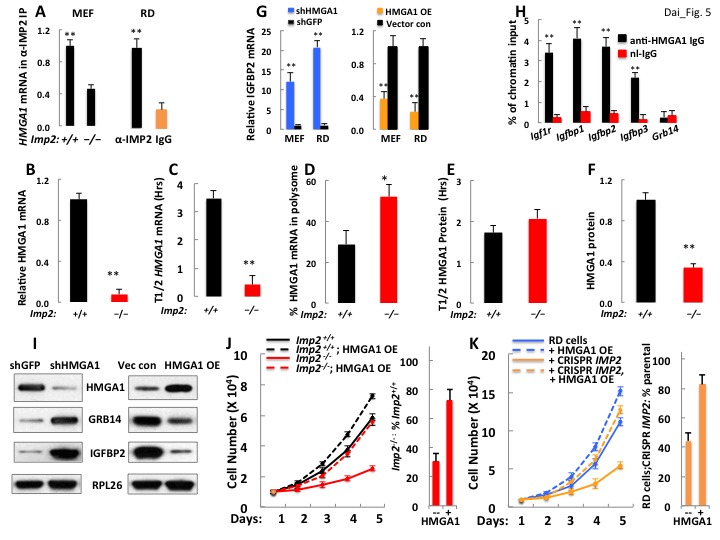
Figure 5—figure supplement 1. RNAseq indicates that IMP2 binds HMGA1 mRNA predominantly at the 3’UTR.
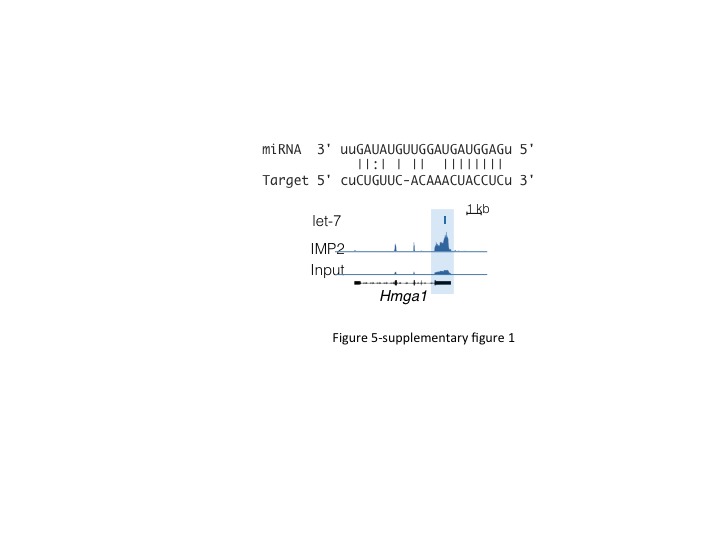
Figure 5—figure supplement 2. Depletion of IGFBP2 does not affect the abundance of Grb14.
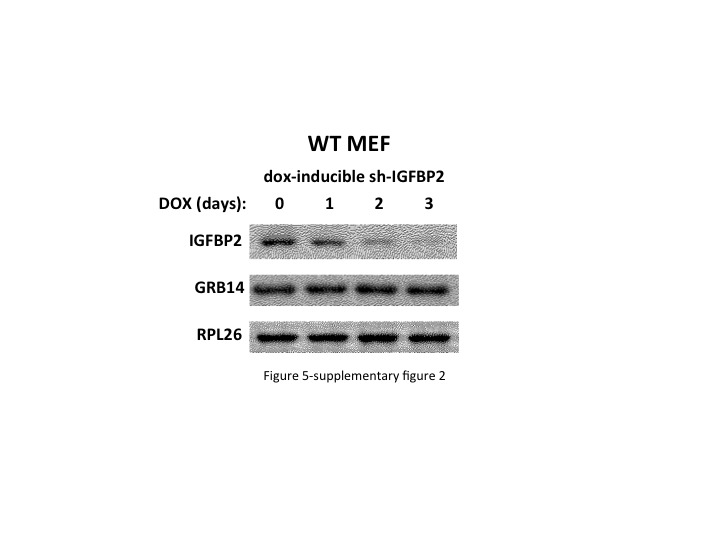
Figure 5—figure supplement 3. Depletion of HMGA1 prolongs the half-life of the Grb14 polypeptide.
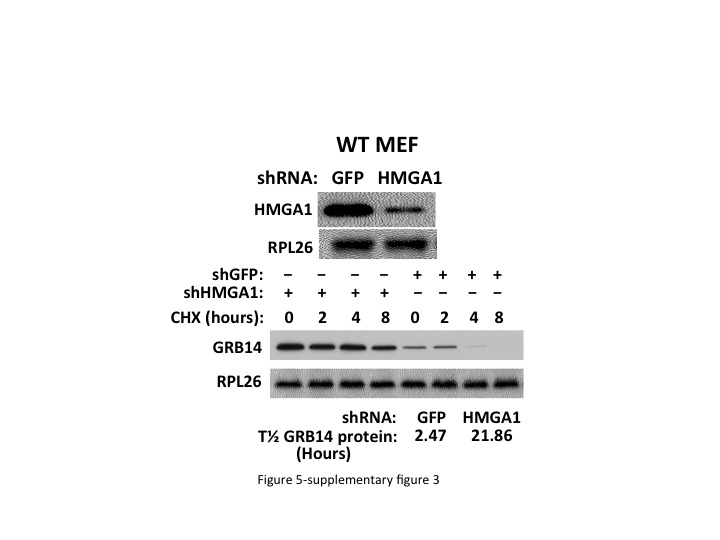
Depletion of HMGA1 from Imp2+/+ MEFs or RD cells increased the abundance of IGFBP2 mRNA 12.1 fold and 20.8 fold respectively (Figure 5G, left); reciprocally, doxycycline-induced expression of HMGA1 reduced IGFBP2 mRNA levels in RD cells and Imp2+/+ MEFs and by 79% and 63% respectively (Figure 5G, right). To determine if HMGA1 directly binds to the mouse Igfbp2 gene promoter, chromatin immunoprecipitation was performed using MEFs. The Igfbp2 gene promoter was enriched 3.7 fold in the anti-IMP2 IP as compared with control IgG, an enrichment comparable to that observed of the promoters of the genes encoding Igf1r, Igfbp1 and Igfbp3 (Figure 5H), previously identified as HMGA1 transcriptional targets (Aiello et al., 2010; Liritano et al., 2012); notably the promoter of Grb14 was not enriched in the HMGA1 IP; similar results were obtained with HMGA1 ChIP using RD cells (not shown). Thus HMGA1 binds and regulates the Igfbp2 gene, suppressing its transcription, so that HMGA1 depletion increases, and overexpression decreases IGFBP2 polypeptide abundance in MEFs; surprisingly, HMGA1 affects the abundance of the Grb14 polypeptide in a virtually identical manner (Figure 5I), an effect not mediated through IGFBP2 (Figure 5—figure supplement 2). As with loss of IMP2, HMGA1 depletion greatly increases the abundance of Grb14 polypeptide by reducing Grb14 polypeptide degradation (Figure 5-Supplementaary Figure 3), acting indirectly through an as yet unidentified transcriptional target. The dependence of HMGA1 abundance on IMP2 demonstrated for MEFs (Figure 5I) is observed in all of the other cancer derived cell lines examined; elimination of IMP2 is accompanied by a major reduction in HMGA1 polypeptide (Figure 4A) whereas forced overexpression of IMP2 in HCC1419 and H2029 cells causes a dose-dependent increase in HMGA1 (Figure 4B).
Doxycycline-induced expression of HMGA1 increases the proliferative rate of Imp2+/+ MEFs by 1.3 fold but increases that of Imp2−/− MEFs by 3.1 fold, restoring their proliferative rate from 30.6% of Imp2+/+ MEFs to 73% (Figure 5J), essentially the same increase as incurred by dual depletion of IGFBP2 and Grb14 (Figure 2D,E). Induced expression of HMGA1 in RD cells stimulates proliferation by 1.2 fold, whereas HMGA1 increases the proliferative rate of IMP2-deficient RD cells by 2.6 fold, restoring the rate to 83% that of the parental RD cells overexpressing HMGA1 (Figure 5K); this is a much greater stimulation than induced by addition of excess IGF2 plus depletion of Grb14 (from 26% to 52% of the parental rate, Figure 4D bottom left), suggesting that in RD cells HMGA1 engenders proproliferative outputs in addition its ability to suppress IGFBP2 and Grb14.
IMP2 stimulation of proliferation, stabilization of Hmga1 mRNA and suppression of Grb14 and IGFBP2 accumulation in MEFs requires an acidic charge at IMP2 residue 164, the mTOR phosphorylation site
We showed previously that transfection of Flag-IMP2(Ser162Asp/Ser164Asp) stimulated the translation of an IGF2-leader 3-luciferase reporter in RD rhabdomyosarcoma cells to an extent similar to Flag-IMP2 wildtype, whereas Flag-IMP2(Ser162Ala/Ser164Ala) was no more effective than empty vector (Dai et al., 2011); this translational response was paralleled by the ability of the IMP2 variants to bind the IMP2 leader 3 5’UTR RNA. To evaluate the functional significance of each phosphorylation site on the ability of IMP2 to promote proliferation, we generated IMP2 variants with either an Ala or an Asp at both Ser162 and Ser164, which we refer to as IMP2-AA, -AD, -DA and -DD and stably expressed doxycycline regulated Flag-tagged versions of each of the four mutant IMP2, a Flag-tagged IMP2 wildtype (IMP2-SS) and an empty Flag vector in the parental Imp2−/− MEFs. Polyclonal populations were selected and a doxycycline dose was determined that induced polypeptide expression of each Flag-tagged IMP2 variant to a level similar to endogenous IMP2 in Imp2+/+ MEFs (Figure 6A, immunoblot; Figure 6B, TMT peptides, immunoblot below); 104 cells of the six MEF types were plated in replicate and proliferation was monitored over six days (Figure 6A). Imp2−/− MEFs expressing IMP2-AD and IMP2-DD proliferated at a rate indistinguishable from Imp2−/− MEFs expressing IMP2-SS, whereas Imp2−/− MEFs expressing IMP2-AA IMP2-DA proliferated at ~50% of that rate as did Imp2−/− MEFs containing empty Flag vector. To evaluate how these IMP2 variants altered the MEF proteome, whole cell mass spectroscopic proteomic analysis was performed as before (Supplementary file 3). If the TMT-determined abundance of each polypeptide in the MEFs expressing Flag-IMP2-AA and Flag-IMP2-DA and empty Flag vector (slower proliferating MEFs) were summed, and divided by the sum of the corresponding polypeptide in Imp2−/− MEFs containing Flag-IMP2-SS, Flag-IMP2-DD and Flag-IMP2-AD (faster proliferating MEFs), the two endogenous polypeptides with the highest ratio in the entire proteome are IGFBP2 (5.7) and Grb14 (3.7) (Figure 6B, right column). Immunoblot confirmed the ability of IMP2-AD and DD to sustain HMGA1 polypeptide and suppress IGFBP2 and Grb14 polypeptide abundance in Imp2−/− MEFs comparably to wildtype IMP2 and more effectively than IMP2-AA and IMP2-DA (Figure 6B, right). Thus the ability of IMP2 to maintain the expression of Hmga1 and suppress the abundance of IGFBP2 and Grb14, which underlies in large part IMP2’s ability to promote MEF proliferation, depends strongly on the status of the IMP2 mTOR phosphorylation site at Ser164.
Figure 6. The ability of IMP2 to stimulate MEF proliferation and reduce IGFBP2 and Grb14 abundance requires an acidic charge at IMP2 residue 164.
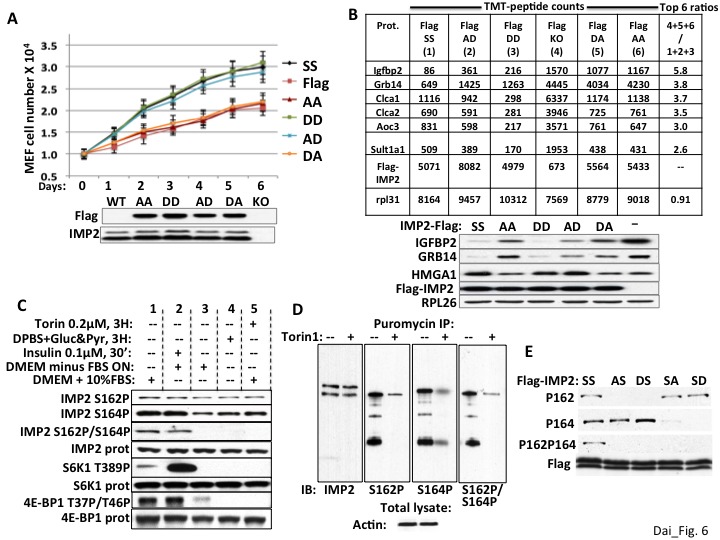
(A) The ability of IMP2 to drive MEF proliferation requires an acidic charge at IMP2 residue 164. Imp2−/− MEFs were engineered to express doxycycline-inducible cDNAs encoding Flag tagged IMP2 wildtype (SS), Ser162Ala/Ser164Ala (AA), Ser162Ala/Ser164Asp (AD), Ser162Asp/Ser164Asp (DD), Ser162Asp/Ser164Ala (DA) or empty flag vector (Flag). Doxycycline was adjusted to achieve Flag-IMP2 variant expression approximating the level of IMP2 found in wildtype Imp2+/+ MEFs, indicated as WT in the immunoblot. The MEFs expressing the six Flag tagged IMP2 variants were plated in replicate and grown in the presence of the adjusted level of doxycycline. Cell number was determined daily. Each point on the curves for SS, AD and DD do not differ from each other but differ from those for Flag, AA and DA starting at day 2, p<0.01. (B) Genome-wide proteomics reveals that the abundance of the IGFBP2 and Grb14 polypeptides in Imp2−/− MEFs expressing Flag-IMP2 with an Ala at residue 164 is similar to that in MEFs lacking IMP2. Whole cell extracts prepared from the six doxycycline-treated MEFs expressing Flag-IMP2 variants or empty Flag vector shown Figure 6A were analyzed by genome wide TMT proteomics. The values for each of the 7964 polypeptides (detected in all six lines) in the (slower growing) Imp2−/− MEFs expressing Flag-IMP2-AA, Flag-IMP2-DA and Flag-vector (KO) were summed and divided by the sum of that polypeptide in MEFs expressing Flag-IMP2 wildtype (SS), Flag-IMP2-AD and Flag-IMP2-DD. This ratio was then sorted from highest to lowest value and the values are shown for the polypeptides showing 6 highest ratios. The abundance of the Flag-IMP2 polypeptide variants and the endogenous rpL31 polypeptide, the latter meant to reflect overall polypeptide abundance, are also shown. The entire data set is in Supplementary file 3. Extracts of the MEFs described in Figure 6A,B were subjected to SDS-PAGE and immunoblotted as indicated. (C) The phosphorylation of IMP2(Ser164) and concurrent dual phosphorylation of IMP2(Ser162/Ser164) are post-translationally regulated by mTOR. 293E cells were grown continuously in DMEM with 10% FCS (columns 1, 4, 5) were treated with torin1, 200 nM (column 5) or switched to DPBS containing glucose, 25 mM and pyruvate,1mM (column 4) 3 hr prior to extraction some cells. Other 293 cells were subjected to overnight serum withdrawal (columns 2,3) followed by addition of insulin 100 nM for 30 min. (column 2) prior to extraction. The extracts were subjected to SDS-PAGE and immunoblot as indicated. (D) Nascent IMP2 polypeptides bound to puromycin are co-translationally phosphorylated at Ser162 and Ser164 by mTOR. Twenty min. after addition of torin1 (200 nM) to rapidly growing RD cells, puromycin was added at 10 ug/ml, and the cells were extracted 10 min. later. The extracts were blotted for IMP2 and puromycin immunoprecipitates were blotted for IMP2 and IMP2(Ser162P) and IMP2(Ser164P). (E) The modification of Ser162 does not affect the phosphorylation of Ser164 and vice versa. 293 cells were transiently transfected with vectors encoding Flag-tagged wildtype IMP2 (SS) or the Flag-IMP2 mutants Ser162Ala (AS), Ser162Asp (DS), Ser164Ala (SA) or Ser164Asp (SD). Flag immunoprecipitates were separated by SDS-PAGE and immunobloted as indicated.
IMP2(Ser164) is phosphorylated by mTOR post-translationally as well as co-translationally
The regulation of IMP2 phosphorylation was examined in 293E cells. Overnight withdrawal of serum, brief incubation in amino acid and serum-free medium or torin1 (Figure 6C, column 1 vs columns 3,4,5 respectively) fully abolish the concomitant dual phosphorylation at IMP2 Ser162 and Ser164; the sensitivity of this dual phosphorylation to amino acid withdrawal and rapamycin (Dai et al., 2011) as well as its rapid stimulation by insulin (Figure 6C, column 2 vs column 3) point strongly to the mediation of mTORC1. Nevertheless, serum withdrawal or torin1 cause little dephosphorylation of IMP2(Ser162P) and only partial dephosphorylation of IMP2(Ser164P), a pattern previously observed with shRNA-induced depletion of mTOR in RD cells (Dai et al., 2011). The modest dephosphorylation of IMP2(Ser164) caused by torin1 or amino acid withdrawal contrasts with the ability of these treatments to cause the near-total dephosphorylation of sites phosphorylated exclusively by mTORC1, such as S6K1(Ser389) or 4E-BP(Thr37/46). The marked resistance of IMP2(Ser162P) to dephosphorylation by torin1 is similar to that seen previously with the co-translational phosphorylation of IMP1(Ser181) (Dai et al., 2013). We therefore examined whether IMP2 is phosphorylated co-translationally by incubating 293 cells with puromycin, which is covalently incorporated into nascent polypeptides because of its resemblance to the 3’ end of aminoacylated tRNA, thereby terminating elongation. Puromycin immunoprecipitates contain IMP2 polypeptides that are phosphorylated at both Ser162 and Ser164 as well as at both sites concomitantly, which can have only occurred co-translationally; pretreatment of the cells with torin1 20 min. prior to addition of puromycin strongly inhibits these phosphorylations of nascent IMP2 (Figure 6D). Thus IMP2 undergoes mTOR dependent cotranslational phosphorylation at both Ser162 and Ser164, in addition to an insulin-, serum- and rapamycin-sensitive post-translational phosphorylation primarily (if not exclusively) at IMP2(Ser164), which results in concomitant dual phosphorylation. How the mature IMP2 polypeptide attains its steady state level of phosphorylation is not entirely understood; it is clear however, that the phosphorylation at either IMP2 site does not affect phosphorylation at the other site; substitution of Ser164 with either Ala or Asp has little effect on the extent of phosphorylation at Ser162 and the same is true of such substitutions at Ser162 on the phosphorylation at Ser164 (Figure 6E).
Discussion
IMP2 is amplified and overexpressed in many cancers and recent reports (Li et al., 2015; Liu et al., 2015; Mu et al., 2015) have pointed to a tumorogenic role in individual cancer types, often with a poor prognosis (Barghash et al., 2015; Bigagli et al., 2016; Davidson et al., 2014; Kessler et al., 2013). Consistent with the view that IMP2 contributes broadly to tumor progression, we show herein that IMP2 drives the proliferation of both MEFs and a wide and unselected cohort of cancer cell lines. IMP2 is best considered a tumor promoter rather than an oncogene; although mice with transgenic overexpression of IMP2 in liver exhibit a higher tumor burden after diethylnitrosamine-induced hepatotoxicity (Kessler et al., 2015), IMP2 has not as yet been shown capable of initiating tumorigenesis. The conclusion that IMP2 is a tumor promoter raises for consideration the biology of IMP2 in normal, noncancerous circumstances and how this might underlie tumor promotion. IMP1 and IMP3 are so-called ‘oncofetal’ genes because their high expression in embryonic development is strongly downregulated before birth, but frequently reappears in cancers. IMP2 diverges from this model in that it continues to be expressed widely in adult life, however IMP2 appears to be preferentially expressed in tissue resident stem cells, such as satellite cells (Boudoukha et al., 2010; Li et al., 2012), neural stem cells (Fujii et al., 2013) and white adipocyte precursors (Dai et al., 2015), where it is critical for their ability to proliferate, differentiate and gain motility. Thus IMP2 gene amplification and/or upregulated expression may be important to the genesis of cancer stem cells and thereby central to IMP2’s tumor promoting capability, as proposed by (Degrauwe et al., 2016a) and demonstrated in glioblastoma stem cells (Degrauwe et al., 2016b).
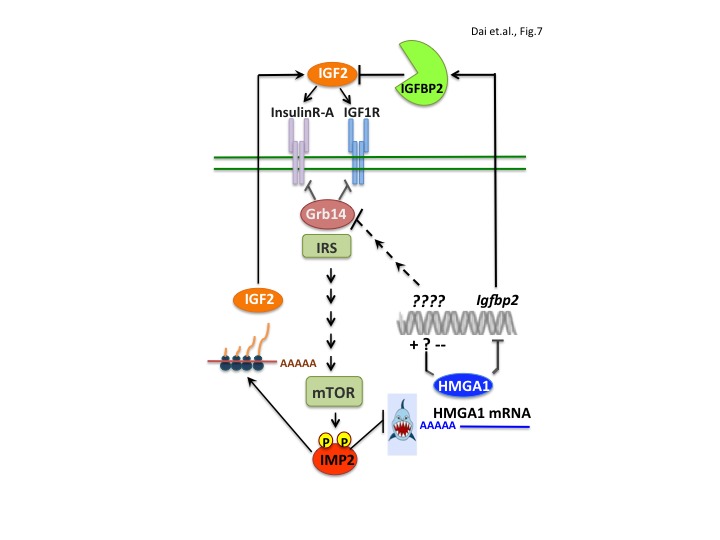
The present work also elucidates a major molecular pathway that underlies IMP2’s tumor promoting activity; IMP2 occupies a central place in a network of gene products that drive proliferation through the IGF1R and INSR-A (Figure 7). The expression of the IMP2 gene is strongly upregulated by the oncofetal HMGA2 oncogene (Brants et al., 2004; Cleynen et al., 2007; Li et al., 2012) and the mRNA encoding the oncogenic transcriptional modifier HMGA1 (Fedele and Fusco, 2010; Ozturk et al., 2014, Sumter et al., 2016), previously detected as an IMP2 client (Janiszewska et al., 2012), is identified here as an important mediator of IMP2’s tumor promoting activity. Restoring HMGA1 abundance largely rescues the proliferative defect engendered by IMP2 deficiency in MEFs and RD cells (Figure 5J,K). IMP2 binds the HMGA1 mRNA 3’UTR, inhibiting its degradation; elimination of IMP2 causes a major decrease in HMGA1 mRNA and protein abundance. Regarding mechanism by which IMP2 protects HMGA1 mRNA, Degrauwe et al. (2016b) demonstrated in Glioblastoma stem cells that IMP2 binding to the HMGA1 mRNA 3’UTR (Figure 5—figure supplement 1) overlaps the binding site of the pro-differentiation tumor suppressor miR, Let-7 and antagonizes Let-7’s ability to promote HMGA1 mRNA degradation.
Figure 7. IMP2 promotes proliferation by increasing IGF2 polypeptide and by stabilizing HMGA1 mRNA, whose polypeptide product suppresses the abundance of IGFBP2 and Grb14, inhibitors of IGF2 action.
HMGA1 expression is high during embryonic development, much lower in adult tissues, but greatly upregulated in a broad range of benign and malignant tumors. The HMGA1 protein binds to the AT-rich regions in the DNA minor groove; although lacking direct transcriptional regulatory activity, it modulates gene expression by changing chromatin structure and promoting the assembly of other TFs. HMGA1’s output is thus cell context dependent; in addition to oncogenic transformation, HMGA1 can also promote expression of a stem cell-like program and/or an epithelial-to-mesenchymal transition. Numerous transcriptional targets relevant to tumorigenesis have been described, including p53 and Rb (Sumter et al., 2016) or the oncogenic miR222 (Wong et al., 2010; Zhang et al., 2011; Panneerselvam et al., 2016); here we identify the ability of HMGA1 to suppress the abundance of two previously unknown targets, IGFBP2 and Grb14, inhibitors of IGF1R and Insulin receptor signaling. HMGA1 binds directly within the Igfbp2 gene promoter to suppress transcription. In contrast, HMGA1 does not bind to the Grb14 gene, but acts through an unidentified transcriptional target to ultimately promote Grb14 polypeptide degradation.
Envisioning an anti-proliferative role for Grb14 is relatively straightforward, although contrary examples exist (Balogh et al., 2012). The role of IGFBP2 in cancer however is controversial (Pickard and McCance, 2015; Russo et al., 2015). IGFBP2 has IGF-dependent and independent, proproliferative actions in cell culture; IGFBP2 contains an RGD domain and can interact with the integrins αVβ3 and α5β1 to affect cell survival or motility (see Russo et al., 2015), and functions coordinately with IGF1 to promote endothelial proliferation through polymerization and inactivation of the receptor tyrosine phosphatase RTPTβ, causing inhibition of PTEN (Shen et al., 2015). Nevertheless, the ability of transgenic overexpression of IGFBP2 to inhibit postnatal growth (Hoeflich et al., 1999) and colonic tumorigenesis (Diehl et al., 2009) attests to its ability to sequester IGF in vivo.
A central role for IGFs in tumorigenesis had been predicted by the finding that mouse embryo fibroblasts devoid of an IGF1R are resistant to transformation by many cellular and viral oncogenes (Sell et al., 1993). Although studies in mouse cancer models were often supportive, interventions directed at inhibition of the IGF1R in man as a single therapy and in combination with chemotherapy have not shown efficacy (Baserga, 2013; Pollak, 2012). The reason(s) for this disappointing outcome are not known, however one likely mechanism is the frequent overexpression of IGF2, due in part to loss of imprinting at the IGF2 locus and/or loss of the IGF2R (Brouwer-Visser and Huang, 2015; Livingstone, 2013). IGF2 has high affinity for the fetal-predominant A form of the insulin receptor (INSR-A), also frequently reexpressed in tumors. The present findings identify IMP2 as a vital component of this network; its stabilization of HMGA1 mRNA is necessary for the oncogene-driven upregulation of HMGA1 transcription to generate HMGA1 polypeptide overabundance. In turn, HMGA1 suppression of Grb14 and IGFBP2 synergize with IMP2 stimulation of IGF2 L3 mRNA translation to promote IGF2 mitogenic signaling though the IGF1R and Insulin Receptor-A (Morrione et al., 1997; Ulanet et al., 2010).
It is worth noting that the human genes encoding major elements of the tumor promoting pathway described herein, that is, HMGA2, IMP2, Grb14, IGF2, have each been found by GWAS to encode SNPs that are associated with excess risk for type 2 diabetes (Flannick and Florez, 2016), a condition accompanied by increased risk for many cancers (Giovannucci et al., 2010; García-Jiménez et al., 2016). Most of these SNPs are noncoding so that the contribution of the encoded polypeptide in conferring risk is unknown. As regards HMGA1, Foti et al. (2005) reported 4 individuals with reduced HMGA1 abundance due to either hemizygous gene loss or point mutation, who exhibited severe insulin resistance accompanied by diminished insulin receptor abundance. This group also described variants in the HMGA1 gene that associate in excess with type 2 diabetes (Chiefari et al., 2011) however this association has been effectively refuted (Marquez et al., 2012; Froguel et al., 2012), so that a role for HMGA1 in human type 2 diabetes remains unsubstantiated. The mouse HMGA1 KO also exhibits reduced insulin receptor abundance but as part of a complex metabolic phenotype with mild glucose intolerance, hypoinsulinemia and enhanced insulin sensitivity (Foti et al., 2005). Thus, whereas the ability of the pathway centered around IMP2 to initiate and/or promote tumor progression is well established, the role of these elements, if any, in the development of type 2 diabetes and the increased susceptibility of that condition to various cancers remains to be elucidated.
Materials and methods
Cell culture
MEFs were isolated from E12.5–13.5 embryos of Imp2+/– intercrosses (Dai et al., 2015). The proliferation, QPCR and polypeptide abundance measurements derived from mouse embryo fibroblasts (Figure 1E,F,G Figure 2D,E, Figure 3A–E, Figure 5A–H,J, Figure 6A) represent data from 3 or more separate experiments; each experiment used MEFs derived from different Imp2+/+ and Imp2−/− embryos. Human RD (RRID:CVCL_1649), Hela (RRID:CVCL_0058), MB-231 (RRID:CVCL_0062), Hep3b (RRID:CVCL_0326) and 293E (RRID:CVCL_6974) cell lines were maintained in DMEM supplemented with 10% FBS. HCC-1359 (RRID:CVCL_5128), NCI-H2029 (RRID:CVCL_1516), SNU-423 (RRID:CVCL_0366), HCC-1419 (RRID:CVCL_1251) cells were cultured in RPMI-1640 supplemented with 10% FBS. The corresponding data derived from human cancer cell lines (Figure 1C,D, Figure 4C,D, Figure 5A,G,K) represented three separate experiments. The error bars on these figures represent ± one S.D.
Reagents and antibodies
DMSO, doxycycline, cycloheximide, rapamycin, insulin, human IGF1, human IGF2, RPL26 and actin antibodies were from Sigma-Aldrich (St. Louis, Missouri, USA); Torin 1 from TOCRIS. Antibodies: P-AKT(Ser473), AKT, pS6K(Thr389), S6K, P-4E-BP1(Thr37/460), 4E-BP1, P-AMPK, AMPK, IGF1R, IRS1, IRS2, P21, Phos-Tyrosine from Cell Signaling Technology; Grb14 and IGFBP2 antibodies from abcam. IMP antibodies were described previously (Dai et al., 2011; Dai et al., 2013). The inducible Lentiviral shRNA for Grb14, IGFBP2, p21 and HMGA1 were from Dharmacon and the stably expressed Flag-IMP2 variants and Flag-HMGA1were generated using pcDNA6/TR and pcDNA5/TO vectors; these reagents were used according to manufacturer’s instructions. The P-site mutants of IMP2 were generated using the QuikChange site-directed mutagenesis kit (Stratagene).
hIMP2 CRISPR
CRISPR-Cas reagents were obtained from Addgene (U6-Chimeric_BB-CBh-hSpCas9). Small guide RNAs (sgRNAs), selected for minimal predicted off-target mutagenesis, were designed using CRISPR Design software (http://crispr.mit.edu); (hIMP2_CRISPR 1, caccgACAAGAACAATTCCTGAGCT; hIMP2_CRISPR 2, aaacAGCTCAGGAATTGTTCTTGTC). Plasmids co-expressing the sgRNA specific to the IMP2 and the Streptococcus pyogenes Cas9 nuclease were transfected into cells by Nucleofector (Lonza) according to manufacturer’s instruction.
Protein analyses
Immunoblot analyses as described (Dai et al., 2015); each immunoblot was repeated at least one time. The levels of IGF2 were determined using Human IGF2 and Mouse IGF2 ELISA kit from Cusabio life science and R&D systems respectively. Cycloheximide was used at a final concentration of 250 μM to inhibit mRNA translation; protein half-life was estimated from immunoblot of extracts prepared before and at various times after cycloheximide addition.
Analysis of human cancer genomic data
The data used to construct the comparison of IGF2BP1/2/3 gene copy number (Figure 1A) and mRNA abundance (Figure 1B) in human cancers was obtained from TCGA published (PMID:18772890,21720365,20579941,20601955,27158780,28112728, 28052061,26061751) and provisional datasets. cBioPortal (http://www.cbioportal.org/index.do) was used to organize and process the TCGA data.
Multiplexed quantitative mass spectrometry analysis
Samples were processed and analyzed through the Thermo Fisher Scientific Center for Multiplexed Proteomics at Harvard Medical School (Weekes et al., 2014). Peptides derived from digestion using LysC and trypsin were labeled with Tandem Mass Tag 8-plex reagents and fractionated. Multiplexed quantitative mass spectrometry data were collected on an Orbitrap Fusion mass spectrometer operating in a MS3 mode using synchronous precursor selection for the MS2 to MS3 fragmentation (McAlister et al., 2014). MS/MS data were searched against a Uniprot mouse database with both the forward and reverse sequences using the SEQUEST algorithm. Further data processing steps included controlling peptide and protein level false discovery rates, assembling proteins from peptides, and protein quantification from peptides.
RNA analysis
RNA was isolated using QIAGEN RNase kit. RNA samples were examined for the integrity by Agilent bioanalyzer prior to further processing. Sequencing was carried out on Illumina HiSeq 2500, resulting in approximately 21 million of 50 bp paired-end reads per sample. STAR aligner (Pubmed ID: 23104886) was used to map sequencing reads to the Mus musculus genome version 10 (mm 10) reference genomes. Read counts for individual transcripts were produced with HTSeq-count (Pubmed ID:25260700), followed by the estimation of expression values and detection of differentially expressed transcripts using EdgeR (Pubmed ID:19910308). The RNA sequence data have been deposited in NCBI’s Gene Expression Omnibus and are accessible through GEO series accession number GSE101311.
mRNAs half-lives determination
Cells were treated with 1 μM Actinomycin D (Sigma) for 12 hr to block transcription. After the indicated times, the total RNAs were extracted, followed by DNase digestion for eliminating DNA contamination and cDNA syntheses. The concentration of mRNAs were quantified by Real-Time RT-PCR using the SYBR Green. The primers for the real-time PCRs were as follow: murine Grb14 sense (actatgtggacgacaacagc), antisense (cataattctttctaagatacag); murine Igfbp2 sense (ccagcaggagttggaccaggt), antisense (cttaaggttgtaccggccatgc); murine P21sense (cgagaacggtggaactttgac), antisense (cagggctcaggtagaccttg).
Chromatin immunoprecipitation (ChIP)
Protein was cross-linked to DNA by treatment of PBS washed cells with formaldehyde. Cells were pelleted and resuspended in cell lysis buffer containing a protease inhibitor cocktail (Roche). After 10 min on ice, the nuclei were collected and chromatin was sheared by sonication. ChIP was performed using the Simple ChIP Enzymatic Chromatin IP kit (Cell Signaling Technology) according to the manufacturers’ instructions. The sheared DNA-protein complexes were immune-precipitated using antibodies to HMGA1. A nonimmune IgG was the negative control.
Acknowledgements
ND and JA designed and supervised the studies, JW and LM provided reagents, ND and FJ acquired the data, ND, FJ, RS and JA analyzed the data and contributed to writing and all au reviewed and approved the final draft. We thank J Florez for discussions. Supported by NIH awards DK017776, DK057521, DK040561 and institutional sources.
Funding Statement
The funders had no role in study design, data collection and interpretation, or the decision to submit the work for publication.
Contributor Information
Ning Dai, Email: ning@molbio.mgh.harvard.edu.
Joseph Avruch, Email: avruch@molbio.mgh.harvard.edu.
Jeffrey Settleman, Calico Life Sciences, United States.
Funding Information
This paper was supported by the following grants:
National Institute of Diabetes and Digestive and Kidney Diseases R37 DK17776 to Joseph Avruch.
National Institute of Diabetes and Digestive and Kidney Diseases P30 DK057521 to Joseph Avruch.
National Institute of Diabetes and Digestive and Kidney Diseases P30 DK040561 to Ruslan Sadreyev.
Additional information
Competing interests
No competing interests declared.
Author contributions
Conceptualization, Investigation, Writing—original draft, Writing—review and editing, Designed and supervised the studies, acquired the data, analyzed the data, contributed to writing, and reviewed and approved the final draft.
Data curation, Formal analysis, Investigation, Writing—review and editing, Acquired the data, analyzed the data, contributed to writing, and reviewed and approved the final draft.
Resources, Methodology, Provided reagents, reviewed and approved the final draft.
Resources, Writing—review and editing, Provided reagents and reviewed and approved the final draft.
Supervision, Methodology, Writing—review and editing, Analyzed the data, contributed to writing and reviewed and approved the final draft.
Conceptualization, Supervision, Funding acquisition, Writing—original draft, Writing—review and editing, Designed and supervised the studies, analyzed the data, contributed to writing, and reviewed and approved the final draft.
Additional files
References
- Aiello A, Pandini G, Sarfstein R, Werner H, Manfioletti G, Vigneri R, Belfiore A. HMGA1 protein is a positive regulator of the insulin-like growth factor-I receptor gene. European Journal of Cancer. 2010;46:1919–1926. doi: 10.1016/j.ejca.2010.02.050. [DOI] [PubMed] [Google Scholar]
- Balogh K, Asa SL, Zheng L, Cassol C, Cheng S, Ezzat S. The insulin resistance Grb14 adaptor protein promotes thyroid Cancer ret signaling and progression. Oncogene. 2012;31:4012–4021. doi: 10.1038/onc.2011.569. [DOI] [PMC free article] [PubMed] [Google Scholar]
- Barghash A, Helms V, Kessler SM. Overexpression of IGF2 mRNA-Binding protein 2 (IMP2/p62) as a feature of Basal-like breast Cancer correlates with short survival. Scandinavian Journal of Immunology. 2015;82:142–143. doi: 10.1111/sji.12307. [DOI] [PubMed] [Google Scholar]
- Baserga R. The decline and fall of the IGF-I receptor. Journal of Cellular Physiology. 2013;228:675–679. doi: 10.1002/jcp.24217. [DOI] [PubMed] [Google Scholar]
- Bell JL, Wächter K, Mühleck B, Pazaitis N, Köhn M, Lederer M, Hüttelmaier S. Insulin-like growth factor 2 mRNA-binding proteins (IGF2BPs): post-transcriptional drivers of Cancer progression? Cellular and Molecular Life Sciences. 2013;70:2657–2675. doi: 10.1007/s00018-012-1186-z. [DOI] [PMC free article] [PubMed] [Google Scholar]
- Bigagli E, De Filippo C, Castagnini C, Toti S, Acquadro F, Giudici F, Fazi M, Dolara P, Messerini L, Tonelli F, Luceri C. DNA copy number alterations, gene expression changes and disease-free survival in patients with colorectal Cancer: a 10 year follow-up. Cellular Oncology. 2016;39:545–558. doi: 10.1007/s13402-016-0299-z. [DOI] [PubMed] [Google Scholar]
- Boudoukha S, Cuvellier S, Polesskaya A. Role of the RNA-binding protein IMP-2 in muscle cell motility. Molecular and Cellular Biology. 2010;30:5710–5725. doi: 10.1128/MCB.00665-10. [DOI] [PMC free article] [PubMed] [Google Scholar]
- Brants JR, Ayoubi TA, Chada K, Marchal K, Van de Ven WJ, Petit MM. Differential regulation of the insulin-like growth factor II mRNA-binding protein genes by architectural transcription factor HMGA2. FEBS Letters. 2004;569:277–283. doi: 10.1016/j.febslet.2004.05.075. [DOI] [PubMed] [Google Scholar]
- Brouwer-Visser J, Huang GS. IGF2 signaling and regulation in Cancer. Cytokine & Growth Factor Reviews. 2015;26:371–377. doi: 10.1016/j.cytogfr.2015.01.002. [DOI] [PubMed] [Google Scholar]
- Chiefari E, Tanyolaç S, Paonessa F, Pullinger CR, Capula C, Iiritano S, Mazza T, Forlin M, Fusco A, Durlach V, Durlach A, Malloy MJ, Kane JP, Heiner SW, Filocamo M, Foti DP, Goldfine ID, Brunetti A. Functional variants of the HMGA1 gene and type 2 diabetes mellitus. JAMA. 2011;305:903–912. doi: 10.1001/jama.2011.207. [DOI] [PubMed] [Google Scholar]
- Cleynen I, Brants JR, Peeters K, Deckers R, Debiec-Rychter M, Sciot R, Van de Ven WJ, Petit MM. HMGA2 regulates transcription of the Imp2 gene via an intronic regulatory element in cooperation with nuclear factor-kappaB. Molecular Cancer Research. 2007;5:363–372. doi: 10.1158/1541-7786.MCR-06-0331. [DOI] [PubMed] [Google Scholar]
- Dai N, Christiansen J, Nielsen FC, Avruch J. mTOR complex 2 phosphorylates IMP1 cotranslationally to promote IGF2 production and the proliferation of mouse embryonic fibroblasts. Genes & Development. 2013a;27:301–312. doi: 10.1101/gad.209130.112. [DOI] [PMC free article] [PubMed] [Google Scholar]
- Dai N, Rapley J, Angel M, Yanik MF, Blower MD, Avruch J. mTOR phosphorylates IMP2 to promote IGF2 mRNA translation by internal ribosomal entry. Genes & Development. 2011;25:1159–1172. doi: 10.1101/gad.2042311. [DOI] [PMC free article] [PubMed] [Google Scholar]
- Dai N, Zhao L, Wrighting D, Krämer D, Majithia A, Wang Y, Cracan V, Borges-Rivera D, Mootha VK, Nahrendorf M, Thorburn DR, Minichiello L, Altshuler D, Avruch J. IGF2BP2/IMP2-Deficient mice resist obesity through enhanced translation of Ucp1 mRNA and other mRNAs encoding mitochondrial proteins. Cell Metabolism. 2015;21:609–621. doi: 10.1016/j.cmet.2015.03.006. [DOI] [PMC free article] [PubMed] [Google Scholar]
- Davidson B, Rosenfeld YB, Holth A, Hellesylt E, Tropé CG, Reich R, Yisraeli JK. VICKZ2 protein expression in ovarian serous carcinoma effusions is associated with poor survival. Human Pathology. 2014;45:1520–1528. doi: 10.1016/j.humpath.2014.03.005. [DOI] [PubMed] [Google Scholar]
- Degrauwe N, Schlumpf TB, Janiszewska M, Martin P, Cauderay A, Provero P, Riggi N, Suvà ML, Paro R, Stamenkovic I. The RNA binding protein IMP2 preserves Glioblastoma Stem cells by preventing let-7 target gene silencing. Cell Reports. 2016b;15:1634–1647. doi: 10.1016/j.celrep.2016.04.086. [DOI] [PubMed] [Google Scholar]
- Degrauwe N, Suvà ML, Janiszewska M, Riggi N, Stamenkovic I. IMPs: an RNA-binding protein family that provides a link between stem cell maintenance in normal development and Cancer. Genes & Development. 2016a;30:2459–2474. doi: 10.1101/gad.287540.116. [DOI] [PMC free article] [PubMed] [Google Scholar]
- Desbuquois B, Carré N, Burnol AF. Regulation of insulin and type 1 insulin-like growth factor signaling and action by the Grb10/14 and SH2B1/B2 adaptor proteins. The FEBS Journal. 2013;280:794–816. doi: 10.1111/febs.12080. [DOI] [PubMed] [Google Scholar]
- Diehl D, Hessel E, Oesterle D, Renner-Müller I, Elmlinger M, Langhammer M, Göttlicher M, Wolf E, Lahm H, Hoeflich A. IGFBP-2 overexpression reduces the appearance of dysplastic aberrant crypt foci and inhibits growth of adenomas in chemically induced colorectal carcinogenesis. International Journal of Cancer. 2009;124:2220–2225. doi: 10.1002/ijc.24193. [DOI] [PubMed] [Google Scholar]
- Fedele M, Fusco A. HMGA and cancer. Biochimica Et Biophysica Acta (BBA) - Gene Regulatory Mechanisms. 2010;1799:48–54. doi: 10.1016/j.bbagrm.2009.11.007. [DOI] [PubMed] [Google Scholar]
- Flannick J, Florez JC. Type 2 diabetes: genetic data sharing to advance complex disease research. Nature Reviews Genetics. 2016;17:535–549. doi: 10.1038/nrg.2016.56. [DOI] [PubMed] [Google Scholar]
- Foti D, Chiefari E, Fedele M, Iuliano R, Brunetti L, Paonessa F, Manfioletti G, Barbetti F, Brunetti A, Croce CM, Fusco A, Brunetti A. Lack of the architectural factor HMGA1 causes insulin resistance and diabetes in humans and mice. Nature Medicine. 2005;11:765–773. doi: 10.1038/nm1254. [DOI] [PubMed] [Google Scholar]
- Froguel P, Marquez M, Cauchi S. Response to comment on: Marquez et al. Low-frequency variants in HMGA1 are not associated with type 2 diabetes risk. Diabetes. 2012;61:e15. doi: 10.2337/db12-0800. [DOI] [PMC free article] [PubMed] [Google Scholar]
- Fujii Y, Kishi Y, Gotoh Y. IMP2 regulates differentiation potentials of mouse neocortical neural precursor cells. Genes to Cells. 2013;18:79–89. doi: 10.1111/gtc.12024. [DOI] [PubMed] [Google Scholar]
- García-Jiménez C, Gutiérrez-Salmerón M, Chocarro-Calvo A, García-Martinez JM, Castaño A, De la Vieja A. From obesity to diabetes and Cancer: epidemiological links and role of therapies. British Journal of Cancer. 2016;114:716–722. doi: 10.1038/bjc.2016.37. [DOI] [PMC free article] [PubMed] [Google Scholar]
- Giovannucci E, Harlan DM, Archer MC, Bergenstal RM, Gapstur SM, Habel LA, Pollak M, Regensteiner JG, Yee D. Diabetes and Cancer: a consensus report. Diabetes Care. 2010;33:1674–1685. doi: 10.2337/dc10-0666. [DOI] [PMC free article] [PubMed] [Google Scholar]
- Hansen TV, Hammer NA, Nielsen J, Madsen M, Dalbaeck C, Wewer UM, Christiansen J, Nielsen FC. Dwarfism and impaired gut development in insulin-like growth factor II mRNA-binding protein 1-deficient mice. Molecular and Cellular Biology. 2004;24:4448–4464. doi: 10.1128/MCB.24.10.4448-4464.2004. [DOI] [PMC free article] [PubMed] [Google Scholar]
- Hoeflich A, Wu M, Mohan S, Föll J, Wanke R, Froehlich T, Arnold GJ, Lahm H, Kolb HJ, Wolf E. Overexpression of insulin-like growth factor-binding protein-2 in transgenic mice reduces postnatal body weight gain. Endocrinology. 1999;140:5488–5496. doi: 10.1210/endo.140.12.7169. [DOI] [PubMed] [Google Scholar]
- Huang daW, Sherman BT, Lempicki RA. Systematic and integrative analysis of large gene lists using DAVID bioinformatics resources. Nature Protocols. 2009;4:44–57. doi: 10.1038/nprot.2008.211. [DOI] [PubMed] [Google Scholar]
- Janiszewska M, Suvà ML, Riggi N, Houtkooper RH, Auwerx J, Clément-Schatlo V, Radovanovic I, Rheinbay E, Provero P, Stamenkovic I. Imp2 controls oxidative phosphorylation and is crucial for preserving glioblastoma Cancer stem cells. Genes & Development. 2012;26:1926–1944. doi: 10.1101/gad.188292.112. [DOI] [PMC free article] [PubMed] [Google Scholar]
- Kessler SM, Laggai S, Barghash A, Schultheiss CS, Lederer E, Artl M, Helms V, Haybaeck J, Kiemer AK. IMP2/p62 induces genomic instability and an aggressive hepatocellular carcinoma phenotype. Cell Death and Disease. 2015;6:e1894. doi: 10.1038/cddis.2015.241. [DOI] [PMC free article] [PubMed] [Google Scholar]
- Kessler SM, Pokorny J, Zimmer V, Laggai S, Lammert F, Bohle RM, Kiemer AK. IGF2 mRNA binding protein p62/IMP2-2 in hepatocellular carcinoma: antiapoptotic action is independent of IGF2/PI3K signaling. AJP: Gastrointestinal and Liver Physiology. 2013;304:G328–G336. doi: 10.1152/ajpgi.00005.2012. [DOI] [PubMed] [Google Scholar]
- Lederer M, Bley N, Schleifer C, Hüttelmaier S. The role of the oncofetal IGF2 mRNA-binding protein 3 (IGF2BP3) in Cancer. Seminars in Cancer Biology. 2014;29:3–12. doi: 10.1016/j.semcancer.2014.07.006. [DOI] [PubMed] [Google Scholar]
- Li Y, Francia G, Zhang JY. p62/IMP2 stimulates cell migration and reduces cell adhesion in breast Cancer. Oncotarget. 2015;6:32656–32668. doi: 10.18632/oncotarget.5328. [DOI] [PMC free article] [PubMed] [Google Scholar]
- Li Z, Gilbert JA, Zhang Y, Zhang M, Qiu Q, Ramanujan K, Shavlakadze T, Eash JK, Scaramozza A, Goddeeris MM, Kirsch DG, Campbell KP, Brack AS, Glass DJ. An HMGA2-IGF2BP2 Axis regulates myoblast proliferation and myogenesis. Developmental Cell. 2012;23:1176–1188. doi: 10.1016/j.devcel.2012.10.019. [DOI] [PMC free article] [PubMed] [Google Scholar]
- Liritano S, Chiefari E, Ventura V, Arcidiacono B, Possidente K, Nocera A, Nevolo MT, Fedele M, Greco A, Greco M, Brunetti G, Fusco A, Foti D, Brunetti A. The HMGA1-IGF-I/IGFBP system: a novel pathway for modulating glucose uptake. Molecular Endocrinology. 2012;26:1578–1589. doi: 10.1210/me.2011-1379. [DOI] [PMC free article] [PubMed] [Google Scholar]
- Liu FY, Zhou SJ, Deng YL, Zhang ZY, Zhang EL, Wu ZB, Huang ZY, Chen XP. MiR-216b is involved in pathogenesis and progression of hepatocellular carcinoma through HBx-miR-216b-IGF2BP2 signaling pathway. Cell Death and Disease. 2015;6:e1670. doi: 10.1038/cddis.2015.46. [DOI] [PMC free article] [PubMed] [Google Scholar]
- Livingstone C. IGF2 and cancer. Endocrine Related Cancer. 2013;20:R321–R339. doi: 10.1530/ERC-13-0231. [DOI] [PubMed] [Google Scholar]
- Marquez M, Huyvaert M, Perry JR, Pearson RD, Falchi M, Morris AP, Vivequin S, Lobbens S, Yengo L, Gaget S, Pattou F, Poulain-Godefroy O, Charpentier G, Carlsson LM, Jacobson P, Sjöström L, Lantieri O, Heude B, Walley A, Balkau B, Marre M, Froguel P, Cauchi S, DIAGRAM Consortium Low-frequency variants in HMGA1 are not associated with type 2 diabetes risk. Diabetes. 2012;61:524–530. doi: 10.2337/db11-0728. [DOI] [PMC free article] [PubMed] [Google Scholar]
- McAlister GC, Nusinow DP, Jedrychowski MP, Wühr M, Huttlin EL, Erickson BK, Rad R, Haas W, Gygi SP. MultiNotch MS3 enables accurate, sensitive, and multiplexed detection of differential expression across Cancer cell line proteomes. Analytical Chemistry. 2014;86:7150–7158. doi: 10.1021/ac502040v. [DOI] [PMC free article] [PubMed] [Google Scholar]
- Morrione A, Valentinis B, Xu SQ, Yumet G, Louvi A, Efstratiadis A, Baserga R. Insulin-like growth factor II stimulates cell proliferation through the insulin receptor. PNAS. 1997;94:3777–3782. doi: 10.1073/pnas.94.8.3777. [DOI] [PMC free article] [PubMed] [Google Scholar]
- Mu Q, Wang L, Yu F, Gao H, Lei T, Li P, Liu P, Zheng X, Hu X, Chen Y, Jiang Z, Sayari AJ, Shen J, Huang H. Imp2 regulates GBM progression by activating IGF2/PI3K/Akt pathway. Cancer Biology & Therapy. 2015;16:623–633. doi: 10.1080/15384047.2015.1019185. [DOI] [PMC free article] [PubMed] [Google Scholar]
- Nielsen J, Christiansen J, Lykke-Andersen J, Johnsen AH, Wewer UM, Nielsen FC. A family of insulin-like growth factor II mRNA-binding proteins represses translation in late development. Molecular and Cellular Biology. 1999;19:1262–1270. doi: 10.1128/MCB.19.2.1262. [DOI] [PMC free article] [PubMed] [Google Scholar]
- Ozturk N, Singh I, Mehta A, Braun T, Barreto G. HMGA proteins as modulators of chromatin structure during transcriptional activation. Frontiers in Cell and Developmental Biology. 2014;2:5. doi: 10.3389/fcell.2014.00005. [DOI] [PMC free article] [PubMed] [Google Scholar]
- Panneerselvam J, Srivastava A, Muralidharan R, Wang Q, Zheng W, Zhao L, Chen A, Zhao YD, Munshi A, Ramesh R. IL-24 modulates the high mobility group (HMG) A1/miR222 /AKT signaling in lung Cancer cells. Oncotarget. 2016;7:70247–70263. doi: 10.18632/oncotarget.11838. [DOI] [PMC free article] [PubMed] [Google Scholar]
- Pickard A, McCance DJ. IGF-Binding protein 2 - Oncogene or tumor suppressor? Frontiers in Endocrinology. 2015;6:25. doi: 10.3389/fendo.2015.00025. [DOI] [PMC free article] [PubMed] [Google Scholar]
- Pollak M. The insulin and insulin-like growth factor receptor family in neoplasia: an update. Nature Reviews Cancer. 2012;12:159–169. doi: 10.1038/nrc3215. [DOI] [PubMed] [Google Scholar]
- Russo VC, Azar WJ, Yau SW, Sabin MA, Werther GA. IGFBP-2: the dark horse in metabolism and Cancer. Cytokine & Growth Factor Reviews. 2015;26:329–346. doi: 10.1016/j.cytogfr.2014.12.001. [DOI] [PubMed] [Google Scholar]
- Saxena R, Voight BF, Lyssenko V, Burtt NP, de Bakker PI, Chen H, Roix JJ, Kathiresan S, Hirschhorn JN, Daly MJ, Hughes TE, Groop L, Altshuler D, Almgren P, Florez JC, Meyer J, Ardlie K, Bengtsson Boström K, Isomaa B, Lettre G, Lindblad U, Lyon HN, Melander O, Newton-Cheh C, Nilsson P, Orho-Melander M, Råstam L, Speliotes EK, Taskinen MR, Tuomi T, Guiducci C, Berglund A, Carlson J, Gianniny L, Hackett R, Hall L, Holmkvist J, Laurila E, Sjögren M, Sterner M, Surti A, Svensson M, Svensson M, Tewhey R, Blumenstiel B, Parkin M, Defelice M, Barry R, Brodeur W, Camarata J, Chia N, Fava M, Gibbons J, Handsaker B, Healy C, Nguyen K, Gates C, Sougnez C, Gage D, Nizzari M, Gabriel SB, Chirn GW, Ma Q, Parikh H, Richardson D, Ricke D, Purcell S. Genome-wide association analysis identifies loci for type 2 diabetes and triglyceride levels. Science. 2007;316:1331–1336. doi: 10.1126/science.1142358. [DOI] [PubMed] [Google Scholar]
- Sell C, Rubini M, Rubin R, Liu JP, Efstratiadis A, Baserga R. Simian virus 40 large tumor antigen is unable to transform mouse embryonic fibroblasts lacking type 1 insulin-like growth factor receptor. PNAS. 1993;90:11217–11221. doi: 10.1073/pnas.90.23.11217. [DOI] [PMC free article] [PubMed] [Google Scholar]
- Shen X, Xi G, Wai C, Clemmons DR. The coordinate cellular response to insulin-like growth factor-I (IGF-I) and insulin-like growth factor-binding protein-2 (IGFBP-2) is regulated through vimentin binding to receptor tyrosine phosphatase β (RPTPβ) Journal of Biological Chemistry. 2015;290:11578–11590. doi: 10.1074/jbc.M114.620237. [DOI] [PMC free article] [PubMed] [Google Scholar]
- Subramanian A, Tamayo P, Mootha VK, Mukherjee S, Ebert BL, Gillette MA, Paulovich A, Pomeroy SL, Golub TR, Lander ES, Mesirov JP. Gene set enrichment analysis: a knowledge-based approach for interpreting genome-wide expression profiles. PNAS. 2005;102:15545–15550. doi: 10.1073/pnas.0506580102. [DOI] [PMC free article] [PubMed] [Google Scholar]
- Sumter TF, Xian L, Huso T, Koo M, Chang YT, Almasri TN, Chia L, Inglis C, Reid D, Resar LM. The high mobility Group A1 (HMGA1) Transcriptome in Cancer and development. Current Molecular Medicine. 2016;16:353–393. doi: 10.2174/1566524016666160316152147. [DOI] [PMC free article] [PubMed] [Google Scholar]
- Ulanet DB, Ludwig DL, Kahn CR, Hanahan D. Insulin receptor functionally enhances multistage tumor progression and conveys intrinsic resistance to IGF-1R targeted therapy. PNAS. 2010;107:10791–10798. doi: 10.1073/pnas.0914076107. [DOI] [PMC free article] [PubMed] [Google Scholar]
- Warfel NA, El-Deiry WS. p21WAF1 and tumourigenesis: 20 years after. Current Opinion in Oncology. 2013;25:52–58. doi: 10.1097/CCO.0b013e32835b639e. [DOI] [PubMed] [Google Scholar]
- Weekes MP, Tomasec P, Huttlin EL, Fielding CA, Nusinow D, Stanton RJ, Wang EC, Aicheler R, Murrell I, Wilkinson GW, Lehner PJ, Gygi SP. Quantitative temporal viromics: an approach to investigate host-pathogen interaction. Cell. 2014;157:1460–1472. doi: 10.1016/j.cell.2014.04.028. [DOI] [PMC free article] [PubMed] [Google Scholar]
- Wong QW, Ching AK, Chan AW, Choy KW, To KF, Lai PB, Wong N. MiR-222 overexpression confers cell migratory advantages in hepatocellular carcinoma through enhancing AKT signaling. Clinical Cancer Research. 2010;16:867–875. doi: 10.1158/1078-0432.CCR-09-1840. [DOI] [PubMed] [Google Scholar]
- Yisraeli JK. VICKZ proteins: a multi-talented family of regulatory RNA-binding proteins. Biology of the Cell. 2005;97:87–96. doi: 10.1042/BC20040151. [DOI] [PubMed] [Google Scholar]
- Zhang Y, Ma T, Yang S, Xia M, Xu J, An H, Yang Y, Li S. High-mobility group A1 proteins enhance the expression of the oncogenic miR-222 in lung Cancer cells. Molecular and Cellular Biochemistry. 2011;357:363–371. doi: 10.1007/s11010-011-0907-1. [DOI] [PubMed] [Google Scholar]