

Summary
Eukaryotic promoter regions are frequently transcribed divergently in vivo, but it is unknown whether the resulting antisense RNAs are a mechanistic byproduct of Pol II transcription or biologically meaningful. Here, we use a functional evolutionary approach that involves nascent transcript mapping in S. cerevisiae strains containing foreign yeast DNA. Promoter regions in foreign environments lose the directionality they have in their native species. Strikingly, fortuitous promoter regions arising in foreign DNA produce equal transcription in both directions, indicating that divergent transcription is a mechanistic feature that does not imply a function for these transcripts. Fortuitous promoter regions arising during evolution promote bidirectional transcription, and over time are purged through mutation or retained to enable new functionality. Similarly, human transcription is more bidirectional at newly evolved enhancers and promoter regions. Thus, promoter regions are intrinsically bidirectional and are shaped by evolution to bias transcription towards coding versus non-coding RNAs.
ETOC blurb
Promoters are intrinsically bidirectional and are shaped by evolution to bias transcription of coding transcripts while suppressing non-coding antisense transcription

Introduction
Eukaryotic promoter regions are nucleosome-depleted regions that contain binding sites for transcriptional activator proteins and core promoters that are bound by general transcription factors and RNA polymerase (Pol) II assembled into a preinitiation complex (Burke et al., 1998; Smale, 1997, 2001; Struhl, 1987; Weis and Reinberg, 1992). Activator-binding sites in promoters and enhancers can function bidirectionally, but the preinitiation complex is intrinsically asymmetric and hence promotes transcription in only one direction. Nevertheless, most eukaryotic promoter regions generate divergent transcripts, many of which are antisense non-coding RNAs that are rapidly degraded by the nuclear exosome (Almada et al., 2013; Core and Lis, 2008; Flynn et al., 2011; Kilchert et al., 2016; Neil et al., 2009; Ntini et al., 2013; Rege et al., 2015; Seila et al., 2008; Vera and Dowell, 2016). Although a given coding transcript and the divergent upstream non-coding transcript share the same promoter region, each transcript originates from a different preinitiation complex (Rhee and Pugh, 2012) and thus are initiated by different core promoters. In addition, divergent non-coding transcripts are often observed in enhancers that can be located far upstream or downstream of the promoter region.
Several possible functions have been proposed for divergent transcription, such as maintenance of nucleosome-depleted regions (NDRs) and de novo gene formation (Scruggs et al., 2015; Wu and Sharp, 2013), but none has been demonstrated experimentally. On the other hand, divergent transcription may be the byproduct of an open chromatin region, and thus represent transcriptional noise (de Boer et al., 2014; Seila et al., 2009; Struhl, 2007). At the heart of this debate lies the question of intrinsic directionality. Are promoter regions intrinsically unidirectional and then shaped by evolution to support divergent transcription, or are they intrinsically bidirectional? Consistent with the unidirectional model, divergent transcription is not observed equally across eukaryotes (Core et al., 2012) and sense and antisense divergent transcription rates do not correlate (Churchman and Weissman, 2011). Further, directionality is controlled by a number of regulators (Churchman and Weissman, 2011; Marquardt et al., 2014; Tan-Wong et al., 2012; Whitehouse et al., 2007). On the other hand, pervasive divergent transcription across fungal and mammalian genomes (>80% of promoter regions) supports the idea that promoter regions are intrinsically bidirectional. Functional analyses of native, and hence highly evolved, organisms in vivo cannot distinguish whether bidirectional promoter regions and non-coding transcripts are a mechanistic consequence of transcription or an evolved biological function. In principle, this distinction can be addressed by analyzing transcription of evolutionarily irrelevant DNA.
In this study, we use a functional evolutionary approach to investigate the intrinsic directionality of yeast promoter regions and how promoter region directionality evolves (Hughes et al., 2012). Specifically, we compare Pol II occupancy across native S. cerevisiae, K. lactis, and D. hansenii genomes with S. cerevisiae strains containing large regions of these foreign yeast species. Of particular note, we previously described nucleosome-depleted regions that occur fortuitously in D. hansenii coding regions when they are present in S. cerevisiae (Hughes et al., 2012). These regions, which presumably arise by fortuitous binding of S. cerevisiae activators that recruit nucleosome remodelers, often function as promoters, although transcription was minimally characterized. As D. hansenii coding regions are evolutionarily irrelevant for transcriptional initiation in S. cerevisiae, they represent an ideal case to mechanistically examine the issue of bidirectional transcription in the absence of evolutionary constraints. We then combine this information with evolutionary analysis of yeast species to address how promoter directionality has evolved.
Results
Transcription is biased towards the coding direction
While coding mRNAs are relatively long-lived, the corresponding antisense transcripts are rapidly degraded non-coding RNAs. Consequently, to quantitate promoter directionality, nascent transcription in each direction must be monitored. Using native elongating transcript sequencing (NET-seq) to precisely and quantitatively map engaged Pol II complexes across the S. cerevisiae genome (Churchman and Weissman, 2011), we define a directionality score based on the ratio of sense and antisense reads (Figure 1A,B). Due to the compact yeast genome, we focused our analysis on promoter regions between tandemly-oriented genes in order to avoid analyzing coding transcription in the antisense direction. Consistent with previous reports (Churchman and Weissman, 2011), S. cerevisiae promoter regions exhibit higher sense transcription than divergent antisense transcription on average (Figure 1B and S1A,B) The majority (>70%) of promoter regions are ‘directional’, defined by at least 3x more sense transcription than antisense transcription, including highly directional cases in which no antisense is detected. On the other hand, approximately a quarter of promoter regions are ‘bidirectional’ that we define as sense:antisense ratios between 1/3 and 3 (Figure 1B). Importantly, NET-seq measures of directionality positively correlate with directionality measures using TFIIB ChIP-exo data (Rhee and Pugh, 2012) that correspond to initiation rates and 4tU-seq (Schulz et al., 2013) data that correspond to synthesis rates, indicating that bias in directionality arises largely from biases in initiation, not elongation (Figure S1C). Thus yeast promoter regions are largely directional but exhibit substantial variability.
Figure 1. Promoter region directionality across the Saccharomyces cerevisiae genome.
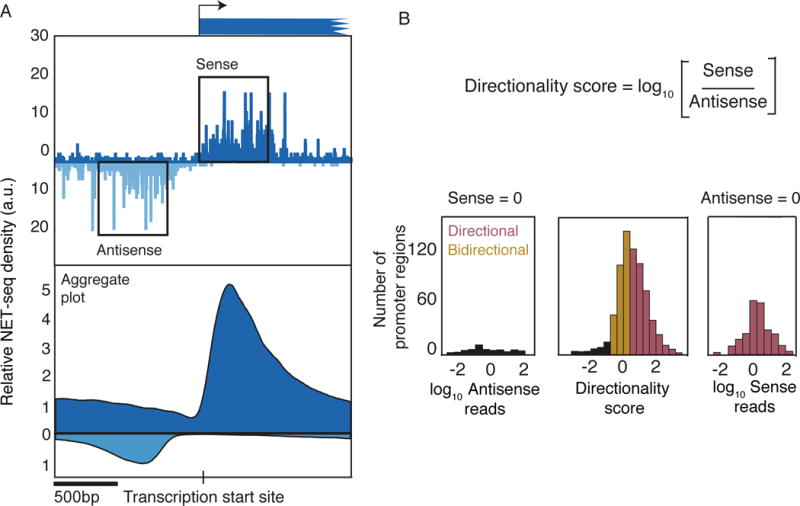
(A) NET-seq analysis of the Saccharomyces cerevisiae genome. Upper panel shows the distribution of active RNAPII for the promoter region of the YBL068W gene. Transcription in the sense and antisense directions are plotted above and below the horizontal axis, respectively. Bottom panel shows the aggregate plot of NET-seq reads averaged over all gene promoter regions by aligning to their TSS. Only promoter regions between tandemly-oriented genes were included to ensure that the antisense transcript is non-coding.
(B) Directionality score is defined as the log10 ratio of sense and antisense reads measured within 500 bp windows situated upstream and downstream of TSS (shown as boxes in (Figure 1a)). Genome-wide distribution of the directionality score is displayed in the middle panel. For promoter regions lacking sense (left panel) or antisense reads (right panel), distributions of the antisense or sense reads are displayed instead. Promoter regions were categorized as directional (yellow) if the sense to antisense ratio was ≥3, and bidirectional (pink) if the ratio was <3.
See also Figure S1
Directionality loss in foreign environment
To address whether promoter regions are intrinsically unidirectional or bidirectional, we analyzed promoter directionality in K. lactis, D. hansenii, and five S. cerevisiae strains each containing a yeast artificial chromosome (YAC) harboring a ~150 kb piece of K. lactis or D. hansenii DNA (Figure 2A, Figure S1D, see Materials and Methods)(Hughes et al., 2012). Due to the lack of transcription start site annotation for these yeast species, we developed FIDDLE (Flexible Integration of Data with Deep LEarning), an integrative deep learning tool that leverages multiple types of available genomics data to predict genome-wide transcription start sites (Eser and Stirling Churchman, 2016). FIDDLE is capable of predicting TSS with nearly the same accuracy as 5′ end–mapping techniques such as TSS-seq (Malabat et al., 2015) (Figure S2A,B).
Figure 2. Promoter region directionality is lost in a foreign environment.
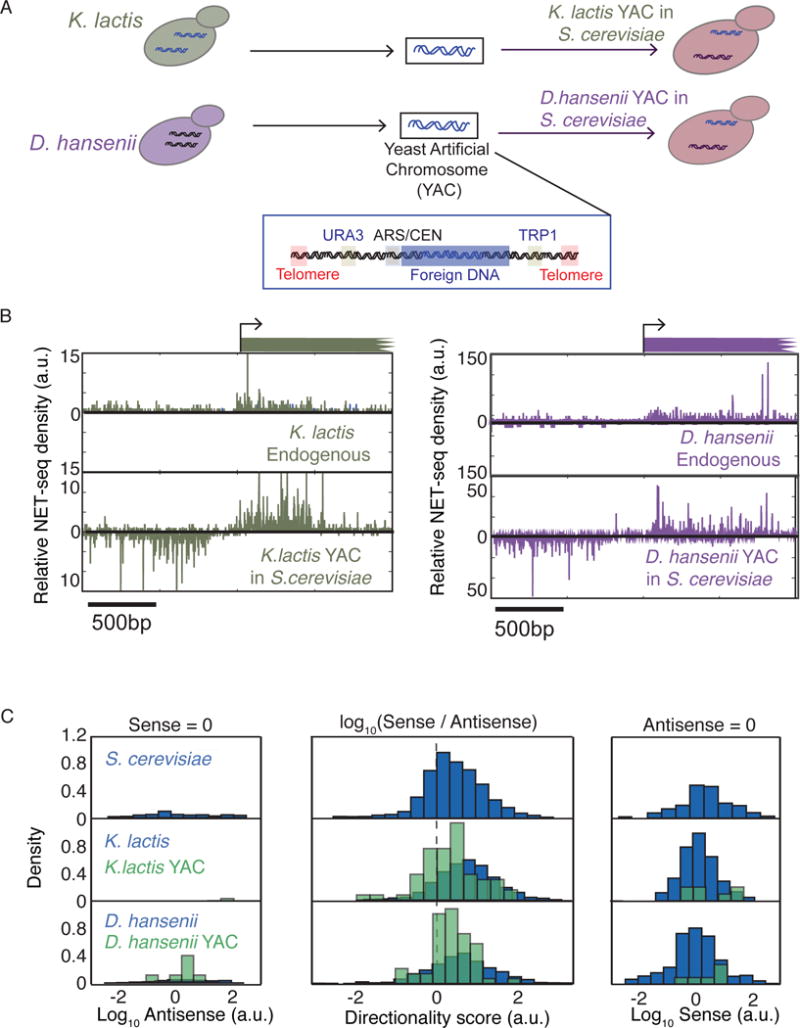
(A) Chromosome pieces extracted from K. lactis and D. hansenii were inserted into yeast artificial chromosomes (YACs) containing centromere and telomere sequences and selective markers on both arms.
(B) NET-seq reads for two promoter regions from K. lactis (left) and D. hansenii (right) are shown in their native environments and in the foreign (S. cerevisiae) environment.
(C) Genome-wide distributions of the directionality score native species and YAC S. cerevisiae strains are displayed in the middle panel. For promoter regions lacking sense (left panel) or antisense reads (right panel), distributions of the antisense or sense reads are displayed instead. The p-values of two sample Kolmogorov-Smirnov test (KS-test) for YAC and native distributions are 3.8 10−7 (K. lactis) and 2.0 10−9 (D. hansenii).
See also Figures S1 and S2
As in S. cerevisiae, promoter regions in both K. lactis and D. hansenii are predominantly directional (Figure 2B,C). Interestingly, a global-scale comparison of native K. lactis and D. hansenii with the S. cerevisiae strains containing the corresponding foreign yeast DNA reveals a reproducible loss in promoter directionality when DNA is in a foreign environment (p-values < 10−4 and 2.3×10⁻³ for K. lactis and D. hansenii, respectively by Kolmogorov-Smirnov (KS) test) (Figure 2B,C and Figure S2C–E). We do not observe an enrichment of any S. cerevisiae transcription factor (TF) motifs at promoter regions that change in directionality (Figure S2F). Thus, the decrease in directional bias suggests that some DNA sequences on the heterologous promoter regions are no longer recognized by S. cerevisiae proteins, and consequently are unable to promote directionality in the foreign environment. In addition, the overall decrease in directionality and the absence of highly directional transcription from the heterologous promoter regions suggests that the ground-state of transcription is bidirectional.
Fortuitous promoter regions generate equal bidirectional transcription
In the experiments described above, promoter directionality is not entirely lost in a foreign environment, due either to residual detection of foreign DNA sequences by S. cerevisiae proteins or an intrinsically directional property of promoter regions. To discriminate between these possibilities, we examined de novo promoter regions that do not exist in the native organism and hence are evolutionarily irrelevant in S. cerevisiae. Using FIDDLE, we identified in an unbiased manner 43 D. hansenii coding sequences that act as fortuitous promoter regions when placed in the foreign environment of the S. cerevisiae nucleus (Figure 3A,B, S3A). Importantly, we observe that fortuitous promoter regions are predominantly bidirectional, certainly more bidirectional than directionality in native D. hansenii (p-value <10−12 by KS test) or D. hansenii YACs (p-value < 10−5 by KS test) (Figure 3C, S3B). These fortuitous promoter regions are depleted for nucleosomes with phased nucleosomes on both sides and are enriched for the general transcription factor, TFIIB (Figure 3B) (Hughes et al., 2012). The majority of de novo nucleosome depleted regions (71%) co-occur with a fortuitous promoter region. Core promoter elements, TATA-like motifs, are not enriched in fortuitous promoter regions (Table S1). While certain core promoter elements produce strong levels of transcription, a wide variety of DNA sequences are capable of inducing initiation (Lubliner et al., 2013, 2015; Smale and Kadonaga, 2003). Thus, we propose that the de novo removal of nucleosomes by activators would expose DNA to the transcription machinery, resulting in modest levels of transcription initiation on both strands. In sum, these observations demonstrate that promoter regions are intrinsically bidirectional and hence that directional promoters are molded by evolution.
Figure 3. Fortuitous promoter regions arise in foreign environments and produce bidirectional transcription.

(A) Example of a fortuitous promoter region emerging within the coding sequence of the D. hansenii gene, DEHA2D15356g, when in a foreign (S. cerevisiae) environment.
(B) Aggregate plot of the average NET-seq reads over the fortuitous promoter regions in native and YAC strains (upper two panels). Transcription in the sense and antisense directions are plotted above and below the horizontal axis, respectively. Aggregate plots are shown for TFIIB ChIP-seq in YAC strains (dark red) and MNase-seq in YAC (blue grey) and native (dark blue) strains over the fortuitous promoters are shown (bottom two panels).
(C) Histogram of directionality scores for native D. hansenii (upper), corresponding YACs (upper), and the fortuitous promoter regions (bottom). Genome-wide distributions of the directionality score are displayed in the middle panels. For promoter regions lacking sense (left panels) or antisense reads (right panels), distributions of the antisense or sense reads are displayed instead. Two sample KS-test p-values are 7.1×10⁻¹² and 2.1×10⁻⁴ for when comparing fortuitous distribution to D. hansenii native and YAC distributions, respectively.
(D) Transcription factors whose binding sites are significantly enriched at fortuitous promoter regions. P-values are determined through comparison of binding site density at fortuitous promoter regions compared to D. hansenii native promoter regions. Data summarized in Table S3.
See also Figures S3, S5 and Table S1.
Newly evolved promoter regions are less directional than more evolved promoter regions
The idea that evolutionary pressure drives promoter regions away from their intrinsic bidirectionality predicts that directionality should increase in accord with evolutionary time. Using sequence alignment from seven Saccharomyces species (Siepel et al., 2005), we calculated genomic evolutionary rate profiling (GERP) scores, which reflect the deficit in nucleotide substitution arising from selective pressure on a particular element that constrains the DNA sequence (Cooper et al., 2005a). This analysis reveals that in S. cerevisiae directional promoter regions contain more constrained elements than bidirectional promoter regions, indicating that they have experienced higher levels of evolutionary selection (p-value of 0.02 by KS test) (Figure 4A). In addition, we coarsely categorized genes by evolutionary time by comparing S. cerevisiae genes whose orthologs are found only in the Saccharomyces sensu stricto genus to all other genes (Carvunis et al., 2012). Promoter regions of sensu stricto only genes are less directional than those genes also found in other yeast species (p-value <10−12 by KS test) (Figure 4B,C). Together, these analyses suggest that the promoter regions evolve to support directional transcription.
Figure 4. Evolutionary analysis of promoter region directionality.

(A) Aggregate plots of genomic evolutionary rate profiling (GERP) scores, determined by multiple alignment of seven Saccharomyces genomes, for directional and bidirectional promoter regions as defined in Figure 1B. The p-value is 0.02 calculated by Kolmogorov-Smirnov test for the distributions of average GERP scores over directional and bidirectional promoters, i.e., 500bp upstream of TSS.
(B) Evolutionary tree displaying the relationship between 24 yeast species. Saccharomyces sensu stricto species are boxed.
(C) Directionality distributions for the promoter regions of the genes whose orthologs are present only in Saccharomyces sensu stricto (orange) and those whose orthologs are also present in other species (blue). The distributions are significantly different according to the KS-test (p-value<3.5 10−12).
To investigate which sequences may have been selected for and may confer directionality, we searched for elements that show differential enrichment between directional and bidirectional promoter regions. Elements that make strong core promoters, such as the TATA box, showed similar enrichments across both classes of promoter regions with little to no effect (Figure S4). Instead, we postulated that the selection for transcription factor (TF) binding motifs might be responsible for altering promoter region directionality. We determined the preferential enrichment of annotated yeast TF motifs across directional and bidirectional promoter regions. We found that twelve TF motifs were statistically more enriched at directional promoter regions and zero motifs were more enriched at bidirectional promoter regions (Table S2). These analyses suggest that directionality is orchestrated by a set of asymmetrical activators (or repressors) that increase sense transcription and/or repress antisense transcription.
Evolutionary resolution of fortuitous promoter regions
Although the fortuitous promoter regions described here arise in the context of an artificial experiment, they are analogous to new promoter regions that inevitably arise during evolution via fortuitous changes in DNA sequences and/or transcription factors. Upon generation of such a novel promoter region, the organism can take either of two possible evolutionary paths (Figure 5A): purge or retain the novel promoter region. To look for such events, we identified S. cerevisiae transcription factor (TF) binding motifs that are more frequently observed at fortuitous vs. native D. hansenii promoter regions (Figure 3D, S5 and Table S3). At the top of the list are Reb1 and Abf1, constitutive regulatory factors that bind to many genes in S. cerevisiae and function through the recruitment of chromatin remodelers that displace nucleosomes (Ganapathi et al., 2011; Hartley and Madhani, 2009; Raisner et al., 2005); these proteins are present in K. lactis, but in D. hansenii are not present (Abf1) or serve a different function (Reb1) (Tsankov et al., 2010; Wapinski et al., 2007). Consistently, fortuitous promoter regions are present in D. hansenii YACs but not present in the K. lactis YACs, suggesting that fortuitous promoter regions arise when DNA is placed into a foreign environment where the set of TFs differ from the endogenous environment. In addition, the frequencies of Reb1 and Abf1 binding sites across coding sequences in 24 yeast species vary as a function of phylogenetic branching point relative to S. cerevisiae. Binding site frequencies are systematically lower in coding regions after the WGD event, when these binding sites became functional (Figure 5B), suggesting that these sites were purged from coding regions to discourage the formation of fortuitous promoter regions.
Figure 5. Evolutionary trajectories of de novo promoter regions.
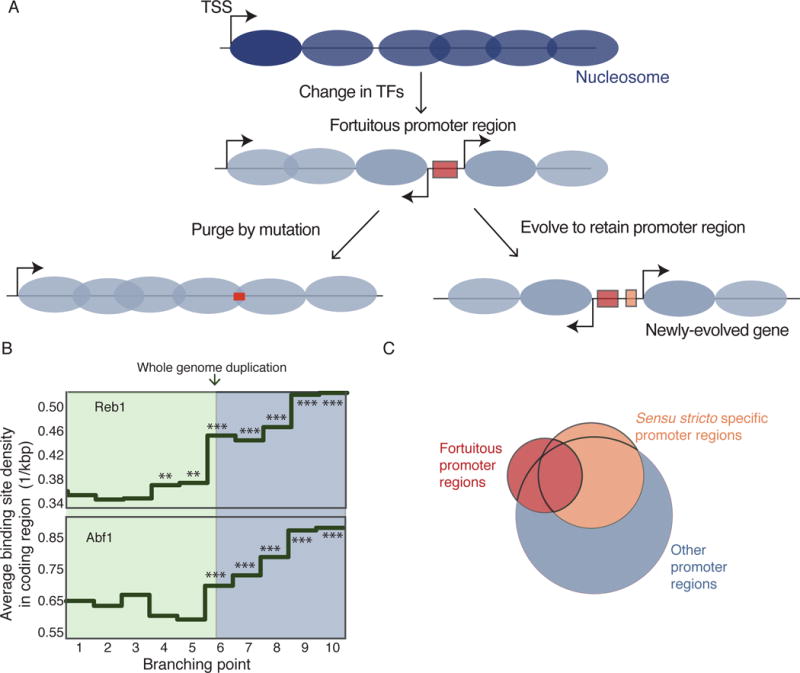
(A) Schematic showing possible paths that a cell can take after an emergence of a fortuitous promoter region. First option is purging the TF binding site found in the coding sequence by mutation (left). Alternatively, the new transcripts produced by the fortuitous promoter regions could be retained (right).
(B) Coding sequence binding site densities are calculated for Reb1 and Abf1 for the genomes of 24 yeast species, averaged across each clade and plotted against the branching point in the evolutionary tree relative to S. cerevisiae (see Figure 4B). Difference between the binding site densities for the genomes of the species at each branch point and densities for the S. cerevisiae genome was determined by a two-sample Poisson intensity test (Gu et al., 2008). **: p-value < 10−4, ***: p-value << 10−10.
(C) Venn diagram shows the overlap between the transcription factors whose binding sites are enriched at fortuitous promoter regions and endogenous promoter regions of sensu stricto specific and other genes in S. cerevisiae.
See also Table S4.
Conversely, a fortuitous promoter region and the new transcripts arising within a coding region might be utilized and evolutionarily selected, particularly after the WGD when the other copy of the original gene would remain. In this scenario, TF binding sites found at fortuitous promoter regions should also be found at the promoters of newly evolved genes. We identified a set of TF binding sites that are specifically enriched at S. cerevisiae promoter regions as compared to coding regions and found that only a subset of these are located at promoters of sensu stricto only genes. In addition, there is high overlap between the TF binding sites enriched in the promoters of newly evolved (sensu stricto only) genes and fortuitous promoter regions that are highly distinct from those enriched at older genes (Figure 5C), suggesting that some newly evolved genes may have started as a fortuitous promoter region. Lastly, when fortuitous promoter regions that arise in coding sequences are retained through evolution, they might split the coding region in half to generate two separate genes. We found 148 possible “gene splitting” events across the S. cerevisiae genome by asking whether two tandem genes show strong homology to a single gene in one of the other 23 sequenced yeast genomes (Table S4). Four tandem S. cerevisiae gene pairs that show high homology to a single D. hansenii coding region, and all of these are separated by either a Reb1 or Abf1 binding site, which is not expected by chance (p-value = 0.047). This suggests that these gene splitting events may have been formed by the arrival of new transcription factors. Thus, the bidirectional fortuitous promoter regions emerging in YAC coding regions represent a naive state that likely reflects how promoters arise during natural evolution.
Human transcription is bidirectional at newly evolved regulatory regions
As widespread divergent transcription also occurs in human cells (Core et al., 2008; Preker et al., 2008; Seila et al., 2008), we asked whether the promoter region ground state is conserved to humans. Analysis of NET-seq data from HeLa S3 cells reveals that transcription from human promoter regions is also strongly biased towards the coding direction (Figure 6A,B) (Mayer et al., 2015). A comparative epigenomic data of the livers of 20 mammalian species identified a small set of newly evolved liver promoter regions as regions that are functionally active (defined by histone modifications) in human liver and none of the other 19 mammalian livers (Villar et al., 2015). Consistent with our analysis in yeast, we find that newly evolved liver human promoter regions are more bidirectional than highly conserved promoter regions (Figure 6C). The modest effect size is due in part to the tissue-specific nature of the Villar et al. classification, because some of the promoter regions classified as newly evolved might actually be more highly conserved promoter regions, and simply active in other tissues.
Figure 6. Human transcription is more bidirectional at newly evolved regulatory regions.
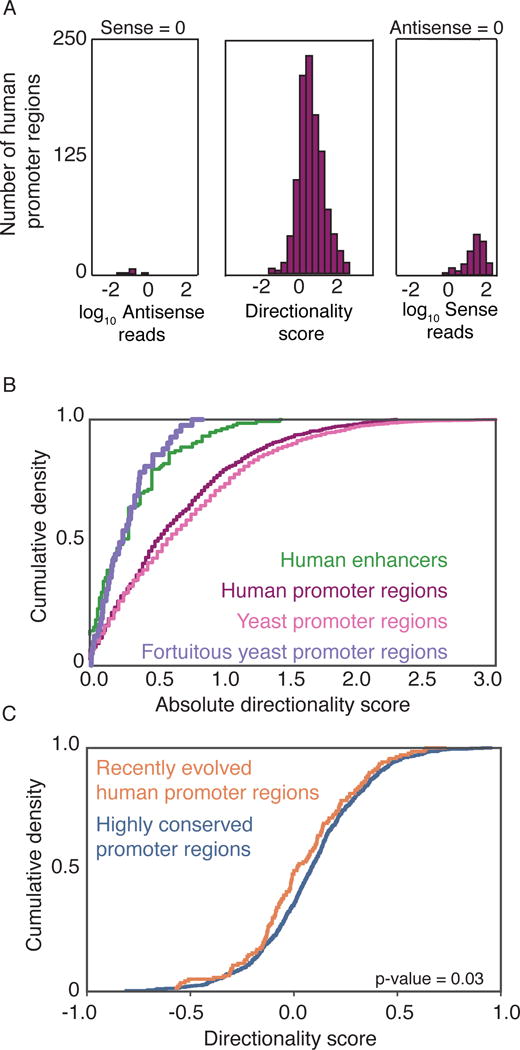
(A) Directionality score histogram of human coding sequence promoter regions is shown. The directionality scores of the human promoter regions are calculated the same way as for yeast promoter regions, using NET-seq data from HeLa S3 cells (Mayer et al., 2015), with one alteration. The length of the upstream and downstream windows around the TSS is 1kb instead of 500bp, due to the ambiguity of human TSS annotation. Non-overlapping human CDS were curated as described in Mayer et al (Mayer et al., 2015).
(B) Absolute values of directionality scores for enhancers (HeLa S3), human coding promoter regions (HeLa S3) and yeast coding promoter regions are plotted as cumulative distribution. Enhancer regions were identified as described in Mayer et al (Mayer et al., 2015). Fortuitous promoter regions and enhancers are not statistically significantly different (p-value=0.59 by KS test).
(C) Directionality score distribution of recently evolved and older promoter regions are shown (p=0.03 by KS test). The list of recently evolved and older promoter regions is obtained from Villar et al. 2015.
In contrast to human promoter regions, most human enhancers are newly evolved, arising from the exaptation of ancestral DNA (Villar et al., 2015). Thus enhancers could arise in a similar manner as the fortuitous promoter regions in yeast, because in large genomes with low gene density, fortuitous changes in sequences will occur more frequently within intergenic regions, and some of these changes will create new regulatory regions. We postulated that the transcription produced by enhancer regions (eRNAs) would be bidirectional, similar to that of fortuitous promoter regions in yeast. Consistent with has been described (Andersson et al., 2014), we find that transcription directionality of human enhancers is bidirectional and indistinguishable to the transcription directionality of fortuitous yeast promoter regions (p-value of 0.59 by KS test) (Figure 6B). Thus across yeast and human genomes, newly evolved nucleosome depleted regions produce bidirectional transcription, indicating that the promoter region ground state is a conserved feature of transcription mechanics.
Discussion
Analysis of transcriptional events that occur in evolutionarily irrelevant DNA make it possible to determine the ground state that reflects basic mechanistic properties of Pol II transcription in vivo. The observation that fortuitous promoter regions (D. hansenii coding sequences in S. cerevisiae cells) give rise to equal transcription in both directions indicates that bidirectionality is the transcriptional ground state. The ground state is mediated primarily by activator proteins, which generate nucleosome-depleted regions via recruitment of nucleosome remodeling complexes and stimulate transcription in both directions. As a consequence, functional core promoters that support transcription to similar extents invariably occur on both sides of the activator-binding sites within the nucleosome-depleted region. This latter conclusion, though perhaps unexpected, is consistent with the observation that the sequence of the core promoter has little effect when transcriptional activation occurs at low to moderate levels (Iyer and Struhl, 1995). Our results also suggest that, in native organisms, many and perhaps nearly all of the non-coding antisense transcripts from bidirectional promoter regions arise as a mechanistic consequence of Pol II transcription and are evolutionarily irrelevant. Some individual antisense transcripts may have a biological function, but the mere existence of such transcripts is expected and does not imply any functional role. Similarly, the bidirectionality of eRNAs is likely a consequence of the transcriptional ground-state, which may question the direct biological significance of enhancer RNAs in mammalian cells. It has been suggested that divergent transcription promotes new gene formation, and there are promoter regions that seem to have been derived from enhancers (Engreitz et al., 2016; Wu and Sharp, 2013). Thus, rather than serving immediate functional roles, a subset of eRNAs and antisense RNAs could be acting as an RNA reservoir that can be shaped by evolutionary pressures to serve physiological functions in descendants (Churchman, 2017; Wu and Sharp, 2013).
The fact that promoter regions are intrinsically bidirectional means that directional transcription in native organisms is an evolved trait. As transcriptional activator proteins are generally bidirectional and nucleosome-depleted regions are non-directional, this evolutionary process could occur via DNA sequences (and interacting proteins) on one side of the activator binding sites that increase and/or decrease transcriptional activity in one direction. For example, two core promoter regions that mediate divergent transcription might evolve to differentially respond to the activator protein(s), and such a mechanism occurs in S. cerevisiae, because strong activator proteins often require a canonical TATA element for high levels of transcription (Iyer and Struhl, 1995; Struhl, 1986). Alternatively, the binding of asymmetric activators (e.g. monomers) or repressors within a promoter region could also confer higher transcription directionality. Our analysis suggests that this is dominant mechanism by which directionality is conferred in yeast as we identified a subset of DNA-binding protein motifs that are preferentially enriched at directional promoter regions (Table S2). Other mechanisms of directional transcription could involve binding sites for repressors that block the connection between the activator and the basic Pol II machinery (Brent and Ptashne, 1984), sequences that affect nucleosome stability, or sequences that affect transcriptional elongation, reinitiation or termination. Whatever mechanisms are involved, our results strongly suggest that directional transcription in native organisms involves co-evolution and selection of DNA sequences and transcription factors for some biological function(s).
STAR Methods text
CONTACT FOR REAGENT AND RESOURCE SHARING
Further information and requests for resources and reagents should be directed to and will be fulfilled by the Lead Contact, L. Stirling Churchman (churchman@genetics.med.harvard.edu).
EXPERIMENTAL MODEL AND SUBJECT DETAILS
Strains
Yeast strains used in this study were listed in KEY RESOURCES TABLE. Rpb3 of strains subjected to NET-seq analysis was epitope-tagged at C-terminus with 3X-Flag tag and expressed from its endogenous locus. In order to accommodate alternative codon usage in D. hansenii (i.e., CUG translated as serine, instead of leucine) (Moura et al., 2007), codons of the epitope tag and selection marker were modified accordingly. To promote higher efficiency of gene targeting through homologous recombination in K. lactis and D. hansenii, extra long homologous regions adjacent to the target site (up to 1000 bp) were used to flank the epitope tag and selection marker. Electroporation based transformation method were also optimized to achieve high-efficiency transformation in K. lactis and D. hansenii. Further details of strain construction are available upon request.
Growth Conditions
K. lactis and D. hansenii were grown in custom medium containing: SC Amino Acid mix (Sunrise Science) (0.2%), Yeast extract (1.5%), Peptone (1%), Dextrose (2%), Adenine (0.01%), Uracil (0.01%), and Tryptophan (0.01%), as previously described (Tsankov et al., 2010). All YAC containing culture was grown in slightly modified medium containing: SC –Tryptophan –Uracil mix (Sunrise Sciences) (0.2%), Yeast extract (1.5%), Peptone (1%), Dextrose (2%), and Adenine (0.01%) (Hughes et al., 2012). All yeast culture was grown at 30°C, except that D. hansenii was cultured at 28°C.
METHOD DETAILS
NET-Seq
NET-seq libraries were constructed and sequenced as previously described with minor modifications (Churchman and Weissman, 2012). Briefly, log phase yeast culture (OD600 = 0.6–0.8) were harvested by filtration and flash frozen using liquid nitrogen. Frozen cells were lysed via pulverization using mixer mill. Nascent RNA was purified from immunoprecipitated RNA polymerase (precipitated using ANTI-FLAG M2 affinity gel and eluted with 3X FLAG peptide), followed by library construction. An improved version of NET-seq DNA linker featured 6 random nucleotides at 5′ terminus was used to further increase ligation efficiency, as well as minimizing ligation bias and library amplification bias (Harlen et al., 2016; Mayer and Churchman, 2016). 3′ end sequencing of NET-seq libraries was performed on Illumina sequencing platform.
RNA-Seq
Total RNA from yeast culture grown to mid-log phase was isolated using standard hot phenol-chloroform extraction protocol. mRNA was purified and fragmented, followed by cDNA synthesis. Library construction was carried out as previously described (Wong et al., 2001).
ChIP-Seq
Sheared chromatin from mid-log phase yeast culture was prepared (Fan et al., 2010). Chromatin immunoprecipitation was conducted using antibody against TFIIB. Barcoded sequencing libraries from ChIP DNA were constructed (Wong et al., 2001).
QUANTIFICATION AND STATISTICAL ANALYSIS
Processing and Alignment of Sequencing Reads
To remove adapter sequences from NET-seq fastq files, we used cutadapt (Martin, 2011). Remaining fastq files were further cleaned by Prinseq (Schmieder and Edwards, 2011). We then aligned the remaining sequences to sacCer3 genome using Bowtie2 and Tophat2 (Kim et al., 2013; Langmead and Salzberg, 2012). Only the positions matching the 5′ end of the sequencing reads corresponding to the 3′ end of the nascent RNA fragments were recorded. Reads that align to the same genomic position and contain identical barcodes are considered PCR duplication events and are removed.
TSS detection for native and YAC species
To detect the transcription start sites of the genes in S. cerevisiae, we trained our deep learning model, FIDDLE (Eser and Stirling Churchman, 2016), by providing inputs from DNA sequence, NET-seq (this study), MNase-seq (Hughes et al., 2012), RNA-seq (this study) and TFIIB ChIP-seq (this study) data and the target from TSS-seq data (Malabat et al., 2015). After successfully training the model, we input the region that spans 1 kb upstream of the coding start site to predict where the TSSs are for native and other YAC species. The output of the model is a probability distribution which peaks around the TSS.
Determining nucleosome depleted regions within the coding sequence of D. hansenii YACs
After smoothing the MNase-seq data with 50bp windows, we detected the peaks that are higher than the 10% of the maximum peak value found within the coding sequence. Then, we selected the regions that are located between the detected peaks and have at least 250bp peak-to-peak distance.
Directionality score calculation
After annotating the TSS for the S. cerevisiae genome, we first removed the overlapping genes, then selected the promoter regions of tandemly oriented genes, where divergent transcription is non-coding. We then calculated the transcriptional activity within ±50bp region around each nucleotide by taking 10% trimmed mean of the NET-seq reads which contain outliers due to the RNAPII pausing. Then the metagene profiles are calculated by aligning the tandem genes to their TSS and recording the average number of reads for all positions 1kb upstream and downstream of TSS.
For each nucleotide position, we calculated the transcriptional activity within ±50bp region around by 10% trimmed mean of the NET-seq reads to avoid the effects of strong pauses. To quantify the coding and divergent non-coding transcriptional activity, we took 500 bp window upstream antisense and downstream sense of the TSS and recorded the maximum window-averaged values for coding and divergent transcription, respectively. We selected the promoter regions who have a signal greater than 0.1 (at least 5 reads are expected within 50bp-averaging window) in any directions. Then the directionality scores of promoter regions are calculated by taking the log10 ratio of these coding and divergent transcriptional activities for those who have signal in both directions. Otherwise, they are called sense transcription and antisense transcription if they lack antisense and sense signal, respectively.
Evolutionary rate profiling
GERP score quantifies the evolutionary rate of a specified position in the genome (Cooper et al., 2005b). We calculated the average GERP score for 500 bp upstream and downstream of the TSS for both high biased and bidirectional tandem promoter regions using sequence alignment from seven Saccharomyces species (Siepel et al., 2005). We performed Kolmogorov-Smirnov test to compare the distributions of average GERP scores over directional and bidirectional promoters, i.e., 500 bp upstream of TSS.
Transcription factor enrichment
We used FIMO scanning to determine the transcription factor binding sites (Grant et al., 2011). The PWM of the binding motifs are obtained from YEASTRACT (Teixeira et al., 2014). To calculate the statistics of differential enrichment, we assumed that for a given nucleotide in the genome, the probability of finding the mid-point of the specific transcription factor binding site is a Bernoulli process with a very low probability, p<<1. Then the probability of finding k TF binding site within large regions (tens of kb) can be approximated by Poisson process with a point mass function:
where λ is the average number of TF binding sites expected under the null hypothesis and k is the number of binding sites that are observed. Therefore, the probability of observing at least k0 number of TF binding sites approximates the p-value which is given by
where Γ is the upper incomplete gamma-function. We used Scipy stats module in Python to calculate empirical cumulative density function.
Evolutionary retention of fortuitous promoter regions
We take the 200 bp upstream and downstream regions of all S. cerevisiae genes that are not overlapping with each other. Then we used the command line tool, Hmmer (Wheeler and Eddy, 2013), with the default options to search for the matches that both upstream and downstream of S. cerevisiae TSS within the same coding sequences of other 22 yeast species, obtained from Broad orthogroup repository (Wapinski et al., 2007). We then selected those that satisfies the correct order, i.e., upstream sequence has to match upstream of the position where downstream sequence matched, minimum 100 bp distance between these matches and the maximum E-value of 0.1. Our analysis only reveals the lower limit of matches as we do not consider the 5′UTR and have margins around 200 bp from coding sequence start and end sites for the 22 target species.
Evolutionary purging of fortuitous promoter regions
We used FIMO (Grant et al., 2011) to scan the coding sequences of all other yeast species for TF binding sites whose motifs belong to S. cerevisiae and are obtained from YEASTRACT (Teixeira et al., 2014). Then we calculated the number of hits divided by the CDS length for each gene and averaged across the genome for each species. We then aggregated the average TF binding site density at the CDS of yeast species that diverges from the same first order branching point relative to S. cerevisiae. We performed two-sample Poisson intensity test (Gu et al., 2008) by comparing TF binding densities on coding sequences found in species belonging to the specified branching point to S. cerevisiae.
Directionality change boxplots for individual transcription factors
Directionality change for YAC promoters is calculated by subtracting the directionality score in their native environment from the one in S. cerevisiae. Next, the promoters are assigned to transcription factors if FIMO scanning (Grant et al., 2011) results in at least one hit for the transcription factor motifs. Then we plotted the boxplot of directionality changes for each transcription factor, for both K. lactis and D. hansenii YACs.
Motif match score
We take consensus TATA box motifs from (Basehoar et al., 2004) and formed position weight matrix (PWM) and convolved the motif along the promoters.
Discriminative motif match analysis
We calculated motif match score for the transcription factor motifs from the YEASTRACT database (Teixeira et al., 2014). Then we recorded the maximum motif match score for each promoter region. We selected the transcription factors whose maximum motif match score distributions for directional and bidirectional promoter regions are significantly different (KS-test p<0.05).
DATA AND SOFTWARE AVAILABILITY
All data are deposited in Gene Expression Omnibus under accession number GSE87735.
Supplementary Material
FIMO hits with p<10−4 for conservative TATA motifs obtained from Basehoar et al. 2004. Percentage denotes the percent ratio of hits over total number of queried regions.
Mean log-ratio shows the average 10-based logarithm of maximum motif match scores differences between directional and bidirectional promoter regions. P values are obtained by the KS-test over the distributions of maximum motif match scores for both directional and bidirectional promoters.
Reported tables are the FIMO scans (Grant et al., 2011) that run over D. hansenii genome using YEASTRACT motif database (Teixeira et al., 2014). Density of transcription factor binding sites are calculated by dividing number of total hits within the coding sequences by the total length of the coding sequences for D. hansenii and S. cerevisiae.
Output of HMMER analysis is shown (Wheeler and Eddy, 2013). See methods for details. Qgene corresponds to the S. cerevisiae genes whose upstream and downstream regions of TSS are queried to match to a single gene (Tgene) in other species. Tstart and Tend correspond to the position relative to coding sequence start site in the target species for S. cerevisiae queried region (suffices_ups denotes upstream and _dws denotes downstream of TSS)
(A) Boxplots show the distribution of directionality scores for different quartiles of sense transcription.
(B) Scatter plot shows the directionality scores of S. cerevisiae endogenous promoter regions calculated in two different yeast strains, YJ167 and YJ168, containing two different YACs from K. lactis. Pearson correlation scores are displayed.
(C) Contour plots show the density of directionality scores calculated from 4tU-seq (Schulz et al., 2013) and TFIIB ChIP-exo (Rhee and Pugh, 2011) compared to the directionality score from NET-seq. Pearson correlation scores and the corresponding p-values are shown inset.
(D) Scatter plot of total NET-seq reads of every gene for two replicate experiments. Pearson correlation scores are displayed.
(A) Examples of a TSS prediction using FIDDLE showing the model prediction (red) and the experimental data (gray) for TSS location (Eser and Stirling Churchman, 2016). The model is trained by using TSS-seq data from Malabat et al. as supervised data (Malabat et al., 2015). FIDDLE does not require data pre-processing, which is highly common in standard methods such as peak detection, feature selection, dimensionality reduction etc. After training the model with S. cerevisiae TSS-seq data, we then transfer the model to D. hansenii and K. lactis as well as S. cerevisiae YAC containing strains.
(B) FIDDLE performance: Summary statistics of the KL-divergence and the TSS prediction accuracy of models trained using individual datasets (DNA sequence, ChIP-seq etc) or all datasets together (Combined). The predictive value of a biological replicate dataset is shown for comparison as it represents the intrinsic variability of the method (Eser and Stirling Churchman, 2016).
(C) Boxplots show the distribution of sense and antisense transcription which is normalized by the library size and multiplied by one million. Asterisks denote the statistical significance level: *p-value<0.05, ***p-value<0.0005 by KS test (D) Metagene view of aggregated NET-seq reads by aligning genes to their transcription start sites (TSS) for native K. lactis and D. hansenii species (left) and the corresponding YAC containing S. cerevisiae strains (right).
(E) Sense, antisense and directionality scores of YAC promoters are plotted for endogenous (y-axes) and YAC containing S. cerevisiae (x-axes) environments. 10-based logarithmic values are shown on the axes.
(F) Boxplots show the distribution of changes in directionality score for the promoter regions that are enriched for motifs of certain transcription factors for K. lactis (left) and D. hansenii (right) YACs. None of them are significantly different than the overall changes in directionality score.
(A) Example of a fortuitous promoter region emerging within the coding sequence of a D. hansenii gene, DEHA2D15365g. Gray shows the RNA-seq (unstranded) data.
(B) Cumulative density plots show the absolute value of directionality score distributions for S. cerevisiae, D. hansenii, D. hansenii YAC and fortuitous promoters. Distributions of the fortuitous promoters are significantly different than that of YACs (p-value < 10−5 by KS test) and D. hansenii (p-value<10−12 by KS test).
Average motif match scores for directional (red) and bidirectional (yellow) promoters in S. cerevisiae are shown for conservative TATA-box (top), poly-A (middle) and poly-G (bottom) motifs.
Scatter plot shows the binding site density for the transcription factors at promoter regions of D. hansenii and S. cerevisiae, calculated by FIMO scanning using YEASTRACT motifs. Dotted lines denote the 2 fold, equal and one half binding site ratio of D. hansenii over S. cerevisiae. Histograms at the top and the right are of the TF binding site densities for S. cerevisiae and D. hansenii, respectively. Scatter plot data displayed in Table S3.
Highlights.
Promoter region transcription directionality decreases in a foreign environment
Newly evolved promoter regions produce transcription equally in both directions
The ground state of promoter region directionality is bidirectional
DNA sequences and proteins co-evolve to promote directional transcription ETOC blurb
Acknowledgments
We thank Y.Niu, Z. Moqtaderi, A. Mayer and K. Harlen for technical advice; J. Geisberg for sharing TFIIB antisera; C. Patil for advice and editing; S. Eddy, C. Weisman and members of the Churchman and Struhl labs for valuable discussions. This work was supported by US National Institutes of Health grants, R01-HG007173 and R01-GM117333 (to L.S.C.) and R01-GM30186 (to K.S.), and a Burroughs Wellcome Fund Career Award at the Scientific Interface (to L.S.C.).
Footnotes
Publisher's Disclaimer: This is a PDF file of an unedited manuscript that has been accepted for publication. As a service to our customers we are providing this early version of the manuscript. The manuscript will undergo copyediting, typesetting, and review of the resulting proof before it is published in its final citable form. Please note that during the production process errors may be discovered which could affect the content, and all legal disclaimers that apply to the journal pertain.
Author Contributions
Conceptualization, Y.J., U.E., K.S., and L.S.C.; Methodology, Y.J., U.E., K.S., and L.S.C.; Investigation, Y.J. and U.E.; Software, U.E.; Formal Analysis, Y.J., U.E., K.S., and L.S.C.; Writing – Original Draft, U.E. and L.S.C.; Writing – Review & Editing, Y.J., U.E., K.S., and L.S.C.; Funding Acquisition, K.S. and L.S.C.
References
- Almada AE, Wu X, Kriz AJ, Burge CB, Sharp PA. Promoter directionality is controlled by U1 snRNP and polyadenylation signals. Nature. 2013;499:360–363. doi: 10.1038/nature12349. [DOI] [PMC free article] [PubMed] [Google Scholar]
- Andersson R, Gebhard C, Miguel-Escalada I, Hoof I, Bornholdt J, Boyd M, Chen Y, Zhao X, Schmidl C, Suzuki T, et al. An atlas of active enhancers across human cell types and tissues. Nature. 2014;507:455–461. doi: 10.1038/nature12787. [DOI] [PMC free article] [PubMed] [Google Scholar]
- Basehoar AD, Zanton SJ, Pugh BF. Identification and distinct regulation of yeast TATA box-containing genes. Cell. 2004;116:699–709. doi: 10.1016/s0092-8674(04)00205-3. [DOI] [PubMed] [Google Scholar]
- de Boer CG, van Bakel H, Tsui K, Li J, Morris QD, Nislow C, Greenblatt JF, Hughes TR. A unified model for yeast transcript definition. Genome Res. 2014;24:154–166. doi: 10.1101/gr.164327.113. [DOI] [PMC free article] [PubMed] [Google Scholar]
- Brent R, Ptashne M. A bacterial repressor protein or a yeast transcriptional terminator can block upstream activation of a yeast gene. Nature. 1984;312:612–615. doi: 10.1038/312612a0. [DOI] [PubMed] [Google Scholar]
- Burke TW, Willy PJ, Kutach AK, Butler JE, Kadonaga JT. The DPE, a conserved downstream core promoter element that is functionally analogous to the TATA box. Cold Spring Harb Symp Quant Biol. 1998;63:75–82. doi: 10.1101/sqb.1998.63.75. [DOI] [PubMed] [Google Scholar]
- Carvunis AR, Rolland T, Wapinski I, Calderwood MA, Yildirim MA, Simonis N, Charloteaux B, Hidalgo CA, Barbette J, Santhanam B, et al. Proto-genes and de novo gene birth. Nature. 2012;487:370–374. doi: 10.1038/nature11184. [DOI] [PMC free article] [PubMed] [Google Scholar]
- Churchman LS. Not Just Noise: Genomics and Genetics Bring Long Noncoding RNAs into Focus. Mol Cell. 2017;65:1–2. doi: 10.1016/j.molcel.2016.12.017. [DOI] [PubMed] [Google Scholar]
- Churchman LS, Weissman JS. Nascent transcript sequencing visualizes transcription at nucleotide resolution. Nature. 2011;469:368–373. doi: 10.1038/nature09652. [DOI] [PMC free article] [PubMed] [Google Scholar]
- Churchman LS, Weissman JS. Native elongating transcript sequencing (NET-seq) Curr Protoc Mol Biol. 2012 doi: 10.1002/0471142727.mb0414s98. Chapter 4, Unit 4.14.1–17. [DOI] [PubMed] [Google Scholar]
- Cooper GM, Stone EA, Asimenos G, NISC Comparative Sequencing Program. Green ED, Batzoglou S, Sidow A. Distribution and intensity of constraint in mammalian genomic sequence. Genome Res. 2005a;15:901–913. doi: 10.1101/gr.3577405. [DOI] [PMC free article] [PubMed] [Google Scholar]
- Cooper GM, Stone EA, Asimenos G, NISC Comparative Sequencing Program. Green ED, Batzoglou S, Sidow A. Distribution and intensity of constraint in mammalian genomic sequence. Genome Res. 2005b;15:901–913. doi: 10.1101/gr.3577405. [DOI] [PMC free article] [PubMed] [Google Scholar]
- Core LJ, Lis JT. Transcription regulation through promoter-proximal pausing of RNA polymerase II. Science. 2008;319:1791–1792. doi: 10.1126/science.1150843. [DOI] [PMC free article] [PubMed] [Google Scholar]
- Core LJ, Waterfall JJ, Lis JT. Nascent RNA sequencing reveals widespread pausing and divergent initiation at human promoters. Science. 2008;322:1845–1848. doi: 10.1126/science.1162228. [DOI] [PMC free article] [PubMed] [Google Scholar]
- Core LJ, Waterfall JJ, Gilchrist DA, Fargo DC, Kwak H, Adelman K, Lis JT. Defining the status of RNA polymerase at promoters. Cell Rep. 2012;2:1025–1035. doi: 10.1016/j.celrep.2012.08.034. [DOI] [PMC free article] [PubMed] [Google Scholar]
- Engreitz JM, Haines JE, Perez EM, Munson G, Chen J, Kane M, McDonel PE, Guttman M, Lander ES. Local regulation of gene expression by lncRNA promoters, transcription and splicing. Nature. 2016;539:452–455. doi: 10.1038/nature20149. [DOI] [PMC free article] [PubMed] [Google Scholar]
- Eser U, Stirling Churchman L. FIDDLE: An integrative deep learning framework for functional genomic data inference 2016 [Google Scholar]
- Fan X, Moqtaderi Z, Jin Y, Zhang Y, Liu XS, Struhl K. Nucleosome depletion at yeast terminators is not intrinsic and can occur by a transcriptional mechanism linked to 3′-end formation. Proceedings of the National Academy of Sciences. 2010;107:17945–17950. doi: 10.1073/pnas.1012674107. [DOI] [PMC free article] [PubMed] [Google Scholar]
- Flynn RA, Almada AE, Zamudio JR, Sharp PA. Antisense RNA polymerase II divergent transcripts are P-TEFb dependent and substrates for the RNA exosome. Proc Natl Acad Sci U S A. 2011;108:10460–10465. doi: 10.1073/pnas.1106630108. [DOI] [PMC free article] [PubMed] [Google Scholar]
- Ganapathi M, Palumbo MJ, Ansari SA, He Q, Tsui K, Nislow C, Morse RH. Extensive role of the general regulatory factors, Abf1 and Rap1, in determining genome-wide chromatin structure in budding yeast. Nucleic Acids Res. 2011;39:2032–2044. doi: 10.1093/nar/gkq1161. [DOI] [PMC free article] [PubMed] [Google Scholar]
- Grant CE, Bailey TL, Noble WS. FIMO: scanning for occurrences of a given motif. Bioinformatics. 2011;27:1017–1018. doi: 10.1093/bioinformatics/btr064. [DOI] [PMC free article] [PubMed] [Google Scholar]
- Gu K, Ng HKT, Tang ML, Schucany WR. Testing the ratio of two poisson rates. Biom J. 2008;50:283–298. doi: 10.1002/bimj.200710403. [DOI] [PubMed] [Google Scholar]
- Harlen KM, Trotta KL, Smith EE, Mosaheb MM, Fuchs SM, Churchman LS. Comprehensive RNA Polymerase II Interactomes Reveal Distinct and Varied Roles for Each Phospho-CTD Residue. Cell Rep. 2016;15:2147–2158. doi: 10.1016/j.celrep.2016.05.010. [DOI] [PMC free article] [PubMed] [Google Scholar]
- Hartley PD, Madhani HD. Mechanisms that specify promoter nucleosome location and identity. Cell. 2009;137:445–458. doi: 10.1016/j.cell.2009.02.043. [DOI] [PMC free article] [PubMed] [Google Scholar]
- Hughes AL, Jin Y, Rando OJ, Struhl K. A functional evolutionary approach to identify determinants of nucleosome positioning: a unifying model for establishing the genome-wide pattern. Mol Cell. 2012;48:5–15. doi: 10.1016/j.molcel.2012.07.003. [DOI] [PMC free article] [PubMed] [Google Scholar]
- Iyer V, Struhl K. Mechanism of differential utilization of the his3 TR and TC TATA elements. Mol Cell Biol. 1995;15:7059–7066. doi: 10.1128/mcb.15.12.7059. [DOI] [PMC free article] [PubMed] [Google Scholar]
- Kilchert C, Wittmann S, Vasiljeva L. The regulation and functions of the nuclear RNA exosome complex. Nat Rev Mol Cell Biol. 2016;17:227–239. doi: 10.1038/nrm.2015.15. [DOI] [PubMed] [Google Scholar]
- Kim D, Pertea G, Trapnell C, Pimentel H, Kelley R, Salzberg SL. TopHat2: accurate alignment of transcriptomes in the presence of insertions, deletions and gene fusions. Genome Biol. 2013;14:R36. doi: 10.1186/gb-2013-14-4-r36. [DOI] [PMC free article] [PubMed] [Google Scholar]
- Langmead B, Salzberg SL. Fast gapped-read alignment with Bowtie 2. Nat Methods. 2012;9:357–359. doi: 10.1038/nmeth.1923. [DOI] [PMC free article] [PubMed] [Google Scholar]
- Lubliner S, Keren L, Segal E. Sequence features of yeast and human core promoters that are predictive of maximal promoter activity. Nucleic Acids Res. 2013;41:5569–5581. doi: 10.1093/nar/gkt256. [DOI] [PMC free article] [PubMed] [Google Scholar]
- Lubliner S, Regev I, Lotan-Pompan M, Edelheit S, Weinberger A, Segal E. Core promoter sequence in yeast is a major determinant of expression level. Genome Res. 2015;25:1008–1017. doi: 10.1101/gr.188193.114. [DOI] [PMC free article] [PubMed] [Google Scholar]
- Malabat C, Feuerbach F, Ma L, Saveanu C, Jacquier A. Quality control of transcription start site selection by nonsense-mediated-mRNA decay. Elife. 2015;4:e06722. doi: 10.7554/eLife.06722. [DOI] [PMC free article] [PubMed] [Google Scholar]
- Marquardt S, Escalante-Chong R, Pho N, Wang J, Churchman LS, Springer M, Buratowski S. A chromatin-based mechanism for limiting divergent noncoding transcription. Cell. 2014;157:1712–1723. doi: 10.1016/j.cell.2014.04.036. [DOI] [PMC free article] [PubMed] [Google Scholar]
- Martin M. Cutadapt removes adapter sequences from high-throughput sequencing reads. EMBnet journal. 2011;17:10–12. [Google Scholar]
- Mayer A, Churchman LS. Genome-wide profiling of RNA polymerase transcription at nucleotide resolution in human cells with native elongating transcript sequencing. Nat Protoc. 2016;11:813–833. doi: 10.1038/nprot.2016.047. [DOI] [PMC free article] [PubMed] [Google Scholar]
- Mayer A, di Iulio J, Maleri S, Eser U, Vierstra J, Reynolds A, Sandstrom R, Stamatoyannopoulos JA, Churchman LS. Native elongating transcript sequencing reveals human transcriptional activity at nucleotide resolution. Cell. 2015;161:541–554. doi: 10.1016/j.cell.2015.03.010. [DOI] [PMC free article] [PubMed] [Google Scholar]
- Moura GR, Lousado JP, Pinheiro M, Carreto L, Silva RM, Oliveira JL, Santos MAS. Codon-triplet context unveils unique features of the Candida albicans protein coding genome. BMC Genomics. 2007;8:444. doi: 10.1186/1471-2164-8-444. [DOI] [PMC free article] [PubMed] [Google Scholar]
- Neil H, Malabat C, d’Aubenton-Carafa Y, Xu Z, Steinmetz LM, Jacquier A. Widespread bidirectional promoters are the major source of cryptic transcripts in yeast. Nature. 2009;457:1038–1042. doi: 10.1038/nature07747. [DOI] [PubMed] [Google Scholar]
- Ntini E, Järvelin AI, Bornholdt J, Chen Y, Boyd M, Jørgensen M, Andersson R, Hoof I, Schein A, Andersen PR, et al. Polyadenylation site-induced decay of upstream transcripts enforces promoter directionality. Nat Struct Mol Biol. 2013;20:923–928. doi: 10.1038/nsmb.2640. [DOI] [PubMed] [Google Scholar]
- Preker P, Nielsen J, Kammler S, Lykke-Andersen S, Christensen MS, Mapendano CK, Schierup MH, Jensen TH. RNA exosome depletion reveals transcription upstream of active human promoters. Science. 2008;322:1851–1854. doi: 10.1126/science.1164096. [DOI] [PubMed] [Google Scholar]
- Raisner RM, Hartley PD, Meneghini MD, Bao MZ, Liu CL, Schreiber SL, Rando OJ, Madhani HD. Histone variant H2A.Z marks the 5′ ends of both active and inactive genes in euchromatin. Cell. 2005;123:233–248. doi: 10.1016/j.cell.2005.10.002. [DOI] [PMC free article] [PubMed] [Google Scholar]
- Rege M, Subramanian V, Zhu C, Hsieh THS, Weiner A, Friedman N, Clauder-Münster S, Steinmetz LM, Rando OJ, Boyer LA, et al. Chromatin Dynamics and the RNA Exosome Function in Concert to Regulate Transcriptional Homeostasis. Cell Rep. 2015;13:1610–1622. doi: 10.1016/j.celrep.2015.10.030. [DOI] [PMC free article] [PubMed] [Google Scholar]
- Rhee HS, Pugh BF. Comprehensive Genome-wide Protein-DNA Interactions Detected at Single-Nucleotide Resolution. Cell. 2011;147:1408–1419. doi: 10.1016/j.cell.2011.11.013. [DOI] [PMC free article] [PubMed] [Google Scholar]
- Rhee HS, Pugh BF. Genome-wide structure and organization of eukaryotic pre-initiation complexes. Nature. 2012;483:295–301. doi: 10.1038/nature10799. [DOI] [PMC free article] [PubMed] [Google Scholar]
- Schmieder R, Edwards R. Quality control and preprocessing of metagenomic datasets. Bioinformatics. 2011;27:863–864. doi: 10.1093/bioinformatics/btr026. [DOI] [PMC free article] [PubMed] [Google Scholar]
- Schulz D, Schwalb B, Kiesel A, Baejen C, Torkler P, Gagneur J, Soeding J, Cramer P. Transcriptome Surveillance by Selective Termination of Noncoding RNA Synthesis. Cell. 2013;155:1075–1087. doi: 10.1016/j.cell.2013.10.024. [DOI] [PubMed] [Google Scholar]
- Scruggs BS, Gilchrist DA, Nechaev S, Muse GW, Burkholder A, Fargo DC, Adelman K. Bidirectional Transcription Arises from Two Distinct Hubs of Transcription Factor Binding and Active Chromatin. Mol Cell. 2015;58:1101–1112. doi: 10.1016/j.molcel.2015.04.006. [DOI] [PMC free article] [PubMed] [Google Scholar]
- Seila AC, Calabrese JM, Levine SS, Yeo GW, Rahl PB, Flynn RA, Young RA, Sharp PA. Divergent transcription from active promoters. Science. 2008;322:1849–1851. doi: 10.1126/science.1162253. [DOI] [PMC free article] [PubMed] [Google Scholar]
- Seila AC, Core LJ, Lis JT, Sharp PA. Divergent transcription: a new feature of active promoters. Cell Cycle. 2009;8:2557–2564. doi: 10.4161/cc.8.16.9305. [DOI] [PubMed] [Google Scholar]
- Siepel A, Bejerano G, Pedersen JS, Hinrichs AS, Hou M, Rosenbloom K, Clawson H, Spieth J, Hillier LW, Richards S, et al. Evolutionarily conserved elements in vertebrate, insect, worm, and yeast genomes. Genome Res. 2005;15:1034–1050. doi: 10.1101/gr.3715005. [DOI] [PMC free article] [PubMed] [Google Scholar]
- Smale ST. Transcription initiation from TATA-less promoters within eukaryotic protein-coding genes. Biochim Biophys Acta. 1997;1351:73–88. doi: 10.1016/s0167-4781(96)00206-0. [DOI] [PubMed] [Google Scholar]
- Smale ST. Core promoters: active contributors to combinatorial gene regulation. Genes Dev. 2001;15:2503–2508. doi: 10.1101/gad.937701. [DOI] [PubMed] [Google Scholar]
- Smale ST, Kadonaga JT. The RNA polymerase II core promoter. Annu Rev Biochem. 2003;72:449–479. doi: 10.1146/annurev.biochem.72.121801.161520. [DOI] [PubMed] [Google Scholar]
- Struhl K. Constitutive and inducible Saccharomyces cerevisiae promoters: evidence for two distinct molecular mechanisms. Mol Cell Biol. 1986;6:3847–3853. doi: 10.1128/mcb.6.11.3847. [DOI] [PMC free article] [PubMed] [Google Scholar]
- Struhl K. Promoters, activator proteins, and the mechanism of transcriptional initiation in yeast. Cell. 1987;49:295–297. doi: 10.1016/0092-8674(87)90277-7. [DOI] [PubMed] [Google Scholar]
- Struhl K. Transcriptional noise and the fidelity of initiation by RNA polymerase II. Nat Struct Mol Biol. 2007;14:103–105. doi: 10.1038/nsmb0207-103. [DOI] [PubMed] [Google Scholar]
- Tan-Wong SM, Zaugg JB, Camblong J, Xu Z, Zhang DW, Mischo HE, Ansari AZ, Luscombe NM, Steinmetz LM, Proudfoot NJ. Gene loops enhance transcriptional directionality. Science. 2012;338:671–675. doi: 10.1126/science.1224350. [DOI] [PMC free article] [PubMed] [Google Scholar]
- Teixeira MC, Monteiro PT, Guerreiro JF, Gonçalves JP, Mira NP, dos Santos SC, Cabrito TR, Palma M, Costa C, Francisco AP, et al. The YEASTRACT database: an upgraded information system for the analysis of gene and genomic transcription regulation in Saccharomyces cerevisiae. Nucleic Acids Res. 2014;42:D161–D166. doi: 10.1093/nar/gkt1015. [DOI] [PMC free article] [PubMed] [Google Scholar]
- Tsankov AM, Thompson DA, Socha A, Regev A, Rando OJ. The Role of Nucleosome Positioning in the Evolution of Gene Regulation. PLoS Biol. 2010;8:e1000414. doi: 10.1371/journal.pbio.1000414. [DOI] [PMC free article] [PubMed] [Google Scholar]
- Vera JM, Dowell RD. Survey of cryptic unstable transcripts in yeast. BMC Genomics. 2016;17:305. doi: 10.1186/s12864-016-2622-5. [DOI] [PMC free article] [PubMed] [Google Scholar]
- Villar D, Berthelot C, Aldridge S, Rayner TF, Lukk M, Pignatelli M, Park TJ, Deaville R, Erichsen JT, Jasinska AJ, et al. Enhancer evolution across 20 mammalian species. Cell. 2015;160:554–566. doi: 10.1016/j.cell.2015.01.006. [DOI] [PMC free article] [PubMed] [Google Scholar]
- Wapinski I, Pfeffer A, Friedman N, Regev A. Natural history and evolutionary principles of gene duplication in fungi. Nature. 2007;449:54–61. doi: 10.1038/nature06107. [DOI] [PubMed] [Google Scholar]
- Weis L, Reinberg D. Transcription by RNA polymerase II: initiator-directed formation of transcription-competent complexes. FASEB J. 1992;6:3300–3309. doi: 10.1096/fasebj.6.14.1426767. [DOI] [PubMed] [Google Scholar]
- Wheeler TJ, Eddy SR. nhmmer: DNA homology search with profile HMMs. Bioinformatics. 2013;29:2487–2489. doi: 10.1093/bioinformatics/btt403. [DOI] [PMC free article] [PubMed] [Google Scholar]
- Whitehouse I, Rando OJ, Delrow J, Tsukiyama T. Chromatin remodelling at promoters suppresses antisense transcription. Nature. 2007;450:1031–1035. doi: 10.1038/nature06391. [DOI] [PubMed] [Google Scholar]
- Wong KH, Jin Y, Moqtaderi Z. Current Protocols in Molecular Biology. John Wiley & Sons, Inc.; 2001. Multiplex Illumina Sequencing Using DNA Barcoding. [DOI] [PubMed] [Google Scholar]
- Wu X, Sharp PA. Divergent Transcription: A Driving Force for New Gene Origination? Cell. 2013;155:990–996. doi: 10.1016/j.cell.2013.10.048. [DOI] [PMC free article] [PubMed] [Google Scholar]
Associated Data
This section collects any data citations, data availability statements, or supplementary materials included in this article.
Supplementary Materials
FIMO hits with p<10−4 for conservative TATA motifs obtained from Basehoar et al. 2004. Percentage denotes the percent ratio of hits over total number of queried regions.
Mean log-ratio shows the average 10-based logarithm of maximum motif match scores differences between directional and bidirectional promoter regions. P values are obtained by the KS-test over the distributions of maximum motif match scores for both directional and bidirectional promoters.
Reported tables are the FIMO scans (Grant et al., 2011) that run over D. hansenii genome using YEASTRACT motif database (Teixeira et al., 2014). Density of transcription factor binding sites are calculated by dividing number of total hits within the coding sequences by the total length of the coding sequences for D. hansenii and S. cerevisiae.
Output of HMMER analysis is shown (Wheeler and Eddy, 2013). See methods for details. Qgene corresponds to the S. cerevisiae genes whose upstream and downstream regions of TSS are queried to match to a single gene (Tgene) in other species. Tstart and Tend correspond to the position relative to coding sequence start site in the target species for S. cerevisiae queried region (suffices_ups denotes upstream and _dws denotes downstream of TSS)
(A) Boxplots show the distribution of directionality scores for different quartiles of sense transcription.
(B) Scatter plot shows the directionality scores of S. cerevisiae endogenous promoter regions calculated in two different yeast strains, YJ167 and YJ168, containing two different YACs from K. lactis. Pearson correlation scores are displayed.
(C) Contour plots show the density of directionality scores calculated from 4tU-seq (Schulz et al., 2013) and TFIIB ChIP-exo (Rhee and Pugh, 2011) compared to the directionality score from NET-seq. Pearson correlation scores and the corresponding p-values are shown inset.
(D) Scatter plot of total NET-seq reads of every gene for two replicate experiments. Pearson correlation scores are displayed.
(A) Examples of a TSS prediction using FIDDLE showing the model prediction (red) and the experimental data (gray) for TSS location (Eser and Stirling Churchman, 2016). The model is trained by using TSS-seq data from Malabat et al. as supervised data (Malabat et al., 2015). FIDDLE does not require data pre-processing, which is highly common in standard methods such as peak detection, feature selection, dimensionality reduction etc. After training the model with S. cerevisiae TSS-seq data, we then transfer the model to D. hansenii and K. lactis as well as S. cerevisiae YAC containing strains.
(B) FIDDLE performance: Summary statistics of the KL-divergence and the TSS prediction accuracy of models trained using individual datasets (DNA sequence, ChIP-seq etc) or all datasets together (Combined). The predictive value of a biological replicate dataset is shown for comparison as it represents the intrinsic variability of the method (Eser and Stirling Churchman, 2016).
(C) Boxplots show the distribution of sense and antisense transcription which is normalized by the library size and multiplied by one million. Asterisks denote the statistical significance level: *p-value<0.05, ***p-value<0.0005 by KS test (D) Metagene view of aggregated NET-seq reads by aligning genes to their transcription start sites (TSS) for native K. lactis and D. hansenii species (left) and the corresponding YAC containing S. cerevisiae strains (right).
(E) Sense, antisense and directionality scores of YAC promoters are plotted for endogenous (y-axes) and YAC containing S. cerevisiae (x-axes) environments. 10-based logarithmic values are shown on the axes.
(F) Boxplots show the distribution of changes in directionality score for the promoter regions that are enriched for motifs of certain transcription factors for K. lactis (left) and D. hansenii (right) YACs. None of them are significantly different than the overall changes in directionality score.
(A) Example of a fortuitous promoter region emerging within the coding sequence of a D. hansenii gene, DEHA2D15365g. Gray shows the RNA-seq (unstranded) data.
(B) Cumulative density plots show the absolute value of directionality score distributions for S. cerevisiae, D. hansenii, D. hansenii YAC and fortuitous promoters. Distributions of the fortuitous promoters are significantly different than that of YACs (p-value < 10−5 by KS test) and D. hansenii (p-value<10−12 by KS test).
Average motif match scores for directional (red) and bidirectional (yellow) promoters in S. cerevisiae are shown for conservative TATA-box (top), poly-A (middle) and poly-G (bottom) motifs.
Scatter plot shows the binding site density for the transcription factors at promoter regions of D. hansenii and S. cerevisiae, calculated by FIMO scanning using YEASTRACT motifs. Dotted lines denote the 2 fold, equal and one half binding site ratio of D. hansenii over S. cerevisiae. Histograms at the top and the right are of the TF binding site densities for S. cerevisiae and D. hansenii, respectively. Scatter plot data displayed in Table S3.