

Summary
Tumor necrosis factor α (TNFα) has both positive and negative roles in human disease. In certain cancers, TNFα is infused locally to promote tumor regression, but dose-limiting inflammatory effects limit broader utility. In autoimmune disease, anti-TNFα antibodies control inflammation in most patients, but these benefits are offset during chronic treatment. TAK1 acts as a key mediator between survival and cell death in TNFα-mediated signaling. Here, we describe Takinib, a potent and selective TAK1 inhibitor that induces apoptosis following TNFα stimulation in cell models of rheumatoid arthritis and metastatic breast cancer. We demonstrate that Takinib is an inhibitor of autophosphorylated TAK1 that binds within the ATP binding pocket, yet is non-competitive, and inhibits by slowing down the rate-limiting step of TAK1 activation. Overall, Takinib is an attractive starting point for the development of inhibitors that sensitize cells to TNFα-induced cell death, with general implications for cancer and autoimmune disease treatment.
Keywords: Kinase inhibitors, Drug discovery, Enzyme Kinetics, Cancer, Inflammatory Disorders, autoimmune disease
eTOC Blurb
Totzke et al. combine enzymatic and cell biological methods to identify a novel potent and selective TAK1 inhibitor that induces apoptosis in a TNFa-dependent manner in rheumatoid arthritis and breast cancer models and reveals a substrate-like mechanism for autophosphorlyation for TAK1.
Introduction
TNFα is a major contributor to tissue inflammation and the largest drug target in terms of commercial impact with annual U.S. sales of TNFα antibodies upwards of $160 billion (Bradley, 2008; Hopkins & Groom, 2002). In rheumatoid arthritis (RA), ankylosing spondylitis, and inflammatory bowel disease, inhibiting TNFα signaling has been proven to reduce disease burden dramatically (Komaki et al., 2017; Powrie et al., 1994; Spadaro et al., 2013). The role of TNFα in cancer is complex; TNFα induces apoptosis in some types of cancer, but chronic inflammation mediated by TNFα has also been associated with tumor progression in cancers including hepatocellular carcinoma, metastatic breast cancer, and colorectal cancer (Becker et al., 2004; Choo, Sakurai, Koizumi, & Saiki, 2006; Inokuchi et al., 2010; Phong et al., 2010; A. Singh et al., 2012). Due to its tumor necrosis inducing actions, TNFα infusion was once considered a front-line therapy for the treatment of cancer (Kurzrock, Feinberg, Talpaz, Saks, & Gutterman, 1989). However, systemic TNFα administration also carries a significant risk of inducing dramatic inflammatory effects that result in life-threatening shock (Kristensen et al., 1993; Kuei, Tashkin, & Figlin, 1989; Moore et al., 1999; Yan et al., 2001). Today, therapeutic uses of TNFα are restricted to local tumor infusion (Deroose, Grunhagen, de Wilt, Eggermont, & Verhoef, 2015; Verhoef et al., 2007). Isolating the TNFα pro-apoptotic functions from pro-inflammatory functions could have far-reaching applications in inflammatory disorders and cancers.
TAK1/MAP3K7 is a key moderator of survival and cell death in TNFα signaling. It is an evolutionarily conserved member of the mitogen-activating kinase kinase kinase (MAP3K) family and regulates pro survival signaling in several cancer types and inflammatory disorders (Huang, Chiang, Hung, & Hou, 2015; Lin, Niu, Peng, Zhang, & Niu, 2015; Takahashi et al., 2015). Complete genetic knockout of TAK1 leads to embryonic lethality (Sakurai, 2012; Shim et al., 2005). Conditional knockout of TAK1 in immune cells highlights the importance of TAK1 in inflammatory diseases: loss of TAK1 in B and T lymphocytes, dendritic cells or natural killer cells severely affects maturation and function of these cell types. A detailed review of these conditions is provided elsewhere (Sakurai, 2012).
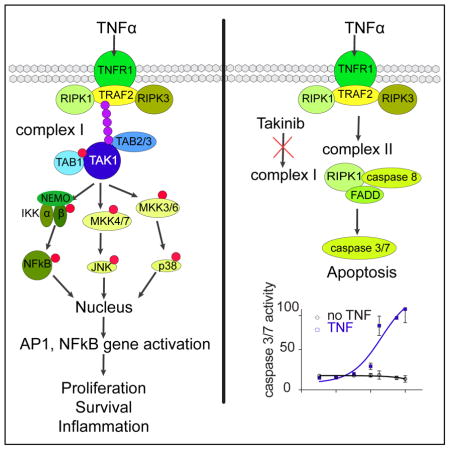
TAK1 activity is enhanced by interactions with TAK1 binding proteins 1,2,3 (TAB1–3) (Roh, Song, & Seki, 2014). Stimulation of cancer cells with TNFα leads to TAK1-dependent activation of NFκ, cJun, and p38 MAPK (Takahashi et al., 2015) (Fig. 1a). The assembly of the TNFα-Receptor 1 (TNFR1) complex 1 leads to recruitment of inhibitor of IκB kinase (IKK) and is facilitated by K-63-linked polyubiquitination of TAK1 and the IKK complex. TAK1 phosphorylates IKKβ, which leads to phosphorylation of Inhibitor of IκB kinase (IκB) and allows translocation of NFκB to the nucleus and transcription of pro survival genes, such as IAP and Bcl-Xl (Vaiopoulos, Athanasoula, & Papavassiliou, 2013). p38 MAPK signaling gets transiently activated after TNFα stimulation (Wajant, Pfizenmaier, & Scheurich, 2000). TAK1 phosphorylates MKK3/4/6, which leads to p38 and c-Jun activation and subsequent translocation to the nucleus to activate transcription of pro survival genes (Catz & Johnson, 2001; Kreuz, Siegmund, Scheurich, & Wajant, 2001; Phong et al., 2010; Zer, Sachs, & Shin, 2007). In both in vitro and in vivo models, downregulation of TAK1 decreased transcription and activity of matrix proteolysis genes, and demonstrated the role of TAK1 in angiogenesis and metastasis (Safina, Ren, Vandette, & Bakin, 2008). If complex 1 cannot be fully assembled (i.e. if TAK1 is not functional), apoptosis or necroptosis are induced, which suggests the potential for selective induction of apoptosis by inhibiting TAK1.
Figure 1.

Identification of Takinib as a potent and selective inhibitor of TAK1. A TNFα pathways indicating TAK1 as a key node for survival signaling B Kinase dendrogram depicting relative potency of top kinase hits. Dots are scaled based on the ratio of IC50 values compared to TAK1. Illustration reproduced courtesy of Cell Signaling Technology, Inc. (www.cellsignal.com). C chemical structure of Takinib D IC50 values as determined by kinase assay at MRC Dundee (n=2, mean ± SEM). E Selectivity profile of Takinib of kinase assay against 140 mammalian kinases performed at MRC Dundee shows log % activity. F Potency of Takinib against TAK1 as determined in kinase assay (shown is a representative experiment of three, n=3, mean ± SEM) G TAK1 inhibitors were directly compared in a kinase assay (n=2, mean ± SEM). Table below shows IC50 values.
The delicate balance between survival and death is often dysregulated in disease and opens novel avenues for intervention. Despite the rising interest in TAK1 as a potential therapeutic target, inhibitors that selectively induce cell death upon TNFα stimulation have not been demonstrated. The most widely used tool to study TAK1 biology is the resorcylic lactone (5Z)-7-oxozeaenol (5ZO) (J. Wu et al., 2013). 5ZO demonstrated increased efficacy compared to the FDA-approved JAK inhibitor tofacitinib in rheumatoid arthritis cell models (Jones et al., 2017). However, this molecule also potently inhibits a panel of at least 50 other kinases and forms a covalent bond with reactive cysteines in the activation loop of its targets, rendering it inadequate for therapeutic purposes due to off-target effects (J. Wu et al., 2013). Despite the known limitations of 5ZO, it is still used to study TAK1 biology in contexts of disease.
Herein, we describe the identification and characterization of the TAK1 inhibitor Takinib (1), which selectively induces apoptosis following TNFα stimulation. The compound is easily synthesized and exhibits tractable structure activity relationships (SAR). In a kinome-wide screen, the molecule was found to exhibit extraordinary selectivity towards TAK1 over all other members. In detailed kinetic studies, we demonstrate that TAK1 undergoes substrate-like intermolecular autophosphorylation and Takinib prolongs this rate-limiting step of TAK1 activation. Additionally, after activation with ATP, Takinib inhibits TAK1 in a competitive manner. Co-crystallization studies showed that Takinib binds to TAK1 in the DFG-in conformation and makes multiple hydrogen bonds and hydrophobic interactions within the ATP-binding pocket explaining both its potency and selectivity towards TAK1 over even closely related kinases. In cell models of RA and metastatic breast cancer, Takinib treatment results in TNFα-dependent induction of apoptosis due to inhibition of TAK1 as a key switch between survival and cell death.
Results
Potency and Selectivity of Takinib for TAK1
Takinib (1) was discovered in a FLECS (Fluorescence-linked enzyme chemoproteomic strategy (Carlson et al., 2013; Howe et al., 2014)) screen of a library consisting of 3379 small molecules containing known kinase-binding motifs with the goal of identifying lead compounds targeting the malarial PfPK9 (Plasmodium falciparum Protein Kinase 9, Fig. S1). With an apparent KD of 200nM, Takinib serves as a chemical starting point for the development of PfPK9 inhibitors for malaria and will be discussed elsewhere. As an unbiased assessment of the selectivity of Takinib within the mammalian kinome, the compound was screened against the MRC Dundee kinase panel, which contains a comprehensive library of kinases representing all gene family members within the human kinome (Fig. 1, Table S1) (Hastie, McLauchlan, & Cohen, 2006). At 10μM, Takinib showed significant inhibitory activity (<10% enzyme activity after exposure) on six serine/threonine kinases including TAK1, IRAK4, IRAK1, GCK, CLK2, and MINK1 (Fig. 1BE). Dose-response experiments of these kinases were performed as validation of the initial kinase inhibition profile. TAK1/MAP3K7 was most potently inhibited with an IC50 value of 9.5nM (Fig. 1D), more than 1.5 log more potent than the second and third ranked targets, IRAK4 (120nM) and IRAK1 (390nM), respectively. TAK1, IRAK4, and IRAK1 all belong to the family of tyrosine-like kinases. Importantly, IRAK4 and IRAK1 are also key mediators in TLR and IL-1 receptor signaling, which involve K-63 polyubiquitination of downstream molecules (Powers et al., 2006; Rhyasen & Starczynowski, 2015)
Takinib is distinguished from NG25 (Tan et al., 2015), a dual type II inhibitor previously reported as targeting both TAK1 and GCK/MAP4K2, since Takinib targets GCK with a 45-fold lower potency compared to TAK1 (GCK IC50 450nM). Takinib is an aminobenzimidazole (Fig. 1C), and this class of inhibitors was previously identified as Src kinase family inhibitors (Francini et al., 2015). However, in initial kinome profiling, the Src family members Src and Yes1 were only weakly inhibited by Takinib. Compared to the most widely studied TAK1 inhibitor 5ZO (J. Wu et al., 2013), Takinib does not inhibit any of the MAP2Ks or MAP3Ks family members i.e. MKK6/MAP2K6, MEKK1/MAP3K1, MKK1/MAP2K1 (Table S1). Additionally, p38 was completely insensitive to Takinib, which had been a concern with the dual TAK1/p38α inhibitor PF-05381941(Kilty & Jones, 2015). As a testament to its selectivity within the kinome, Takinib also showed no efficacy towards the TAK1-closely related MAP3K5/ASK1 (Table S1, Results of Dundee Selectivity profiling, related to Figure 1). We further tested the selectivity of Takinib in a purine-wide selectivity assay based on γ-linked ATP sepharose (Carlson et al., 2013; Haystead, 2006). The purinome comprises a large class of proteins with more than 2000 family members including protein kinases, ATPases, dehydrogenases, and purinergic receptors. This diversity of enzyme classes covered by the purinome enabled us to perform a broader selectivity analysis of Takinib (Fig. S5). Due to the low copy number of TAK1, we expressed TAK1-TAB1-GFP in HEK293T cells and incubated the lysate with γ-linked ATP sepharose. Elutions with Takinib, ATP, and HS-10 (Barrott et al., 2012) were collected in 96-well plates, and fluorescence was measured (Fig. S5 A, B). HS-10 was used to compare the elution profile of a potent and selective Hsp90 inhibitor with the elution profile of Takinib and ATP. Following elutions, GFP fluorescence was only present in the Takinib and ATP samples. Mass spectrometric analysis of silver-stained bands revealed the identity of TAK-TAB1-GFP as the only significant elution for Takinib. Additionally, we compared the elution profiles of 5ZO, NG-25, and Epigallocatechin-3-gallate (E3G). E3G was previously described as an inhibitor of TAK1 in rheumatoid arthritis cell models (A. K. Singh, Umar, Riegsecker, Chourasia, & Ahmed, 2016). While additional bands were present in the 5ZO elution, NG-25, and Takinib eluted TAK1-TAB1-GFP quite selectively. E3G did not elute TAK1, which we attribute to its lack of potency. As a testament to the selectivity of Takinib, proteins from the ATP eluate were also sequenced to demonstrate the extent and diversity of the proteins bound to the ATP sepharose beads (Table S 3,4 Mass spec sequencing analysis for Fig. S5A, Fig. S5D, related to Figure 1).
To further compare Takinib to other well-described TAK1 inhibitors, we determined potency of 5ZO, NG-25, and E3G on TAK1 enzymatic activity using an assay that measures incorporation of 32P from 32P-ATP into a common substrate peptide (Fig. 1G). Takinib showed most potent inhibition of TAK1 activity (IC50 8.2nM), followed by 5ZO (22nM), and NG25 (81nM). We could not determine a dose-response curve for E3G.
Co-crystallization of Takinib and TAK1
To completely understand the interactions between Takinib and TAK1 and to establish a foundation for subsequent structure-guided optimization of this chemotype, we determined the 3-dimensional structure of TAK1 protein bound to Takinib using x-ray crystallography. Crystals diffracted to 2.0 Å resolution and the structure was readily determined using molecular replacement (see Table S2 for data collection and refinement statistics). Additional density corresponding to the shape of Takinib was seen in the kinase active site (Fig. 2A–D). The benzimidazole of Takinib is stabilized in the active site via hydrophobic interactions with Val42, Tyr106, and Gly110. A hydrogen bond is observed between the internal carbonyl of the isophthalamide and backbone nitrogen of Ala107. The terminal acetamide of Takinib also forms a critical hydrogen bond with the side chain of Lys63 and active site water (HOH46). This water also forms additional hydrogen bonds with the side chain oxygen of Glu77 and the amine nitrogen of Asp175 (Fig. 2D). Of note, an analogous water coordinated to analogous catalytic side chains has been observed in many structures of nucleotide and inhibitor bound kinases including IRAK4 (2NRU) and has also been studied with respect to selectivity of bosutinib (Levinson & Boxer, 2014). Of note, Asp175, Phe176, Gly177 of the activation loop are in the DFG-in conformation (Fig. 2B) consistent with a type-I inhibitor.
Figure 2.

Crystal structure of Takinib and TAK1. A Fo-Fc electron density map (green mesh) contoured at 2.5σ observed for Takinib. B Surface and ribbon view of TAK1 and Takinib C View of water mediated hydrogen bonding interactions (yellow dotted lines) of EDHS206 with active site residues of TAK1 is shown. D Structural interactions of Takinib and TAK1 in the catalytic pocket.
Takinib can be drawn in two tautomeric forms, as an endocyclic imine (tautomer A) or as an exocyclic imine (tautomer B). The crystal structure was originally solved using the ligand as tautomer A given that it provides a delocalized electron state. However, to evaluate the possibility that Takinib exists as tautomer B when bound to TAK1, the ligand was subjected to energy minimization calculations [MMFF94s force field in Avogadro (Hanwell et al., 2012)]. Using the conformation of the ligand as modeled in the crystal structure as a starting point, we performed energy minimization using either tautomer. Tautomer B was found to be more stable (strain energy B = −57.9 kJ/mol vs. strain energy A = 10.9 kJ/mol) and moved very little on minimization. Further refinement of the crystal structure using tautomer B gave a 2% drop in the R-factor and allowed an additional hydrogen bond from the relocated hydrogen to the carbonyl of Ala107. For these reasons, we believe that the exocyclic imine is the preferred tautomer both in solution and on binding to TAK1 and all structures are drawn to reflect that.
Structure-Activity studies of Takinib
Takinib can be readily synthesized and proved highly amenable to directed iterative chemistry for SAR studies (see supplemental methods and schemes). Several small-molecule inhibitors that contain an acylaminobenzimidazole moiety have previously been identified, including inhibitors for Hsp70 and IRAK1/4 (Howe et al., 2014; Powers et al., 2006). To determine if this scaffold acts as a promiscuous inhibitor, we screened 46 analogs from our initial screening library containing an acylaminobenzimidazole and the Hsp70 (HS-72) and IRAK-1/4 inhibitor against TAK1 (Fig. 3, S2). At a concentration of 100nM, none of the compounds inhibited enzyme activity significantly, which suggests that the acylaminobenzimidazole moiety is not sufficient for TAK1 inhibition (Fig. S2). Next, we synthesized analogs with modifications to the amide and the alkyl side chain (Fig. 3). Reducing the propyl to an ethyl alkyl chain retains potency against TAK1 (Fig. 3, 4 IC50 840pM). However, replacing the primary amide with N-methyl amide or the methyl ester reduces potency from 0.8nM to 13 nM (Fig. 3, 6) and 61 nM (Fig. 3, 3), respectively. We observed the most dramatic potency loss with a carboxylic acid replacing the amide (Fig. 3, 5). The additional charge introduced by the carboxylate ion could lead to electrostatic repulsion and abrogate TAK1 interaction, which makes 5 an inactive control compound in further studies. These structure-activity studies indicate that major molecular changes on the carbamoyl benzyl group of Takinib are not tolerated. To explore the possibility of making chemical tools, we explored positions for further elaboration. Halogen substitution on the phthalamide ring reduces potency significantly (Fig. 3, 11 IC50 220 nM, 13 IC50 140 nM). Changing the alkyl chain to an amino pentane with the methyl ester showed little impact though on a weaker analog (Fig. 3, 9 IC50 61nM). These findings are consistent with the co-crystal structure, demonstrating that –CONH2 is the key substituent at R2 given that it makes interactions with active site residues and a coordinated water molecule. Bulky substituents such as –COOCH3; -CONHCH3 were not tolerated likely because of steric clashes with Met104, Cys174 and Asp175. Similarly, bulky substituents such as Br were not tolerated at R3 and R4 due to steric constraints arising from Met104 and Glu105.
Figure 3.

Structure-Activity Studies of Takinib analogs. A Analogs of Takinib were screened for enzyme inhibition in kinase assay (n=2, mean ± SEM). B Modifications of Takinib and their IC50 values as determined in kinase assay. C Takinib was compared to commercially available inhibitors HS-72 and IRAK-1/4 inhibitor containing aminobenzimidazole moiety.
Figure 6.

Takinib induces apoptosis in RA FLS and reduces IL-6 secretion. A RA FLS cells in the presence and absence of TNF were treated with titrations of Takinib and 5ZO for 48h. Caspase 3/7 activity was measured using the fluorogenic substrate (DEVD)2-R110. Data are expressed as RFU and normalized to yield % caspase induction (n=2, mean ± SEM). B Caspase induction after treatment with TAKINIB, 219, 220, 5ZO or tofacitinib for 48h in the presence of TNF (n=6, mean ± SEM). C RA FLS were treated with indicated compounds and IL-6 secretion was measured using human IL-6 ELISA (n=5, mean ± SEM). D Proposed mechanism of Takinib induction of apoptosis through inhibition of complex 1 signaling.
Figure 5.
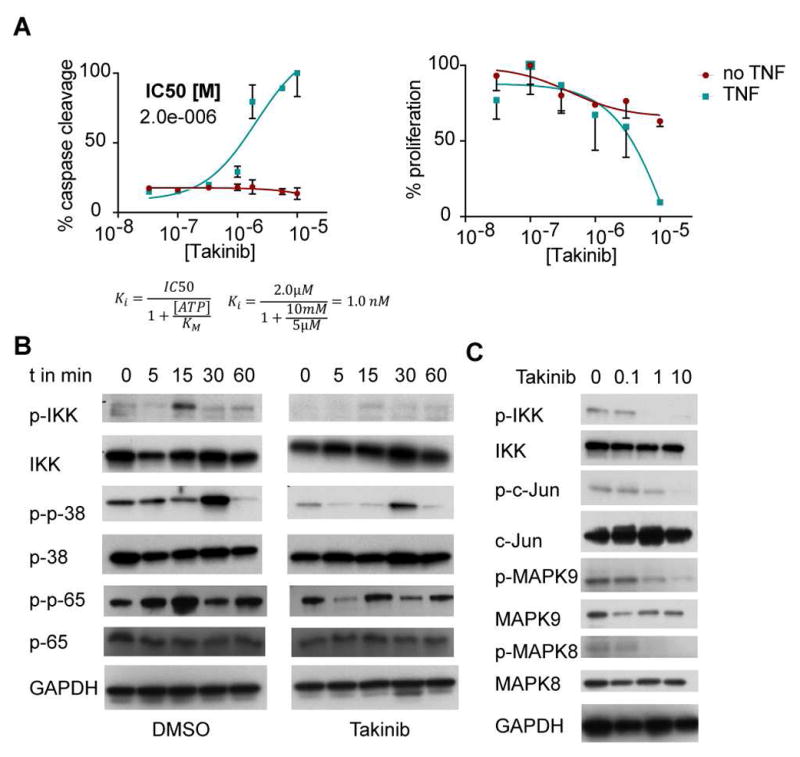
Effects of Takinib treatment on breast cancer cell line MDA-MB-231. A Cells were treated with titrations of Takinib in presence or absence of TNF for 24h left caspase 3/7 activity was determined (n=3, mean ± SEM). right proliferation assay with Hoechst reagent was used to measure DNA content (n=3, mean ± SEM). B Time course analysis of TNF signaling downstream of TAK1. Cells were treated with 10μM Takinib and stimulated with TNF for indicated time. Phosphorylated and total IKK, p-38 and p-65 were detected via Western blot analysis. GAPDH was measured as a loading control. C Dose-dependent effects of TAK1 downstream signaling in TNF-activated cells.
Kinetic effects of Takinib binding to TAK1 slow down the rate-limiting step of TAK1 activation
To investigate the kinetics of Takinib -TAK1 interaction, we determined how this interaction is affected by increasing ATP concentrations. The activity of purified TAK1 protein was assayed in the presence of DMSO (vehicle), 10nM, and 50nM Takinib and increasing concentrations of ATP (Fig. 4A, B). Analysis of the reaction velocity using Michaelis-Menten kinetics revealed that increasing concentrations of Takinib leads to a decrease in Vmax while maintaining KM. When the enzyme was activated with 5μM ATP for 3h, the same Vmax was reached for 0, 10, 50, and 100nM Takinib and KM increased for these concentrations, which implies that Takinib is an ATP- competitive inhibitor if TAK1 is ATP-activated. Importantly, figure 4C shows that Takinib inhibited the function of both activated and un-activated TAK1 with identical potency. Because Takinib was not competitive with ATP for the un-activated TAK1 (Fig. 4A), we studied the kinetics of the TAK1 activation process.
Figure 4.

Kinetic studies of the mode of inhibition of Takinib. A TAK1 activity was measured with increasing concentrations of ATP and Takinib with not-activated kinase (n=5, mean ± SEM). Kinetic data shown in table below. B As in A, kinase was activated with ATP prior to assay (n=4, mean ± SEM). C Activated and not activated kinase activity was measured in kinase assay with titrations of Takinib (n=4, mean ± SEM). D TAK1 activity inhibition was assayed in the presence (auto + substrate phosphorylation) or absence (autophosphorylation) of substrate peptide (n=2, mean ± SEM). E, F Time course of autophosphorylation of TAK1 in the presence of 100nM (E) and 1μM (F) Takinib (n=2, mean ± SEM). G Time course studies of autophosphorylation in the presence of relative enzyme concentrations H Derivative of phosphorylated enzyme (E*) concentration of G (n=2, mean ± SEM). J Derivative of time course study of E,F.
Several reports have identified a two-step process of activation for TAK1, undergoing autophosphorylation occurring at Ser192, Thr178, Thr187, and Thr184 which precedes substrate phosphorylation (Hirata, Takahashi, Morishita, Noguchi, & Matsuzawa, 2017; Kishimoto, Matsumoto, & Ninomiya-Tsuji, 2000). We modeled auto and substrate phosphorylation in the kinase assay by determining TAK1 activity in the absence (auto phosphorylation) and presence (auto+substrate phosphorylation) of substrate peptide and found that both processes are inhibited at low nanomolar concentrations of Takinib (Fig. 4D, auto IC50 12.8nM, auto+substrate IC50 6.7nM). Because previous studies utilizing recombinant protein expression techniques came to opposing conclusions regarding whether TAK1 undergoes intra- or intermolecular autophosphorylation (Kishimoto et al., 2000; Scholz et al., 2010), we performed kinetic studies utilizing Takinib to identify the autophosphorylation mechanism based on enzyme kinetic processes. During intermolecular autophosphorylation, phosphorylation of one enzyme molecule leads to a cascade of phosphorylation events of other enzyme molecules, leading to phosphorylation of theoretically 100% of enzymes becoming phosphorylated over time. Intramolecular autophosphorylation is a stoichiometric process and limited by the amount of ATP present. The kinase assay was performed with purified TAK1 protein in the presence of DMSO, 100nM or 1μM Takinib over a period of three hours (Fig. 4E, F). Comparing the activity of TAK1 in the presence of 0 and 100nM demonstrates that autophosphorylation increases over time and then saturates, whereas it is almost completely inhibited at 1μM Takinib. These kinetic studies demonstrate that TAK1 undergoes an intermolecular autophosphorylation process, which can further be divided into reciprocal and substrate-like autophosphorylation (Dodson, Yeoh, Haq, & Bayliss, 2013). During reciprocal autophosphorylation, two enzyme molecules come together to phosphorylate each other. In substrate-like autophosphorylation, a priming event by one enzyme molecule converts an inactive molecule into an active one. This molecule phosphorylates another, generating a cascade of autophosphorylation events. These two mechanisms differ in their kinetics because of the rate-limiting priming event during substrate-like autophosphorylation, which generates a peak rate for formation of phosphorylated enzyme. To investigate if TAK1 molecules undergo reciprocal or substrate-like autophosphorylation, we determined the rate of TAK1 autophosphorylation at different enzyme concentrations over a period of three hours (Dodson et al., 2013). Reducing the relative enzyme concentration by 50% lead to a reduction of autophosphorylation events by 50% as expected (Fig. 4G). Taking the derivative of phosphorylated enzyme production reveals a peak in the rate of formation of phosphorylated enzyme (Fig. 4H), arguing for a substrate-like mechanism of autophosphorylation. Based on the time course experiments of TAK1 autophosphorylation in figure 4E–F, Takinib slows down the occurrence of the priming event and thereby delays the formation of phosphorylated enzyme. This is demonstrated in figure 4J, where the derivative of autophosphorylated enzyme over time was calculated. DMSO-treated TAK1 activity rate peaks at 20min, while 100nM Takinib shifts the peak to 60min.
Effects of Takinib on cell-based models
TAK1 is a key signaling molecule mediating pro survival versus apoptosis upon TNFα stimulation. Previous reports identified TAK1 as a mediator of metastasis and bone destruction in breast cancer (Safina et al., 2008; Safina, Sotomayor, Limoge, Morrison, & Bakin, 2011; Wang et al., 2016; X. F. Wu et al., 2014). TAK1 is amplified in more than 35% of breast cancers models www.cbioportal.com (Cerami et al., 2012; Gao et al., 2013). MDA-MB-231 cells are derived from pleural effusion of metastatic cells from an invasive ductal carcinoma (Cailleau R Fau - Young, Young R Fau - Olive, Olive M Fau - Reeves, & Reeves, 1974). We hypothesized that inhibition of TAK1 by Takinib leads to initiation of apoptosis in TNFα-stimulated MDA-MB-231 cells. To test this hypothesis, we treated serum-starved MDA-MB-231 cells with titrations of Takinib, then stimulated with TNFα for 12h. As a control, MDA-MB-231 cells were treated with Takinib but not TNFα. Caspase 3/7 activity was determined as previously described (Alwarawrah et al., 2016). TNFα stimulation in the presence of Takinib induced caspase activity in MDA-MB-231cells in a dose-dependent manner, whereas unstimulated cells did not upregulate caspase activity (Fig. 5A, left). We measured cell proliferation using Hoechst reagent in TNFα-stimulated and unstimulated MDA-MB-231 cells and found a dose-dependent reduction of DNA content in the stimulated cells after 24h (Fig. 5A, right). If TNFα is not present, cells remain viable. To account for intracellular ATP concentrations [estimated at 1-10mM (Beis I Fau - Newsholme & Newsholme, 1975)], we added a conversion of IC50 to Ki in order to resolve the apparent discrepancy between low nM activity in kinase assays and low μM activity in cellular assays.
We further investigated whether Takinib could inhibit cellular signaling following acute TNFα stimulation. MDA-MB-231 cells were serum-starved for 3h and pre-treated with 10μM Takinib for 2h. Stimulation of cells with TNFα was performed over a time-course of 60min and the phosphorylation status of IKK, p38, and p65 was determined via Western Blot (Fig. 5B). IKK and p65 are maximally phosphorylated at 15 minutes, which indicate activation of the NFkB pathway, while p38 phosphorylation peaks at 30 minutes. Takinib reduced phosphorylation of significantly but did not influence total protein levels. Dose-dependency studies were performed in Hela cells following 15 minutes of TNFα stimulation. Western Blot analysis demonstrated that Takinib inhibits phosphorylation of IKK, MAPK 8/9, and cJun in a dose-dependent manner (Fig. 5C). Additionally, we investigated cellular TAK1 autophosphorylation following 15min of TNFα stimulation. Thr184 phosphorylation was significantly reduced at low μM concentrations (Fig. S3A).
Given the role of TAK1 in inflammatory diseases such as RA, we investigated whether Takinib induces cell death and reduces cytokine secretion in RA fibroblast-like synoviocytes (RA FLS). RA FLS become hyperplastic during disease and contribute to cytokine-mediated inflammatory joint destruction (Tran et al., 2007). To examine whether RA FLS respond to Takinib in a TNFα dependent manner, RA FLS were treated with titrations of Takinib in the presence of 0, 0.1, 10, and 30ng/ml TNFα for 24 and 48h and caspase 3/7 activity determined (Fig. S3B). After 24h, we did not observe a dose-dependent effect on caspase activity but determined that cells treated with 30ng/ml had a generally higher level of caspase activity compared to the other groups that were treated with lower TNFα concentrations. After 48h, apoptosis was observed in the 10 and 30ng/ml groups in a dose-dependent manner (Fig. S3B). Treatment of RA FLS cells with Takinib or 5ZO in the absence or presence of 10ng/ml TNFα revealed that 5ZO reduces caspase induction at concentrations above 1μM unlike Takinib (Fig. 6A). This suggests that the polypharmacology of 5ZO leads to inhibition of signaling molecules involved in apoptosis at higher concentrations and highlights the selectivity of Takinib for TNFα signaling. Both compounds were compatible with similar levels of background caspase activity in the absence of TNFα. Additionally, we tested whether Takinib analogs 4 and 5 and the JAK inhibitor tofacitinib can induce apoptosis following 24 and 48h of treatment with TNFα (Fig. 6B, S3). None of the tested compounds induced caspase activity significantly following 24h treatment (Fig. S3). The 48h TNFα treatment exhibited increased caspase activity by 33% in the presence of Takinib and 4, while the effect of 5 was marginal (Fig. 6B). Tofacitinib treatment showed no effect at the studied concentrations. To determine the effects of Takinib on cytokine secretion, we performed IL-6 and IL-8 ELISA assays (Fig. 6C). Takinib showed an almost complete inhibition of IL-6 secretion at μM concentrations following 24h of treatment in the presence of TNFα. Similar effects were observed for IL-8 secretion by Takinib, 4 and tofacitinib treatment, which resulted in 40% reduction (Fig. S3). 5ZO was significantly more potent than the other compounds in IL-6 and IL-8 cytokine secretion experiments, which suggests that its strong anti-inflammatory effects stem from inhibition of factors other than TAK1 and JAKs. We suggest that the apoptosis-inducing mechanism of action of Takinib stems from inhibiting the function of complex I, which induces NFkB pro survival signaling. Instead, complex II forms, which leads to induction of effector caspases 3/7 (Fig. 6D).
Discussion
In this study, we characterize the TAK1 inhibitor Takinib, detail its kinetic effects on TAK1 activity, and demonstrate its effects in inflammatory cell models. The complete synthesis of Takinib and active and inactive analogs is reported and shows that the molecule exhibits tractable SAR. Takinib potently and selectively targets TAK1 and induces apoptosis in TNFα-stimulated breast cancer and rheumatoid arthritis in vitro models. Dependence on TNFα raises the possibility that TAK1 inhibitors may only show pro-apoptotic activity in inflammatory tissue or tumor microenvironments that are rich in TNFα, sparing healthy tissues and therefore limiting side effects. In breast cancer, such an environment is associated with metastasis, which suggests Takinib may have utility in progressive malignant disease. The TNFα dependent apoptosis induction for Takinib treated cells suggests it may be worth revisiting the antitumor activities of TNFα in combination with selective TAK1 inhibition.
Could inhibition of TAK1 greatly sensitize tumor cells to TNFα, significantly reducing the dose and completely mitigating the dose limiting proinflammatory side effects of TNFα?
In RA, our studies further validate TAK1 as a therapeutic target. Anti-TNFα antibodies have proven effectiveness in the treatment of RA. However, these therapies are amongst the most expensive on the market and due to tachyphylaxis and/or anti-drug immune responses that develops during chronic treatment, patients often have to stop therapy and resort to alternative and sometimes less effective drugs. Exploring the efficacy of Takinib in animal models of RA is therefore certainly warranted. As a word of caution, however, our comparative inhibitor studies highlight that the development of compounds exhibiting polypharmacology could negate TNFα-dependent caspase induction, as treatment with 5ZO in RA FLS demonstrated. We further suggest that studies investigating TAK1 biology should utilize 5ZO with its limitations in mind, since off-target effects of this compound will likely affect the results profoundly.
The co-crystal structure revealed critical interactions between Takinib and specific TAK1 residues. Hydrogen bonds to catalytic Lys63, hinge-region Ala107, and Asp175 of the DFG-motif place Takinib in the ATP-binding pocket. Hydrophobic interactions with Val42, Thr106, and Gly110 further stabilize Takinib binding. Takinib interferes by sequestering the conserved structured water molecules. Even though the crystal structure clearly shows TAK1 in the DFG-in conformation, initial kinetic studies with TAK1 showed that the maximum reaction rate could not be reached at high ATP concentrations in the presence of the inhibitor, in opposition to the general classification of type 1 inhibitors that are defined as ATP-competitive. This phenomenon was explained after investigating kinetics of TAK1 autophosphorylation. We demonstrate that TAK1 undergoes substrate-like autophosphorylation and that Takinib slows down the rate-limiting step of this process. After TAK1 undergoes the first step of activation, Takinib acts as a competitive inhibitor of TAK1. Inhibition of TAK1 with Takinib in the non-activated state does not allow for full kinase reaction rate because the inhibitor-treated kinase pool is still undergoing kinase activation. This study illustrates the importance of detailed enzymatic characterizations of small-molecule inhibitors are required to understand their actions on proteins. Due to these kinetic effects, Takinib does not compete with ATP and therefore is not ATP-restricted in binding to TAK1 in cells.
The finding that Takinib also shows some affinity for IRAK1, and IRAK4 (albeit it is 14 and 30-fold respectively lower that TAK1), in addition to PfPK9 suggests a conserved fold in Lys-63-linked polyubiquitin regulated kinases. In P. falciparum, PfPK9 down-regulates ubiquitin signaling through phosphorylation of the E2-ubiquitin conjugating enzyme Ubc13 (Philip & Haystead, 2007), whereas TAK1, IRAK1, and IRAK4 are activated through E3-ubiquitin ligases. The sequences of IRAK1, IRAK4, TAK1, and PfPK9 were aligned to investigate if sites critical for Takinib binding to TAK1 are conserved in these kinases. This alignment showed a moderate degree of conservation across kinases (Fig. S4). While the catalytic Lys63 andAsp175 of the DFG motif align, these residues are conserved across all major kinase families. However, Ala107 of the hinge region aligns with Ala187 of PfPK9, suggesting the potential for hydrogen bonding. Critical hydrophobic interactions mediated by Val42, Thr106, and Gly110 are congruent between kinases, except for Val42 which is only present in TAK1. Its absence in PfPK9, IRAK1, and IRAK4 could result in a loss of potency of Takinib for these kinases. Opposing charges in the hydrophobic interaction region could also contribute to the loss of potency [[compare Lys44 (R44) in TAK1 with Glu220/204/115 (E220/204/115)]. Residues preceding the DFG motif are quite different, with TAK1 having a bulkier cysteine compared to small residues like serine, alanine, and glycine present in the other kinases. Our understanding of the interactions of Takinib with TAK1 highlight how this same scaffold may be utilized to derive potent inhibitors selective for PfPK9, IRAK1, and IRAK4.
Significance
We describe the development of Takinib, a potent and selective inhibitor of TAK1. With the recent surge in research published on TAK1 as a target for cancer and inflammatory disorders, Takinib serves as a scaffold to explore TAK1 as a druggable target in TNFα signaling and might open avenues for other cytokine signaling pathways including IL-1, TGFβ, and LPS. Selectively inhibiting TAK1 as a key promoter of survival pathways in TNFα-rich microenvironments leads to an upregulation of programmed cell death and provides a unique approach to targeted therapy in metastatic breast cancers and rheumatoid arthritis. Crystallographic analysis revealed that Takinib binds deep within the ATP binding pocket of TAK1 and targets the kinase in the DFG-in conformation. We demonstrate that detailed kinetic analysis is necessary to understand the mechanism of action of a small-molecule inhibitor and provides critical mechanistic insights into kinase function. These studies demonstrated that Takinib acts as a competitive inhibitor if TAK1 is activated by ATP and that TAK1 autophosphorylation is a two-step intermolecular process with a rate-limiting first intramolecular step.
STAR METHODS
CONTACT FOR REAGENT AND RESOURCE SHARING
Further information and requests for resources and reagents should be directed to and will be fulfilled by the Lead Contact, Timothy Haystead (timothy.haystead@duke.edu).
EXPERIMENTAL MODEL AND SUBJECT DETAILS
Cell Culture
MDA-MB-231, HEK293T, and HeLa cells were obtained from American Type Culture Collection. RA FLS were derived and propagated in the laboratory of D. Fox as previously described(Tran et al., 2007). Cells were incubated at 37°C and 5%CO2. Cancer cells were cultured in DMEM medium containing 10%FBS and 1% Pen/Strep. RA FLS were cultured in CMRL medium with 10%FBS, 1% Pen/Strep, 1% Glutamax.
METHOD DETAILS
FLECS assay
HEK293 cells were cultured in DMEM (Life Technologies) supplemented with 10% FBS (Sigma) and 1% antibiotic-antimycotic (Life Technologies) and maintained in a standard tissue culture incubator (37 °C, 5% CO2). ATP-Sepharose beads were synthesized in-house according to a previously published procedure (Carlson et al., 2013). The P. falciparum PK9 gene (PlasmoDB accession # PF3D7_1315100) was cloned into the pEGFP-C1 mammalian expression vector (Clontech) in frame with a N-terminal GFP tag. Parental HEK293 cells were transfected with the resulting PfPK9-pEGFP-C1 vector to generate HEK293-GFP-PfPK9 expressing cells using X-tremeGENE HP transfection reagent (Roche) per manufacturer instructions. Briefly, the culture medium was replaced at 48 hours post-transfection with medium supplemented with 1 mg/mL G418 sulfate (Life Technologies) to select for stably transfected cells. Following stable cell selection, fluorescence activated cell sorting (FACS) was used to enrich for GFP-PfPK9 expressing cells. Subsequently, FACS sorted HEK293-GFP-PfPK9 cells were cultured with medium supplemented with 0.5 mg/mL G418 sulfate for all following experiments. Cellular homogenates from cells were applied to a gamma phosphate linked ATP-resin. 3218 small molecules of an in-house library were screened for GFP-PfPK9 elution at 500μM. Secondary assays were conducted to confirm the presence of GFP-PfPK9 in eluates via Western blot analysis to control for false positives that may arise from small-molecules with intrinsic fluorescence. The TAK1-TAB1-GFP plasmid was obtained from MRC Dundee. For TAK1-TAB1-GFP elution, the procedures outlined above where followed.
Protein purification
TAK1-TAB1 (kinase domain residues 31-303 fused with 36 residues of TAB1 c-terminal domain residues 468-504) was expressed, purified as reported previously (Tan et al., 2015). In summary, His-TAK1-TAB1 was expressed in insect cells and purified using his-affinity column followed by TEV cleavage and finally using size exclusion chromatography. Protein purity was verified using a gradient SDS PAGE gel stained with coomassie blue. Protein concentration was measured using the Bradford method (Bradford, 1976).
Kinase Assay
Activity of purified TAK1-TAB1 protein was measured as previously described(Hastie et al., 2006). In brief, TAK1-TAB1 (50ng/well) was incubated with 5μM ATP containing radiolabeled [32P]-ATP in the presence of 300μM substrate peptide (RLGRDKYKTLRQIRQ) in a final volume of 40μl in the presence of buffer (containing 50mM Tris pH 7.5, 0.1mM EGTA, 0.1% β-Mercaptoethanol, 10 mM magnesium acetate, 0.5mM MnCl) and indicated compounds. The reaction was let go for 10min and stopped with 10μl concentrated H3PO4. The remaining activity was measured using a scintillation counter. Dose-response curves were repeated 3 times. For kinetic mechanistic studies, experiments were repeated two times and averaged.
X-ray crystallography
Purified TAK1-TAB1 as described above was crystallized as reported previously (Tan et al., 2015) with the following minor modification: Takinib was solubilized in ethyleneglycol prior to being added to the crystal soaking solution which consisted of 1mM Takinib, 0.75M sodium citrate, 0.2M NaCl, 0.1M Tris pH 7.0 and 20% ethyleneglycol. TAK1 crystals were soaked for two days before they were flash frozen in liquid nitrogen. Diffraction data was collected at Argonne Advanced Photon Source beamline 19-D. Data processing and scaling were performed using HKL3000 (Minor, Cymborowski, Otwinowski, & Chruszcz, 2006). Phases were obtained by molecular replacement using 2EVA as a starting model. Refinement, manual modeling and visualization were done using Coot (Emsley & Cowtan, 2004), Phenix (Adams et al., 2010) and Refmac (Murshudov et al., 2011). Ligand interaction figures were generated by PyMol (The PyMOL Molecular Graphics System (Alexander, Woetzel, & Meiler, 2011) and Ligplot+ . Data collection and final refinement statistics are given in Table S2.
Caspase-3/7-Activity Assay
The assay was performed as previously described (Alwarawrah et al., 2016; Howe et al., 2014). Cells were seeded at a density of 5,000 cells/well. After 24h, cells were treated with titrations of Takinib or inhibitors in the presence or absence of TNFα. After 24h incubation, 50μl of caspase buffer (50 mM HEPES pH 7.5, 100 mM KCl, 5 mM EDTA, 10 mM MgCl2, 10 mM CHAPS, 20% sucrose, 10 mM DTT) containing 10μl (Z-DEVD)2-Rh110 were added to each well. Plates were incubated for 12h at 37°C, after which fluorescence was measured at 485/535 nm. Experiments were repeated 3 times.
Hoechst Proliferation Assay
The assay was performed as previously described. MDA-MB-231 cells (1,000 cells/well) were seeded in a 96-well plate with 10% FBS, 5% Pen/Strep, 4g/l glucose DMEM medium. After 24h, cells were serum starved with 1% FBS, 5% Pen/Strep, 4g/l glucose DMEM medium for 4h. Cells were treated with titrations of Takinib in the presence or absence of 30ng/ml TNFα. Plates at 0h and 24h following treatment were frozen at -80°C after removal of media. After 24h, 100μl ddH2O was added to each well and plates were refrozen. 1 μl from Hoechst stock [1 mg/ml in 1:4 DMSO/H2O] was dissolved in 1 ml of TNE buffer (10 mM Tris, 2 M NaCl, 1 mM Na2EDTA) and 100μl of this solution was added to each well. The fluorescence was determined at 355/460nm.
Western Blot Analysis
Cells were lysed (50mM Tris, 150mM NaCl, 1mM EDTA, 1%Triton-X100, 1mM DTT, complete protease and PhosStop phosphatase inhibitor) after indicated treatment and run on Criterion XT Tris-HCl gel 4%–15% gradient (Bio-Rad). Following transfer to PVDF membrane and blocking in 5% non-fat dry milk in TBST, membranes were incubated with antibody overnight. After incubation with secondary antibody, chemiluminescence was used to visualize bands. Experiments were repeated 3 times.
ELISA cytokine assays
RA FLS cells were seeded at 5,000 cells/well in 10%CMRL medium, 1% Glutamax, 1%Pen/Strep. After overnight incubation, cells were serum-starved with 1%CMRL medium, 1% Glutamax, 1%Pen/Strep for 4h, after which treatment with inhibitors and TNF stimulation occurred. 24h after treatment, supernatant was added to ELISA plates (IL-6, IL-8, TNF, Ready-SET-Go! from Thermo). ELISA was conducted based on the manufacturer’s protocol. Absorbance was measured at 450 and 570nm. Experiments were repeated 3 times.
Mass spec analysis
Following silver stain of SDS-PAGE, visible bands were excised from the gel manually and cut into small pieces approximately 1mm x 1mm. These gel pieces were destained using 1:1 30mM potassium ferricyanide: 100mM sodium thiosulfate for 10 minutes followed by alternating washes with 25mM ammonium bicarbonate and acetonitrile. Following dehydration with acetonitrile, 25μL of porcine trypsin (Promega) at a concentration of 20μg/mL was added to the gel pieces. The gel pieces were then kept on ice for approximately 1 hour after which incubation at 37°C overnight occured. Following di gestion, the supernatant was transferred to a second tube, and acetonitrile was added to the gel pieces to complete the extraction of digested peptides. This extract was added to the first supernatant and this combined solution, containing the extracted peptides was frozen and lyophilized. The peptides were resuspended in 5μL of 100:99:1 acetonitrile: water: trifluoroacetic acid immediately prior to spotting on the MALDI target.
For MALDI analysis, the matrix solution consisted of alpha-cyano-4-hydroxycinnamic acid (Aldrich Chemical Co. Milwaukee, WI) saturating a solution of 1:1:0.01 acetonitrile: 25mM ammonium citrate: trifuoroacetic acid. Approximately 0.15 μL of peptide solution was spotted on the MALDI target immediately followed by 0.15μL of the matrix solution. This combined solution was allowed to dry at room temperature. MALDI MS and MS/MS data was then acquired using the ABSCIEX TOF/TOF® 5800 Mass Spectrometer. Resultant peptide mass fingerprint and peptide sequence data was submitted to the UniProt database using the Mascot search engine to which relevance is calculated and scores are displayed.
Synthesis of Takinib and analogs
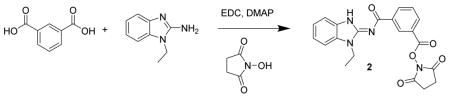
N-(1-Propyl-1H-benzo[d]imidazol-2-yl)isophthalamide 1. A mixture of 3-carbamoylbenzoic acid (1.5 g, 9.08 mmol), N-propylaminobenzamidazole (1.59 g, 9.08 mmol), HOBT hydrate (1.39 g, 9.08 mmol), DMAP (110 mg, 0.9 mmol) and EDC (2.61 g, 13.6 mmol) were dissolved in methylene chloride (30 mL), treated with Hunig’s base (1.17 g, 9.08 mmol) and stirred for 6 days. The reaction mixture was then concentrated and slurried with warm ethanol and water. After stirring for a day, the solid was filtered off, washed with water and air-dried to give compound Takinib /EDHS-206 1 (2.2 g, 75%) as a white powder. LC/MS gave a single peak with m/z = 323.1 [M+1]+ and 667.3 [2M + Na]+. 1H-NMR (dmso-d6) δ 8.68 (s, 1H), 8.38 (d, J = 7 Hz, 1H), 8.10 (s, 1H), 7.98 (d, J = 7 Hz, 1H), 7.52–7.57 (m, 3H), 7.41 (s, 1H), 7.26 (t, J = 7 Hz, 1H), 7.22 (t, J = 7 Hz, 1H), 4.27 (t, J = 7 Hz, 2H), 1.85 (h, J = 7 Hz, 2H), 0.93 (t, J = 7 Hz, 3H).
2,5-dioxopyrrolidin-1-yl 3-((1-ethyl-1H-benzo[d]imidazol-2-yl)carbamoyl)benzoate 2. A mixture of isophthalic acid (300 mg, 1.8 mmol), N-ethylaminobenzamidazole (291 mg, 1.8 mmol), N-hydroxysuccinimide (249 mg, 2.17 mmol), DMAP (22 mg, 0.18 mmol) and EDC (865 mg, 4.5 mmol) were dissolved in methylene chloride (5 mL), treated with Hunig’s base (233 mg, 1.8 mmol) and stirred for 2 h. The reaction mixture was added to a column and chromatographed (40 g Isco silica gel, 0 to 100% ethyl acetate in hexanes) to give pure product. The product was triturated with 20% ethyl acetate in hexanes to give 2 (157 mg, 21%) as a light cream colored powder. LC/MS gave a single peak with m/z = 407.1 [M+1]+ and 835.2 [2M + Na]+. 1H-NMR (DMSO-d6) δ 8.88 (s, 1H), 8.67 (d, J = 7 Hz, 1H), 8.23 (d, J = 7 Hz, 1H), 7.78 (t, J = 7 Hz, 1H), 7.57 (d, J = 7 Hz, 1H), 7.56 (d, J = 7 Hz, 1H), 7.29 (t, J = 7 Hz, 1H), 7.25 (t, J = 7 Hz, 1H), 4.33 (q, J = 7 Hz, 2H), 2.92 (s, 4H), 1.37 (t, J = 7 Hz, 3H).
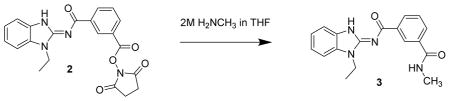
N1-(1-ethyl-1H-benzo[d]imidazol-2-yl)-N3-methylisophthalamide 3. Compound 2 (20 mg, 49 μmol) was dissolved in methylene chloride (2 mL) and treated with methyl amine (2M in THF, 250 μL). After 4 h, the reaction mixture was concentrated then dissolved in methylene chloride and chromatographed (2 x 4 g isco silica gel, 0 to 10% MeOH in CH2Cl2) to give the product 3 (11.1 mg, 70%) as a cream colored solid. LC/MS showed a single peak with m/z = 323.1 [M+1]+ and 667.2 [2M + Na]+. 1H-NMR (dmso-d6) δ 12.73 (br s, 1H), 8.64 (br s, 1H), 8.57 (q, J = 4 Hz, 1H), 8.38 (d, J = 8 Hz, 1H), 7.94 (d, J = 8 Hz, 1H), 7.53–7.58 (m, 3H). 7.27 (dt, J 1, 8 Hz, 1H), 7.23 (dt, J = 1, 8 Hz, 1H), 4.34 (q, J = 7 Hz, 2H), 2.82 (d, J = 4 Hz, 3H), 1.37 (t, J = 7 Hz, 3H)
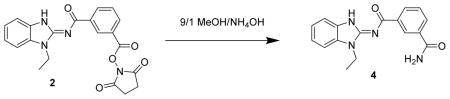
N-(1-ethyl-1H-benzo[d]imidazol-2-yl)isophthalamide 4. Compound 2 (20 mg, 49 μmol) was dissolved in methylene chloride (2 mL) and treated with 9/1 MeOH/ammonium hydroxide solution (100 μL). After 3 days, the reaction mixture was diluted with methanol, concentrated onto silica gel and chromatographed (2 x 4 g isco silica gel, 0 to 10% MeOH in CH2Cl2) to give 4 (12.2 mg) as a white powder. LC/MS showed a single peak with m/z = 309.1 [M+1]+ and 639.2 [2M + Na]+. 1H-NMR (dmso-d6) δ 12.75 (br s, 1H), 8.68 (br s, 1H), 8.38 (d, J = 8 Hz, 1H), 8.10 (s, 1H), 7.98 (d, J = 8 Hz, 1H), 7.52–7.57 (m, 3H). 7.27 (dt, J 1, 8 Hz, 1H), 7.42 (s, 1H), 7.23 (dt, J = 1, 8 Hz, 1H), 4.34 (q, J = 7 Hz, 2H), 1.36 (t, J = 7 Hz, 3H).
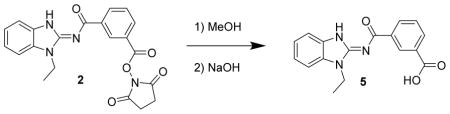
3-((1-ethyl-1H-benzo[d]imidazol-2-yl)carbamoyl)benzoic acid 5. Compound 2 (20 mg, 49 μmol) was dissolved in methanol, treated with 50% sodium hydroxide (10 drops) and stirred for a day. The mixture was then diluted with 1N HCl until a precipitate formed which was eventually filtered off to give 5 (7.7 mg, 48%) as a white solid. LC/MS showed a single peak at m/z = 310.1 [M+H]+. 1H-NMR (dmso-d6) δ 13.09 (v br s, 1H), 12.77 (br s, 1H), 8.78 (br s, 1H), 8.47 (d, J = 8 Hz, 1H), 8.07 (d, J = 8 Hz, 1H), 7.60 (t, J = 8 Hz, 1H), 7.53–7.57 (m, 2H), 7.27 (t, J = 8 Hz, 1H), 7.23 (t, J = 8 Hz, 1H), 4.32 (q, J = 7 Hz, 2H), 1.37 (t, J = 7 Hz, 3H).
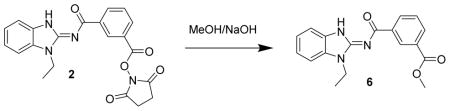
Methyl 3-((1-ethyl-1H-benzo[d]imidazol-2-yl)carbamoyl)benzoate 6. Compound 2 (20 mg, 49 μmol) was dissolved in methanol (2 mL) and treated with 1 drop of 50% NaOH (50 mg or 25 mg NaOH). After 3 d, the mixture was treated with acetic acid, concentrated and chromatographed (4 gm isco silica gel, 19/1 : CH2Cl2/MeOH) to give a partially purified product. It was triturated with 20% EtOAc in hexane to give a powder and re-concentrated to give 6 (7.1 mg, 50%) as a pinkish solid. LC/MS gave a single peak with m/z = 324.1 [M+1]+ and 669.2 [2M + Na] +. 1H-NMR (dmso-d6) δ 12.77 (br s, 1H), 8.80 (br s, 1H), 8.51 (d, J = 8 Hz, 1H), 8.10 (d, J = 8 Hz, 1H), 7.64 (t, J = 8 Hz, 1H), 7.54–7.58 (m, 2H), 7.28 (t, J = 8 Hz, 1H), 7.24 (t, J = 8 Hz, 1H), 4.33 (q, J = 7 Hz, 2H), 3.91 (s, 3H), 1.37 (t, J = 7 Hz, 3H).
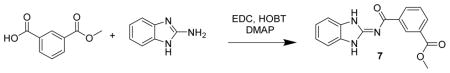
Methyl 3-((1H-benzo[d]imidazol-2-yl)carbamoyl)benzoate 7. A mixture of methyl isophthalate (500 mg, 2.8 mmol), aminobenzamidazole (369 mg, 2.8 mmol), HOBT (340 mg, 2.2 mmol), DMAP (34 mg, 0.28 mmol) and EDC (718 mg, 3.7 mmol) were dissolved in methylene chloride (5 mL), treated with Hunig’s base (359 mg, 2.8 mmol) and stirred for 1 d. The reaction mixture was diluted with methanol, adsorbed onto silica gel and chromatographed (40 g Isco silica gel, , 0 to 10% MeOH in CH2Cl2) to give pure product. The product was triturated with 20% ethyl acetate in hexanes to give 7 (352 mg, 42%) as a white powder. LC/MS gave a single peak with m/z = 296.1 [M+1]+. 1H-NMR (dmso-d6) δ 12.51 (br s, 1H), 8.78 (br s, 1H), 8.39 (d, J = 8 Hz, 1H), 8.13 (d, J = 8 Hz, 1H), 7.66 (t, J = 8 Hz, 1H), 7.42–7.46 (m, 2H), 7.15–7.19 (m, 2H), 3.91 (s, 3H).
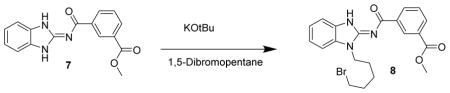
Methyl 3-((1-(5-bromopentyl)-1H-benzo[d]imidazol-2-yl)carbamoyl)benzoate 8. Compound 7 (100 mg, 338 μmol) was dissolved in THF (2 mL) and DMSO (1 mL) and treated with KOtBu (338 μL of 1M solution in THF) followed by 1,5-dibromopentane (77.9 mg, 46.1 μL, 338 μmol) and stirred at RT for 2 h. The reaction mixture was concentrated then chromatographed (43 g Isco C18, 0 to 100% MeOH w/0.2% formic in both) to give compound 8 (98 mg, 65%) as a white solid. LC/MS showed a single peak at m/z = 444.1 [M+H]+. 1H-NMR (DMSO-d6) δ 12.77 (br s, 1H), 8.81 (s, 1H), 8.49 (d, J = 8 Hz, 1H), 8.09 (d, J = 8 Hz, 1H), 7.63 (t, J = 8 Hz, 1H), 7.56 (2 d, J = 8 Hz, 2H), 7.27 (t, J = 8 Hz, 1H), 7.24 (t, J + 8 Hz, 1H), 4.30 (t, J = 7 Hz, 2H), 3.90 (s, 3H), 3.50 (t, J = 7 Hz, 2H), 1.91 (p, J = 7 Hz, 2H), 1.87 (p, J = 7 Hz, 2H), 1.49 (p, J = 7 Hz, 2H).
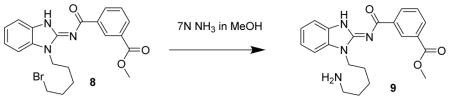
Methyl 3-((1-(5-aminopentyl)-1H-benzo[d]imidazol-2-yl)carbamoyl)benzoate 9. Compound 8 (67 mg, 151 μmol) was dissolved in methanolic ammonia (7N ammonia in methanol, 4 mL) and heated at 45°C overnight. The next day, the reactio n mixture was concentrated to a glass and chromatographed (43 g isco C18, 0 to 100% MeOH with 0.2% formic acid) to give compound 9 (33 mg, 60%) as a tacky solid. LC/MS showed a single peak at m/z = 381.2. 1H-NMR (dmso-d6) δ 8.81 (br s, 1H), 8.49 (d, J = 8 Hz, 1H), 8.44 (s, 1H), 8.09 (d, J = 8Hz, 1H), 7.64 (t, J = 8 Hz, 1H), 7.53–7.57 (m, 2H), 7.27 (t, j = 8 Hz, 1H), 7.23 (t, J = 8 Hz, 1H), 4.28 (t, J = 7 Hz, 2H), 3.91 (s, 3H), 2.68 (t, J = 7 Hz, 2H), 1.84 (p, J = 7 Hz, 2H), 1.58 (p, J = 7 Hz, 2H), 1.41 (p, J = 7 Hz, 2H),
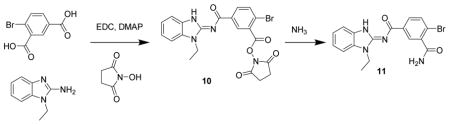
4-Bromo-N1-(1-ethyl-1H-benzo[d]imidazol-2-yl)isophthalamide 11. A mixture of 4- bromoisophthalic acid (100 mg, 4.1 μmol), N-ethylaminobenzamidazole (66 mg, 4.1 μmol), N-hydroxysuccinimide (56 mg, 4.9 μmol), DMAP (5 mg, 0.4 μmol) and EDC (234 mg, 1.2 mmol) were dissolved in methylene chloride (5 mL), treated with Hunig’s base (53 mg, 4.1 μmol) and stirred for 3 d. The reaction mixture was added directly to a column and air-dried for a few minutes then chromatographed (12 g isco silica gel, 0 to 100% EtOAc in hexanes) to give 10 (56 mg, 28%) as a glass. The glass was treated with 7N ammonia in methanol (2 mL) and stirred for 1 d. The mixture was concentrated and chromatographed (12 g isco silica gel, 0 to 10% MeOH in CH2Cl2) to give two peaks. The larger later eluting peak was concentrated to give 11 (19.8 mg, 10%) as a white solid. LC/MS gave a single peak with m/z = 387.1 [M+1]+ and 795.0 [2M + Na] +. 1H-NMR (dmso-d6) δ 12.77 (br s, 1H), 8.12 (br s, 1H), 7.78 (d, J = 8 Hz, 1H), 7.73 (d, J = 8 Hz, 1H), 7.54–7.59 (m, 2H), 7.28 (t, J = 8 Hz, 1H), 7.25 (t, J = 8 Hz, 1H), 4.24 (q, J = 7 Hz, 2H), 1.31 (t, J = 7 Hz, 3H).
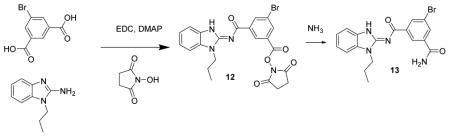
5-Bromo-N-(1-propyl-1H-benzo[d]imidazol-2-yl)isophthalamide 13. A mixture of 5-bromoisophthalic acid (100 mg, 4.1 μmol), N-propylaminobenzamidazole (72 mg, 4.1 μmol), N-hydroxysuccinimide (56 mg, 4.9 μmol), DMAP (5 mg, 0.4 μmol) and EDC (234 mg, 1.2 mmol) were dissolved in methylene chloride (5 mL), treated with Hunig’s base (53 mg, 4.1 μmol) and stirred for 1 d to give 12. The reaction mixture was then treated with 9/1 MeOH/NH4OH (5 mL) and stirred for 2 h. The mixture was concentrated to a solid, dissolved in DMSO, added to a column and chromatographed (50 g isco C18, 0 to 100% MeOH with 0.2% formic acid) to give 13 (71 mg, 43%) as a white powder. LC/MS gave a single peak with m/z =401.1 [M+1]+ and 823.1 [2M + Na] +. 1 H-NMR (dmso-d6) δ 12.77 (br s, 1H), 8.65 (br s, 1H), 8.45 (br s, 1H), 8.22 (br s, 1H), 8.17 (br s, 1H), 7.54–7.60 (m, 3H), 7.28 (t, J = 8 Hz, 1H), 7.24 (t, J = 8 Hz, 1H), 4.27 (t, J = 7 Hz, 2H), 1.85 (h, J = 7Hz, 2H), 0.92 (t, J = 7 Hz, 3H).
QUANTIFICATION AND STATISTICAL ANALYSIS
Graphpad Prism 7 was used for statistical analysis of kinase assays, viability assays, and ELISA. For each analysis, total n and SEM are presented in the figure legend. Curves were plotted using variable slope (four parameters) non-linear fit.
DATA AND SOFTWARE AVAILABILITY
The co-crystal structure was deposited to the protein data base (PDB) and can be accessed using the code 5V5N.
Supplementary Material
Table S1. Results of Dundee Selectivity profiling (mean±SEM, n=2), related to Figure 1.
Table S2. Crystallographic statistics, related to Figure 2.
Highlights.
Identification of takinib as a potent (IC50 9.5nM) and selective TAK1 inhibitor
X-ray structure reveals binding of takinib deep in the ATP-binding pocket of TAK1
Enzymatic studies demonstrate a substrate-like autophosphorlylation mechanism - takinib induces TNFa-dependent cell death in rheumatoid arthritis and breast cancer
Acknowledgments
This work was supported by Welch I1829 (KDW), CPRIT RP140233 (KDW), NIH GM099796 (ERD), and ORNL Ralph E. Powe Junior Faculty Enhancement Award (ERD). We thank Diana Tomchick, Zhe Chen, the staff at the structural biology laboratory at UT Southwestern Medical Center and at beamline 19ID of Advanced Photon Source for discussions and technical assistance with X-ray data collection and processing. Results shown in this report are derived from work performed at Argonne National Laboratory, Structural Biology Center at the Advanced Photon Source. Argonne is operated by U Chicago Argonne, LLC, for the U.S. Department of Energy, Office of Biological and Environmental Research under contract DE-AC02-06CH11357. KB is supported by the Fulbright scholar program and a sabbatical leave from the Jordan University of Science and Technology. We thank Doug Marchuk (Duke University) for providing the FLAG-TNNI3K plasmid and Aaron P. Smith for helpful discussion. A patent disclosure describing Takinib and its analogs has been filed with Duke University by ERD and TAJH.
Footnotes
Author Contributions
ERD and TH directed the project in general and initiated the screening program against PfPK9 and subsequently TAK1. Both authors along with JT, DG and KDW wrote and edited the paper. KW, DG, and AB solved the co-crystal structure of Takinib and TAK1. JT carried all enzymatic and analog studies as well as deduced the mechanism of Takinib inhibition. RR, DAC, and ALE carried out screening work against the Haystead laboratory purine analog collection. PFH and MMP synthesized Takinib. The analogs of Takinib were synthesized by PH. LSE, KB, and JT carried out the cancer cell based studies examining the effects of Takinib on TNFα signaling. JT carried out the RA FLS studies. PC and DF provided RA FLS cells. DRL performed the mass spec analysis. The first 3 authors contributed equally to this work. KDW, ERD and TH are listed as joint senior authors of this work, reflecting their individual expertise and the highly collaborative nature of this work.
Publisher's Disclaimer: This is a PDF file of an unedited manuscript that has been accepted for publication. As a service to our customers we are providing this early version of the manuscript. The manuscript will undergo copyediting, typesetting, and review of the resulting proof before it is published in its final citable form. Please note that during the production process errors may be discovered which could affect the content, and all legal disclaimers that apply to the journal pertain.
References
- Adams PD, Afonine PV, Bunkoczi G, Chen VB, Davis IW, Echols N, … Zwart PH. PHENIX: a comprehensive Python-based system for macromolecular structure solution. Acta Crystallogr D Biol Crystallogr. 2010;66(Pt 2):213–221. doi: 10.1107/S0907444909052925. [DOI] [PMC free article] [PubMed] [Google Scholar]
- Alexander N, Woetzel N, Meiler J. bcl::Cluster : A method for clustering biological molecules coupled with visualization in the Pymol Molecular Graphics System. IEEE Int Conf Comput Adv Bio Med Sci. 2011;2011:13–18. doi: 10.1109/ICCABS.2011.5729867. [DOI] [PMC free article] [PubMed] [Google Scholar]
- Alwarawrah Y, Hughes P, Loiselle D, Carlson DA, Darr DB, Jordan JL, … Haystead TAJ. Fasnall, a Selective FASN Inhibitor, Shows Potent Anti-tumor Activity in the MMTV-Neu Model of HER2(+) Breast Cancer. Cell Chemical Biology. 2016;23(6):678–688. doi: 10.1016/j.chembiol.2016.04.011. [DOI] [PMC free article] [PubMed] [Google Scholar]
- Barrott JJ, Hughes Pf, Osada T, Yang XY, Hartman ZC, Loiselle DR, Spector NL, … Haystead TA. Optical and radioiodinated tethered Hsp90 inhibitors reveal selective internalization of ectopic Hsp90 in malignant breast tumor cells. Chemistry&Biology. 2012;20(9):1187–1197. doi: 10.1016/j.chembiol.2013.08.004. D - NLM: NIHMS517515. [DOI] [PMC free article] [PubMed] [Google Scholar]
- D - NLM: PMC3815696 EDAT- 2013/09/17 06:00 MHDA- 2014/03/29 06:00 CRDT- 2013/09/17 06:00 PHST- 2013/06/03 [received] PHST- 2013/07/18 [revised] PHST- 2013/08/10 [accepted] PHST- 2013/09/12 [aheadofprint] AID - S1074-5521(13)00303-7 [pii] AID - 10.1016/j.chembiol.2013.08.004 [doi] PST - ppublish
- Becker C, Fantini MC, Schramm C, Lehr HA, Wirtz S, Nikolaev A, … Neurath MF. TGF-beta suppresses tumor progression in colon cancer by inhibition of IL-6 trans-signaling. Immunity. 2004;21(4):491–501. doi: 10.1016/j.immuni.2004.07.020. [DOI] [PubMed] [Google Scholar]
- Beis I, Newsholme EA. The contents of adenine nucleotides, phosphagens and some glycolytic intermediates in resting muscles from vertebrates and invertebrates. Biochem J. 1975;152 doi: 10.1042/bj1520023. D - NLM: PMC1172435 EDAT- 1975/10/01 MHDA- 1975/10/010001 CRDT- 1975/10/01 00:00 PST - ppublish. [DOI] [PMC free article] [PubMed] [Google Scholar]
- Bradford MM. A rapid and sensitive method for the quantitation of microgram quantities of protein utilizing the principle of protein-dye binding. Anal Biochem. 1976;72:248–254. doi: 10.1016/0003-2697(76)90527-3. [DOI] [PubMed] [Google Scholar]
- Bradley JR. TNF-mediated inflammatory disease. J Pathol. 2008;214(2):149–160. doi: 10.1002/path.2287. [DOI] [PubMed] [Google Scholar]
- Cailleau R, Young R, Olive M, Reeves WJ., Jr Breast tumor cell lines from pleural effusions. J Natl Cancer Inst. 1974 doi: 10.1093/jnci/53.3.661. [DOI] [PMC free article] [PubMed] [Google Scholar]
- Carlson DA, Franke AS, Weitzel DH, Speer BL, Hughes PF, Hagerty L, … Haystead TA. Fluorescence linked enzyme chemoproteomic strategy for discovery of a potent and selective DAPK1 and ZIPK inhibitor. ACS Chem Biol. 2013;8(12):2715–2723. doi: 10.1021/cb400407c. [DOI] [PMC free article] [PubMed] [Google Scholar]
- Catz SD, Johnson JL. Transcriptional regulation of bcl-2 by nuclear factor kappa B and its significance in prostate cancer. Oncogene. 2001;20(50):7342–7351. doi: 10.1038/sj.onc.1204926. [DOI] [PubMed] [Google Scholar]
- Cerami E, Gao J, Dogrusoz U, Gross BE, Sumer SO, Aksoy BA, … Schultz N. The cBio cancer genomics portal: an open platform for exploring multidimensional cancer genomics data. Cancer Discov. 2012;2(5):401–404. doi: 10.1158/2159-8290.CD-12-0095. [DOI] [PMC free article] [PubMed] [Google Scholar]
- Choo MK, Sakurai H, Koizumi K, Saiki I. TAK1-mediated stress signaling pathways are essential for TNF-alpha-promoted pulmonary metastasis of murine colon cancer cells. Int J Cancer. 2006;118(11):2758–2764. doi: 10.1002/ijc.21734. [DOI] [PubMed] [Google Scholar]
- Deroose JP, Grunhagen DJ, de Wilt JH, Eggermont AM, Verhoef C. Treatment modifications in tumour necrosis factor-alpha (TNF)-based isolated limb perfusion in patients with advanced extremity soft tissue sarcomas. Eur J Cancer. 2015;51(3):367–373. doi: 10.1016/j.ejca.2014.11.020. [DOI] [PubMed] [Google Scholar]
- Dodson CA, Yeoh S, Haq T, Bayliss R. A kinetic test characterizes kinase intramolecular and intermolecular autophosphorylation mechanisms. Sci Signal. 2013;6(282):ra54. doi: 10.1126/scisignal.2003910. [DOI] [PubMed] [Google Scholar]
- Emsley P, Cowtan K. Coot: model-building tools for molecular graphics. Acta Crystallogr D Biol Crystallogr. 2004;60(Pt 12 Pt 1):2126–2132. doi: 10.1107/S0907444904019158. [DOI] [PubMed] [Google Scholar]
- Francini CM, Fallacara AL, Artusi R, Mennuni L, Calgani A, Angelucci A, … Botta M. Identification of Aminoimidazole and Aminothiazole Derivatives as Src Family Kinase Inhibitors. Chemmedchem. 2015;10(12):2027–2041. doi: 10.1002/cmdc.201500428. [DOI] [PubMed] [Google Scholar]
- Gao JJ, Aksoy BA, Dogrusoz U, Dresdner G, Gross B, Sumer SO, … Schultz N. Integrative Analysis of Complex Cancer Genomics and Clinical Profiles Using the cBioPortal. Science Signaling. 2013;6(269) doi: 10.1126/scisignal.2004088. D - NLM: NIHMS622586. [DOI] [PMC free article] [PubMed] [Google Scholar]
- D - NLM: PMC4160307 EDAT- 2013/04/04 06:00 MHDA- 2013/09/24 06:00 CRDT- 2013/04/04 06:00 AID - scisignal.2004088 [pii] AID - 10.1126/scisignal.2004088 [doi] PST - epublish
- Hanwell MD, Curtis DE, Lonie DC, Vandermeersch T, Zurek E, Hutchison GR. Avogadro: an advanced semantic chemical editor, visualization, and analysis platform. J Cheminform. 2012;4(1):17. doi: 10.1186/1758-2946-4-17. [DOI] [PMC free article] [PubMed] [Google Scholar]
- Hastie CJ, McLauchlan HJ, Cohen P. Assay of protein kinases using radiolabeled ATP: a protocol. Nature Protocols. 2006;1(2):968–971. doi: 10.1038/nprot.2006.149. [DOI] [PubMed] [Google Scholar]
- Haystead TA. The purinome, a complex mix of drug and toxicity targets. Curr Top Med Chem. 2006;6(11):1117–1127. doi: 10.2174/156802606777812059. [DOI] [PubMed] [Google Scholar]
- Hirata Y, Takahashi M, Morishita T, Noguchi T, Matsuzawa A. Post-Translational Modifications of the TAK1-TAB Complex. LID - E205 [pii] LID - 10.3390/ijms18010205 [doi] Int J Mol Sci. 2017;18 doi: 10.3390/ijms18010205. [DOI] [PMC free article] [PubMed] [Google Scholar]
- Hopkins AL, Groom CR. The druggable genome. Nat Rev Drug Discov. 2002;1(9):727–730. doi: 10.1038/nrd892. [DOI] [PubMed] [Google Scholar]
- Howe MK, Bodoor K, Carlson DA, Hughes PF, Alwarawrah Y, Loiselle DR, … Haystead TA. Identification of an allosteric small-molecule inhibitor selective for the inducible form of heat shock protein 70. Chem Biol. 2014;21(12):1648–1659. doi: 10.1016/j.chembiol.2014.10.016. [DOI] [PMC free article] [PubMed] [Google Scholar]
- Huang HL, Chiang CH, Hung WC, Hou MF. Targeting of TGF-beta-activated protein kinase 1 inhibits chemokine (C-C motif) receptor 7 expression, tumor growth and metastasis in breast cancer. Oncotarget. 2015;6(2):995–1007. doi: 10.18632/oncotarget.2739. [DOI] [PMC free article] [PubMed] [Google Scholar]
- Inokuchi S, Aoyama T, Miura K, Osterreicher CH, Kodama Y, Miyai K, … Seki E. Disruption of TAK1 in hepatocytes causes hepatic injury, inflammation, fibrosis, and carcinogenesis. Proc Natl Acad Sci U S A. 2010;107(2):844–849. doi: 10.1073/pnas.0909781107. [DOI] [PMC free article] [PubMed] [Google Scholar]
- Jones DS, Jenney AP, Swantek JL, Burke JM, Lauffenburger DA, Sorger PK. Profiling drugs for rheumatoid arthritis that inhibit synovial fibroblast activation. Nature Chemical Biology. 2017;13(1):38–45. doi: 10.1038/Nchembio.2211. [DOI] [PMC free article] [PubMed] [Google Scholar]
- Kilty I, Jones LH. TAK1 selective inhibition: state of the art and future opportunities. Future Med Chem. 2015;7(1):23–33. doi: 10.4155/fmc.14.138. [DOI] [PubMed] [Google Scholar]
- Kishimoto K, Matsumoto K, Ninomiya-Tsuji J. TAK1 mitogen-activated protein kinase kinase kinase is activated by autophosphorylation within its activation loop. Journal of Biological Chemistry. 2000;275(10):7359–7364. doi: 10.1074/jbc.275.10.7359. [DOI] [PubMed] [Google Scholar]
- Komaki Y, Yamada A, Komaki F, Kudaravalli P, Micic D, Ido A, Sakuraba A. Efficacy, safety and pharmacokinetics of biosimilars of anti-tumor necrosis factor-alpha agents in rheumatic diseases; A systematic review and meta-analysis. J Autoimmun. 2017 doi: 10.1016/j.jaut.2017.02.003. [DOI] [PubMed] [Google Scholar]
- Kreuz S, Siegmund D, Scheurich P, Wajant H. NF-kappaB inducers upregulate cFLIP, a cycloheximide-sensitive inhibitor of death receptor signaling. Mol Cell Biol. 2001;21(12):3964–3973. doi: 10.1128/MCB.21.12.3964-3973.2001. [DOI] [PMC free article] [PubMed] [Google Scholar]
- Kristensen M, Chu CQ, Eedy DJ, Feldmann M, Brennan FM, Breathnach SM. Localization of tumour necrosis factor-alpha (TNF-alpha) and its receptors in normal and psoriatic skin: epidermal cells express the 55-kD but not the 75-kD TNF receptor. Clinical and Experimental Immunology. 1993;94(2):354–362. doi: 10.1111/j.1365-2249.1993.tb03457.x. [DOI] [PMC free article] [PubMed] [Google Scholar]
- Kuei JH, Tashkin DP, Figlin RA. Pulmonary toxicity of recombinant human tumor necrosis factor. Chest. 1989;96(2):334–338. doi: 10.1378/chest.96.2.334. [DOI] [PubMed] [Google Scholar]
- Kurzrock R, Feinberg B, Talpaz M, Saks S, Gutterman JU. Phase I study of a combination of recombinant tumor necrosis factor-alpha and recombinant interferon-gamma in cancer patients. J Interferon Res. 1989;9(4):435–444. doi: 10.1089/jir.1989.9.435. [DOI] [PubMed] [Google Scholar]
- Levinson NM, Boxer SG. A conserved water-mediated hydrogen bond network defines bosutinib's kinase selectivity. Nat Chem Biol. 2014;10(2):127–132. doi: 10.1038/nchembio.1404. [DOI] [PMC free article] [PubMed] [Google Scholar]
- Lin P, Niu W, Peng C, Zhang Z, Niu J. The role of TAK1 expression in thyroid cancer. Int J Clin Exp Pathol. 2015;8(11):14449–14456. D - NLM: PMC4713548 OTO - NOTNLM. [PMC free article] [PubMed] [Google Scholar]
- Minor W, Cymborowski M, Otwinowski Z, Chruszcz M. HKL-3000: the integration of data reduction and structure solution--from diffraction images to an initial model in minutes. Acta Crystallogr D Biol Crystallogr. 2006;62(Pt 8):859–866. doi: 10.1107/S0907444906019949. [DOI] [PubMed] [Google Scholar]
- Moore RJ, Owens DM, Stamp G, Arnott C, Burke F, East N, … Balkwill F. Mice deficient in tumor necrosis factor-alpha are resistant to skin carcinogenesis. Nat Med. 1999;5(7):828–831. doi: 10.1038/10552. [DOI] [PubMed] [Google Scholar]
- Murshudov GN, Skubak P, Lebedev AA, Pannu NS, Steiner RA, Nicholls RA, … Vagin AA. REFMAC5 for the refinement of macromolecular crystal structures. Acta Crystallogr D Biol Crystallogr. 2011;67(Pt 4):355–367. doi: 10.1107/S0907444911001314. [DOI] [PMC free article] [PubMed] [Google Scholar]
- Philip N, Haystead TA. Characterization of a UBC13 kinase in Plasmodium falciparum. Proceedings of the National Academy of Sciences. 2007;104(19):7845–7850. doi: 10.1073/pnas.0611601104. [DOI] [PMC free article] [PubMed] [Google Scholar]
- Phong MS, Van Horn RD, Li S, Tucker-Kellogg G, Surana U, Ye XS. p38 Mitogen-Activated Protein Kinase Promotes Cell Survival in Response to DNA Damage but Is Not Required for the G2 DNA Damage Checkpoint in Human Cancer Cells. Molecular and Cellular Biology. 2010;30(15):3816–3826. doi: 10.1128/mcb.00949-09. [DOI] [PMC free article] [PubMed] [Google Scholar]
- Powers JP, Li S, Jaen JC, Liu J, Walker NP, Wang Z, Wesche H. Discovery and initial SAR of inhibitors of interleukin-1 receptor-associated kinase-4. Bioorg Med Chem Lett. 2006;16(11):2842–2845. doi: 10.1016/j.bmcl.2006.03.020. [DOI] [PubMed] [Google Scholar]
- Powrie F, Leach MW, Mauze S, Menon S, Caddle LB, Coffman RL. Inhibition of Th1 responses prevents inflammatory bowel disease in scid mice reconstituted with CD45RBhi CD4+ T cells. Immunity. 1994;1(7):553–562. doi: 10.1016/1074-7613(94)90045-0. [DOI] [PubMed] [Google Scholar]
- Rhyasen GW, Starczynowski DT. IRAK signalling in cancer. Br J Cancer. 2015;112(2):232–237. doi: 10.1038/bjc.2014.513. [DOI] [PMC free article] [PubMed] [Google Scholar]
- Roh YS, Song J, Seki E. TAK1 regulates hepatic cell survival and carcinogenesis. J Gastroenterol. 2014;49(2):185–194. doi: 10.1007/s00535-013-0931-x. [DOI] [PMC free article] [PubMed] [Google Scholar]
- Safina A, Ren MQ, Vandette E, Bakin AV. TAK1 is required for TGF-beta 1- mediated regulation of matrix metalloproteinase-9 and metastasis. Oncogene. 2008;27(9):1198–1207. doi: 10.1038/sj.onc.1210768. [DOI] [PubMed] [Google Scholar]
- Safina A, Sotomayor P, Limoge M, Morrison C, Bakin AV. TAK1-TAB2 signaling contributes to bone destruction by breast carcinoma cells. Mol Cancer Res. 2011;9(8):1042–1053. doi: 10.1158/1541-7786. MCR-10-0196. [DOI] [PMC free article] [PubMed] [Google Scholar]
- Sakurai H. Targeting of TAK1 in inflammatory disorders and cancer. Trends Pharmacol Sci. 2012;33(10):522–530. doi: 10.1016/j.tips.2012.06.007. [DOI] [PubMed] [Google Scholar]
- Scholz R, Sidler CL, Thali RF, Winssinger N, Cheung PCF, Neumann D. Autoactivation of Transforming Growth Factor beta-activated Kinase 1 Is a Sequential Bimolecular Process. Journal of Biological Chemistry. 2010;285(33):25753–25766. doi: 10.1074/jbc.M109.093468. [DOI] [PMC free article] [PubMed] [Google Scholar]
- Shim JH, Xiao CC, Paschal AE, Bailey ST, Rao P, Hayden MS, … Ghosh S. TAK1, but not TAB1 or TAB2, plays an essential role in multiple signaling pathways in vivo. Genes & Development. 2005;19(22):2668–2681. doi: 10.1101/gad.1360605. [DOI] [PMC free article] [PubMed] [Google Scholar]
- Singh A, Sweeney MF, Yu M, Burger A, Greninger P, Benes C, … Settleman J. TAK1 inhibition promotes apoptosis in KRAS-dependent colon cancers. Cell. 2012;148(4):639–650. doi: 10.1016/j.cell.2011.12.033. [DOI] [PMC free article] [PubMed] [Google Scholar]
- Singh AK, Umar S, Riegsecker S, Chourasia M, Ahmed S. Regulation of Transforming Growth Factor beta-Activated Kinase Activation by Epigallocatechin-3- Gallate in Rheumatoid Arthritis Synovial Fibroblasts: Suppression of K(63) -Linked Autoubiquitination of Tumor Necrosis Factor Receptor-Associated Factor 6. Arthritis Rheumatol. 2016;68(2):347–358. doi: 10.1002/art.39447. [DOI] [PMC free article] [PubMed] [Google Scholar]
- Spadaro A, Lubrano E, Marchesoni A, D'Angelo S, Ramonda R, Addimanda O, … Salvarani C. Remission in ankylosing spondylitis treated with anti-TNF-alpha drugs: a national multicentre study. Rheumatology (Oxford) 2013;52(10):1914–1919. doi: 10.1093/rheumatology/ket249. [DOI] [PubMed] [Google Scholar]
- Takahashi H, Jin C, Rajabi H, Pitroda S, Alam M, Ahmad R, … Kufe D. MUC1-C activates the TAK1 inflammatory pathway in colon cancer. Oncogene. 2015;34(40):5187–5197. doi: 10.1038/onc.2014.442. [DOI] [PMC free article] [PubMed] [Google Scholar]
- Tan L, Nomanbhoy T, Gurbani D, Patricelli M, Hunter J, Geng J, … Gray NS. Discovery of type II inhibitors of TGFbeta-activated kinase 1 (TAK1) and mitogen-activated protein kinase kinase kinase kinase 2 (MAP4K2) J Med Chem. 2015;58(1):183–196. doi: 10.1021/jm500480k. [DOI] [PMC free article] [PubMed] [Google Scholar]
- Tran CN, Lundy Sk, White PT, Endres JL, Motyl CD, Gupta R, Wilke CM, … Fox DA. Molecular interactions between T cells and fibroblast-like synoviocytes: role of membrane tumor necrosis factor-alpha on cytokine-activated T cells. Am J Pathol. 2007 doi: 10.2353/ajpath.2007.070004. D - NLM: PMC2043519 EDAT- 2007/09/08 0900 MHDA- 2008/01/26 09:00 CRDT- 2007/09/08 09:00 AID - S0002-9440(10)62419-4 [pii] AID - PST - ppublish. [DOI] [PMC free article] [PubMed] [Google Scholar]
- Vaiopoulos AG, Athanasoula KC, Papavassiliou AG. NF-κB in colorectal cancer. Journal of Molecular Medicine. 2013;91(9):1029–1037. doi: 10.1007/s00109-013-1045-x. [DOI] [PubMed] [Google Scholar]
- Verhoef C, de Wilt JH, Grunhagen DJ, van Geel AN, ten Hagen TL, Eggermont AM. Isolated limb perfusion with melphalan and TNF-alpha in the treatment of extremity sarcoma. Curr Treat Options Oncol. 2007;8(6):417–427. doi: 10.1007/s11864-007-0044-y. [DOI] [PMC free article] [PubMed] [Google Scholar]
- Wajant H, Pfizenmaier K, Scheurich P. Tumor necrosis factor signaling. Cell Death Differ. 2000;10(1):45–65. doi: 10.1038/sj.cdd.4401189. [DOI] [PubMed] [Google Scholar]
- Wang Z, Zhang H, Shi M, Yu Y, Wang H, Cao WM, … Zhang H. TAK1 inhibitor NG25 enhances doxorubicin-mediated apoptosis in breast cancer cells. Sci Rep. 2016;6:32737. doi: 10.1038/srep32737. [DOI] [PMC free article] [PubMed] [Google Scholar]
- Wu J, Powell F, Larsen NA, Lai Z, Byth KF, Read J, … Chen H. Mechanism and in vitro pharmacology of TAK1 inhibition by (5Z)-7-Oxozeaenol. ACS Chem Biol. 2013;8(3):643–650. doi: 10.1021/cb3005897. [DOI] [PubMed] [Google Scholar]
- Wu XF, Zhang WZ, Font-Burgada J, Palmer T, Hamil AS, Biswas SK, … Karin M. Ubiquitin-conjugating enzyme Ubc13 controls breast cancer metastasis through a TAK1-p38 MAP kinase cascade. Proceedings of the National Academy of Sciences of the United States of America. 2014;111(38):13870–13875. doi: 10.1073/pnas.1414358111. [DOI] [PMC free article] [PubMed] [Google Scholar]
- Yan P, Li Q, Kim GM, Xu J, Hsu CY, Xu XM. Cellular localization of tumor necrosis factor-alpha following acute spinal cord injury in adult rats. J Neurotrauma. 2001;18(5):563–568. doi: 10.1089/089771501300227369. [DOI] [PubMed] [Google Scholar]
- Zer C, Sachs G, Shin JM. Identification of genomic targets downstream of p38 mitogen-activated protein kinase pathway mediating tumor necrosis factor-α signaling. Physiological genomics. 2007;31(2):343–351. doi: 10.1152/physiolgenomics.00080.2007. [DOI] [PMC free article] [PubMed] [Google Scholar]
Associated Data
This section collects any data citations, data availability statements, or supplementary materials included in this article.
Supplementary Materials
Table S1. Results of Dundee Selectivity profiling (mean±SEM, n=2), related to Figure 1.
Table S2. Crystallographic statistics, related to Figure 2.