

Abstract
The B-subunits of replicative DNA polymerases from Archaea to humans belong to the same protein family, suggesting that they share a common fundamental function. We report here the gene structure for the B-subunit of human DNA polymerase ɛ (POLE2), whose expression and transcriptional regulation is typical for replication proteins with some unique features. The 75 bp core promoter region, located within exon 1, contains an Sp1 element that is a critical determinant of promoter activity as shown by the luciferase reporter, electrophoretic mobility shift and DNase I footprinting assays. Two overlapping E2F elements adjacent to the Sp1 element are essential for full promoter activity and serum response. Binding sites for E2F1 and NF-1 reside immediately downstream from the core promoter region. Our results suggest that human POLE2 is regulated by two E2F–pocket protein complexes, one associated with Sp1 and the other with NF-1. So far, only one replicative DNA polymerase B-subunit gene promoter, POLA2 encoding the B-subunit of DNA polymerase α, has been characterized. Mitogenic activation of the POLE2 promoter by an E2F-mediated mechanism resembles that of POLA2, but the regulation of basal promoter activity is different between these two genes.
INTRODUCTION
The replicative DNA polymerases (pols) α, δ and ɛ (reviewed in 1–3) are central components in DNA replication, repair, recombination and cell cycle control. They are multisubunit enzymes that are up-regulated by mitogenic activators. So far, research on replicative polymerases has focused mainly on the catalytic A-subunits, while the function and regulation of the others, such as the B-subunits, has remained obscure.
In the yeasts Saccharomyces cerevisiae and Schizosaccharomyces pombe, genes for the B-subunits of pols α, δ and ɛ are essential for viability, and temperature-sensitive mutants show defects in replication initiation/elongation (4–6). The 68 kDa B-subunit of mammalian pol α is a substrate for cyclin-dependent kinases in vitro and in vivo and phosphorylation of this subunit is involved in regulation of primase activity (7). The B-subunits of replicative polymerases from Archaea to humans form a protein superfamily, as revealed by their conserved primary structural elements (8). The obvious common fold predicts a common function that makes B-subunits challenging subjects for research.
Expression of genes for the A-subunits of mammalian pols α, δ and ɛ depends on cell proliferation, showing elevated steady-state mRNA levels upon entry into S phase when serum-deprived cells are induced to proliferate (9–11). Similar proliferation dependence has been reported for expression of the 68 kDa B-subunit as well as for the 55 and 48 kDa primase subunits of pol α (12). In cycling cells, the fluctuation of mRNA levels is moderate, being highest at the G1/S boundary, and this probably reflects adaptation to global transcriptional control rather than an acute need for de novo synthesis of protein.
Promoters of genes for catalytic A-subunits of mammalian replicative polymerases as well as the known B-subunit promoters are TATA-less and contain several transcription factor binding elements such as Sp1, CCAAT and E2F (13–19). Several other mitogen-regulated genes that are associated with DNA replication have TATA-less G+C-rich promoters with binding sites for Sp1 and E2F. Genes for nucleotide synthesis (dihydrofolate reductase, thymidine kinase and thymidylate synthetase) and for cell cycle regulation (CDC25A, cyclin D1, cyclin E, cyclin A, CDC6 and ORC1) provide good examples of this (20–30).
Sp1 belongs to the Sp(1–4) family of transcription factors that bind to the consensus element 5′-GGGCGG-3′ and often act as critical determinants for promoter activity and initiation of transcription in TATA-less promoters (31). Sp1 interacts with histone deacetylase 1 (HDAC1), but this interaction can be abolished by overexpression of E2F1 (32). E2Fs (reviewed in 33) are heterodimeric transcription factors consisting of E2F(1–6) and DP(1–3) subunits. They bind the consensus sequence 5′-TTT(G/C)(G/C)CGC-3′ and several variant sequences (34–36). Cell cycle-specific transactivation by E2F and/or repression by E2F–pocket protein (pRb, p107 and p130) complexes are utilized in the regulation of almost all genes involved in DNA replication in animal cells (33). Overexpression of E2F1–3 up-regulates several replication/cell cycle proteins and can drive quiescent fibroblasts into the cell cycle (37). At least in the mouse dihydrofolate reductase (DHFR) promoter, E2F1-mediated activation is based on the recruitment of CREB-binding protein (CBP), which acetylates histones and enables the loading of RNA polymerase II and other basal transcription factors (38). The CBP interaction can be prevented by pocket proteins that bind the same C-terminal region of E2Fs. E2F1–3 are known to interact primarily with pRb, E2F4 associates mainly with p107 and p130, whereas E2F5 is found mostly complexed with p130 (39,40). The binding of pocket proteins not only prevents E2F transactivation, but also leads to a repressed state by HDAC1 recruitment (41).
Interestingly, transcription factors Sp1 and E2F1 are synergistic in activation of the dihydrofolate reductase (42) and thymidine kinase genes (43,44) and have a cooperative repressive role in regulation of the cyclin D1 promoter (45). Sp1 and E2F1 also physically interact to form an activated complex in a cell cycle-dependent manner (43).
We cloned the gene for the human pol ɛ B-subunit (POLE2) and studied the regulation of its expression in cells induced to proliferate. We show that mitogenic activation of the POLE2 promoter is reminiscent of other proliferation-related genes, while regulation of the basal promoter activity is unique. Furthermore, we present a model for the roles of Sp1, NF-1, E2F and pocket proteins in these regulatory processes.
MATERIALS AND METHODS
Cell lines and cultivation
HeLa S3 cells (ATCC CCL2.2) were cultivated in suspension as ‘spinner cells’ in Joklik’s modification of minimal essential medium (Flow Laboratories) supplemented with sodium bicarbonate and 5% calf serum. Attached HeLa cells (ATCC CCL2) and NIH 3T3 cells (ATCC CRL 1658) were cultured in Dulbecco’s modified Eagle’s medium (Gibco BRL) supplemented with 10% fetal bovine serum. IMR-90 cells (ATCC CCL 186) were cultivated as monolayers in minimal essential medium (Gibco BRL) supplemented with Earle’s salts and non-essential amino acids. All media contained 2 mM glutamax-I, 100 U/ml penicillin and 100 µg/ml streptomycin.
Ribonuclease protection assay
Total RNA was isolated from cultivated cells with TRIzol LS reagent (Gibco BRL). For the ribonuclease protection assay, 10 µg total RNA was hybridized and the assay was performed with a RPA III RNase Protection Assay Kit (Ambion). cDNA templates for the human pol ɛ catalytic A-subunit, cytoplasmic β-actin and histone H3 were used to prepare antisense RNA probes for RNase protection assays as described (11). The template for the human pol ɛ B-subunit was a 213 bp fragment, representing nucleotides 606–819 of the cDNA (GenBank accession no. AF036899).
Determination of the exon–intron organization
The human BAC clone BACH-247, which contains the POLE2 gene, was identified by PCR screening from a human BAC library (BAC-5331; Genome Systems) and used to determine the organization of the gene. Exon–intron boundaries were sequenced directly from the BAC clone and the sizes of the introns were determined by sequencing, PCR amplification and/or restriction mapping. DNA sequencing was performed by automated sequencing using a BigDye Terminator Cycle Sequencing Ready Reaction Kit (PE Applied Biosystems). For restriction mapping of the BAC clone, the insert was first released by digestion with NotI, resulting in a 145 kb 5′-terminal fragment and a 23 kb 3′-terminal fragment. The inserts were subsequently digested both partially and completely with restriction enzymes. The digested samples were separated in a 1.0% agarose gel by pulsed field gel electrophoresis using the CHEF Mapper XA system (Bio-Rad). After electrophoresis, the DNA was transferred to a Hybond-N nylon membrane (Amersham) and hybridized with 32P-labeled probes (200–260 bp) derived from the vector sequence flanking either the 5′- or 3′-terminus of the insert.
Identification of the transcription initiation site
The transcription initiation sites of the gene were identified by primer extension analysis. The primer was end-labeled with 32P using T4 polynucleotide kinase (Pharmacia) and annealed to HeLa S3 mRNA for 2 h at 65°C. Primer extension was performed at 42°C for 30 min and then at 52°C for another 30 min using the AMV Reverse Transcriptase Primer Extension System (Promega). The transcription initiation sites were determined by comparison of the extension products to a sequence ladder. The transcription initiation sites were verified by RT–PCR analysis using an antisense primer for first strand cDNA synthesis. The cDNA was then used as a template for PCR amplification. The amplified products were subcloned and sequenced.
Serum starvation of cells
For studying the dependence of the steady-state mRNA levels on the proliferative state of cells, a serum starvation assay was performed with IMR-90 cells at 14 doubling passages as described (11). For determination of promoter activity in serum-starved and growth-induced cells, 3 × 10⁵ NIH 3T3 cells were cultivated for 20 h on 28 cm2 plates, transfected with selected promoter constructs and allowed to grow overnight. The cells were then starved for 70 h in medium containing only 0.5% fetal bovine serum and re-stimulated to proliferate by elevating the serum concentration to 15%. DNA synthesis in the cells was monitored by incorporation of [3H]thymidine in parallel cell cultures on 8.7 cm2 plates (11).
Cell synchronization and counterflow centrifugal elutriation
Synchronization of cells by nocodazole and double thymidine block and measurement of the respective DNA syntheses in cells were performed as described previously (11). Log phase HeLa S3 cells were fractionated by counterflow centrifugal elutriation in a Beckman JE-5.0 elutriator rotor with constant rotor speed and increasing flow rate. Aliquots of 1.0 × 10⁶ cells were stained with propidium iodide (46) and analyzed by flow cytometry (Becton Dickinson). The distribution of cells into different stages of the cell cycle was estimated using the rectangular method (47).
Deletion/site-mutated constructs, transfection and promoter activity
An ∼1.1 kb genomic fragment, including the 5′-flanking sequence and exon 1, was first subcloned into a pGL3-Basic luciferase reporter vector (Promega) which was double-digested with XhoI and HindIII. The construct was then used as a template for PCR amplification to produce a series of deletion constructs. Site-mutated constructs were derived from the corresponding deletion constructs by introducing mutated nucleotides with a PCR-based method.
Construct DNAs were purified with a Qiagen plasmid purification kit for transfection assays, which were performed using the FuGENE 6 transfection reagent (Boehringer Mannheim). The deletion/site-mutated constructs (2.0 µg) were transfected onto 28 cm2 plates of logarithmically growing HeLa CCL2 cells. A pSV-β-galactosidase vector (Promega) (0.5 µg) was included as an internal control in each transfection. The cells were harvested 30 h after transfection and the cell extracts were then prepared for determination of the luciferase and β-galactosidase activities using reporter assay systems (Boehringer Mannheim). The luciferase activity was normalized to the β-galactosidase activity.
Electrophoretic mobility shift assay (EMSA)
EMSA was performed with nuclear extracts and 32P-end-labeled restriction fragment probes (Fig. 7A). Nuclear extracts from asynchronous/synchronized HeLa S3 cells were prepared as described (48). IMR-90 fibroblasts were synchronized by serum starvation and re-stimulation as described above. The late G1-specific nuclear extract was prepared at 15 h after the addition of serum just before the start of DNA synthesis. A 20 µl binding reaction for EMSA contained 3 µg nuclear extract, 10 mM Tris–HCl, pH 7.5, 50 mM NaCl, 5 mM MgCl2, 0.5 mM DTT, 4% glycerol and 0.5 µg poly(dI·dC)-poly(dI·dC) as a non-specific DNA. The reaction mixtures were incubated for 5 min at room temperature before addition of the probe (0.65 ng). The mixtures were then incubated for an additional 30 min and stopped by addition of 10× loading buffer (250 mM Tris–HCl, pH 7.5, 0.2% BPB, 40% glycerol). For competition experiments, unlabeled double-stranded oligonucleotide competitors were added 15 min before addition of the probe. Prior to use the competitors were annealed in an annealing buffer (20 mM Tris–HCl, pH 7.5, 5 mM MgCl2, 0.1 mM DTT, 0.01 mM EDTA) for 10 min at 70°C and then left at room temperature for an additional 30 min. Antibodies (Santa Cruz) used in the supershift assays were E2F1 (C-20), E2F2 (C-20), E2F3 (N-20), E2F4 (C-20), E2F5 (E-19), NF-1 (N-20), p107 (SD9), p130 (C-20), pRb (C-15) and Sp1 (1C6). Antibody (0.5–2.0 µg) was added to the reaction mixture after the probe and incubated for 2 h at 4°C. The samples were finally resolved in a 4% polyacrylamide gel in 0.25× TBE buffer.
Figure 7.


Characterization of the nuclear proteins binding to the POLE2 promoter by EMSA. (A) A schematic representation of probes and competitor oligonucleotides used. The putative binding elements of the transcription factors are indicated. The mutated nucleotides in the Sp1 (GGCG→aGCt), E2F (a/b)/NF-1(a) (CG→ta), E2F(b)/NF-1(a) (CAA→tAc), E2F(c) (CAA→tAc) and E2F(d)/NF-1(b) (GGC→cat) elements used in competitor oligonucleotides are shown in bold. (B) The existence of two separate DNA–protein complexes, core promoter (cp) and downstream (dr) complex, as indicated by competition assay. EMSA was performed with an end-labeled probe containing nucleotides +101 to +254 (long probe) and HeLa nuclear extract. Unlabeled competitor oligonucleotides were used in 500-fold molar excess. Note that the promoter complex containing the cp complex migrates faster when the dr complex is competed out. (C) The identities of the transcription factors binding to the core promoter and the downstream region were examined by supershift assay. EMSA was performed with either the short probe (left) or long probe (right) and HeLa nuclear extract. Specific antibodies against E2F2, E2F4, p107 and Sp1 caused supershifts of the core promoter complex as denoted by arrows. Similarly, antibodies against E2F1, pRb and NF-1 retarded the complexes binding to the downstream region. (D) Core promoter complex formation in vitro was more efficient in extracts from G1 than from G0 nuclei. EMSA was performed with the core promoter (short) probe and nuclear extract prepared from asynchronous G0 or G1 IMR-90 cells. The latter two were from serum-deprived and re-stimulated fibroblasts as described in Materials and Methods.
DNase I footprinting assay
DNase I footprinting analysis was performed using a SureTrack Footprinting Kit (Amersham Pharmacia Biotech). The promoter DNA containing nucleotides +101 to +254, along with a short 3′- or 5′-flanking vector sequence, was isolated from B6 by digestion with XhoI/NcoI or MluI/HindIII, respectively. These two substrate DNAs were treated with calf intestinal alkaline phosphatase, gel purified and labeled at the 5′-end by T4 polynucleotide kinase. The vector sequences of the end-labeled DNAs were removed by treatment with HindIII or XhoI, respectively. The resulting DNA fragments labeled only at one end were purified on a 5% polyacrylamide gel in TBE buffer. The purified probes (20 000 c.p.m.) were incubated with 10 µg nuclear extract from asynchronous HeLa S3 cells or with BSA solution. All binding reactions contained poly(dI·dC)-poly(dI·dC) as non-specific competitor. Unlabeled probe was used for specific competition as indicated in Figure 8. Digestion with DNase I (2–4 U for nuclear extract and 1 U for BSA-containing reactions) was performed according to the instructions with the kit.
Figure 8.


In vitro DNase I footprint analysis of POLE2 promoter DNA. Single-end 32P-labeled POLE2 DNA was incubated with nuclear extracts from asynchronous HeLa S3 cells and then digested with various amounts of DNase I. The protected cis-acting elements indicated on the left were determined by comparison with the sequencing G+A ladder. NE, nuclear extracts; BSA, bovine serum albumin, used as a negative control. Unlabeled probe was added in molar excess (120 ng) as a specific competitor. (A) Analysis of the sense strand POLE2 promoter DNA. (B) Analysis of the antisense strand POLE2 promoter DNA.
RESULTS
The transcription initiation sites and genomic organization of human POLE2
Primer extension analysis revealed multiple transcription initiation sites of POLE2 (Fig. 1). Initiation sites were also mapped by RT–PCR analysis. Products could be amplified only with sense primers from the putative exon 1 representing the region expected to be transcribed, but not with a sense primer from the region predicted to be a 5′-flanking, non-transcribed region (data not shown). The results are consistent with those obtained by primer extension analysis and exclude the possibility of additional introns upstream. However, the presence of an additional initiation site(s) further downstream cannot be ruled out. Since the multiple initiation sites and/or alternative splicing could result in numerous forms of mRNA, northern analysis was performed. Only ∼1.8 kb mRNA was detected (data not shown). This size is in agreement with the combined length of the exons, suggesting that alternatively spliced forms differing significantly in size do not exist. A consensus sequence GCTCC (C/G) of a recently described multiple start site element downstream (MED-1) is located downstream of the mapped transcription initiation sites (Fig. 1). This element is common in TATA-less promoters with multiple transcription initiation sites (49).
Figure 1.

Nucleotide sequence and putative regulatory elements of the promoter region of POLE2. The putative binding elements for the transcription factors were identified using the MatInspector V2.2 program (64) in conjunction with the Transfac Matrix Table V3.3 database except for the variant E2F elements (a) and (d) that were not identified by MatInspector V2.2 (35,36). Locations of all elements are underlined, the elements on the complementary strand indicated by italics and the elements that were studied by bold letters. The transcription initiation sites were determined by primer extension and RT–PCR and are indicated by arrowheads in the figure. The translation start site (ATG) is boxed. The intron sequence is shown in lower case. The multiple start site element downstream (MED-1) is indicated by a dashed line.
A human BAC clone was used to determine genomic organization. The gene is divided into 19 exons and 18 introns spanning at least 37 kb. All the intron–exon junctions match well with the reported consensus sequence (GT/AG) with the exception of intron 8, which belongs to a rare U12 class of introns with AT-AC at their termini. These introns contain divergent, but highly conserved, splicing signal sequences when compared to those of the common GT-AG introns. The U12 type introns also contain a well-conserved branch site, whose consensus sequence (caaCtTTAATCT) is present in intron 8 of POLE2. The U12-dependent pre-mRNA splicing machinery has been described in cells from mammals and other higher organisms (50). The sizes of exons of POLE2 range from 49 to 245 bp and introns from 87 bp to 5.3 kb. The 5′-flanking region and exon 1 are very G+C rich. This region is covered by a 1034 bp CpG island (data not shown) and it lacks a consensus TATA box upstream of the transcription initiation sites. More than 15 potential consensus binding elements for several transcription factors, including Sp1, E2F and NF-1, were identified in the 5′-flanking region and in exon 1 (Fig. 1).
The proliferation dependence of expression of human POLE2
Proliferation dependence of the expression of POLE2 was studied by analyzing steady-state mRNA levels when serum-deprived (quiescent) cells were returned to the cycle by the addition of serum. The level of POLE2 message started to increase at 10 h and reached its 4.8-fold maximum level 22 h after addition of serum. This expression profile is similar to the profile of the pol ɛ catalytic A-subunit (POLE1) mRNA (11) and precedes histone H3 mRNA expression (51) and DNA synthesis (Fig. 2). A similar dependence on cell proliferation has been reported for mouse POLA2, which encodes the 68 kDa B-subunit of DNA pol α (12).
Figure 2.

Expression of POLE2 is proliferation dependent. Steady-state mRNA levels of POLE2 were measured by the RNase protection assay. IMR-90 fibroblasts in a quiescent state induced by serum deprivation were stimulated to re-enter the cell cycle by addition of serum. Total RNA samples were isolated for RNase protection assay at the times indicated. The level of DNA synthesis in vivo was determined in parallel cultures for each time point. The mRNA levels for POLE1, β-actin and histone H3 were studied as controls.
Expression of POLE2 during the cell cycle was studied by measuring the mRNA level in cells synchronized with chemicals or fractionated by counterflow centrifugal elutriation. When IMR-90 cells synchronized to S phase by a double thymidine block were released, DNA synthesis resumed and peaked at 4 h. At 15 h the cells started to enter S phase again and DNA synthesis peaked again around 20 h. During this time, the steady-state mRNA levels of POLE2 varied only a little, being highest during DNA synthesis (Fig. 3A). In a similar manner, nocodazole-synchronized (Fig. 3B) and elutriated HeLa S3 cells (Fig. 3C) showed only minor variation in the level of the mRNA during the cycle. In both cases the mRNA levels fluctuated <2-fold, with the highest levels in late G1 and early S phase (Fig. 3B and C).
Figure 3.


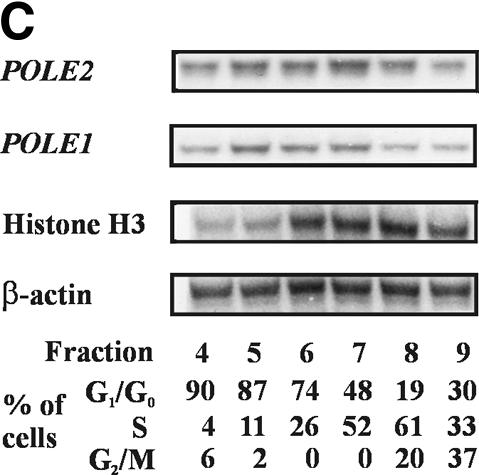
Expression of POLE2 shows only minor fluctuations during the cell cycle. (A) Steady-state mRNA levels of POLE2 from IMR-90 cells synchronized by the double thymidine block method. Cells arrested by double thymidine block were released by removing the thymidine and RNA samples were isolated at the time points shown. The mRNA levels of POLE1, β-actin and histone H3 were studied as controls. DNA synthesis activity in vivo was determined in parallel cultures from each time point. (B) Steady-state mRNA levels of POLE2 from HeLa S3 cells synchronized with nocodazole. Cells grown in suspension were arrested with nocodazole and released by removing the nocodazole. The DNA synthesis activity in vivo at the time points shown was determined and presented as described above. (C) Steady-state mRNA levels of POLE2 from HeLa S3 cells fractionated by counterflow centrifugal elutriation. Cell cycle distribution of the fractions was analyzed by flow cytometry. RNA samples from each fraction were analyzed by RNase protection assay.
Taken together, these results indicate that expression of POLE2 is growth dependent and induced at the G1/S boundary when serum-deprived cells enter the cell cycle, while in cycling cells, the gene is almost constitutively expressed with only minor induction at the G1/S boundary. Expression profiles from these studies are similar to those of POLE1 (11).
Determination of the human POLE2 core promoter region
To determine the core promoter region of POLE2, a series of deletion constructs within the putative promoter region from nucleotides –858 to +254 were created using the pGL3-Basic luciferase reporter plasmid. The promoter activity of each construct was then evaluated by luciferase assay of cell extracts from transfected HeLa cells (Fig. 4). The longest construct containing nucleotides –858 to +254 (B1) and the construct containing nucleotides –360 to +254 (B2) showed equally high promoter activities. Further 5′ deletion (constructs B3–B6) increased the promoter activity from 149 (B3) up to 238% (B6). In the latter construct, the 5′-terminus was deleted to nucleotide +101. The results suggest that the region between nucleotides –858 and –360 is not important for promoter activity and that the region between nucleotides –360 and +101 contains a down-regulation element(s). Further 5′ deletion to position +146 (B7) or +173 (B8) almost completely abolished promoter activity. A putative Sp1 element located at nucleotides +140 to +152 (Fig. 1) was disrupted in those constructs, suggesting that it is required for promoter activity. On the other hand, a 3′ deletion of construct B4 to nucleotide +175 (B9) increased promoter activity from 129 to 227%, suggesting that at least one down-regulation element is present between nucleotides +175 and +254. Two putative E2F elements and a putative NF-1 element are located in this region (Fig. 1). Further 3′ deletion of B4 to nucleotide +152 (B10) reduced promoter activity to 81%. This deletion removed three more putative transcription factor-binding elements, two E2F elements and an NF-1 element. Further 3′ deletion to nucleotide +126 (B11) abolished promoter activity. This construct lacks the putative Sp1 element. The deletion analysis performed suggests that the core promoter region is between nucleotides +101 and +175. Consequently, a deletion construct (B12) containing this region was prepared. The promoter activity of this construct was as high as 171%, indicating that the core promoter was, indeed, in the predicted region. This region contains a putative Sp1 element, two putative E2F elements and a putative NF-1 element. These could thereby be critical cis-acting elements for regulation of POLE2. Surprisingly, the inverted construct B4reverse showed 667% promoter activity when compared to that of B1 (Fig. 4), suggesting bidirectionality of the POLE2 promoter. There are several examples of reverse oriented genes which have overlapping promoters, such as BRCA1/NBR2, DHFR/REP3 and RanBP1/Htf9c (52–54). The significance of the reverse promoter remains to be explored.
Figure 4.

The deletion constructs of the putative POLE2 promoter region and their relative promoter activities in asynchronous HeLa cells. A series of deletion constructs fused to the pGL3-Basic luciferase reporter plasmid were analyzed by transient transfection of cycling HeLa CCL2 cells. Luciferase activity was normalized to β-galactosidase activity. The promoter activity of construct B1 containing the longest promoter insert is taken to be 100%. Values are the means of at least five independent experiments, each run in duplicate. The transcriptional orientation is indicated by an arrow on each construct. The Basic and Control vectors were used as negative and positive controls, respectively. The transcription initiation sites (arrowheads) and elements studied are indicated on the promoter sequence (Fig. 1).
Roles of cis-acting elements in promoter activity
Since putative Sp1 and E2F/NF-1 elements seemed to be critical for regulation of POLE2, co-transfection with a Sp1 expression plasmid and element mutation assays were performed. In the co-transfection assay, several deletion constructs were co-transfected into HeLa cells either with a human Sp1 expression plasmid or with the corresponding control vector. Co-transfection with a Sp1 plasmid induced the promoter activity of all constructs examined from 1.8- (B10) to 3.6-fold (B1) (Fig. 5A). These included the construct B12, which contains only the core promoter region. The results strongly suggest that Sp1 regulates POLE2 through the Sp1 element of the core promoter region. Indeed, two nucleotide mutations in the putative Sp1 element of constructs B1 and B9 reduced the promoter activities to 9 and 6%, respectively (Fig. 5B), confirming that the Sp1 element in the core promoter region is a critical determinant for POLE2 regulation. Point mutations in the E2F/NF-1 element(s) of B9 had a less severe effect, the promoter activity decreasing to 52–78% (Fig. 5B). Finally, mutations in both the Sp1 and E2F(b) elements completely abolished the promoter activity (<3%). These results indicate that in addition to Sp1, an E2F/NF-1 element(s) is also required for full promoter activity.
Figure 5.


cis elements critical for POLE2 promoter activity. (A) Co-transfection assay with Sp1 expression vector. Each deletion construct (2.0 µg) was co-transfected into cycling HeLa CCL2 cells on 28 cm2 dishes with either the human Sp1 expression vector plasmid (pEVR2/Sp1, 0.5 µg) or a control expression vector missing the Sp1 cDNA insert (pEVR2/0, 0.5 µg). The cell extracts were prepared to measure luciferase activity 30 h after transfection. Activation of the different deletion constructs by Sp1 was evaluated by comparing relative luciferase activity in the presence of pEVR2/Sp1, which expresses Sp1, to those obtained in the presence of pEVR2/0, which does not. Values are the means of four independent experiments, each run in duplicate. (B) Site mutation analysis. Promoter activities of the site-mutated constructs were analyzed by transient transfection of cycling HeLa CCL2 cells. Luciferase activity was normalized to β-galactosidase activity. Values are the means of five independent experiments, each run in duplicate. The sequence and the elements studied in the site-mutated region of the constructs are shown on the left. The mutated nucleotides are indicated by bold lower case letters.
To study whether growth regulation of POLE2 mRNA levels is dependent on the promoter region studied, constructs B1 and B12 were transfected into NIH 3T3 cells that were then growth-arrested by serum deprivation and re-stimulated into the cell cycle by serum. The stimulated cells were harvested for luciferase assays at various time points after serum addition. The promoter activities from the two constructs both began to rise at 6 h and peaked at 14 h after a 4- to 5-fold increase, similar to that found at the onset of DNA synthesis (Fig. 6A). These results indicate that promoter activity is induced at the G1/S boundary, like synthesis of the mRNA (Fig. 2), and that the mitogenic response is transcriptionally regulated and mediated by a cis-acting element(s) within the core promoter region.
Figure 6.


Serum stimulation of POLE2 is mediated by the E2F(a/b) element. (A) Relative promoter activities in serum-deprived NIH 3T3 cells stimulated to proliferate. Constructs B1 and B12 with different lengths of the POLE2 promoter sequence were examined for their response to serum stimulation in NIH 3T3 cells. The promoter and DNA synthesis activities in cells are presented as relative activities by taking the activities at the time of serum addition to be 1. (B) The E2F(a/b) cis element is required for full serum response in NIH 3T3 cells. The site-mutated constructs B9-E2F(a)-2nt and B9-E2F(b)-2nt were derived from construct B9, which was used as the control. The mutated sequences are shown in Figure 5B. The promoter activity and DNA synthesis in cells are presented as described above.
We then studied whether mutations in the E2F/NF-1 element(s) affected mitogenic regulation of the promoter. Indeed, mutations in both the E2F elements (E2F and E2F/NF-1 constructs) significantly diminished the serum-induced increase in promoter activity at the G1/S phase, being 14 and 26%, respectively, relative to the increase in the wild-type control B9 (Fig. 6B). The reduced response to serum is caused by an increase in promoter activity in serum-deprived cells rather than by a decrease in promoter activity in serum-induced cells. In serum-deprived cells, B9-E2F(a)-2nt and B9-E2F(b)-2nt showed 3.7- and 3.4-fold promoter activity, respectively, compared to that of the B9 control. These results strongly suggest that the element(s) E2F(a/b)/NF-1(a) is required for full serum response and that this is most likely due to alleviation of G0-specific repression.
Multiprotein complexes are involved in transcriptional regulation of human POLE2
To identify the transcription factors binding to the core promoter (cp) and the putative silencer region immediately downstream from the core promoter (hereafter downstream region or dr) an EMSA was employed. Overlapping E2F elements (a and b) as well as a putative NF-1 binding site (a) are located in the core promoter and are collectively called core promoter E2F/NF-1 elements. Similarly, E2F elements (c and d) and a NF-1 binding site (b) overlapping with E2F(d) are collectively called downstream region E2F/NF-1 elements (Fig. 7A). The probes covering nucleotides +101 to +175 (Fig. 7A, short probe) and nucleotides +101 to +254 (Fig. 7A, long probe) were used for these studies. Incubation of the long probe with the nuclear extract prepared from asynchronous HeLa cells led to formation of several DNA–protein complexes (Fig. 7B). The identities of these complexes were studied using a molar excess of wild-type or mutated unlabeled competitor oligonucleotides (Fig. 7A) and specific antibodies. The competition with wild-type oligonucleotides revealed two independent protein complexes, one binding to the core promoter and the other to a downstream region (Fig. 7B). Consistent results were obtained by DNase I footprinting analysis that showed protection of the core promoter Sp1 element and downstream region E2F/NF-1 element in both the sense and antisense strands, as well as protection of the core promoter E2F elements in the antisense strand (Fig. 8).
Anti-Sp1 antibody caused a supershift of the core promoter complex (Fig. 7C), confirming the presence of Sp1. Consistently, the oligonucleotide containing a mutated Sp1 element, either alone or together with a mutated E2F(b) element, was unable to compete in formation of the core promoter complex (Fig. 7B). Oligonucleotides missing the Sp1 element (Fig. 7A, oligonucleotides C5–C9) did not reveal any binding of a protein to the core promoter E2F/NF-1 element (Fig. 7B and data not shown). However, binding of E2F and pocket protein to the core promoter is obvious, because the E2F(b) mutation abolished the serum response (Fig. 6B) and anti-E2F2, anti-E2F4 and anti-p107 antibodies caused supershifts of the core promoter complex (Fig. 7C). Furthermore, the oligonucleotide with an Sp1 element but without the core promoter E2F/NF-1 element (Fig. 7A, C4) could not completely prevent formation of the core promoter complex as studied by EMSA (data not shown). Most likely this E2F–pocket protein binding is dependent on Sp1, and will be discussed below.
Mitogenic activation of the promoter was examined more closely from nuclear extracts of (i) logarithmically growing, (ii) serum-deprived and (iii) serum re-stimulated IMR-90 fibroblasts by EMSA. Clearly, extracts from serum-deprived (G0) cells contained far fewer proteins that were able to complex with the short probe containing the core promoter than extracts from G1 and asynchronous cells (Fig. 7D). However, the p107 complex formed in the G0 nuclear extract was relatively more abundant than in extracts from asynchronous or G1 cells (Fig. 7D). We were unable to detect supershifts with antibodies against E2F2, E2F4 or any other E2F species in fibroblast extracts, obviously due to the low abundance of the supershifted complexes. We also detected no binding of pRb or p130. Anti-Sp1 antibody caused a supershift that was weakly detectable both in G0 and G1 extracts (data not shown). Essentially similar results were obtained with the long probe (Fig. 7A) containing the downstream region (data not shown).
Next we asked what are the proteins in HeLa nuclear extract that bind to the region downstream from the core promoter? As shown in Figure 7B, a short oligonucleotide (Fig. 7A, C10) containing a downstream E2F/NF-1 element competed as efficiently as a longer oligonucleotide containing upstream elements (Fig. 7A, C5) for formation of the downstream complex. A mutation in the E2F(d)/NF-1(b) element completely abolished competition, whereas a mutation in E2F(c) had a minor effect. Specific antibodies against E2F1, NF-1, pRb, p107 and Sp1 caused supershifts of the downstream and core promoter complexes (Fig. 7C and data not shown). Interestingly no supershifts by anti-E2F2 or anti-E2F4 antibodies were observed (data not shown).
To study whether promoter occupancy changes during the cell cycle, oligonucleotide competition and antibody supershift EMSA were employed with nuclear extracts from nocodazole-synchronized HeLa cells and HeLa cells fractionated by counterflow centrifugal elutriation. The competition with oligonucleotides representing the core promoter or downstream region as well as supershifts with anti-Sp1, anti-E2F1, anti-p107 or anti-NF-1 remained unchanged throughout the cell cycle (data not shown).
DISCUSSION
We have revealed the structure and organization of the gene for the human DNA pol ɛ B-subunit (POLE2) and studied how its expression is regulated through the promoter. The 5′-flanking region and exon 1 are covered by a CpG island. The TATA-less core promoter was mapped between nucleotides +101 and +175 with a luciferase reporter assay using a series of deletion constructs. Surprisingly, critical regulatory elements are located downstream from observed transcription initiation sites. However, it cannot be excluded that there is a major transcription initiation site downstream that is not revealed by primer extension analysis due to the high G+C content.
The core promoter is necessary and sufficient both for full promoter activity and for serum response and it contains binding sites for transcription factors Sp1, E2F and NF-1. The structure of the promoter is reminiscent of promoters of the replicative DNA polymerase catalytic A-subunit genes and the mouse pol α B-subunit gene, suggesting a regulatory mechanism that is typical for genes encoding DNA replication proteins. The gene for the pol α A-subunit is induced in late G1 and its promoter is TATA-less and contains binding sites for Sp1, Ap1, Ap2, NF-1 and E2F (13). The promoters of genes for the human pol δ and pol ɛ A-subunits contain Sp1 and E2F binding sites and the genes are serum-responsive (16,17). The mouse pol α B-subunit gene (POLA2) contains two E-boxes and four E2F, four Sp1, an ATF, an Ap2 and a p53 binding site. The E-boxes bind transcription factor USF and are essential for constitutive promoter activity. The palindromic E2F site (–11/–3) and an additional E2F site downstream from the transcription initiation site (+9/+16) were essential for proliferation dependence and the latter element bound E2F4 abundantly in vitro. Overexpression of E2F1 activates POLA2 ∼15-fold. Intact Sp1 sites were not necessary for promoter activity (19).
The regulation of POLE2 is apparently similar to the regulation of genes for the DNA polymerase A-subunits. The central roles of transcription factors Sp1, E2F and NF-1 is supported by the following observations: (i) the promoter activity is dramatically reduced upon deletion/mutation of the Sp1 element and induced by co-transfection with a vector expressing Sp1; (ii) the serum response is dependent on the intact E2F(a/b) sequence; (iii) Sp1, E2F2/4 and p107 bind to the core promoter sequence and E2F1, pRb and NF-1 to the downstream region; and (iv) the consensus binding sites of the core promoter/downstream region are protected, as demonstrated by footprinting analysis.
Based on our results we propose a model for the regulation of POLE2 (Fig. 9), where two E2F–pocket protein complexes, a core promoter complex and a downstream complex repress transcription in quiescent cells, possibly in synergy with Sp1. Dissociation of these complexes and/or substitution by other members of the E2F and pocket protein families activates transcription in response to a mitogenic stimulus. The fact that the gel shifts observed remained unchanged and that formation of the corresponding core promoter complexes in vitro increased when serum-deprived cells were induced to proliferate makes substitution more likely. Interestingly, when the core promoter probe (nucleotides +101 to +175) was able to complex with E2F2 and E2F4 in vitro, a longer probe containing nucleotides from +101 to +254 was not. A simple explanation would be that the downstream complex, containing E2F1 and/or NF-1, masks the epitopes for anti-E2F2 and anti-E2F4 antibodies. However, it is intriguing to speculate that the downstream complex could modulate assembly of the core promoter complex in vitro, reflecting its obvious down-regulation property in vivo.
Figure 9.

A model of regulation of the POLE2 promoter. The region containing Sp1, E2F and NF1 elements is occupied by multiprotein complexes in both quiescent and cycling cells. A dramatic increase in promoter activity takes place during G0→G1. We propose that two E2F–pocket protein complexes repress transcription in quiescent cells, one containing p107 and the other pRb. After a mitogenic stimulus, cyclinD-Cdk4/6 phosphorylates the pocket proteins, disrupting these complexes. The level of promoter activity in cycling cells may result from modulation of species of bound E2Fs and pocket proteins. Sp1 is essential for promoter activity in cycling cells and may interact with E2F1 to form a repressive complex in quiescent cells.
Abundant p107 complex in serum-deprived fibroblasts and in cycling HeLa cells was unexpected, since p130, rather than p107, has been reported to be the predominant pocket protein in quiescent cells (55–57). Furthermore, the viral E7 oncoprotein that is present in HeLa cells has been reported to destabilize E2F–pocket protein complexes (58). Recent studies that utilize a chromatin immunoprecipitation assay have revealed that p107 can be bound to the promoter in G0 cells and that the promoter specificities between the different E2F and pocket protein species vary in vivo (57,59). On the other hand, although it is likely that p107 binds the core promoter through E2F, most likely E2F4, direct binding to Sp1 cannot be excluded (60). Whether p107 has a major role in maintenance of the repressed state of POLE2 in quiescent cells remains to be explored.
The organization and induction of the POLE2 promoter is somewhat similar to those of the cyclin D1 gene promoter (45). In trophoblastic cells and mouse embryonic fibroblasts, E2F1 mediates Sp1-dependent repression of the cyclin D1 promoter, while transactivation is due to E2F4. Binding of Sp1 and p107 but not of E2F1 to the cyclin D1 core promoter was demonstrated by EMSA. Importantly, repression by E2F1 was cell-specific and the promoter was found to be activated by E2F1 in MCF7 cells (61).
The structures of the B-subunits of replicative DNA polymerases are conserved from Archaea to humans (8), suggesting that they have a common fundamental function in DNA replication. The B-subunits of replicative DNA polymerases are essential for viability of yeast cells (4,5,62) and they are expressed in a proliferation-dependent manner in S.cerevisiae (6) and human pol ɛ (this study), as well as in mouse (12,19) and Drosophila (63) pol α. The genes for the B-subunits may be generally regulated through the E2F–pocket protein pathway, although adjustment of the basal activity may be achieved by distinct transcription factors (19; this report).
Acknowledgments
ACKNOWLEDGEMENTS
The human Sp1 expression vector was a gift of Dr Suske (Institut für Molekularbiologie und Tumorforschung, Marburg, Germany). This work was supported by grants from the Academy of Finland.
DDBJ/EMBL/GenBank accession nos AF387021–AF387034
References
- 1.Burgers P.M. (1998) Eukaryotic DNA polymerases in DNA replication and DNA repair. Chromosoma, 107, 218–227. [DOI] [PubMed] [Google Scholar]
- 2.Hübscher U., Nasheuer,H.-P. and Syväoja,J.E. (2000) Eukaryotic DNA polymerases, a growing family. Trends Biochem. Sci., 25, 143–147. [DOI] [PubMed] [Google Scholar]
- 3.Wang T.S.-F. (1996) Cellular DNA polymerases. In Depamphilis,M.L. (ed.), DNA Replication in Eukaryotic Cells. Cold Spring Harbor Laboratory Press, Cold Spring Harbor, NY, pp. 461–493.
- 4.Foiani M., Marini,F., Gamba,D., Lucchini,G. and Plevani,P. (1994) The B subunit of the DNA polymerase alpha-primase complex in Saccharomyces cerevisiae executes an essential function at the initial stage of DNA replication. Mol. Cell. Biol., 14, 923–933. [DOI] [PMC free article] [PubMed] [Google Scholar]
- 5.Hashimoto K., Nakashima,N., Ohara,T., Maki,S. and Sugino,A. (1998) The second subunit of DNA polymerase III (delta) is encoded by the HYS2 gene in Saccharomyces cerevisiae. Nucleic Acids Res., 15, 477–485. [DOI] [PMC free article] [PubMed] [Google Scholar]
- 6.Araki H., Hamatake,R.K., Johnston,L.H. and Sugino,A. (1991) DPB2, the gene encoding DNA polymerase II subunit B, is required for chromosome replication in Saccharomyces cerevisiae. Proc. Natl Acad. Sci. USA, 88, 4601–4605. [DOI] [PMC free article] [PubMed] [Google Scholar]
- 7.Voitenleitner C., Rehfuess,C., Hilmes,M., O’Rear,L., Liao,P.C., Gage,D.A., Ott,R., Nasheuer,H.-P. and Fanning,E. (1999) Cell cycle-dependent regulation of human DNA polymerase alpha-primase activity by phosphorylation. Mol. Cell. Biol., 19, 646–656. [DOI] [PMC free article] [PubMed] [Google Scholar]
- 8.Mäkiniemi M., Pospiech,H., Kilpeläinen,S., Jokela,M., Vihinen,M. and Syväoja,J.E. (1999) A novel family of DNA-polymerase-associated B subunits. Trends Biochem. Sci., 24, 14–16. [DOI] [PubMed] [Google Scholar]
- 9.Wahl A.F., Geis,A.M., Spain,B.H., Wong,S.W., Korn,D. and Wang,T.F. (1988) Gene expression of human DNA polymerase alpha during cell proliferation and the cell cycle. Mol. Cell. Biol., 8, 5016–5025. [DOI] [PMC free article] [PubMed] [Google Scholar]
- 10.Yang C.L., Chang,L.S., Zhang,P., Hao,H., Zhu,L., Toomey,N.L. and Lee,M.Y. (1992) Molecular cloning of the cDNA for the catalytic subunit of human DNA polymerase delta. Nucleic Acids Res., 20, 735–745. [DOI] [PMC free article] [PubMed] [Google Scholar]
- 11.Tuusa J., Uitto,L. and Syväoja,J.E. (1995) Human DNA polymerase epsilon is expressed during cell proliferation in a manner characteristic of replicative DNA polymerases. Nucleic Acids Res., 23, 2178–2183. [DOI] [PMC free article] [PubMed] [Google Scholar]
- 12.Miyazawa H., Izumi,M., Tada,S., Takada,R., Masutani,M., Ui,M. and Hanaoka,F. (1993) Molecular cloning of the cDNAs for the four subunits of mouse DNA polymerase alpha-primase complex and their gene expression during cell proliferation and the cell cycle. J. Biol. Chem., 268, 8111–8122. [PubMed] [Google Scholar]
- 13.Pearson B.E., Nasheuer,H.-P. and Wang,T.S.-F. (1991) Human DNA polymerase alpha gene: sequences controlling expression in cycling and serum-stimulated cells. Mol. Cell. Biol., 11, 2081–2095. [DOI] [PMC free article] [PubMed] [Google Scholar]
- 14.Sala A., Nicolaides,N.C., Engelhard,A., Bellon,T., Lawe,D.C., Arnold,A., Grana,X., Giordano,A. and Calabretta,B. (1994) Correlation between E2F-1 requirement in the S phase and E2F-1 transactivation of cell cycle-related genes in human cells. Cancer Res., 54, 1402–1406. [PubMed] [Google Scholar]
- 15.Chang L.-S., Zhao,L., Zhu,L., Chen,M.-L. and Lee,M.Y.W.T. (1995) Structure of the gene for the catalytic subunit of human DNA polymerase delta (POLD1). Genomics, 28, 411–419. [DOI] [PubMed] [Google Scholar]
- 16.Zhao L. and Chang,L.S. (1997) The human POLD1 gene. Identification of an upstream activator sequence, activation by Sp1 and Sp3 and cell cycle regulation. J. Biol. Chem., 272, 4869–4882. [PubMed] [Google Scholar]
- 17.Huang D., Pospiech,H., Kesti,T. and Syväoja,J.E. (1999) Structural organization and splice variants of the POLE1 gene encoding the catalytic subunit of human DNA polymerase epsilon. Biochem. J., 339, 657–665. [PMC free article] [PubMed] [Google Scholar]
- 18.Huang D., Knuuti,R., Palosaari,H., Pospiech,H. and Syväoja,J.E. (1999) cDNA and structural organization of the gene POLE1 for the mouse DNA polymerase epsilon catalytic subunit. Biochim. Biophys. Acta, 1445, 363–371. [DOI] [PubMed] [Google Scholar]
- 19.Nishikawa N.S., Izumi,M., Uchida,H., Yokoi,M., Miyazawa,H. and Hanaoka,F. (2000) Cloning and characterization of the 5′-upstream sequence governing the cell cycle-dependent transcription of mouse DNA polymerase alpha 68 kDa subunit gene. Nucleic Acids Res., 28, 1525–1534. [DOI] [PMC free article] [PubMed] [Google Scholar]
- 20.Azizkhan J.C., Vaughn,J.P., Christy,R.J. and Hamlin,J.L. (1986) Nucleotide sequence and nuclease hypersensitivity of the Chinese hamster dihydrofolate reductase gene promoter region. Biochemistry, 25, 6228–6236. [DOI] [PubMed] [Google Scholar]
- 21.Chen M.J., Shimada,T., Moulton,A.D., Cline,A., Humphries,R.K., Maizel,J. and Nienhuis,A.W. (1984) The functional human dihydrofolate reductase gene. J. Biol. Chem., 259, 3933–3943. [PubMed] [Google Scholar]
- 22.Flemington E., Bradshaw,H.D.,Jr, Traina-Dorge,V., Slagel,V. and Deininger,P.L. (1987) Sequence, structure and promoter characterization of the human thymidine kinase gene. Gene, 52, 267–277. [DOI] [PubMed] [Google Scholar]
- 23.Gudas J.M., Fridovich-Keil,J.L., Datta,M.W., Bryan,J. and Pardee,A.B. (1992) Characterization of the murine thymidine kinase-encoding gene and analysis of transcription start point heterogeneity. Gene, 118, 205–216. [DOI] [PubMed] [Google Scholar]
- 24.Ash J., Liao,W.C., Ke,Y. and Johnson,L.F. (1995) Regulation of mouse thymidylate synthase gene expression in growth-stimulated cells: upstream S phase control elements are indistinguishable from the essential promoter elements. Nucleic Acids Res., 23, 4649–4656. [DOI] [PMC free article] [PubMed] [Google Scholar]
- 25.Chen X. and Prywes,R. (1999) Serum-induced expression of the cdc25A gene by relief of E2F-mediated repression. Mol. Cell. Biol., 19, 4695–4702. [DOI] [PMC free article] [PubMed] [Google Scholar]
- 26.Motokura T. and Arnold,A. (1993) PRAD1/cyclin D1 proto-oncogene: genomic organization, 5′ DNA sequence and sequence of a tumor-specific rearrangement breakpoint. Genes Chromosom. Cancer, 7, 89–95. [DOI] [PubMed] [Google Scholar]
- 27.Ohtani K., DeGregori,J. and Nevins,J.R. (1995) Regulation of the cyclin E gene by transcription factor E2F1. Proc. Natl Acad. Sci. USA, 92, 12146–12150. [DOI] [PMC free article] [PubMed] [Google Scholar]
- 28.Henglein B., Chenivesse,X., Wang,J., Eick,D. and Brechot,C. (1994) Structure and cell cycle-regulated transcription of the human cyclin A gene. Proc. Natl Acad. Sci. USA, 91, 5490–5494. [DOI] [PMC free article] [PubMed] [Google Scholar]
- 29.Hatebor G., Wobst,A., Petersen,B., LeCam,L., Vigo,E., Sardet,C. and Helin,K. (1998) Cell cycle-regulated expression of mammalian CDC6 is dependent on E2F. Mol. Cell. Biol., 18, 6679–6697. [DOI] [PMC free article] [PubMed] [Google Scholar]
- 30.Ohtani K., DeGregori,J., Leone,G., Herendeen,D.R., Kelly,T.J. and Nevins,J.R. (1996) Expression of the HsOrc1 gene, a human ORC1 homolog, is regulated by cell proliferation via the E2F transcription factor. Mol. Cell. Biol., 16, 6977–6984. [DOI] [PMC free article] [PubMed] [Google Scholar]
- 31.Fry C.J. and Farnham.P.J. (1999) Context-dependent transcriptional regulation. J. Biol. Chem., 274, 29583–29586. [DOI] [PubMed] [Google Scholar]
- 32.Doetzlhofer A., Rotheneder,H., Lagger,G., Koranda,M., Kurtev,V., Brosch,G., Winterberger,E. and Seiser,C. (1999) Histone deacetylase 1 can repress transcription by binding to Sp1. Mol. Cell. Biol., 19, 5504–5511. [DOI] [PMC free article] [PubMed] [Google Scholar]
- 33.Lavia P. and Jansen-Durr,P. (1999) E2F target genes and cell-cycle checkpoint control. Bioessays, 21, 221–230. [DOI] [PubMed] [Google Scholar]
- 34.Nevins J.R. (1992) E2F: a link between the Rb tumor suppressor protein and viral oncoproteins. Science, 258, 424–429. [DOI] [PubMed] [Google Scholar]
- 35.Tao Y., Kassatly,R.F., Cress,W.D. and Horowitz,J.M. (1997) Subunit composition determines E2F DNA-binding site specificity. Mol. Cell. Biol., 17, 6994–7007. [DOI] [PMC free article] [PubMed] [Google Scholar]
- 36.Zheng N., Fraenkel,E., Pabo,C.O. and Pavletich,N.P. (1999) Structural basis of DNA recognition by the heterodimeric cell cycle transcription factor E2F-DP. Genes Dev., 13, 666–674. [DOI] [PMC free article] [PubMed] [Google Scholar]
- 37.Leone G., DeGregori,J., Yan,Z., Jakoi,L., Ishida,S., Williams,R.S. and Nevins,J.R. (1998) E2F3 activity is regulated during the cell cycle and is required for the induction of S phase. Genes Dev., 12, 2120–2130. [DOI] [PMC free article] [PubMed] [Google Scholar]
- 38.Fry C.J., Pearson,A., Malinowski,E., Bartley,S.M., Greenblatt,J. and Farnham,P.J. (1999) Activation of the murine dihydrofolate reductase promoter by E2F1. A requirement for CBP recruitment. J. Biol. Chem., 274, 15883–15891. [DOI] [PubMed] [Google Scholar]
- 39.Cobrinik D., Lee,M.H., Hannon,G., Mulligan,G., Bronson,R.T., Dyson,N., Harlow,E., Beach,D., Weinberg,R.A. and Jacks,T. (1993) Shared role of the pRB-related p130 and p107 proteins in limb development. Genes Dev., 10, 1633–1644. [DOI] [PubMed] [Google Scholar]
- 40.Schwarz J.K., Devoto,S.H., Smith,E.J., Chellappan,S.P., Jakoi,L. and Nevins,J.R. (1993) Interactions of the p107 and Rb proteins with E2F during the cell proliferation response. EMBO J., 12, 1013–1020. [DOI] [PMC free article] [PubMed] [Google Scholar]
- 41.Ferreira R., Magnaghi-Jaulin,L., Robin,P., Harel-Bellan,A. and Trouche,D. (1998) The three members of the pocket proteins family share the ability to repress E2F activity through recruitment of a histone deacetylase. Proc. Natl Acad. Sci. USA, 95, 10493–10498. [DOI] [PMC free article] [PubMed] [Google Scholar]
- 42.Lin S.Y., Black,A.R., Kostic,D., Pajovic,S., Hoover,C.N. and Azizkhan,J.C. (1996) Cell cycle-regulated association of E2F1 and Sp1 is related to their functional interaction. Mol. Cell. Biol., 16, 1668–1675. [DOI] [PMC free article] [PubMed] [Google Scholar]
- 43.Karlseder J., Rotheneder,H. and Wintersberger,E. (1996) Interaction of Sp1 with the growth- and cell cycle-regulated transcription factor E2F. Mol. Cell. Biol., 16, 1659–1667. [DOI] [PMC free article] [PubMed] [Google Scholar]
- 44.Rotheneder H., Geymayer,S. and Haidweger,E. (1999) Transcription factors of the Sp1 family: interaction with E2F and regulation of the murine thymidine kinase promoter. J. Mol. Biol., 293, 1005–1015. [DOI] [PubMed] [Google Scholar]
- 45.Watanabe G., Albanese,C., Lee,R.J., Reutens,A., Vairo,G., Henglein,B. and Pestell,R.G. (1998) Inhibition of cyclin D1 kinase activity is associated with E2F-mediated inhibition of cyclin D1 promoter activity through E2F and Sp1. Mol. Cell. Biol., 18, 3212–3222. [DOI] [PMC free article] [PubMed] [Google Scholar]
- 46.Vindelöv L.L., Christensen,I.J. and Nissen,N.I. (1983) Standardization of high-resolution flow cytometric DNA analysis by the simultaneous use of chicken and trout red blood cells as internal reference standards. Cytometry, 3, 323–327. [DOI] [PubMed] [Google Scholar]
- 47.Baisch H., Gohde,W. and Linden,W.A. (1975) Analysis of PCP-data to determine the fraction of cells in the various phases of cell cycle. Radiat. Environ. Biophys., 12, 31–39. [DOI] [PubMed] [Google Scholar]
- 48.Lee K.A.W., Zerivitz,K. and Akusjärvi,G. (1994) Small-scale preparation of nuclear extracts from mammalian cells. In Celis,J.E. (ed.), Cell Biology. A Laboratory Handbook. Academic Press, London, UK, Vol. 1, pp. 668–670.
- 49.Ince T.A. and Scotto,K.W. (1995) A conserved downstream element defines a new class of RNA polymerase II promoters. J. Biol. Chem., 270, 30249–30252. [DOI] [PubMed] [Google Scholar]
- 50.Burge C.B., Padgett,R.A. and Sharp,P.A. (1998) Evolutionary fates and origins of U12-type introns. Mol. Cell, 2, 773–785. [DOI] [PubMed] [Google Scholar]
- 51.Plumb M., Stein,J. and Stein,G. (1983) Coordinate regulation of multiple histone mRNAs during the cell cycle in HeLa cells. Nucleic Acids Res., 11, 2391–2410. [DOI] [PMC free article] [PubMed] [Google Scholar]
- 52.Xu C.F., Brown,M.A., Nicolai,H., Chambers,J.A., Griffiths,B.L. and Solomon,E. (1997) Isolation and characterization of the NBR2 gene which lies head to head with the human BRCA1 gene. Hum. Mol. Genet., 6, 1057–1062. [DOI] [PubMed] [Google Scholar]
- 53.Wells J., Held,P., Illenye,S. and Heintz,N.H. (1996) Protein-DNA interactions at the major and minor promoters of the divergently transcribed dhfr and rep3 genes during the Chinese hamster ovary cell cycle. Mol. Cell. Biol., 16, 634–647. [DOI] [PMC free article] [PubMed] [Google Scholar]
- 54.Guarguaglini G., Battistoni,A., Pittoggi,C., Di Matteo,G., Di Fiore,B. and Lavia,P. (1997) Expression of the murine RanBP1 and Htf9-c genes is regulated from a shared bidirectional promoter during cell cycle progression. Biochem. J., 325, 277–286. [DOI] [PMC free article] [PubMed] [Google Scholar]
- 55.Moberg K., Starz,M.A. and Lees,J.A. (1996) E2F-4 switches from p130 to p107 and pRB in response to cell cycle reentry. Mol. Cell. Biol., 16, 1436–1449. [DOI] [PMC free article] [PubMed] [Google Scholar]
- 56.Smith E.J., Leone,G., DeGregori,J., Jakoi,L. and Nevins,J.R. (1996) The accumulation of an E2F-p130 transcriptional repressor distinguishes a G0 cell state from a G1 cell state. Mol. Cell. Biol., 16, 6965–6976. [DOI] [PMC free article] [PubMed] [Google Scholar]
- 57.Takahashi Y., Rayman,J.B. and Dynlacht,B.D. (2000) Analysis of promoter binding by the E2F and pRB families in vivo: distinct E2F proteins mediate activation and repression. Genes Dev., 14, 804–816. [PMC free article] [PubMed] [Google Scholar]
- 58.Pagano M., Durst,M., Joswig,S., Draetta,G. and Jansen-Durr,P. (1992) Binding of the human E2F transcription factor to the retinoblastoma protein but not to cyclin A is abolished in HPV-16-immortalized cells. Oncogene, 7, 1681–1686. [PubMed] [Google Scholar]
- 59.Wells J., Boyd,K.E., Fry,C.J., Bartley,S.M. and Farnham,P.J. (2000) Target gene specificity of E2F and pocket protein family members in living cells. Mol. Cell. Biol., 20, 5797–5807. [DOI] [PMC free article] [PubMed] [Google Scholar]
- 60.Datta P.K., Raychaudhuri,P. and Bagchi,S. (1995) Association of p107 with Sp1: genetically separable regions of p107 are involved in regulation of E2F- and Sp1-dependent transcription. Mol. Cell. Biol., 15, 5444–5452. [DOI] [PMC free article] [PubMed] [Google Scholar]
- 61.Lee R.J., Albanese,C., Fu,M., D’Amico,M., Lin,B., Watanabe,G., Haines,G.K., Siegel,P.M., Hung,M.-C., Yarden,Y., Horowitz,J.M., Muller,W.J. and Pestell,R.G. (2000) Cyclin D1 is required for transformation by activated Neu and is induced through an E2F-dependent signaling pathway. Mol. Cell. Biol., 20, 672–683. [DOI] [PMC free article] [PubMed] [Google Scholar]
- 62.Sugino A. (1995) Yeast DNA polymerases and their role at the replication fork. Trends Biochem. Sci., 20, 319–323. [DOI] [PubMed] [Google Scholar]
- 63.Takahashi Y., Yamaguchi,M., Hirose,F., Cotterill,S., Kobayashi,J., Miyajima,S. and Matsukage,A. (1996) DNA replication-related elements cooperate to enhance promoter activity of the Drosophila DNA polymerase alpha 73-kDa subunit gene. J. Biol. Chem., 271, 14541–14547. [DOI] [PubMed] [Google Scholar]
- 64.Quandt K., Frech,K., Karas,H., Wingender,E. and Werner,T. (1995) MatInd and MatInspector: new fast and versatile tools for detection of consensus matches in nucleotide sequence data. Nucleic Acids Res., 23, 4878–4884. [DOI] [PMC free article] [PubMed] [Google Scholar]