Significance
Agriculture changed not only human culture and lifeways, but human biology as well. Previous studies indicate that softer agricultural diets may have resulted in a less robust craniofacial morphology in early farmers. However, obtaining reliable estimates of worldwide subsistence effects has proved challenging. Here, we quantify changes in human skull shape and form across the agricultural transition at a global scale. Although modest, the effects are often reliably directional and most pronounced in craniofacial features that are directly involved in mastication.
Keywords: foragers, farmers, subsistence effects, human skull form, mastication
Abstract
Agricultural foods and technologies are thought to have eased the mechanical demands of diet—how often or how hard one had to chew—in human populations worldwide. Some evidence suggests correspondingly worldwide changes in skull shape and form across the agricultural transition, although these changes have proved difficult to characterize at a global scale. Here, adapting a quantitative genetics mixed model for complex phenotypes, we quantify the influence of diet on global human skull shape and form. We detect modest directional differences between foragers and farmers. The effects are consistent with softer diets in preindustrial farming groups and are most pronounced and reliably directional when the farming class is limited to dairying populations. Diet effect magnitudes are relatively small, affirming the primary role of neutral evolutionary processes—genetic drift, mutation, and gene flow structured by population history and migrations—in shaping diversity in the human skull. The results also bring an additional perspective to the paradox of why Homo sapiens, particularly agriculturalists, appear to be relatively well suited to efficient (high-leverage) chewing.
The emergence and spread of agriculture are among the more remarkable developments in the evolutionary history of Homo sapiens. This change in lifeway appears to be associated with changes in human skull shape and form. Although global cranial diversity is generally well explained by neutral evolutionary processes (1–4), early farmers tend to have a chewing architecture that is, at least in some dimensions, less massive than that of their hunter-gatherer counterparts (refs. 5–20 and 21, chap. 7). Explanatory scenarios cohere around the idea that softer agricultural foods reduce masticatory demands, resulting in less robust craniofacial skeletons and reduced and repositioned chewing muscles.
This is the essence of the “masticatory-functional hypothesis” Carlson and Van Gerven (5) posited four decades ago to explain morphological differences among a chronological series of ancient Nubian populations—from Mesolithic hunter-gatherers to Christian agriculturalists. Subsequent forager–farmer comparisons for European, Asian, and American samples support a trend of craniofacial reduction with agriculture (7–19). Most of these studies sample a small number of geographically local populations (but see refs. 22 and 23). Local comparisons are valuable because they often provide a detailed picture of the cultural, dietary, and chronological context for the morphological differences between closely related groups. In some cases, cultural and other evidence supports a hypothesis of biological continuity between the foragers and descendant farmers (5–7, 10, 12, 14, 16–19). However, with few sampled groups, it can be difficult to separate diet effects from other factors differentiating the populations. Moreover, the major dimensions of reduction can vary from study to study, and some farmer masticatory dimensions are larger in some comparisons (8–10, 18).
An alternative approach samples many populations, globally or regionally, to assess the extent to which deviations from a population genetic, neutral model of diversification correspond to differences in mode of subsistence (22, 23). Due to the complexities of characterizing high-dimensional phenotypes in structured samples, each observed variable (shape, diet, genetic data, or a proxy for it) is typically transformed from its original units to a matrix of pairwise distances between populations. The correlation between shape and diet distances, after accounting for population history and structure, becomes the focus of the inquiry.
However, the essential units of morphology are shape, form, and size, not pairwise distances. The beauty of statistical shape analysis is its potential to quantify and concretely represent morphological differences in morphological units. The loss of this potential when evaluating directional effects (diet, climate, etc.) in distance units is especially unfortunate: A distance analysis quantifies the correlation between morphological and diet distances, but not what the morphological response to subsistence practice looks like. It is the latter objective that motivates geometric morphometrics (24, 25) and is central to evaluating functional and evolutionary hypotheses. Insights at this level require methods that permit direct analysis of morphological observations in structured samples.
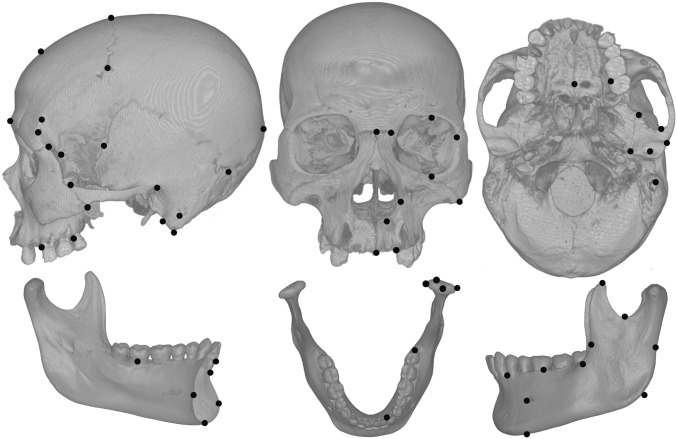
Here, we provide estimates of the influence of agriculture on human skull shape, form, and size at a global scale. The morphological observations are three-dimensional landmark data (Fig. 1 and SI Appendix, Fig. S1). The skeletal sample (Fig. 2 and SI Appendix, Document S1) is a large collection of preindustrial forager and farmer crania (n = 559 from 25 groups) and mandibles (n = 534 from 24 groups). Although bilateral landmarks were collected for most specimens, we average the sides and evaluate hemiforms so that somewhat fragmentary remains can be included in the sample.
Fig. 1.
Landmarks. SI Appendix, Fig. S1 provides landmark names.
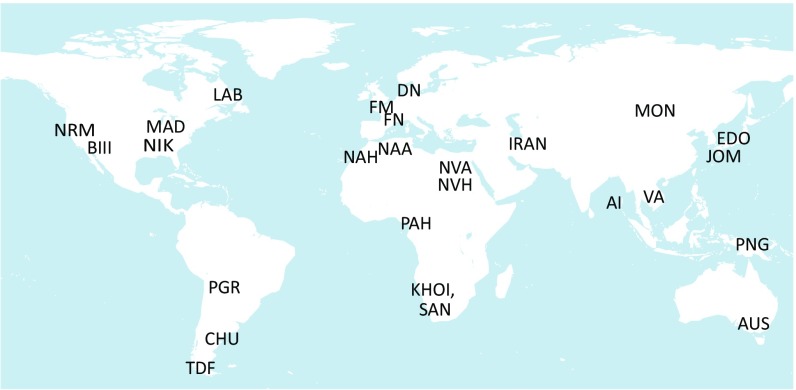
Fig. 2.
Sample map. The sample consists of n = 599 crania (25 groups) and n = 534 mandibles (24 groups). Population names, subsistence profiles, and additional details are in SI Appendix, Document S1.
We adapt a Bayesian, quantitative genetics mixed model for high-dimensional phenotypes (26) to these data. For each skeletal element (cranium, mandible), we fit three models, each with a different diet predictor. The diet predictors identify whether a specific agricultural subsistence staple is present/regular or absent/rare in a population: dairy (“Milk”); maize, wheat, rice, or other cereals (“Mush”); and “Soft,” which groups together all Milk and Mush populations. Diet assignments were made based on published archaeological, isotopic, and enthnographic reports (SI Appendix, Document S1). We focus on dairy and cereals because their association with reduced oral processing demands is relatively uncontroversial. All models also include fixed effects for sex and mean annual temperature, a random effect for population structure, and residual error. Temperature is known to influence human cranial diversity (3, 4, 27–29). Without controlling for temperature, the absence of agriculture in extremely cold climates could confound diet effects.
For each fixed-effect predictor, the model estimates regression coefficients for each landmark coordinate and for size (log centroid size). Visualizing these coefficients as shape and form transformations across the agricultural transition yields intuitive, biologically meaningful representations of how skull morphology varies with subsistence conditions.
Results
We detect modest subsistence effects that are largely consistent with the predictions of the masticatory-functional hypothesis. Masticatory reduction in farmers is most substantial and reliably directional in dairying populations and weakest for cereal domesticators. Thus, among the farming categories, diet effect sizes are greatest when the food that defines the diet predictor class is softest.
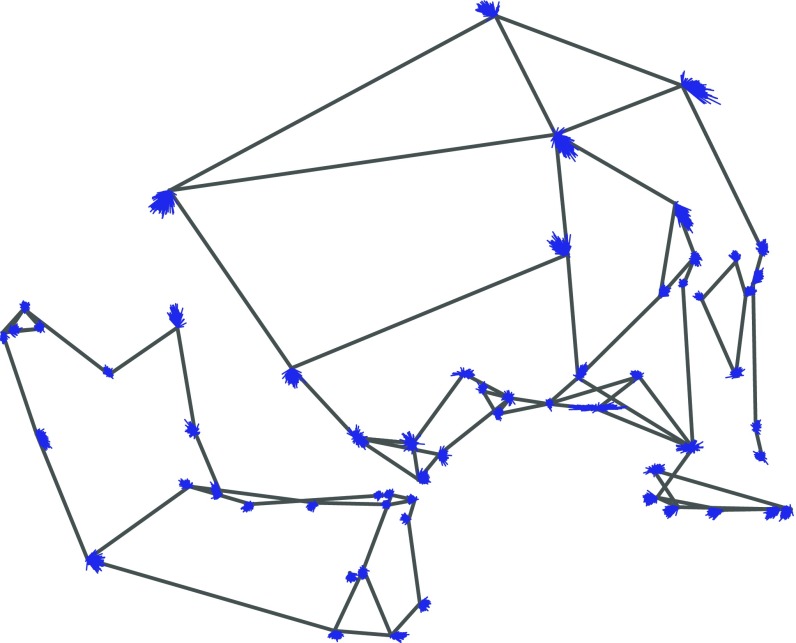
Fig. 3 shows effects of dairy domestication on cranial and mandibular shape. The wireframes depict the mean shape of a female from the reference (harder food) diet category. Displacement vectors emanating from each landmark represent 200 estimates of shape change associated with the Milk predictor, sampled with replacement from the posterior distribution of effects. A less spherical arrangement of vectors around a landmark implies a more reliably directional diet effect. In Fig. 3, we magnify displacement vectors 1.5× to focus attention on their direction and directional consistency. The same results are presented without magnification in SI Appendix, Fig. S2 (interactive 3D plot) and for all three diet predictors in SI Appendix, Figs. S3 and S4.
Fig. 3.
Diet effects estimates, Milk model. Wireframe depicts the reference (harder diet) mean shape. Blue displacement vectors at each landmark depict 200 realizations of the expected shape transformation with agriculture, sampled with replacement from the posterior distribution. Effect sizes have been magnified 1.5× to stress direction and directional consistency.
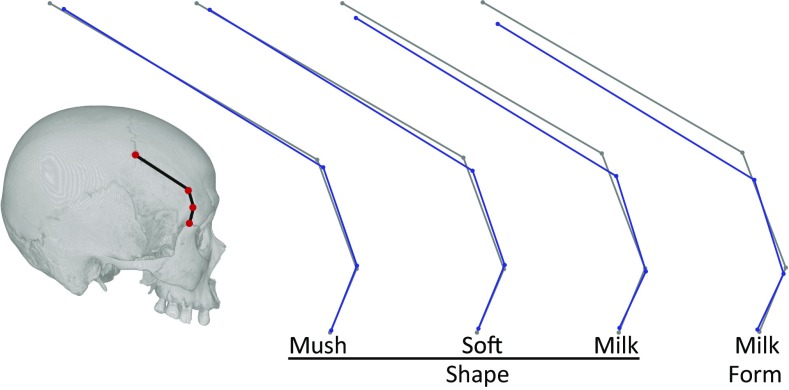
To highlight the most clearly directional diet effects, we present mean contrasts for landmark subsets. Notable features distinguishing the skull shapes of foragers and farmers include a smaller anterior temporalis muscle, delineated by landmarks along the superior temporal line (Fig. 4); posterior displacement of the dentition, especially in the maxillary cheek teeth (Fig. 5 and SI Appendix, Fig. S5, and in 3D in SI Appendix, Fig. S6); a vertically taller palatal vault (SI Appendix, Fig. S6); and a taller mandibular coronoid process, narrower mandibular ramus, and more projecting lower chin (Fig. 3 and SI Appendix, Figs. S2 and S4). Whereas greater chin projection partially reflects a difference in symphyseal shape, much of the contrast appears to be due to a clockwise rotation of the symphysis—a superimposition effect attributable to shape differences in other parts of the mandible. Cranial vault landmark displacements suggest that vault size is large relative to facial size in farming groups (Fig. 3 and SI Appendix, Figs. S2 and S3).
Fig. 4.
Mean contrasts, anterior temporal line. Reference (harder diet) configuration is in gray; diet effects are in blue.
Fig. 5.
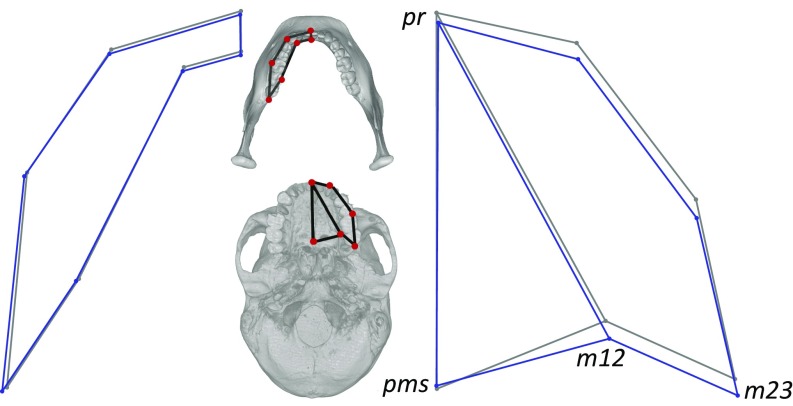
Milk diet mean dental shape contrasts. Reference (harder diet) is in gray; Milk diet is in blue.
The association of agriculture with mandibular size reduction is supported for the Milk and Soft predictors (Table 1). Mandibular size reduction in dairying populations is approximately two-thirds the magnitude of typical size differences between males and females. There is some support for cranial size reduction in dairying populations, as well. However, the diet effect on cranial size is small compared with cranial size differences between males and females or between groups for which environmental temperature differs by the sample average (∼10 °C).
Table 1.
Predictor effects on size (95% posterior credibility interval)
| Model term | Cranium | Mandible |
| Reference (F, forager) | 370 (359, 382) | 215 (206, 225) |
| Diet effects | ||
| Milk | −5.5 (−11.8, 0.7) | −6.6 (−11.1, −2.1) |
| Soft | −1.9 (−6.5, 2.4) | −3.0 (−6.5, 0.8) |
| Mush | −0.4 (−5.3, 4.6) | −1.5 (−5.6, 2.4) |
| Other effects | ||
| Male | 17.4 (15.6, 19.4) | 10.7 (9.1, 12.4) |
| Temp. (Δ/10 °C) | −8.1 (−12.2, −4.6) | −3.1 (−6.2, 0) |
All estimates are in centroid size units (CSU) (temperature size effects reported in CSU per 10 °C, approximately the sample average temperature contrast). Reference, Milk diet, male (sex), and temperature estimates are derived from a single model. Soft and Mush effects are derived from models that substitute these predictors for Milk. Posterior credibility intervals are computed from quantiles of the Gibbs sampler realizations.
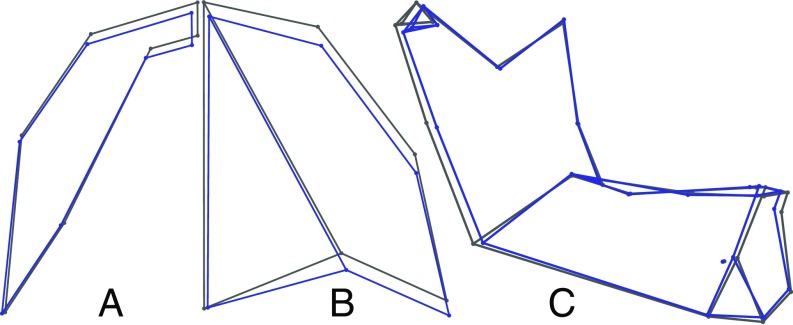
We incorporate size effects into the morphological contrasts to render the comparisons in form space. At scale, the primary differences in the mandible are an absolutely narrower ramus, shorter corpus, and shorter tooth row in agriculturalists (Fig. 6 A and C and in 3D in SI Appendix, Fig. S7). In the cranium, farmers present a shorter and more inferior arc of the anterior temporalis muscle; a modestly taller palate; and, due to the more inferior position of landmarks that approximate the superior vault circumference (lambda, stephanion, and glabella–bregma subtense), a more “peaked” vault (SI Appendix, Fig. S7). This last difference likely reflects increased vault globularity in farmers, although confirmation would require a denser set of landmarks and/or semilandmarks to capture vault curvature.
Fig. 6.
(A–C) Milk diet form contrasts: mandibular tooth row (A), maxillary tooth row (B), and mandible (C). Reference (harder diet) is in gray; Milk diet is in blue.
Whereas Fig. 5 gives the impression that the maxillary tooth row is slightly longer in dairy agriculturalists, in fact, tooth row size appears long because the bony maxilla is short. In agriculturalists, the palatomaxillary suture (landmark pms) is sagitally shallow relative to the molars (m12, m23), indicating a forager–farmer contrast in tooth row size relative to bony palate size. The corresponding form contrast (Fig. 6B) makes clear that the difference in tooth row:palate proportions is a function of an absolutely shorter maxilla—from pms to pr, the central incisor midline—in farmers. Palate dimensions are thus an additional example of bony reduction across the agricultural transition.
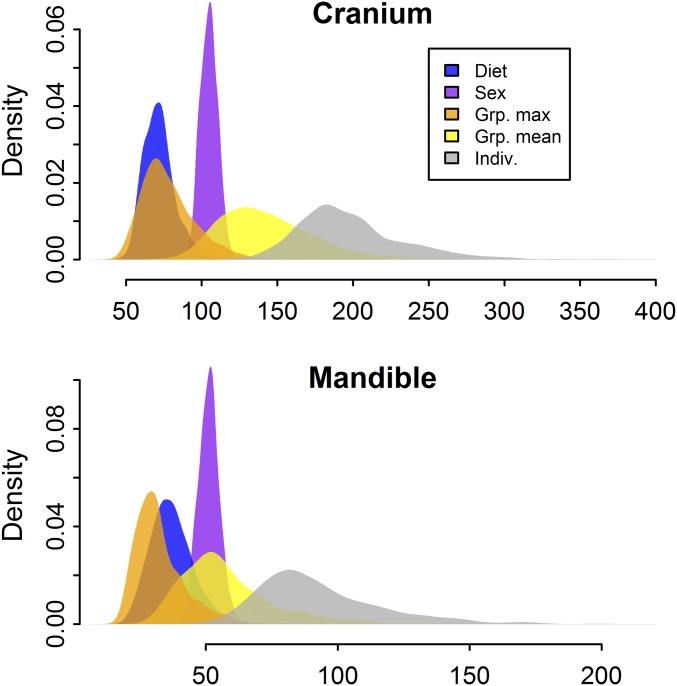
To provide a sense of the magnitude of diet effects relative to sex effects and population- and individual-level heterogeneity, we computed densities of pairwise Euclidean distances in Procrustes form space for (i) the Milk diet contrast, (ii) the sex contrast, (iii) the contrast between group means for two groups of average relatedness, (iv) the contrast between group means for two groups of maximum relatedness, and (v) the contrast between two unrelated individuals from the same group. Each contrast holds all other factors constant. All contrasts are posterior simulations from the fitted model. Average relatedness and maximum relatedness were computed, respectively, as the mean and maximum of the off-diagonal values in the population relationship matrix (SI Appendix, Table S1 and Materials and Methods, Relationship Matrix).
The results are presented in Fig. 7 (and, for shape results, in SI Appendix, Fig. S8). For both cranium and mandible, differences attributable to diet tend to be small relative to typical differences between sexes, between groups of average relatedness, and between individuals. However, diet effects are similar in magnitude to typical differences between closely related groups.
Fig. 7.
Effect magnitude comparison, form space. Densities are distributions of pairwise Euclidean distances for the following contrasts: Milk diet, sex, between two groups of average relatedness, between two groups of maximum relatedness, and between two individuals from the same group. Each stored sample in the posterior contributes one contrast to each density.
Discussion
Although the Milk, Soft, and Mush binary predictors are coarse proxies for overall diet differences, the order of effect size magnitudes (Milk > Soft > Mush) suggests these predictors capture relevant variation in biomechanical demands among farming classes. Dairy items are generally softer and require less oral processing than cereals. Liquid dairy consumption requires no bite force whatsoever. It is therefore reasonable, and consistent with the logic of the masticatory-functional hypothesis, that masticatory reduction would be most noticeable in dairying groups.
The specific differences in morphology are also consistent with a hypothesis of reduced biomechanical demands in farming (particularly dairying) groups. All else equal, a smaller bony masticatory apparatus would be less able to withstand bite force and muscle action forces. A reduced superior temporal line outlines a smaller anterior temporalis muscle. A narrower mandibular ramus indirectly suggests a reduced attachment area for, and hence reduced cross-sectional area of, the masseter and medial pterygoid muscles. These three muscles are the primary elevators of the jaw during chewing cycles. Reductions to these muscles imply reduced capacity to generate high or repetitive bite forces. A more inferiorly located superior temporal line (Figs. 3 and 4) and relatively taller coronoid process also imply a smaller (shorter) temporalis muscle, but not necessarily in a dimension that relates to bite force capacity. Finally, if the taller palatal vault in farmers indicates a thinner bony palate, then this morphological difference may reflect reduced loads as well (30, 31).
The posterior shift of the maxillary and mandibular tooth rows in farmers does not as obviously fit a hypothesis of reduced masticatory performance. All else equal, more posteriorly located cheek teeth should increase the mechanical advantage of the masticatory system by shortening the external moment arm to the food bolus. This tooth row position paradox—increased leverage in an environment of reduced performance demands—has been noted elsewhere as a surprising feature of H. sapiens masticatory morphology (32–35). A more integrated view of the masticatory apparatus partially tempers the efficiency implications: Because of the potential for working-side temporomandibular joint (TMJ) dislocation, posteriorly positioned cheek teeth constrain muscle recruitment during chewing (34, 35).
Nevertheless, the apparent efficiency of the human masticatory apparatus calls for an explanation. One proposal is that high leverage reflects selection for the ability to generate powerful bite forces (32). Alternatively, it has been argued that the shortened distance from TMJ to bite point is part of a generally flatter human facial morphology and thus that nonmasticatory explanations are more likely (34, 36).
Our results point to a different explanation. First, we do not detect a strong association between agricultural diets and overall facial flatness; general orthognathy is more clearly associated with environmental temperature (37). More importantly, the morphological reductions that suggest increased mechanical advantage can actually be attributed to reduced oral processing. Consider the mandibular ramus, narrower in farming groups (Fig. 6C). Ramal growth displaces the tooth row anteriorly (ref. 38, chap. 4). All else equal, a narrow ramus results in more posteriorly positioned mandibular cheek teeth. All else equal, a shorter maxilla (Fig. 6B) has the same implications for the cranium. We therefore suggest that the mechanical advantage of farmers relative to foragers, and perhaps of H. sapiens relative to other taxa, may be incidental to reduced masticatory performance demands.
Finally, it is important to put diet effect magnitudes in perspective. The vast majority of human genetic diversity is within group diversity, and much of the genetic variation that differentiates populations is consistent with neutral evolutionary processes (39–42). Variation in the human cranium is patterned similarly (1, 2, 43). As a simple accounting matter, one would therefore expect the influence of diet to be comparatively small. The relative ranking of effects in Fig. 7 and SI Appendix, Fig. S8 is consistent with this expectation: Subsistence differences are a fraction of typical differences among individuals and smaller than typical differences between groups of average relatedness. Nevertheless, for closely related groups, diet effects and group-level differences are of similar magnitude. This latter result may explain some of the inconsistency among studies that contrast local samples of foragers and farmers. In such samples, diet effects may be substantially obscured or magnified, depending on the extent to which the direction of subsistence and structured effects align.
Conclusion
Explaining human cranial diversity has long occupied a central place in biological anthropology (44–47). Here, we isolated the influence of neutral evolutionary processes on global diversity to quantify changes in skull shape and form across the agricultural transition. The changes fit well with a hypothesis of reduced masticatory performance demands in farming groups. Due to some combination of food material properties and food processing/preparation (e.g., ceramic ware cooking), agricultural staples were likely easier to chew than foods typically consumed by foragers. Increased prevalence of dental malocclusion and tooth crowding in agricultural groups (21, 48) provides added support for this inference.
However, morphological change need not be massive to have functional resonance. The changes in human skull shape and form and masticatory muscle size we identify are relatively small. Small diet effect magnitudes are consistent with studies quantifying the major variance components of global human genetic and cranial diversity, where most variation is found within groups. Small effects are also consistent with a long view of hominin cultural and morphological coevolution. The technologies for cooking, cutting, grinding, and pounding food all precede the emergence of agriculture. Each would have eased oral processing demands in hunter-gatherers as well as early farmers.
Finally, inferences concerning the biological mechanism of subsistence-driven differences in skull morphology tend to favor phenotypic plasticity over natural selection (9, 10, 48–50). A substantial body of experimental feeding and muscle function studies demonstrates the feasibility of a plastic response (31, 50–55). Comparative analyses of dental malocclusion tend to support the inference of plasticity as well (48). Nevertheless, in some forager–farmer ontogenetic comparisons, craniofacial differences consistent with variation in diet functional demands are evident before (15) or very shortly after (56) weaning age. These results in young individuals are consistent with a genetic mechanism. Dietary specializations have also been shown to produce some of the most discernable patterns of genetic divergence among living human groups (57–59). We therefore think genetic mechanisms should not be wholly discounted in studies of the effects of agriculture on skull morphology.
Materials and Methods
Landmark Data.
Landmarks were recorded by D.C.K. For all but two populations, landmark data were collected directly using a Microscribe 3DX digitizer. For the Pampa Grande and Chubut samples from Argentina, D.C.K. used Avizo Lite (FEI Co., v. 9.0.1) to create surface models and record landmarks from computed tomography (CT) scans.
We made two concessions to increase sample size in several populations. First, in some archaeological samples, we found the bones of the basicranium, particularly the occipital, were often fragmentary or displaced. The cranial landmark set therefore includes few basicranial landmarks. Second, although bilateral landmarks were collected for most specimens, the mixed model is fitted to cranial and mandibular hemiforms after averaging the right and left sides. This allows us to include true hemiform mandible fragments (symphysis plus landmarks from one side). An alternative would reflect mandible hemifragments, creating a bilaterally symmetric jaw by fitting the symphysis landmarks of the original and reflected forms to each other. However, we found that small amounts of measurement error along the symphysis occasionally result in large, clearly nonbiological variation in mandibular width at more distal landmarks.
Imputation.
For a missing right or left bilateral landmark where the antimere is present, we impute coordinates using a reflected relabeling procedure that substitutes the position of the reflected antimere for the missing point (60). Missing midline landmarks, and bilateral landmarks absent on both sides, were inferred using two-block partial least-squares (PLS) imputation (60). A total of 51 crania and 34 mandibles (respectively, 9.1% and 6.4% of specimens) required PLS imputation. No specimen required PLS imputation of more than two landmarks.
Superimposition.
After imputation, landmark configurations were aligned using generalized Procrustes analysis (GPA: 24). GPA is a multistep procedure that removes location and centroid size differences between configurations and then rotates each configuration to minimize its squared distance from the sample mean shape.
Mixed Model.
The mixed-effect model was developed to estimate effect sizes in structured samples (61) and has a long history in quantitative genetic studies of pedigreed observations (62–64). Recent innovations extend the mixed model to interspecies samples (65, 66) and to highly multivariate data such as observations of shape or form (26, 28, 67).
The mixed model for the matrix of shape and size observations Y is
The observations (Y) are thus reconstructed as the outcome of contributions from fixed effects (XB), random effects of population history and structure (ZU), and residual error (E). In our implementation, all individuals from a population share the same temperature, diet, and structured contributions, and all males share a common sex effect. The error term characterizes idiosyncratic, individual-level variation.
To minimize abstraction, we describe a mixed model for cranial observations (n = 559). The reference categories for the binary predictors are female and the presumably harder-textured (forager) diet. In Y, each cranium is characterized by a vector of 112 traits: the log centroid size and Procrustes residuals for a hemiform of 37 anatomical landmarks in three dimensions. B is a 4 × 112 matrix, each column containing an intercept and coefficients for sex, temperature, and diet (say, dairy domestication) for one cranial trait. U is a 25 × 112 matrix of structured random effects, each row of U corresponding to a sampled population. X and Z are known design matrices for B and U, respectively. E is a 559 × 112 error matrix.
U has a matrix normal distribution with mean 0, column covariance matrix A (the 25 × 25 population relationship matrix), and row covariance matrix H (the 112 × 112 dispersion matrix for traits, analogous to G for pedigreed observations). E has a matrix normal distribution with mean 0, column covariance matrix I (the 559 × 559 identity matrix), and row covariance matrix R (a 112 × 112 residual covariance matrix). Thus, the covariance matrices for U and E in vectorized form are H A and R I, respectively, where indicates the Kronecker product.
For p traits, H contains p × (p + 1)/2 parameters to be estimated. This quadratic scaling can result in a rapid loss of precision and produce unstable parameter estimates in small to moderate samples if p is large (68). Runcie and Mukherjee (26) propose a Bayesian solution to this problem, whereby H is estimated with an underlying factor model (also ref. 28). The rationale for the factor approach is grounded in a model of biological development. In essence, if k modular, developmental processes contribute to covariance in a p-dimensional phenotype, with k < p, a factor model capturing the modules provides a lower-dimensional solution to H. The method is implemented in the Bayesian Sparse Factor Analysis of Genetic Covariance Matrices (BSFG) software package.
BSFG uses an adaptive Gibbs sampler to estimate posterior densities of model parameters. After a 1,000,000-iteration burn in, we generated 1,000,000 realizations from a single Markov chain, thinning at a rate of 1,000 to obtain 1,000 posterior samples for inference. We examined time-series graphs of model parameters over Gibbs iterations to confirm that mixing was adequate.
Relationship Matrix.
Fitting a mixed model requires a relationship matrix (A; SI Appendix, Table S1), which encodes pairwise evolutionary correlations between sample populations. Because genetic data are not available for most groups in our sample, we relied on the close correspondence between geographic and genetic distances among human groups (29, 40) to estimate relatedness. Geographic distances were estimated using the haversine (69), with migration routes computed over landmasses using reasonable waypoints for passage between continents and over bodies of water. We fitted a linear regression of genetic distance [δμ2 microsatellite distance (70)] on geographic distance for the Human Genome Diversity Project-Centre d'Étude du Polymorphisme Humain microsatellite diversity panel (375 loci, 2,112 samples, 52 populations) (71) and then used the coefficients to predict δμ2 distances for our sample. For populations i and j having an estimated δμ2 distance Dij, the pairwise relatedness due to structure is
where Dmax is the maximum δμ2 between sampled pairs.
Shape and Form Contrasts.
Shape estimates require only a summation of landmark coordinate coefficients. The expected shape of a female forager is
where c is the consensus configuration (in vector form), and is the mean vector of intercept coefficients, averaged over Gibbs realizations. The expected shape for a (female) dairy agriculturalist is simply
Rescaling shape estimates by centroid size coefficients renders the model’s predictions in Procrustes form space.
Statistical uncertainty in the diet effect estimates is visualized by plotting the baseline (female forager) configuration, along with landmark displacement vectors for stochastically varying realizations of The realizations are sampled with replacement from the posterior distribution generated by the Gibbs sampler.
Fixed-Effect Predictors.
The Milk, Mush, and Soft binary predictor structures are coarse relative to actual variation in subsistence (72, 73). However, subsistence data are limited for several sample populations (SI Appendix, Document S1), mandating the use of broad, simple categories.
If the food items that define the subsistence classes were to account for the entire diet of a farming population, average chewing stress is likely to be highest for the Mush farming class (cereals), lower for Soft (cereals and/or dairy), and lowest for Milk (dairy). If these rankings are correct, the Mush model contrasts cereal agriculturalists with a poorly defined harder diet category—one that includes populations expected to have both the highest and the lowest masticatory demands (foragers and dairy consumers, respectively). Nevertheless, we fitted separate models for all three diet predictors because we did not have enough prior information about the total diets of the populations to make an exclusion. As an alternative, we considered incorporating Milk and Mush predictors in the same model. However, with relatively few dairying populations that are not also cereal domesticators, we found this approach resulted in coefficients with very high levels of uncertainty for both subsistence categories.
We considered inclusion of a sample age (chronology) predictor, but its incorporation is problematic for several reasons. Sample dating quality varies substantially; some samples accumulated over centuries whereas others are more temporally constrained; within regions, sample age effects are potentially useful if the populations are related by direct biological descent, but are otherwise misleading to some unknown degree. We have no means to assess whether the sampled populations are related by biological descent. For these reasons, the sample age predictor was not incorporated.
Computing.
BSFG is implemented in Matlab (Mathworks). Geometric morphometrics and posterior analysis of model coefficients were carried out in R (74) with scripts written by D.C.K. Three-dimensional plots were generated in R, using the rgl package (75), and converted to u3d format in Meshlab (Visual Computing Lab-ISTI-CNR). Scripts for several procedures are available at GitHubGist (https://gist.github.com/davidckatz). Data and additional code are available from the authors.
Supplementary Material
Acknowledgments
We thank D. Runcie and S. Mukherjee (guidance with BSFG), Andre Strauss (CT scans), the University of California, Davis (UC Davis) Paleoanthropology Group, Michael Berthaume, and the PNAS editors and anonymous reviewers (manuscript comments). We also thank the institutions who graciously granted access to the skeletal materials in their care: Institut de Paléontologie Humaine (Stéphanie Renault, Amélie Vialet); Musée de l’Homme (Alain Froment, Philippe Mennecier, Martin Friess, Aurélie Fort, Véronique Laborde); University of Vienna (Katrin Schäfer); Naturhistorische Museum Wien (Maria Teschler-Nicola, Karin Wiltschke); University of Copenhagen (Niels Lynnerup); The British Museum (Daniel Antoine); Duckworth Laboratory (Marta Mirazón Lahr); University of Kyoto (Masato Nakatsukasa); Tokyo Natural Science Museum collections at Tsukuba University (Yousuke Kaifu, Kazuhiro Sakaue); Vietnamese Institute of Archaeology (Marc Oxenham, Trinh Hoang Hiep, Nguyen Anh Tuan); American Museum of Natural History (AMNH) (Gisselle Garcia); Harvard Peabody Museum (Michele Morgan, Olivia Herschensohn); University of Pennsylvania Museum of Archaeology and Anthropology (Janet Monge); Phoebe Hearst Museum of Anthropology (Natasha Johnson); San Jose State University (Elizabeth Weiss); and William S. Webb Museum (George Crothers). This material is based upon work supported by the National Science Foundation under Grant BCS-1232590, the Wenner-Gren Foundation, the UC Davis Department of Anthropology, and the AMNH.
Footnotes
The authors declare no conflict of interest.
This article is a PNAS Direct Submission.
See Commentary on page 8917.
This article contains supporting information online at www.pnas.org/lookup/suppl/doi:10.1073/pnas.1702586114/-/DCSupplemental.
References
- 1.Relethford JH. Craniometric variation among modern human populations. Am J Phys Anthropol. 1994;95:53–62. doi: 10.1002/ajpa.1330950105. [DOI] [PubMed] [Google Scholar]
- 2.Smith HF. Which cranial regions reflect molecular distances reliably in humans? Evidence from three-dimensional morphology. Am J Hum Biol. 2009;21:36–47. doi: 10.1002/ajhb.20805. [DOI] [PubMed] [Google Scholar]
- 3.Harvati K, Weaver TD. Human cranial anatomy and the differential preservation of population history and climate signatures. Anat Rec A Discov Mol Cell Evol Biol. 2006;288:1225–1233. doi: 10.1002/ar.a.20395. [DOI] [PubMed] [Google Scholar]
- 4.Roseman CC. Detecting interregionally diversifying natural selection on modern human cranial form by using matched molecular and morphometric data. Proc Natl Acad Sci USA. 2004;101:12824–12829. doi: 10.1073/pnas.0402637101. [DOI] [PMC free article] [PubMed] [Google Scholar]
- 5.Carlson DS, Van Gerven DP. Masticatory function and post-Pleistocene evolution in Nubia. Am J Phys Anthropol. 1977;46:495–506. doi: 10.1002/ajpa.1330460316. [DOI] [PubMed] [Google Scholar]
- 6.Hinton RJ, Carlson DS. Temporal changes in human temporomandibular joint size and shape. Am J Phys Anthropol. 1979;50:325–333. [Google Scholar]
- 7.Goodman AH, Armelagos GJ, Van Gerven DP, Calcagno JM. Diet and post Mesolithic craniofacial and dental evolution in Sudanese Nubia. In: David R, editor. Science in Egyptology. Manchester Univ Press; Manchester, UK: 1984. pp. 201–210. [Google Scholar]
- 8.Kaifu Y. Changes in mandibular morphology from the Jomon to modern periods in eastern Japan. Am J Phys Anthropol. 1997;104:227–243. doi: 10.1002/(SICI)1096-8644(199710)104:2<227::AID-AJPA9>3.0.CO;2-V. [DOI] [PubMed] [Google Scholar]
- 9.González-José R, et al. Functional-cranial approach to the influence of economic strategy on skull morphology. Am J Phys Anthropol. 2005;128:757–771. doi: 10.1002/ajpa.20161. [DOI] [PubMed] [Google Scholar]
- 10.Paschetta C, et al. The influence of masticatory loading on craniofacial morphology: A test case across technological transitions in the Ohio valley. Am J Phys Anthropol. 2010;141:297–314. doi: 10.1002/ajpa.21151. [DOI] [PubMed] [Google Scholar]
- 11.Holmes MA, Ruff CB. Dietary effects on development of the human mandibular corpus. Am J Phys Anthropol. 2011;145:615–628. doi: 10.1002/ajpa.21554. [DOI] [PubMed] [Google Scholar]
- 12.Smith P, Bar-Yosef O, Sillen A. Archaeological and skeletal evidence for dietary change during the late Pleistocene/early Holocene in the Levant. In: Cohen MN, Armelagos GJ, editors. Paleopathology at the Origins of Agriculture. Academic; New York: 1984. pp. 101–136. [Google Scholar]
- 13.Y’Edynak G, Fleisch S. Microevolution and biological adaptability in the transition from food-collecting to food-producing in the Iron Gates of Yugoslavia. J Hum Evol. 1983;12:279–296. [Google Scholar]
- 14.Pinhasi R, Eshed V, Shaw P. Evolutionary changes in the masticatory complex following the transition to farming in the southern Levant. Am J Phys Anthropol. 2008;135:136–148. doi: 10.1002/ajpa.20715. [DOI] [PubMed] [Google Scholar]
- 15.Fukase H, Suwa G. Growth-related changes in prehistoric Jomon and modern Japanese mandibles with emphasis on cortical bone distribution. Am J Phys Anthropol. 2008;136:441–454. doi: 10.1002/ajpa.20828. [DOI] [PubMed] [Google Scholar]
- 16.Sardi ML, Novellino PS, Pucciarelli HM. Craniofacial morphology in the Argentine Center-West: Consequences of the transition to food production. Am J Phys Anthropol. 2006;130:333–343. doi: 10.1002/ajpa.20379. [DOI] [PubMed] [Google Scholar]
- 17.Larsen CS. 1982. The Anthropology of St. Catherines Island 3: Prehistoric Human Biological Adaptation, Anthropological Papers of the American Museum of Natural History (Am Museum of Natural History, New York)
- 18.Boyd DC. 1988. A functional model for masticatory-related mandibular, dental, and craniofacial microevolutionary change derived from a selected southeastern Indian skeletal temporal series. Doctoral dissertation (University of Tennesee, Knoxville)
- 19.Galland M, Van Gerven DP, Von Cramon-Taubadel N, Pinhasi R. 11,000 years of craniofacial and mandibular variation in Lower Nubia. Sci Rep. 2016;6:31040. doi: 10.1038/srep31040. [DOI] [PMC free article] [PubMed] [Google Scholar]
- 20.Larsen CS. Biological changes in human populations with agriculture. Annu Rev Anthropol. 1995;24:185–213. [Google Scholar]
- 21.Larsen CS. Bioarchaeology: Interpreting Behavior from the Human Skeleton. 2nd Ed Cambridge Univ Press; Cambridge, UK: 2015. [Google Scholar]
- 22.von Cramon-Taubadel N. Global human mandibular variation reflects differences in agricultural and hunter-gatherer subsistence strategies. Proc Natl Acad Sci USA. 2011;108:19546–19551. doi: 10.1073/pnas.1113050108. [DOI] [PMC free article] [PubMed] [Google Scholar]
- 23.Noback ML, Harvati K. The contribution of subsistence to global human cranial variation. J Hum Evol. 2015;80:34–50. doi: 10.1016/j.jhevol.2014.11.005. [DOI] [PubMed] [Google Scholar]
- 24.Mitteroecker P, Gunz P. Advances in geometric morphometrics. Evol Biol. 2009;36:235–247. [Google Scholar]
- 25.Rohlf FJ. Shape statistics: Procrustes superimpositions and tangent spaces. J Classif. 1999;16:197–223. [Google Scholar]
- 26.Runcie DE, Mukherjee S. Dissecting high-dimensional phenotypes with Bayesian sparse factor analysis of genetic covariance matrices. Genetics. 2013;194:753–767. doi: 10.1534/genetics.113.151217. [DOI] [PMC free article] [PubMed] [Google Scholar]
- 27.Hubbe M, Hanihara T, Harvati K. Climate signatures in the morphological differentiation of worldwide modern human populations. Anat Rec. 2009;292:1720–1733. doi: 10.1002/ar.20976. [DOI] [PubMed] [Google Scholar]
- 28.Katz DC, Grote MN, Weaver TD. A mixed model for the relationship between climate and human cranial form. Am J Phys Anthropol. 2016;160:593–603. doi: 10.1002/ajpa.22896. [DOI] [PubMed] [Google Scholar]
- 29.Betti L, Balloux F, Hanihara T, Manica A. The relative role of drift and selection in shaping the human skull. Am J Phys Anthropol. 2010;141:76–82. doi: 10.1002/ajpa.21115. [DOI] [PubMed] [Google Scholar]
- 30.Strait DS, et al. Masticatory biomechanics and its relevance to early hominid phylogeny: An examination of palatal thickness using finite-element analysis. J Hum Evol. 2007;52:585–599. doi: 10.1016/j.jhevol.2006.11.019. [DOI] [PubMed] [Google Scholar]
- 31.Menegaz RA, Sublett SV, Figueroa SD, Hoffman TJ, Ravosa MJ. Phenotypic plasticity and function of the hard palate in growing rabbits. Anat Rec. 2009;292:277–284. doi: 10.1002/ar.20840. [DOI] [PubMed] [Google Scholar]
- 32.Wroe S, Ferrara TL, McHenry CR, Curnoe D, Chamoli U. The craniomandibular mechanics of being human. Proc R Soc B Biol Sci. 2010;277:3579–3586. doi: 10.1098/rspb.2010.0509. [DOI] [PMC free article] [PubMed] [Google Scholar]
- 33.O’Connor CF, Franciscus RG, Holton NE. Bite force production capability and efficiency in Neandertals and modern humans. Am J Phys Anthropol. 2005;127:129–151. doi: 10.1002/ajpa.20025. [DOI] [PubMed] [Google Scholar]
- 34.Ledogar JA, et al. Human feeding biomechanics: Performance, variation, and functional constraints. PeerJ. 2016;4:e2242. doi: 10.7717/peerj.2242. [DOI] [PMC free article] [PubMed] [Google Scholar]
- 35.Spencer MA, Demes B. Biomechanical analysis of masticatory system configuration in Neandertals and Inuits. Am J Phys Anthropol. 1993;91:1–20. doi: 10.1002/ajpa.1330910102. [DOI] [PubMed] [Google Scholar]
- 36.Lieberman DE. Speculations about the selective basis for modern human craniofacial form. Evol Anthropol. 2008;17:55–68. [Google Scholar]
- 37.Katz DC. 2016. The influence of climate and diet on human skull shape, form, and size. Doctoral dissertation (University of California, Davis)
- 38.Enlow DH, Hans MG. Essentials of Facial Growth. WB Saunders; Philadelphia: 1996. [Google Scholar]
- 39.Lewontin R. The apportionment of human diversity. Evol Biol. 1972;6:381–398. [Google Scholar]
- 40.Ramachandran S, et al. Support from the relationship of genetic and geographic distance in human populations for a serial founder effect originating in Africa. Proc Natl Acad Sci USA. 2005;102:15942–15947. doi: 10.1073/pnas.0507611102. [DOI] [PMC free article] [PubMed] [Google Scholar]
- 41.Li JZ, et al. Worldwide human relationships inferred from genome-wide patterns of variation. Science. 2008;319:1100–1104. doi: 10.1126/science.1153717. [DOI] [PubMed] [Google Scholar]
- 42.Coop G, et al. The role of geography in human adaptation. PLoS Genet. 2009;5:e1000500. doi: 10.1371/journal.pgen.1000500. [DOI] [PMC free article] [PubMed] [Google Scholar]
- 43.Roseman CC, Weaver TD. Multivariate apportionment of global human craniometric diversity. Am J Phys Anthropol. 2004;125:257–263. doi: 10.1002/ajpa.10424. [DOI] [PubMed] [Google Scholar]
- 44.Howells WW. 1989. Skull Shapes and the Map: Craniometric Analyses in the Dispersion of Modern Homo, Papers of the Peabody Museum of Archaeology and Ethnology (Harvard Univ, Cambridge, MA)
- 45.Boas F. Changes in the bodily form of descendants of immigrants. Am Anthropol. 1912;14:530–562. [Google Scholar]
- 46.Morton SG. Crania Americana. J Dobson; Philadelphia: 1839. [Google Scholar]
- 47.Coon CS. Some problems of human variability and natural selection in climate and culture. Am Nat. 1955;89:257–279. [Google Scholar]
- 48.Corruccini RS. How Anthropology Informs the Orthodotic Diagnosis of Malocclusion’s Causes. Edwin Mellen Press; Lewiston, NY: 1999. [Google Scholar]
- 49.Varrela J. Dimensional variation of craniofacial structures in relation to changing masticatory-functional demands. Eur J Orthod. 1992;14:31–36. doi: 10.1093/ejo/14.1.31. [DOI] [PubMed] [Google Scholar]
- 50.Lieberman DE, Krovitz GE, Yates FW, Devlin M, St Claire M. Effects of food processing on masticatory strain and craniofacial growth in a retrognathic face. J Hum Evol. 2004;46:655–677. doi: 10.1016/j.jhevol.2004.03.005. [DOI] [PubMed] [Google Scholar]
- 51.Ingervall B, Bitsanis E. A pilot study of the effect of masticatory muscle training on facial growth in long-face children. Eur J Orthod. 1987;9:15–23. doi: 10.1093/ejo/9.1.15. [DOI] [PubMed] [Google Scholar]
- 52.Ciochon RL, Nisbett RA, Corruccini RS. Dietary consistency and craniofacial development related to masticatory function in minipigs. J Craniofac Genet Dev Biol. 1997;17:96–102. [PubMed] [Google Scholar]
- 53.Corruccini RS, Beecher RM. Occlusal variation related to soft diet in a nonhuman primate. Science. 1982;218:74–76. doi: 10.1126/science.7123221. [DOI] [PubMed] [Google Scholar]
- 54.Larsson E, et al. Craniofacial and dentofacial development in pigs fed soft and hard diets. Am J Orthod Dentofacial Orthop. 2005;128:731–739. doi: 10.1016/j.ajodo.2004.09.025. [DOI] [PubMed] [Google Scholar]
- 55.Langenbach G, van de Pavert S, Savalle W, Korfage H, van Eijden T. Influence of food consistency on the rabbit masseter muscle fibres. Eur J Oral Sci. 2003;111:81–84. doi: 10.1034/j.1600-0722.2003.00008.x. [DOI] [PubMed] [Google Scholar]
- 56.Gonzalez PN, Perez SI, Bernal V. Ontogeny of robusticity of craniofacial traits in modern humans: A study of South American populations. Am J Phys Anthropol. 2010;142:367–379. doi: 10.1002/ajpa.21231. [DOI] [PubMed] [Google Scholar]
- 57.Hancock AM, et al. Colloquium paper: Human adaptations to diet, subsistence, and ecoregion are due to subtle shifts in allele frequency. Proc Natl Acad Sci USA. 2010;107:8924–8930. doi: 10.1073/pnas.0914625107. [DOI] [PMC free article] [PubMed] [Google Scholar]
- 58.Tishkoff SA, et al. Convergent adaptation of human lactase persistence in Africa and Europe. Nat Genet. 2007;39:31–40. doi: 10.1038/ng1946. [DOI] [PMC free article] [PubMed] [Google Scholar]
- 59.Perry GH, et al. Diet and the evolution of human amylase gene copy number variation. Nat Genet. 2007;39:1256–1260. doi: 10.1038/ng2123. [DOI] [PMC free article] [PubMed] [Google Scholar]
- 60.Gunz P, Mitteroecker P, Neubauer S, Weber GW, Bookstein FL. Principles for the virtual reconstruction of hominin crania. J Hum Evol. 2009;57:48–62. doi: 10.1016/j.jhevol.2009.04.004. [DOI] [PubMed] [Google Scholar]
- 61.Laird NM, Ware JH. Random-effects models for longitudinal data. Biometrics. 1982;38:963–974. [PubMed] [Google Scholar]
- 62.Lynch M, Walsh B. Genetics and Analysis of Quantitative Traits. Sinauer; Sunderland, MA: 1998. [Google Scholar]
- 63.Mrode RA. Linear Models for the Prediction of Animal Breeding Values. 3rd Ed CABI; Oxfordshire, UK: 2014. [Google Scholar]
- 64.Henderson C. Applications of Linear Models in Animal Breeding. Univ of Guelph Press; Guelph, ON, Canada: 1984. [Google Scholar]
- 65.Lynch M. Methods for the analysis of comparative data in evolutionary biology. Evolution. 1991;45:1065–1080. doi: 10.1111/j.1558-5646.1991.tb04375.x. [DOI] [PubMed] [Google Scholar]
- 66.Hadfield JD, Nakagawa S. General quantitative genetic methods for comparative biology: Phylogenies, taxonomies and multi-trait models for continuous and categorical characters. J Evol Biol. 2010;23:494–508. doi: 10.1111/j.1420-9101.2009.01915.x. [DOI] [PubMed] [Google Scholar]
- 67.Klingenberg CP, Leamy LJ. Quantitative genetics of geometric shape in the mouse mandible. Evolution. 2001;55:2342–2352. doi: 10.1111/j.0014-3820.2001.tb00747.x. [DOI] [PubMed] [Google Scholar]
- 68.Kirkpatrick M, Meyer K. Direct estimation of genetic principal components: Simplified analysis of complex phenotypes. Genetics. 2004;168:2295–2306. doi: 10.1534/genetics.104.029181. [DOI] [PMC free article] [PubMed] [Google Scholar]
- 69.Sinnott R. Virtues of the haversine. Sky Telescope. 1984;68:158–159. [Google Scholar]
- 70.Goldstein DB, Ruiz Linares A, Cavalli-Sforza LL, Feldman MW. An evaluation of genetic distances for use with microsatellite loci. Genetics. 1995;139:463–471. doi: 10.1093/genetics/139.1.463. [DOI] [PMC free article] [PubMed] [Google Scholar]
- 71.Cann HM, et al. A human genome diversity cell line panel. Science. 2002;296:261–262. doi: 10.1126/science.296.5566.261b. [DOI] [PubMed] [Google Scholar]
- 72.Kelly RL. The Foraging Spectrum: Diversity in Hunter-Gatherer Lifeways. Smithsonian Institution Press; Washington, DC: 1995. [Google Scholar]
- 73.Bellwood PS. First Farmers: The Origins of Agricultural Societies. Blackwell; Malden, MA: 2005. [Google Scholar]
- 74.R Development Core Team 2016 R: A Language and Environment for Statistical Computing (R Foundation for Statistical Computing, Vienna). Available at www.r-project.org/. Accessed January 15, 2017.
- 75.Adler D, et al. 2017. rgl: 3D Visualization Using OpenGL. R package version 0.97.0 (R Foundation for Statistical Computing, Vienna). Available at https://CRAN.R-project.org/package=rgl. Accessed January 15, 2017.
Associated Data
This section collects any data citations, data availability statements, or supplementary materials included in this article.


