Significance
Antibiotic resistance is a global threat to human health. The problem is aggravated by unnecessary and incorrect use of broad spectrum antibiotics. One way to provide correct treatment and slow down the development of antibiotic resistance is to assay the susceptibility profile of the infecting bacteria before treatment is initiated and let this information guide the choice of antibiotic. Here, we present an antibiotic susceptibility test that is sufficiently fast to be used at the point of care. We show that it is possible to determine if a urinary tract infection is caused by resistant bacteria within 30 min of loading a urine sample, even if the bacterial concentration in the urine is very low.
Keywords: point of care, UTI, AST, antibiotic, resistance, microfluidic
Abstract
The emergence and spread of antibiotic-resistant bacteria are aggravated by incorrect prescription and use of antibiotics. A core problem is that there is no sufficiently fast diagnostic test to guide correct antibiotic prescription at the point of care. Here, we investigate if it is possible to develop a point-of-care susceptibility test for urinary tract infection, a disease that 100 million women suffer from annually and that exhibits widespread antibiotic resistance. We capture bacterial cells directly from samples with low bacterial counts (104 cfu/mL) using a custom-designed microfluidic chip and monitor their individual growth rates using microscopy. By averaging the growth rate response to an antibiotic over many individual cells, we can push the detection time to the biological response time of the bacteria. We find that it is possible to detect changes in growth rate in response to each of nine antibiotics that are used to treat urinary tract infections in minutes. In a test of 49 clinical uropathogenic Escherichia coli (UPEC) isolates, all were correctly classified as susceptible or resistant to ciprofloxacin in less than 10 min. The total time for antibiotic susceptibility testing, from loading of sample to diagnostic readout, is less than 30 min, which allows the development of a point-of-care test that can guide correct treatment of urinary tract infection.
With the ever-increasing emergence and spread of antibiotic-resistant bacteria, a key factor in correct treatment of infections is the ability to rapidly identify the antibiotic susceptibility profile of the infecting species to assure the use of an efficacious antibiotic and reduce the need for broad spectrum drugs (1–3). Phenotypic antibiotic susceptibility tests (ASTs) are typically based on the detection of differential bacterial growth with and without antibiotics in liquid cultures or on solid agar plates (4). In liquid tests, detection is based on the change in OD, whereas the disk diffusion method is used on solid agar plates to identify inhibition zones (5). These methods are generally reliable for detecting resistance and determining the antibiotic concentration that prevents bacterial growth, making them predictive of the therapeutic utility of different antibiotics. However, because it typically takes 1–2 d to get a reliable readout, these methods fail to guide treatment in the early, often critical, stages of infection. As a consequence, the physician is left with the difficult choice of prescribing a broad spectrum antibiotic or risking that the first prescribed antibiotic is ineffective.
Genotypic ASTs are based on detection of a specific genetic marker (plasmids, genes, or mutations) associated with resistance phenotypes by using the common genetic tools (e.g., sequence-specific amplification by PCR, padlock probe-mediated rolling circle amplification, or whole-genome sequencing) (3, 6). These tests are highly sensitive and can limit the detection time to what is needed to amplify selected DNA sequences to detectable levels, but they require detailed advance knowledge of which resistance markers to test for. If new resistance mechanisms arise, these would go undetected and result in false negatives. Furthermore, the presence of certain resistance genes/mutations does not necessarily translate into phenotypic resistance.
Unlike the genotypic ASTs, the phenotypic ASTs directly assess if the antibiotic stops bacterial growth, which is the most relevant measure for the treating physician. New phenotypic ASTs have, therefore, been developed in recent years to decrease the detection times. In particular, microfluidics (7) have made it possible to increase the signal to background ratio in the phenotypic assays by miniaturizing the bacterial incubation chambers (8). Using microfluidic approaches, it has been possible to push the time requirement for AST to 1–3 h (9–13). Recent promising data based on relative DNA copy number increase in antibiotic-treated vs. reference cultures quantified using digital PCR suggest that a biological response can be detected already 15 min after exposure to an antibiotic (14). However, the PCR step still takes an additional 60 min, making this test too slow for a point-of-care application. Here, we use direct single-cell imaging to show that it is possible to determine if a bacterial isolate is susceptible to an antibiotic in less than 10 min. When we include the time for loading a dilute sample, the total time for the test is less than 30 min, such as would be required for a point-of-care application.
Urinary tract infection (UTI) is one example where a fast AST could improve medical practice by making it possible to prescribe an antibiotic to which the infecting bacteria are susceptible before the patient leaves the primary care unit. A fast AST for UTI would have an important clinical impact given that there are 100 million cases of UTI per year worldwide, with high frequency of resistance to primary antibiotics (15). Because 85% of all UTI cases diagnosed in primary care are caused by Escherichia coli, we have focused on this species, but the test can be expanded to also include other species. Clinical infections are diagnosed from 103 or 104 cfu/mL depending on country, which defines the required sensitivity of a test.
Results
Design and Loading of Microfluidic Chip.
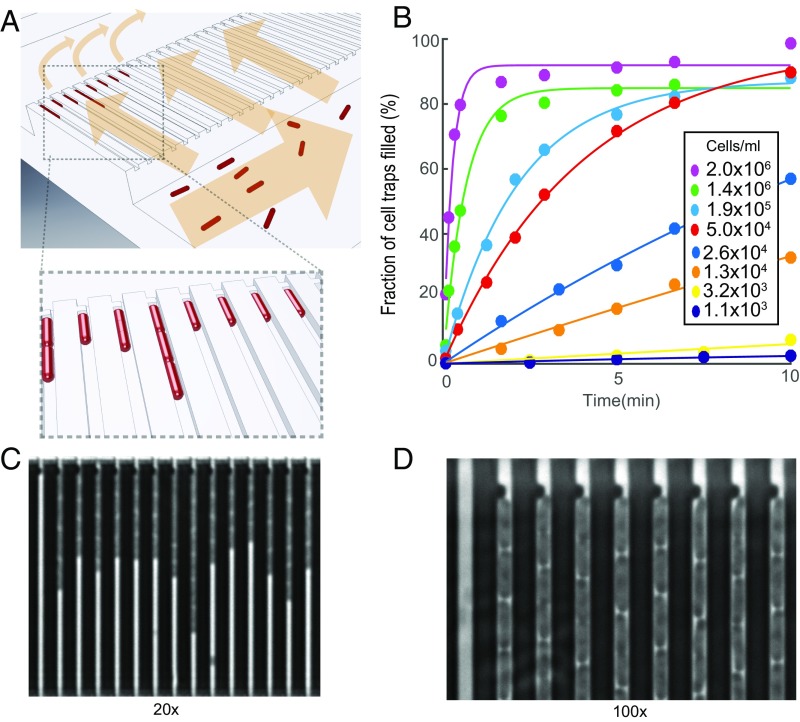
The microfluidic chip design is shown in Fig. 1. (More details on the design can be found in SI Materials and Methods and Figs. S1 and S2.) The device has two rows of cell traps. In each row, there are 2,000 cell traps of dimension 1.25 × 1.25 × 50 µm (Fig. 1A) that can be loaded with bacterial cells (red) from the front channel. A constriction at the end of each trap prevents cells from passing to the back channel, while allowing the media to flow around the cells. This sieve-like design, which is an extension of the Mother Machine (16), enables rapid loading and constant media flow over the cells.
Fig. 1.
Design and operation details of the microfluidic chip. (A) Cartoon illustrating the loading of rod-shaped bacterial cells (red) into cell traps. Arrows indicate flow direction during loading. (B) Fraction of cell traps with at least one E. coli cell at different time points. The different markers correspond to different density cell cultures. (C) A phase contrast image of E. coli in the microfluidic device (darker regions) using a 20× objective. (D) A small part of a phase contrast image taken at 100× showing the back end of the cell trap, where the flow restriction region captures the cells during loading.
Fig. S1.
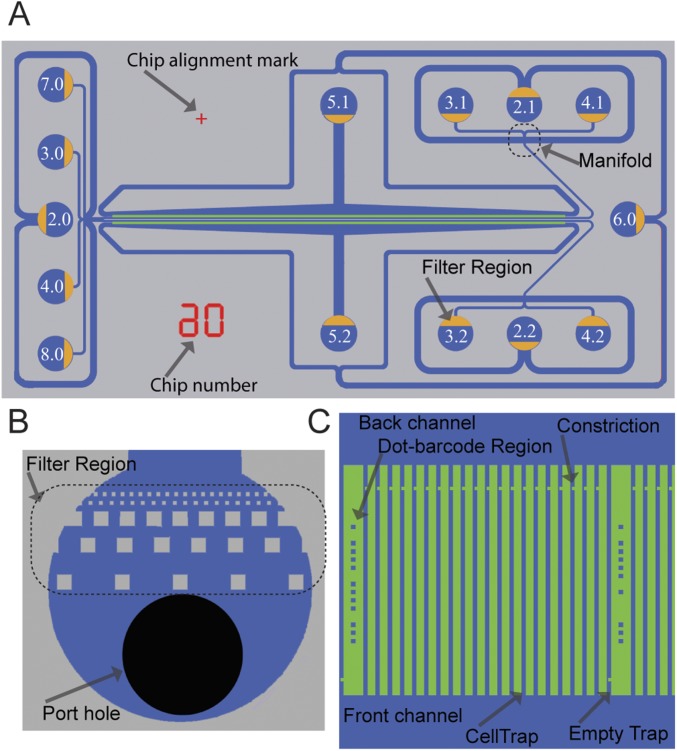
2GMM design and features. (A) Drawing of the 2GMM design showing all of the ports with designated port numbers and the orientation of filter regions (yellow) in the ports. Chip number and chip alignment marks are shown in red. (B) Drawing of a port showing the port hole (black) and the filter region. (C) Drawing of a section of a cell trap row.
Fig. S2.
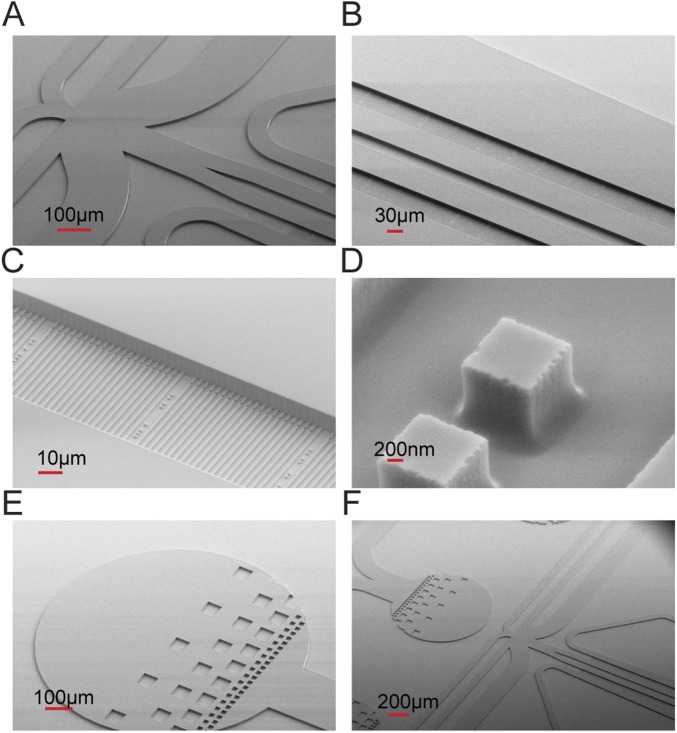
2GMM mold scanning electron microscope images with different magnification show some features of 2GMM on the mold, such as (A and F) manifold, (B) two rows of cell traps, (C) cell traps, (D) dot barcodes, and (E and F) filter regions on the ports.
To test how rapidly dilute samples could be loaded, we monitored the fraction of traps loaded over time for different cell cultures with densities from 1,100 to 2 × 10⁶ cfu/mL (Fig. 1B); 80% of the cell traps were filled within 30 s at a cell density of 2 × 10⁶, and even with the most dilute sample, 1,100 cells per 1 mL, 160 of 2,000 traps were filled in 10 min (SI Materials and Methods and Fig. S3).
Fig. S3.
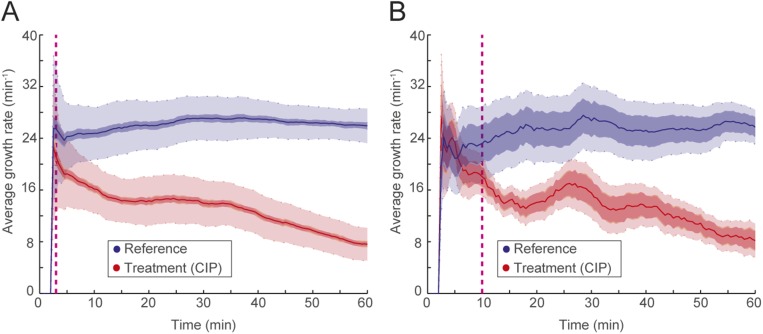
The fASTest using (A) 951 cells (reference: 409, treatment: 502) and (B) 85 cells (reference: 44, treatment: 41) is compared.
The loading time curves (Fig. 1B) can be used for real time bacterial density determination (for example, in a urine sample). Within 30 s, it would be possible to assess if it was a severe bacterial infection with more than 105 cells per 1 mL, and within 10 min, it would be possible to determine if there is a clinically relevant infection at all (17, 18).
Growth Rate Measurements.
In a typical experiment, fluid control is switched from loading to running mode when there is at least one cell in one-half of the cell traps. This prevents filling the cell traps and allows easy detection of the front end of the cell column. A few seconds after the switch, loading media inflow stops, and test media start to reach the cell trap regions. The reference population row receives the antibiotic-free medium, and the treatment population row receives the media with the antibiotic to be tested (Fig. 2A). After the media switch, we performed time-lapse phase contrast microscopy (20× magnification) with an automated x–y translation stage, where each of 4,000 cell traps was imaged every 60 s (a time-lapse movie of one position during a typical experiment can be seen in Movie S1).
Fig. 2.
Detection of growth rate effect of antibiotic. (A) Media with or without antibiotic are supplied to the two different rows of cell traps to test the effect of the antibiotic (CIP; 1 µg/mL) on the treatment population compared with the reference population. (B) A single-cell trap from the reference population (Left) and another single-cell trap from the treatment population (Right) are shown every fifth frame (every 2.5 min). The detected front-most cell pole position is given as a blue or red circle. (C) The corresponding length change through time is shown with the blue or red dots. (D) Growth rates calculated with a sliding window of up to 10 min (starting at 5 min). The (E) length and (F) growth rate are plotted as a function of time for all of the individual traps for the reference (Left) and the treatment population (Right). (G) The descriptive statistics of the normalized growth rate distributions for these populations are shown as a function of time. Colored as blue for the reference population (Left) and red for antibiotic treated population (Right), solid lines show the mean, dark-shaded regions show the 99.9% confidence interval (99.9% CI) of the mean, and the light-shaded region shows the sample SDs. (H) The overlay of the two population’s normalized growth rate distributions. The time of separation of the treatment population from the reference population based on 99.9% CIs occurs before the dashed magenta line, which indicates the first time point when growth rates are estimated.
Growth rates were first estimated for the cells in each individual cell trap. The movement of the front-most cell pole in each cell trap was monitored as a proxy for the cumulative cell length changes for the cells within that trap. Fig. 2 B–D shows an example of how the average growth rate for the cells in an individual cell trap was calculated for the reference cells without antibiotics (Fig. 2 B, Left; C, Left; and D, Left) and antibiotic-treated cells (Fig. 2 B, Right; C, Right; and D, Right). Fig. 2B shows one cell trap every fifth frame of a 120-frame (60-min) experiment, and the circles (blue or red) show the detected front-most cell pole position at that frame. In Fig. 2C, the solid dots (blue or red) show the length of the cell(s) within that cell trap through the experiment. Fig. 2D shows the instantaneous growth rate estimated as the relative length increase per time in a sliding window over 10 min.
Distinguishing Two Populations Based on Growth Rate Statistics.
In Fig. 2 E–H, we applied the growth rate calculation for each of 2,000 cell traps in both rows, such that Fig. 2E shows length vs. time for the two populations (the reference population is in Fig. 2E, Left, and the treatment population is in Fig. 2E, Right). The corresponding growth rates for individual traps are shown in Fig. 2F. In Fig. 2G, the growth rates for the individual cell traps from both populations are averaged and normalized by the average growth rate of the reference population. The framewise sample SD is shown in light transparent color in Fig. 2G, and the SEM is used to calculate a 99.9% confidence interval for the average growth rate (darker shaded region in Fig. 2G). By combining the data from the two columns (Fig. 2H), we could detect the response of the antibiotic treatment population in this experiment based on divergence from a 99.9% confidence interval (dashed magenta line in Fig. 2H) earlier than the first data point at ∼5 min.
Fast Detection of Response to Antibiotic Treatment.
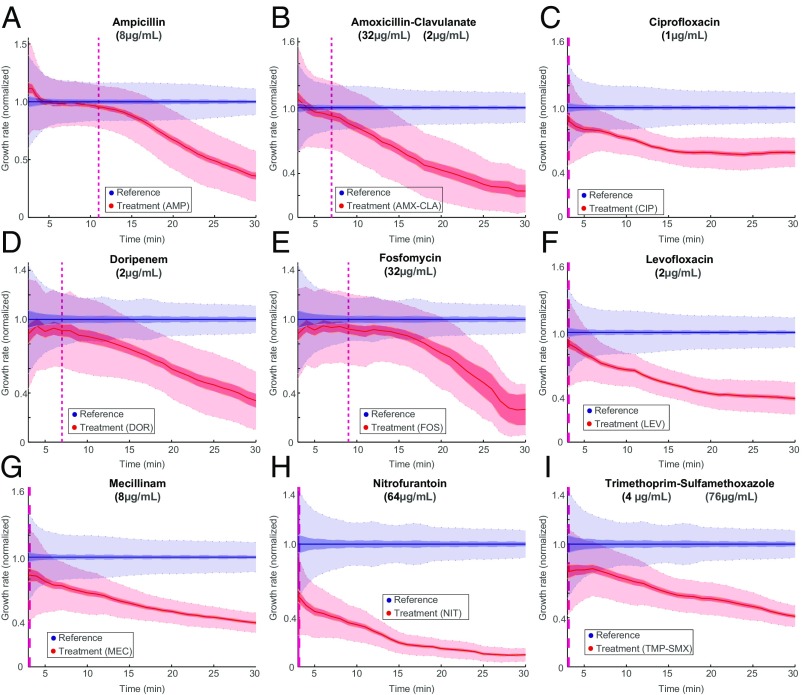
Using the fast antibiotic susceptibility test (fASTest), we determined the antibiotic response time of E. coli (MG1655) to nine different antibiotics that are used for UTIs. These included three different types of penicillins [ampicillin (AMP), amoxicillin-clavulanate (AMX-CLA), and mecillinam (MEC)], one carbapenem [doripenem (DOR)], two different fluoroquinolones [ciprofloxacin (CIP) and levofloxacin (LEV)], and three other agents [fosfomycin (FOS), nitrofurantoin (NIT), and trimethoprim-sulfamethoxazole (TMP-SMX)]. We followed The European Committee on Antimicrobial Susceptibility Testing (EUCAST) breakpoint value recommendations for the test concentrations of each particular antibiotic and the testing media requirements. We loaded the bacteria into the microfluidic chip and supplied growth media (GM) without antibiotic to one row (reference population) and GM with antibiotic to the other (treatment population). With this setup, we could detect the differential growth rate between treatment and reference populations in 3 min for CIP, LEV, MEC, NIT, and TMP-SMX; 7 min for AMX-CLA and DOR; 9 min for FOS; and 11 min for ampicillin based on 99.9% confidence intervals (Fig. 3).
Fig. 3.
Fast detection of response to antibiotic treatment. fASTest experiments testing how fast susceptible E. coli cells respond to (A) ampicillin, (B) AMX-CLA, (C) CIP, (D) DOR, (E) FOS, (F) LEV, (G) MEC, (H) NIT, and (I) TMP-SMX. AMP, ampicillin.
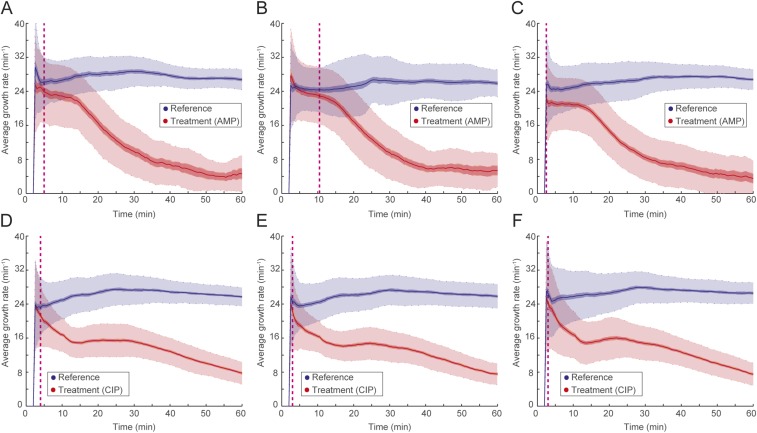
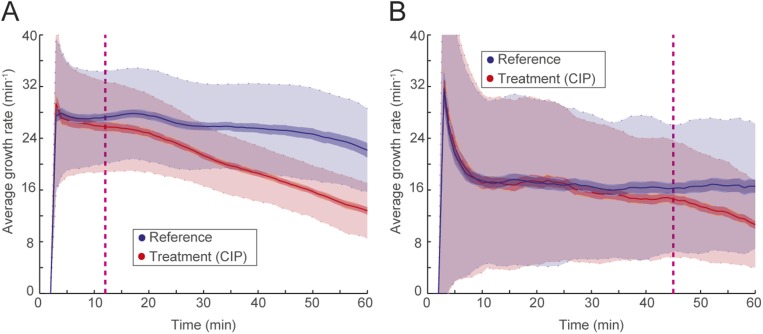
Importantly, the response curves were very reproducible between biological replicates, as shown for CIP and ampicillin in SI Materials and Methods and Fig. S4. This implies that the differential responses to the different drugs were not caused by limited time resolution in the assay but rather, that the measurement was sufficiently fast to monitor the actual biological response time. These experiments were run in the standard susceptibility testing Mueller–Hinton (MH) media; however, in SI Materials and Methods, we show that response times were similar for bacteria grown in urine (Fig. S5). In SI Materials and Methods and Movies S2 and S3, we also show that the fASTest works on Klebsiella pneumoniae and Staphylococcus saprophyticus, which are two other major pathogens causing uncomplicated UTI. The response time for S. saprophyticus was slower as expected because of its longer generation time (Fig. S6).
Fig. S4.
The fASTest of (A–C) ampicillin and (D–F) CIP for susceptible E. coli (MG1655) biological triplicates. AMP, ampicillin.
Fig. S5.
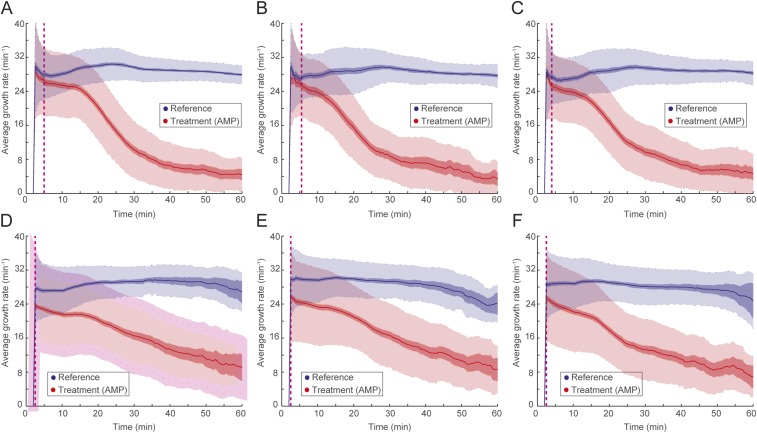
(A–C) The fASTest in standard laboratory medium with three biological replicates of CipR strain using CIP (as reference) and ampicillin and (D–F) the fASTest in urine with three biological replicates of CipR strain to CIP and ampicillin. AMP, ampicillin.
Fig. S6.
(A) fASTest for K. pneumoniae and (B) S. saprophyticus for CIP susceptibility detection.
Fast Antibiotic Susceptibility Testing of Clinical Isolates.
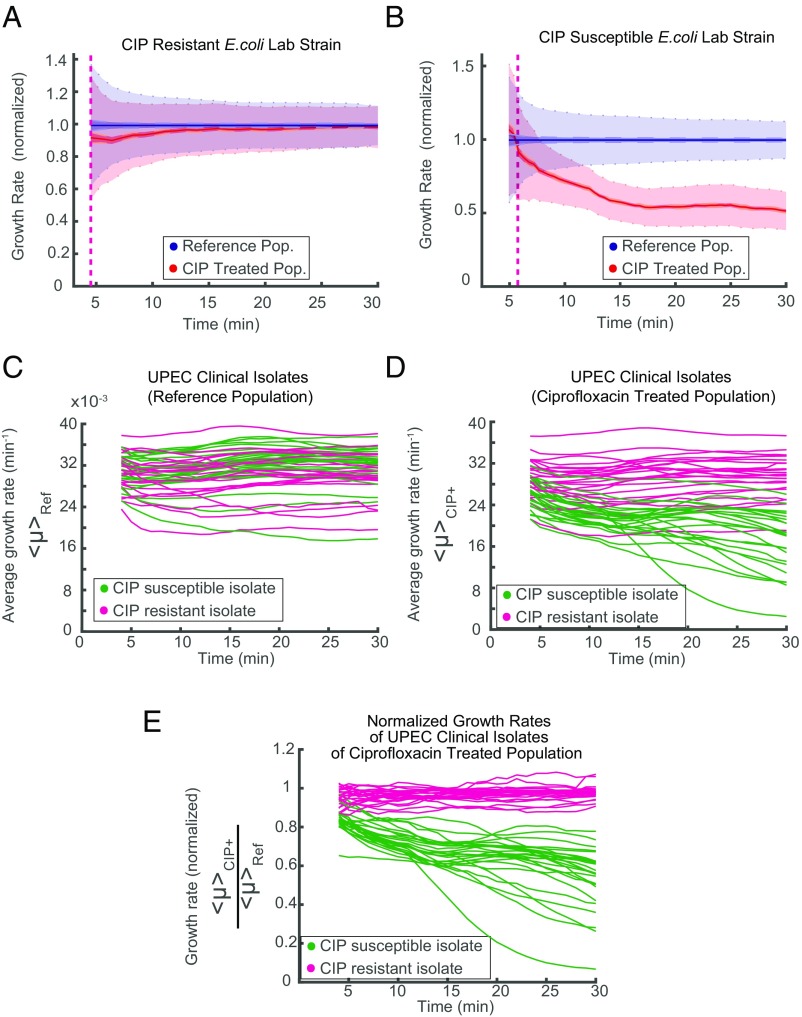
To be practically useful, fASTest needs to differentiate between strains with clinically relevant spectra of resistance mutations and susceptible strains in their responses to the antibiotic. This is important, because even resistant bacteria can show a growth rate reduction caused by the presence of an antibiotic, and one cannot, therefore, directly conclude that a strain is susceptible just because it has impaired growth compared with untreated cells (as seen in Fig. 3). For this reason, we first tested CIP susceptibility of an E. coli strain that was genetically engineered to be resistant to ciprofloxacin (CipR) because of the introduction of several clinically observed mutations (gyrA1-S83L gyrA2-D87N parC-S80I) (19) and compared the results with those of the congenic susceptible WT E. coli strain (CipS) (Fig. 4 A and B). During the first minutes of the test, the CipR strain grew slightly slower when treated with CIP than its untreated reference population (Fig. 4A) before recovering to the same growth rate. The CipS strain responded more strongly (Fig. 4B), which made it possible to distinguish the WT strain from its constructed resistant counterpart in a few minutes.
Fig. 4.
fASTest for resistant and susceptible strains. Laboratory strains of (A) CIP-resistant and (B) -susceptible E. coli are tested for CIP susceptibility. (C–E) Forty-nine clinical isolates of UPEC are tested with fASTest for CIP susceptibility. (C) Average growth rates for the reference populations. (D) Average growth rates for the treatment populations. Color coding indicates magenta for clinically resistant to CIP and green for clinically susceptible to CIP. (E) Growth rate of treated populations normalized for the growth rate of the respective reference population.
Next, we tested 50 clinical isolates of uropathogenic E. coli (UPEC) strains for CIP susceptibility. Samples were initially collected and characterized by the Uppsala University Hospital Clinical Microbiology Laboratory using the gold standard disk diffusion test for CIP susceptibility/resistance as a part of routine for clinical diagnosis. The antibiotic susceptibility of isolates was tested by the disk diffusion method recommended by the European Committee on Antimicrobial Susceptibility Testing (5). A total of 25 CIP-susceptible and 25 CipR isolates were given to us. We received those samples blinded: without the patient or the CIP susceptibility information. One isolate did not grow in the liquid cultures during the preparations and was, therefore, excluded from the study. The remaining 49 isolates were tested for CIP susceptibility using the fASTest. Subsequently, the results were compared with the results from the hospital.
The fASTest results of 49 UPEC clinical isolates are given in Fig. 4 C–E. The growth rate of the untreated reference population varied between the isolates without any obvious differences between resistant and susceptible isolates (Fig. 4C). CIP growth rates of treated populations did not reveal a striking distinction between the resistant and the susceptible isolates (Fig. 4D). However, when the growth rate of the CIP-treated population was normalized with the growth rate of the untreated reference population from the same experiment, susceptible and reference isolates grouped apart after the first 10 min (Fig. 4E). As can be seen in Fig. 4E, all of 24 resistant strains and 25 susceptible strains were grouped in agreement with gold standard disk diffusion measurements within 10 min. This complete agreement corresponds to 86.28–100.00% sensitivity and 85.75–100.00% specificity for detecting resistance.
SI Materials and Methods
Chip Design and Features.
Here, we describe the features of the chip that we have designed to improve the capturing, imaging, and manipulation of individual bacteria. We refer to the general chip design as x growth condition Mother Machine (xGMM), where the x refers to the number of parallelization options for a given Mother Machine chip. The multiple modes of operation are explained below.
The main feature of xGMM consists of a cell trap region (Fig. S1C), with cell traps parallel to each other and perpendicularly connected from both ends to a front channel and a back channel that are parallel to each other. The cell trap size can be manufactured according to the dimensions of the cells to be studied. For the Escherichia coli that is studied in this paper, we used 50-µm-long cell traps with 1.25 × 1.25-µm cross-sectional area. The pitch can also vary according to the purpose of the chip, but in this study, we used chips with cell traps every 3 or 4 µm.
The front and back channels have a fluidic connection to each other only through the cell traps. In each cell trap, 3 µm away from the point that is connected to the back channel, there is a constriction region of 1-µm length, where the width of the cell trap is 300 nm. E. coli cells are captured, because they cannot easily pass through the constriction region when they flow from the front channel to the back channel through the traps during loading.
To prevent the flow of the large particles (i.e., dust, precipitates in the GM) and capture large air bubbles, we have included a filter region (Fig. S1B) at each fluidic port. The filter region has different zones that gradually decrease the filtration size to prevent clogging. In sequence, it captures particles bigger than 160, 80, 40, 20, and 10 µm at different parts of the port and prevents anything bigger than 10 µm from flowing in. The distances between the different filtration zones are designed to be the size of the next filtration region, thereby creating an extra filtration effect between two zones (e.g., distance between the 160-µm zone and the 80-µm zone is 80 µm). This also increases the filtration capacity.
Some features of the chip are designed specifically to aid faster image acquisition or a more precise image processing algorithm. These features are the empty traps, the dot code regions, and two parallel cell trap rows located close enough to each other to fit into the same field of view at 20× magnification.
At a fixed periodicity, there are built-in empty traps (Fig. S1C) that have constrictions in the front end of the traps instead of the back, preventing the entry of any cell during the loading. The empty traps are used by the image processing algorithm for background subtraction (see below), which increases the contrast and makes it easier to detect cell poles.
A dot barcode is imprinted next to each empty trap. The dot barcode is used to identify the indices of the adjacent cell traps using a binary code consisting up to 12 dots (Fig. S1C): 10 dots for the binary code and 1 top dot and 1 bottom dot to specify the positioning of the code region.
The two cell trap rows of 2GMM are located 150 µm apart from each other and parallel. In the field of view of a 20× magnified phase contrast image covering ∼261 × 348 µm, all of these structures can fit for an ∼100-cell trap-wide section of the chip from both of the rows. Thus, during the automated image acquisition, the motorized x–y stage of the microscope needs to mainly move in the x axis, which maximizes the positions that can be imaged in a given time, thereby minimizing the frame rate and increasing the time resolution.
Alternative Modes of Operations and Parallelization.
In each 2GMM, there are two distinct cell trap regions, also mentioned as cell trap rows (or simply rows). Fluidic isolation of these rows from each other enables the delivery of two distinct fluid streams simultaneously, which permits parallel testing. If the aim is to test one strain with two different GM conditions in parallel, then the running step benefits from the fluidic isolation of the two rows, and each GM is applied to a different row. For example, for the fASTest, we use the 2GMM by punching holes only in the necessary ports 2.0 (cell culture loading port), 5.1 and 5.2 (washout ports), 2.1 and 2.2 (waste ports), and 3.1 and 3.2 (media ports) (Fig. S1A). Meanwhile, all other ports are not used.
Mold Production.
Molds are produced by the company NMetis according to our design. The substrates are 3-in Si wafers of 1,000-µm thickness. The mold is produced in three stages. First, an SiO2 layer is formed using thermal oxidation. Second, cell traps and optical alignment marks are etched in the oxide layer using a combination of electron beam lithography, reactive ion etching, and wet etching. Third, the lithography of flow channels, ports, and filtering regions is made in a 10-µm-thick SU8 layer. Some of the features of the 2GMM mentioned above can be seen from the scanning EM images of the 2GMM mold (Fig. S2).
Micromolding.
The microfluidic chip consists of two parts: a cover glass (1.5) and a micromolded silicon elastomer (Sylgard 184; PDMS) that are covalently bonded together. For micromolding, we used the standard soft lithography techniques. PDMS (Sylgard 184; Dow Corning), base, and the curing agent are mixed thoroughly at 1:10 ratio using a homogenizer (FastPrep-24; MP Biomedicals). The mixture is degassed by centrifuging at 1,878 × g for 30 s. After pouring the mixture into the molds, it is further degassed under vacuum. Curing is done at 100 °C for 1 to 15 h. Demolding is followed by dicing micromolded arrays of PDMS chips into individual PDMS chips, punching fluidic connection ports, and cleaning the surface of PDMS chips. Cover glasses were precleaned under running deionized water for dust and particles, and then, they were incubated in glass cleaning liquid [0.2% (vol/vol) Helmanex III in Mili-Q water] in a Teflon vessel with sonication for 45 min and rinsed thoroughly with and stored in Mili-Q water. Before bonding, the surfaces of both the PDMS and the cover glass are cleaned and activated. PDMS surfaces are cleaned by Scotch Magic Tape (3M) initially followed by an isopropyl alcohol (Sigma-Aldrich) dip and blow-dried using clean pressurized air. Surface activation is done using air plasma treatment using the HPT-200 Benchtop Plasma System (Henniker Plasma) at one-half power (100 W) for 30 s. The surfaces are cleaned using a UV-Ozone Cleaner for 10 min. Right after that, the surface activation is done by applying a local corona discharge from a high-frequency spark generator by scanning the application probe over the surfaces for 30–60 s, staying approximately within 5–10 mm of the surfaces. The activated PDMS surface is placed on the activated surface of the cover glass to initiate the bonding. After initial attachment, the microfluidic chip is placed at a temperature of 100 °C for at least 30 min.
Macrofluidic Setup Details.
The fluid reservoirs are 15-mL Falcon tubes with reusable reservoir adapters (Elveflow). Tygon tubing (i.d. = 510 µm, o.d. = 1,524 µm; Saint-Gobain) is used to connect each reservoir to the chip (length of 100 cm). The tubing is connected to the chip using a custom-made metal connector (23-gauge, 14-mm-long tubing bent in the middle at 90°; New England Small Tubing). During loading, both the media and the loading reservoirs are pressurized at 500 mbar, and during the running, only the media reservoirs are pressurized at 100 mbar. Pressure control is done using OB1-Mk3 from Elveflow. Waste ports are connected to 10 cm of tubing, the other end of which is open and level with the chip.
Image Processing.
For image processing, we developed an algorithm encoded in MATLAB. The algorithm has subsections with different functions as explained below.
Note on representation of images in MATLAB.
A 2D image with pixels is represented in MATLAB as a 2D matrix of elements arrayed in columns and rows. Location of each pixel on the x axis of the image is represented in the column number of the element, and location of each pixel on the y axis of the image is represented in the row number of the element. Each element’s value represents the (16-bit) gray value of the corresponding pixel.
Region of interest detection.
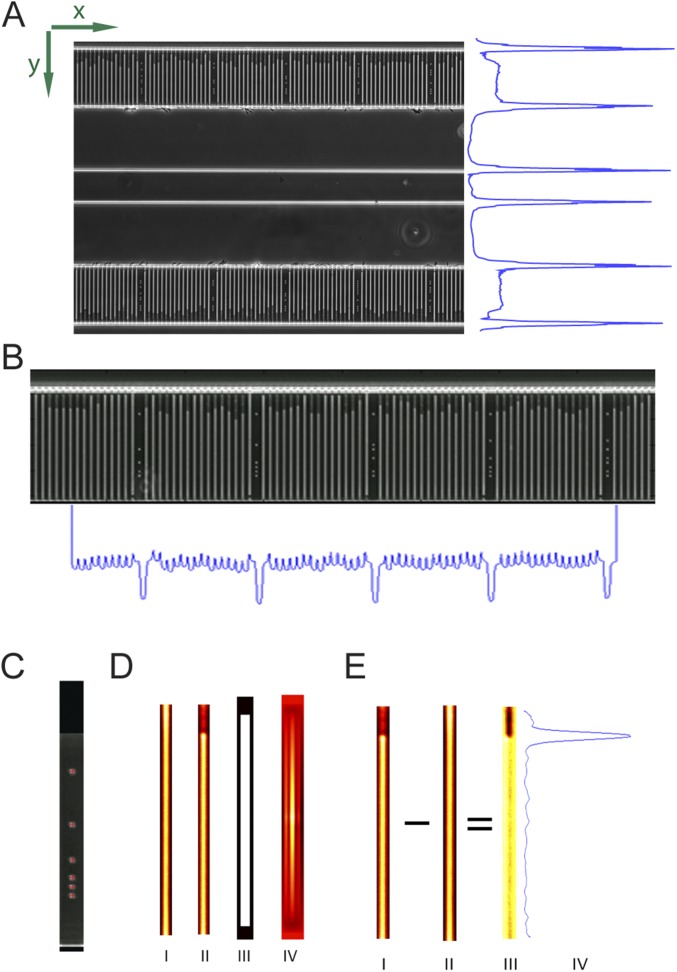
The bottom and top rows need to be detected and cropped. The known physical distance between the two rows means that only one row needs to be precisely detected: here, the top row (higher in y value). A first estimate of the location of the top row is obtained by detecting the bright horizontal lines by summing the pixel values along the x axis of each frame to obtain the intensity profile along the y axis of the image region (Fig. S7A). This profile is then smoothed to flatten noise, and the two top (highest y-value) lines provide an estimate of the location of the top row. The more precise estimate of the location is obtained by detecting the top dot of the barcode located between the cell traps. The dots are located using a radial symmetry dot detection algorithm (23). The median location of all top dots provides a precise location of the row in the image region (Fig. S7C).
Fig. S7.
Image processing steps: (A) region of interest (ROI) detection, (B) cell trap detection, (C) precise ROI detection using the dot barcode, (D) empty trap detection [empty cell trap (I), occupied cell trap (II), template for empty trap averages (III), average empty trap (IV)], and (E) background removal and cell pole detection [occupied cell trap (I), average empty trap (II), enhanced contrast of the occupied trap (III), profile of intensity changes through the contrast enhanced occupied cell trap image (IV)].
Cell trap detection.
After the rows are cropped, the cell traps are detected. For the first frame, a first estimate of the locations of the cell traps is computed by summing the pixel values of the image along the y axis to get the intensity profile along the x axis and detecting the peaks in the intensity profile region (Fig. S7B). Because the cell traps are brighter than the rest of the image, on the intensity profile, they appear as peaks of high intensity. For all subsequent frames, the precise location from the previous frame is used as a first estimate. Using this first estimate based on the previous frame, the precise locations of the cell traps are obtained in the current frame by computing the cross-correlation between each cell trap region and a cell trap mask, a binary image depicting a rectangle the size of a cell trap in white and the background in black.
Empty trap finding.
The empty traps, designed to block entry of cells, need to be identified, so that they can be subtracted from all of the other cell traps to subtract background and thereby improve cell pole detection (Fig. S7D). The empty traps are bright and have a uniform intensity profile. Therefore, to identify them, all cell traps are sorted based on the summed intensity of the pixels in the middle of each cell trap along the y axis. Of the four brightest in each imaging position, the one with minimal summed derivative (i.e., the most uniform cell trap) is selected. A single best (the brightest and most uniform) empty trap is detected in the first frame of each imaging position. The selection process is repeated one more time among those selected cell traps from different positions to select the top three cell traps of all positions. A virtual empty trap produced by averaging these top three empty traps is used as a global empty trap during background subtraction.
Background removal and pole detection.
For each cell trap in each frame of each imaging position, the empty trap is subtracted, and the intensity is rescaled to increase the intensity resolution of the cell trap region (Fig. S7 E, I–III). The pixel values for each cell trap are summed along the x axis to provide the intensity profile along the y axis of the cell trap. The intensity profile is smoothed to flatten noise, and its approximate derivative is computed to indicate the locations of the biggest intensity changes. The absolute value of the approximate derivative is computed and smoothed; this provides the profile of the intensity changes and therefore, the poles of cells in the cell trap (Fig. S7 E, IV). The peaks of this profile are extracted; the one with the highest y coordinate is selected as being the foremost cell pole of the cell trap, and the back end of the cell trap that is closest to the back channel is the one with the lowest y coordinate, whereas the front end has the highest y coordinate.
Data Analysis.
Data analysis consists of pole tracking, growth rate calculation using a sliding window, filtering the data for erroneous pole detections, and calculation of separation time.
Pole tracking.
The cell poles are considered to be particles and tracked using uTrack (22).
Growth rate calculation with sliding window.
The tracking algorithm outputs trajectories, each of which contains the location (y coordinate) of the tracked cell pole in each frame that it is tracked; y-coordinate value also corresponds to the accumulated length of the cell(s) within the particular channel. For exponentially growing cells, the logarithm of cell length has a linear dependence on time. Thus, the growth rate is calculated by fitting a linear regression model to the logarithm of length and the frame number to find the best linear unbiased estimator (i.e., among all unbiased estimators that are linear functions of y, it has the smallest variance) (24). To be able to detect the changes in growth rate, we estimate the instantaneous growth rate using a sliding window of 20 frames. However, this poses a problem at the beginning of the experiment until the 20th frame. The first estimate is from the fifth frame, when for the first time, there are enough data points to have a reliable fit. Then, until the 20th frame, the estimate is based on all available frames.
Data Filtering Criteria.
Minimum number of data points in a trajectory.
If the cell pole detection is not consistently detecting the same cell pole, this is likely to result in short trajectories. For this reason, trajectories are discarded if they are shorter than 15 frames.
Maximum filling of the trap.
In some experiments, some of the traps might be overfilled during the loading. If a cell trap is loaded more than a certain percentage from the beginning, we, therefore, discard the trajectory from that trap. This also filters the dirt particles close to the open end of the trap that are incorrectly considered to be cell poles. For a trap length of 185 pixels, the trajectory is discarded if the initial y value of the trajectory is >160.
Minimum growth rate over the entire trajectory.
Sometimes, the detected cell poles are actually not real cell poles but debris or dead cells loaded in the cell trap, a glare caused by dirt on the coverslip or the illumination path creating an intensity variation that is detected as a cell pole. If the detected cell pole does not move during the experiment, the growth rate calculated from the entire trajectory will be close to zero. Thus, by requiring at least some growth throughout the experiment, these false cell poles are filtered out.
Antibiotics.
We have purchased the antibiotics and additives in powder form (Sigma-Aldrich; product numbers are given below) and made aliquots of 500× stock solutions. All of the stock aliquots are kept in the dark at −80 °C; for each experiment, one aliquot is thawed only once and used. Different antibiotics require different solvents. For this reason, we dissolved amoxycillin (31586–250MG) and clavulanate (C9874-1G) in phosphate buffer (0.1 mM, pH 6); DOR (32138–25MG) in physiological saline (0.85%); ampicillin, CIP (33434–100MG-R), FOS (34089–100MG), and MEC (33447–100MG) in deionized water; trimethoprim (46984–250MG), sulfamethoxazole (S7507-10G), and NIT (46502–250MG) in DMSO; and LEV (28266–1G-F) initially in 200 mM NaOH and then, diluted it twofold with deionized water. When using FOS, glucose-6-phosphate (G7879-500MG) dissolved in deionized water is added to the media to the final 25 µg/mL concentration as recommended.
fASTest Results of Low-Cell Density Cultures.
To show that fASTest can be used on the low-cell density cultures, we have randomly subsampled the original data in one of the experiments, where the WT E. coli is tested with CIP (1 µg/mL). We have compared subsampling to 951 cells (Fig. S3A), with subsampling to 85 cells (Fig. S3B). The separation time increased from 3 to 10 min. Most of the experiments in this manuscript were performed with >1,000 cells.
fASTest for Repeatable Detection of Drug Response Using Two Different Antibiotics.
To show that the response curves in fASTest are highly repeatable and that shape is mainly dependent on the drug being used, we tested susceptible E. coli (MG1655) for two different antibiotics and repeated the test for three biological replicates for each antibiotic (Fig. S4).
fASTest for Repeatable Detection of Drug Response in Standard Laboratory Medium and Urine.
We also tested CipR E. coli in fASTest using CIP and ampicillin without a reference population to show that response to ampicillin does not differ between the susceptible E. coli and CipR strains in three biological triplicates (Fig. S5 A–C). Also when urine was used as a GM and test medium instead of Mueller Hinton Broth, the CipR E. coli showed a very reproducible response to CIP and ampicillin among three biological replicates (Fig. S5 D–F).
fASTest for Different Bacterial Species: K. pneumoniae and S. saprophyticus.
To show that the fASTest can be also be used with species other than E. coli, we tested two other species that are the most common after E. coli in uncomplicated UTIs, K. pneumoniae and S. saprophyticus, for CIP susceptibility (Fig. S6). K. pneumoniae (Movie S2), a rod-shaped Gram-negative bacterium grows very similar to E. coli (Movie S1) in the chip. Also, S. saprophyticus (Movie S3), a bundle-forming coccal bacterium, managed to grow, although the division in alternating axes was restricted in one of the axes when restricted into our cell traps. The slower growth rate of S. saprophyticus makes the assay both slower and nosier than that observed for the fast-growing E. coli and K. pneumoniae.
Discussion
This study originated in an investigation of the cell to cell variation in the bacterial cell cycle (20), which required us to develop tools to determine growth rates very accurately for individual E. coli cells. The process of averaging the growth rate from several hundred individual bacteria makes it possible to detect changes in growth as fast as the biological responses to the antibiotic (Fig. S4). For this reason, it is not possible to find a phenotypic AST based on the growth rate response that is faster than the fASTest. It is important to note that the same time resolution cannot be achieved in a bulk measurement of the growth rate, because in that case, the averaging is done over the cells before the readout, which means that the unavoidable readout noise will impact the growth rate estimate much more than if it is averaged over the cells after the readout.
The sensitivity of fASTest in terms of how many cells per milliliter can be detected is only dependent on how much time is spent loading the cells. For 104 cfu/mL, which is in the lower range for clinically relevant UTIs, sufficient loading can be achieved in 5 min, because for fASTest, it is sufficient to collect ≈100 bacteria. However, the sensitivity will practically depend on which body fluid the sample is collected from. For example, in UTI samples, there may be bacterial contamination from the skin or vaginal flora that sets the sensitivity limit for the infecting species. However, cell traps that contain contaminants may in many cases be excluded based on the morphology and growth rate of the contaminants.
A challenge related to contamination is polymicrobial infections. These are rare for uncomplicated UTIs but commonly observed for, for example, catheter users (21). Because we detect all bacteria in the sample and do not only detect those that grow under standard plating assays, polymicrobial infections can be detected as a high diversity of growth rates in the reference channel. If the mixed strains also display a diverse resistance pattern, this would be observed as a broadened growth rate distribution after antibiotic treatment. An actual point-of-care test would, therefore, have to consider other aspects of the growth rate distribution than just the average. There may, for example, be specific automated indications if a few individual bacteria keep growing fast in a background of dying cells, because this may indicate a polymicrobial infection with a complex resistance spectrum. An alternative strategy for the test to deal with polymicrobial infections and contaminations is to make it time sequential, such that the growth rate is determined for the cells in each cell trap before and after antibiotic treatment. This allows for focusing the analysis on only growing cells and avoiding biases in the averaging caused by an uneven distribution of different species between the reference channel and the treatment channel. A test also needs to consider the possible situation where the cells in the reference channel grow so slowly that a lack of response in treatment channel would be unreliable.
We have here focused on bacterial species and antibiotics related to UTIs, but it is likely that the same principles would work for sepsis, mastitis, or meningitis (i.e., in blood, milk, or cerebrospinal fluid that normally should be devoid of bacterial-sized cells). Independent of the sample, the key principle will be true: it is sufficient to measure the single-cell growth of a few hundred bacteria to get very close to the theoretical time limit for monitoring the response to an antibiotic in real time.
In summary, samples with more than 104 cfu/mL can be loaded in less than 10 min, and thus, no precultivation is needed for patient urine samples. Furthermore, any eukaryotic cell in the sample will be too large to pass through the filtration region within the microfluidic chip or enter the cell channels and disturb the assay. Thus, the combined AST time (loading, measurement, and readout) of the sample is less than 30 min. Based on the small clinical study of CIP susceptibility, the observed sensitivity and specificity of the assay are in 100% agreement with existing but prohibitively slow methodology.
Materials and Methods
The Microfluidic Chip.
The microfluidic chip consists of a cover glass (1.5) and a micromolded silicon elastomer [Sylgard 184; polydimethylsiloxane (PDMS)] that are covalently bonded together. For micromolding, we used the standard soft lithography techniques as described in SI Materials and Methods.
fASTest Protocol.
All of the fASTest runs described in this paper follow this common protocol: growth of overnight culture (ONC), growth of loading culture, connection of microfluidic flow control setup to the microfluidic chip, aligning the chip to the camera, selection of positions to be imaged, running an imaging test to ensure the stability of the microfluidic chip, connecting the loading culture to the macrofluidic setup, loading the cells from loading culture, and starting the antibiotic application and automated phase contrast microscopy.
Bacterial Strains.
The strains used were WT strain DA5438 (E. coli MG1655), ampicillin-resistant strain DA28097 [E. coli del(PlacI_lacIZYA)::amp], CipR strain DA20859 (E. coli gyrA1-S83L, gyrA2-D87N, parC-S80I), and two other species: DA12755 (K. pneumoniae; ATCC13883) and DA14015 (S. saprophyticus).
GM.
Depending on the experiment, we used either Mueller–Hinton Broth (70192–500G; Sigma-Aldrich) or urine as GM. When indicated, the GM was supplemented with an antibiotic. In preparation of urine media, morning urine was collected, and filtered (nitrocellulose filter; 0.2-µm pore size). All media are supplemented with a surfactant [Pluronic F-108; 542342; Sigma-Aldrich; 0.085% (wt/vol) final concentration] to prevent the attachment of the bacteria to the PDMS surface.
Culture Conditions.
For ONC, bacteria from the glycerol stocks were inoculated into 2 mL GM and incubated (37 °C; shaking at 225 rpm) for ∼16 h. For loading culture, 2.5 µL ONC is diluted 1:800 to a total of 2 mL GM and incubated (37 °C; shaking at 225 rpm) for 120 min. For growth in the chip, the chip was continuously supplied with GM and incubated in the microscope cage incubator at 37 °C before, during, and after the loading of bacterial culture and also, during the test. The loading culture was connected to the fluidic setup and kept in the cage incubator at 37 °C. GM was kept outside of the cage incubator at room temperature (21 °C).
Microfluidic Flow Control Setup Details.
Flow direction and rate during the experiment were maintained by pressure-driven flow. An electropneumatic controller from Elveflow (OB1 MkIII) regulated the air pressure applied to the closed fluidic reservoirs. Pressures, flow rates, and tubing details are explained in SI Materials and Methods. The electropneumatic controller was programmed in MATLAB.
Automated Phase Contrast Microscopy.
We used a Nikon Ti-E inverted microscope with a 20× objective (CFI Plan Apo Lambda DM 20× or CFI S Plan Fluor ELWD ADM 20×), with a motorized x–y stage, and a CMOS camera (DMK23U274; The Imaging Source). The setup was maintained within the Cage Incubator Enclosure (custom made by Okolab), where the temperature was maintained at 37 °C by a temperature controller (Airtherm-Atx; World Precision Instruments). Both the microscope and the camera were controlled by an open source microscopy software (MicroManager 1.4.19). Phase contrast images were acquired by the software’s multidimensional acquisition feature, through which the motorized stage moved the fluidic chip to 36 different positions. Each position was imaged every 30 or 60 s depending on the particular experiment. Each experiment was 30 min, although the imaging could be continued longer if needed to provide insights on kill dynamics.
Image Processing.
The images were processed for detection of each row in the raw image and cell traps and empty traps in each row, removing background and performing pole detection to obtain the cell pole detection in each frame of each position using an algorithm developed in MATLAB. Details of this algorithm are given in SI Materials and Methods and Fig. S7.
Data Analysis.
For cell pole tracking, we used µTrack (22). For growth rate calculation of individual cells, we applied a sliding window of data points (length) and fitted a linear function to the logarithm of them. The sliding window grows from 2 to 10 min in the beginning of the experiment and stays at 10 min afterward. We filtered some data based on fixed criteria to remove misidentified particles or cells that were dead from the beginning as well as the traps that were overly filled or left empty during the loading. Details of filters applied are given in SI Materials and Methods.
All raw data will be made available upon request for noncommercial interests. The ethical review committee in Uppsala has no objection to this study (reference no. 2017/051).
Supplementary Material
Acknowledgments
This work was supported by the Swedish Research Council (D.I.A. and J.E.), the European Research Council (J.E.), and the Knut and Alice Wallenberg Foundation (J.E.).
Footnotes
Conflict of interest statement: The chip design is being patented (PCT/SE2015/050685). The fast antibiotic susceptibility test is being developed into a product by a company of which Ö.B. and J.E. are shareholders.
This article is a PNAS Direct Submission.
This article contains supporting information online at www.pnas.org/lookup/suppl/doi:10.1073/pnas.1708558114/-/DCSupplemental.
References
- 1.Kerremans JJ, et al. Rapid identification and antimicrobial susceptibility testing reduce antibiotic use and accelerate pathogen-directed antibiotic use. J Antimicrob Chemother. 2008;61:428–435. doi: 10.1093/jac/dkm497. [DOI] [PubMed] [Google Scholar]
- 2.Doern GV, Scott DR, Rashad AL. Clinical impact of rapid antimicrobial susceptibility testing of blood culture isolates. Antimicrob Agents Chemother. 1982;21:1023–1024. doi: 10.1128/aac.21.6.1023. [DOI] [PMC free article] [PubMed] [Google Scholar]
- 3.van Belkum A, et al. Rapid clinical bacteriology and its future impact. Ann Lab Med. 2013;33:14–27. doi: 10.3343/alm.2013.33.1.14. [DOI] [PMC free article] [PubMed] [Google Scholar]
- 4.Jenkins SG, Schuetz AN. Current concepts in laboratory testing to guide antimicrobial therapy. Mayo Clin Proc. 2012;87:290–308. doi: 10.1016/j.mayocp.2012.01.007. [DOI] [PMC free article] [PubMed] [Google Scholar]
- 5.Matuschek E, Brown DFJ, Kahlmeter G. Development of the EUCAST disk diffusion antimicrobial susceptibility testing method and its implementation in routine microbiology laboratories. Clin Microbiol Infect. 2014;20:O255–O266. doi: 10.1111/1469-0691.12373. [DOI] [PubMed] [Google Scholar]
- 6.Frickmann H, Masanta WO, Zautner AE. Emerging rapid resistance testing methods for clinical microbiology laboratories and their potential impact on patient management. BioMed Res Int. 2014;2014:375681. doi: 10.1155/2014/375681. [DOI] [PMC free article] [PubMed] [Google Scholar]
- 7.Reece A, et al. Microfluidic techniques for high throughput single cell analysis. Curr Opin Biotechnol. 2016;40:90–96. doi: 10.1016/j.copbio.2016.02.015. [DOI] [PMC free article] [PubMed] [Google Scholar]
- 8.Murray C, Adeyiga O, Owsley K, Di Carlo D. Research highlights: Microfluidic analysis of antimicrobial susceptibility. Lab Chip. 2015;15:1226–1229. doi: 10.1039/c5lc90017d. [DOI] [PubMed] [Google Scholar]
- 9.Kim SC, Cestellos-Blanco S, Inoue K, Zare RN. Miniaturized antimicrobial susceptibility test by combining concentration gradient generation and rapid cell culturing. Antibiotics (Basel) 2015;4:455–466. doi: 10.3390/antibiotics4040455. [DOI] [PMC free article] [PubMed] [Google Scholar]
- 10.Choi J, et al. Rapid antibiotic susceptibility testing by tracking single cell growth in a microfluidic agarose channel system. Lab Chip. 2013;13:280–287. doi: 10.1039/c2lc41055a. [DOI] [PubMed] [Google Scholar]
- 11.Hou Z, et al. Time lapse investigation of antibiotic susceptibility using a microfluidic linear gradient 3D culture device. Lab Chip. 2014;14:3409–3418. doi: 10.1039/c4lc00451e. [DOI] [PubMed] [Google Scholar]
- 12.Choi J, et al. A rapid antimicrobial susceptibility test based on single-cell morphological analysis. Sci Transl Med. 2014;6:267ra174. doi: 10.1126/scitranslmed.3009650. [DOI] [PubMed] [Google Scholar]
- 13.Quach DT, Sakoulas G, Nizet V, Pogliano J, Pogliano K. Bacterial cytological profiling (BCP) as a rapid and accurate antimicrobial susceptibility testing method for Staphylococcus aureus. EBioMedicine. 2016;4:95–103. doi: 10.1016/j.ebiom.2016.01.020. [DOI] [PMC free article] [PubMed] [Google Scholar]
- 14.Schoepp NG, et al. Digital quantification of DNA replication and chromosome segregation enables determination of antimicrobial susceptibility after only 15 minutes of antibiotic exposure. Angew Chem Int Ed Engl. 2016;55:9557–9561. doi: 10.1002/anie.201602763. [DOI] [PMC free article] [PubMed] [Google Scholar]
- 15.Stamm WE, Norrby SR. Urinary tract infections: Disease panorama and challenges. J Infect Dis. 2001;183:S1–S4. doi: 10.1086/318850. [DOI] [PubMed] [Google Scholar]
- 16.Wang P, et al. Robust growth of Escherichia coli. Curr Biol. 2010;20:1099–1103. doi: 10.1016/j.cub.2010.04.045. [DOI] [PMC free article] [PubMed] [Google Scholar]
- 17.Slekovec C, et al. Impact of a region wide antimicrobial stewardship guideline on urinary tract infection prescription patterns. Int J Clin Pharm. 2012;34:325–329. doi: 10.1007/s11096-012-9606-6. [DOI] [PubMed] [Google Scholar]
- 18.Schmiemann G, Kniehl E, Gebhardt K, Matejczyk MM, Hummers-Pradier E. The diagnosis of urinary tract infection: A systematic review. Dtsch Arztebl Int. 2010;107:361–367. doi: 10.3238/arztebl.2010.0361. [DOI] [PMC free article] [PubMed] [Google Scholar]
- 19.Marcusson LL, Frimodt-Møller N, Hughes D. Interplay in the selection of fluoroquinolone resistance and bacterial fitness. PLoS Pathog. 2009;5:e1000541. doi: 10.1371/journal.ppat.1000541. [DOI] [PMC free article] [PubMed] [Google Scholar]
- 20.Wallden M, Fange D, Lundius EG, Baltekin Ö, Elf J. The synchronization of replication and division cycles in individual E. coli cells. Cell. 2016;166:729–739. doi: 10.1016/j.cell.2016.06.052. [DOI] [PubMed] [Google Scholar]
- 21.Kline KA, Lewis AL. Gram-positive Uropathogens, polymicrobial urinary tract infection, and the emerging microbiota of the urinary tract. Microbial Spectr. 2016 doi: 10.1128/microbiolspec.UTI-0012-2012. [DOI] [PMC free article] [PubMed] [Google Scholar]
- 22.Jaqaman K, et al. Robust single-particle tracking in live-cell time-lapse sequences. Nat Methods. 2008;5:695–702. doi: 10.1038/nmeth.1237. [DOI] [PMC free article] [PubMed] [Google Scholar]
- 23.Loy G, Zelinsky A. Fast radial symmetry for detecting points of interest. IEEE Trans Pattern Anal Mach Intell. 2003;25:959–973. [Google Scholar]
- 24.Seber GAF, Lee AJ. Linear Regression Analysis. 2nd Ed. Wiley; Hoboken, NJ: 2003. Linear regression: Estimation and distribution theory; pp. 35–95. [Google Scholar]
Associated Data
This section collects any data citations, data availability statements, or supplementary materials included in this article.


