Significance
Women with polycystic ovary syndrome (PCOS) have reduced fertility and increased risk of developing type 2 diabetes. Adiponectin, an adipocyte-derived hormone, together with adipocyte size, is the strongest factor associated with insulin resistance in PCOS. The potential causal relationship among adiponectin levels, infertility, and metabolic dysfunction in PCOS is, however, unknown. Exploiting mouse models, we found that adiponectin is indeed involved in PCOS-related insulin resistance, and, albeit to a much smaller extent, is also involved in the development of reproductive dysfunction. Thus, increased levels of adiponectin can prevent prepubertal androgen-induced metabolic dysfunction in dihydrotestosterone-exposed mice with PCOS-like traits. Collectively, our findings support the notion that altered adipose tissue functionality is a key mediator of metabolic dysfunction in women with PCOS.
Keywords: polycystic ovary syndrome, insulin resistance, adipose tissue
Abstract
Adiponectin, together with adipocyte size, is the strongest factor associated with insulin resistance in women with polycystic ovary syndrome (PCOS). This study investigates the causal relationship between adiponectin levels and metabolic and reproductive functions in PCOS. Prepubertal mice overexpressing adiponectin from adipose tissue (APNtg), adiponectin knockouts (APNko), and their wild-type (WT) littermate mice were continuously exposed to placebo or dihydrotestosterone (DHT) to induce PCOS-like traits. As expected, DHT exposure led to reproductive dysfunction, as judged by continuous anestrus, smaller ovaries with a decreased number of corpus luteum, and an increased number of cystic/atretic follicles. A two-way between-groups analysis showed that there was a significant main effect for DHT exposure, but not for genotype, indicating adiponectin does not influence follicle development. Adiponectin had, however, some protective effects on ovarian function. Similar to in many women with PCOS, DHT exposure led to reduced adiponectin levels, larger adipocyte size, and reduced insulin sensitivity in WTs. APNtg mice remained metabolically healthy despite DHT exposure, while APNko-DHT mice were even more insulin resistant than their DHT-exposed littermate WTs. DHT exposure also reduced the mRNA expression of genes involved in metabolic pathways in gonadal adipose tissue of WT and APNko, but this effect of DHT was not observed in APNtg mice. Moreover, APNtg-DHT mice displayed increased pancreatic mRNA levels of insulin receptors, Pdx1 and Igf1R, suggesting adiponectin stimulates beta cell viability/hyperplasia in the context of PCOS. In conclusion, adiponectin improves metabolic health but has only minor effects on reproductive functions in this PCOS-like mouse model.
Polycystic ovary syndrome (PCOS) is the most common endocrine and metabolic disorder occurring in females (1). PCOS is one of the leading causes of poor fertility and is associated with abdominal obesity, metabolic syndrome, and an increased risk of developing type 2 diabetes (1, 2). Indeed, it has been demonstrated that 30–40% of women with PCOS have impaired glucose tolerance, and as many as 10% develop diabetes by the age of 40 y (3, 4). Despite the negative effect of PCOS on women’s health, very little is known about its etiology, including the causal relationship between the reproductive and metabolic features of PCOS. Adipose tissue dysfunction is implicated as a key feature, and both lean and obese women with PCOS have aberrant adipose tissue morphology (5–7). Specifically, we have found that large adipocyte size, low circulating adiponectin levels, and increased waist circumference, but surprisingly, not androgen excess, are factors that are most strongly associated with insulin resistance in women with PCOS (8). Others have shown that hyperandrogenism is associated with intra-abdominal fat deposition (9). Adiponectin is an adipocyte-derived hormone exerting potent positive effects on whole-body insulin sensitivity (10, 11), as well as on pancreatic beta-cell survival and functionality (12–14). In line with the beneficial effects of adiponectin on metabolic regulation, adiponectin knockout mice exposed to a high-fat diet display decreased hepatic insulin sensitivity and an impaired response to thiazolidinediones (15). Furthermore, overexpression of adiponectin is associated with improved whole-body insulin sensitivity and profound positive effects within adipose tissue, such as increased mitochondrial density in adipocytes, smaller adipocyte size, and transcriptional up-regulation of factors involved in lipid storage through efficient esterification of free fatty acids (16, 17).
Adipose tissue is now also recognized as an important factor in the complex equation by which nutritional status regulates female reproductive function (18). We have shown that adiponectin receptors 1 and 2 are increased in ovaries in PCOS rat models (19, 20), and accumulating evidence suggests a direct role for adiponectin in female reproductive tissues (18). Moreover, a lower proportion of theca cells express adiponectin receptors in polycystic ovaries compared with normal ovaries (21). In cultured theca cells, adiponectin suppresses androstenedione production and key enzymes in the androgen synthesis pathway (21), and placental cytotrophoblasts exposed to adiponectin modulate their steroidogenesis (22). However, adiponectin signaling is not essential for normal mouse reproduction, as adiponectin knockout mice can produce viable offspring.
Based on these observations, we hypothesize that altered adiponectin levels are causally involved in both the reproductive and metabolic disturbances associated with PCOS. To test this hypothesis, we exposed adiponectin knockout (APNko) and overexpressing transgenic (APNtg) mice along with their littermate wild-type (WT) controls to continuous dihydrotestosterone (DHT) exposure from puberty to adult life. DHT exposure has been shown to be a reproducible mouse model of PCOS, effectively mimicking many of the reproductive and metabolic disease features of patients with PCOS (23, 24). Using this approach, we found that elevated levels of adiponectin protect against DHT-induced insulin resistance and that this effect is associated with reduced adipocyte size, decreased visceral fat, and a more healthy adipose tissue, as reflected by restored adipose tissue and improved pancreatic gene expression. In contrast, lack of adiponectin led to more severe metabolic consequences in response to DHT/PCOS. Adiponectin had, however, only minor effects on reproductive functions in PCOS mice.
Results
DHT Exposure Alters Sex Hormone Levels, but Not LH and FSH.
To confirm that DHT exposure resulted in elevated serum DHT levels, sex hormone levels were determined. As expected, DHT levels were increased and testosterone levels decreased in DHT-exposed animals compared with in placebo (P) groups (Table 1).
Table 1.
Effects of DHT on fasting plasma levels and body composition estimated by dual-energy X-ray absorptiometry
| Variable | WT-P | WT-DHT | APNko-P | APNko-DHT | APNtg-P | APNtg-DHT |
| BW, g | 21.4 ± 0.5 | 24.4 ± 0.5** | 21.3 ± 1.0 | 24.6 ± 1.1* | 23.0 ± 0.7 | 24.6 ± 1.3 |
| Glucose, mmol/L | 7.7 ± 0.4 | 9.7 ± 0.6* | 7.5 ± 0.4 | 9.1 ± 0.6 | 8.2 ± 0.4 | 9.6 ± 0.8 |
| Insulin, mU/L | 9.70 ± 0.80 | 16.20 ± 3.10* | 7.88 ± 0.50 | 14.06 ± 2.10* | 9.20 ± 1.20 | 11.50 ± 1.60 |
| Adiponectin, ng/mL | 18,864 ± 660 | 13,646 ± 938*** | Not detected | Not detected | 23,092 ± 2,090‡ | 21,902 ± 2,698†† |
| Triglycerides, mmol/L | 0.24 ± 0.01 | 0.25 ± 0.01 | 0.20 ± 0.03 | 0.23 ± 0.02 | 0.12 ± 0.02 | 0.16 ± 0.0.3† |
| DHT, pg/mL | 24 ± 6 | 1,054 ± 280*** | 13 ± 5 | 1,084 ± 178*** | 20 ± 8 | 1,015 ± 239** |
| Testosterone, pg/mL | 87.6 ± 11.9 | 8.1 ± 1.0*** | 64.4 ± 16.9 | 8.7 ± 1.7** | 56.3 ± 14.1 | 5.5 ± 0.8** |
| Estradiol, pg/mL | 1.15 ± 0.27 | 0.09 ± 0.03*** | 0.57 ± 0.20 | 0.16 ± 0.08 | 3.30 ± 0.71‡‡ | 0.21 ± 0.16** |
| Progesterone, pg/mL | 3,412 ± 817 | 3,908 ± 476 | 3,013 ± 476 | 5,057 ± 693 | 1,712 ± 189 | 3,976 ± 372** |
| LH, pg/mL | 102 ± 6 | 82 ± 9 | 70 ± 8‡ | 79 ± 8 | 109 ± 10 | 82 ± 13 |
| FSH, pg/mL | 381 ± 30 | 374 ± 35 | 335 ± 37 | 245 ± 40 | 302 ± 48 | 264 ± 39 |
| LH/FSH ratio | 0.29 ± 0.03 | 0.23 ± 0.02 | 0.22 ± 0.0.02 | 0.38 ± 0.08* | 0.43 ± 0.03‡ | 0.38 ± 0.07 |
| Body fat, % of BW | 16.7 ± 0.7 | 20.6 ± 1.5* | 16.0 ± 2.0 | 20.4 ± 2.5* | 17.1 ± 1.6 | 18.7 ± 3.6 |
| Visceral fat, % of BW | 8.7 ± 0.5 | 12.1 ± 1.1** | 8.1 ± 0.9 | 11.6 ± 2.1* | 8.6 ± 1.0 | 8.9 ± 2.4 |
| s.c. fat, % of BW | 8.1 ± 0.2 | 8.4 ± 0.4 | 7.8 ± 1.1 | 8.8 ± 0.5 | 8.6 ± 0.8 | 9.8 ± 1.4 |
| LBM, % of BW | 83.2 ± 0.7 | 79.6 ± 2.1 | 84.3 ± 2.1 | 79.5 ± 2.4* | 82.9 ± 1.6 | 81.4 ± 3.6 |
| BMC, g | 0.41 ± 0.01 | 0.38 ± 0.01* | 0.41 ± 0.02 | 0.39 ± 0.01 | 0.42 ± 0.01 | 0.37 ± 0.01** |
| BMD, g/cm2 | 0.048 ± 0.0005 | 0.047 ± 0.0005 | 0.047 ± 0.0014 | 0.047 ± 0.0007 | 0.049 ± 0.0009 | 0.047 ± 0.0008* |
Values are mean ± SEM. BMC, bone mineral content; BMD, bone mineral density; BW, body weight; LBM, lean body mass. *P < 0.05, **P < 0.01, ***P < 0.001 for the effect of DHT within genotypes; †P < 0.05, ††P < 0.01 for the effect of DHT between genotypes; ‡P < 0.05, ‡‡P < 0.01 for the difference between genotypes receiving P.
APNtg-P mice had increased estradiol levels compared with WT-P mice, and both WT and APNtg animals exposed to DHT had lower estradiol levels compared with their placebo controls. There was a significant main effect for DHT exposure on both estradiol and progesterone levels; DHT decreased estradiol levels (P < 0.001) and increased progesterone levels (P = 0.024; Table 1). The luteinizing hormone (LH) and follicle-stimulating hormone (FSH) levels were similar among all groups, but there was a significant main effect for genotype on FSH and LH/FSH ratios. Post hoc comparisons indicated APNtg mice had increased their LH/FSH ratio compared with the WT group, irrespective of DHT exposure (P < 0.01). Only APNko mice had an increased LH/FSH ratio in response to DHT exposure (P < 0.05).
Increased Adiponectin Levels Do Not Protect Against DHT-Induced Anestrus and PCO Morphology.
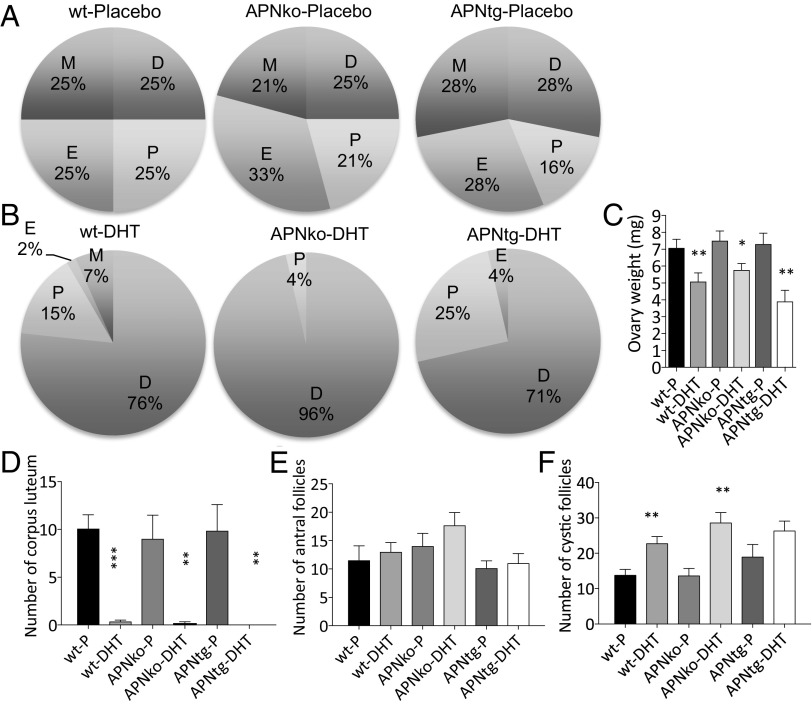
APNko and APNtg placebo groups had regular cycles and did not differ from their littermate placebo controls (Fig. 1A). Moreover, all ovaries contained fresh corpora lutea (Fig. 1D and Fig. S1), indicating recent ovulations. DHT exposure led to continuous anestrus, where most time was spent in pseudodiestrus (Fig. 1B), and this pattern differed from that of placebo-treated controls (P < 0.0001). The estrus cyclicity pattern was not different in APNtg-DHT compared with WT-DHT mice, but APNko-DHT mice spent more time in diestrus and less time in proestrus compared with DHT-exposed WTs (P < 0.05). In agreement with the disrupted estrus cycle, all DHT-exposed mice, irrespective of genotype, showed no or very few corpora lutea in the ovaries (Fig. 1D).
Fig. 1.
Estrous status in placebo (A) and DHT-exposed (B) mice, mean ovarian weights (C), number of corpus luteum (D), antral follicles (E), and cystic follicles (F) in ovaries from WT, APNko, and APNtg mice with and without DHT exposure (n = 7–10/group). D, diestrus; E, estrus; M, metestrus; P, proestrus. *P < 0.05, **P < 0.01, ***P < 0.001 for the effect of DHT within genotypes. Statistical significance was determined with a Mann–Whitney U test. Chi-square tests were used to analyze cyclicity.
Fig. S1.
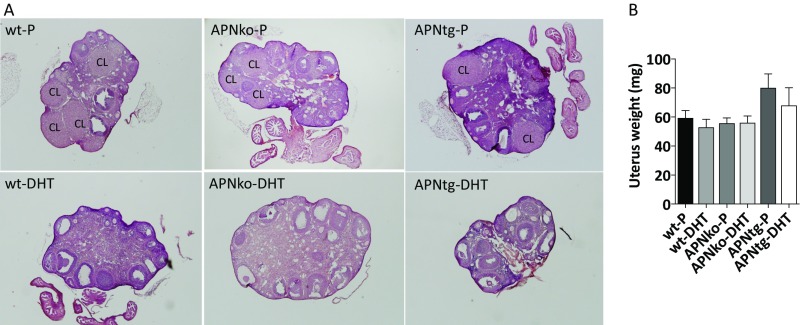
Ovarian gene morphology (A) and mean uterus weights (B). Representative images of ovaries from WT, APNko, and APNtg mice with placebo or DHT exposure. CL, corpus luteum. The Mann–Whitney U test was performed to compare the effect of DHT within genotypes and between DHT-exposed groups.
Ovaries of DHT-exposed mice of all three genotypes weighed less than their placebo controls, and there was no effect of adiponectin on this parameter (Fig. 1C). Uterus weight was not affected by either DHT or genotype (Fig. S1). Ovaries of DHT-exposed mice contained a similar number of antral follicles to placebo-treated control mice (Fig. 1E). The number of cystic and atretic follicles was increased in DHT-exposed WT and APNko mice (Fig. 1F); however, this difference was not found to be significant in APNtg mice (Fig. 1F).
Adiponectin Protects Against DHT-Induced Alterations in Cyp19a1 and Hsd3b, Which Are Genes Involved in Sex Hormone Steroidogenesis in the Ovary.
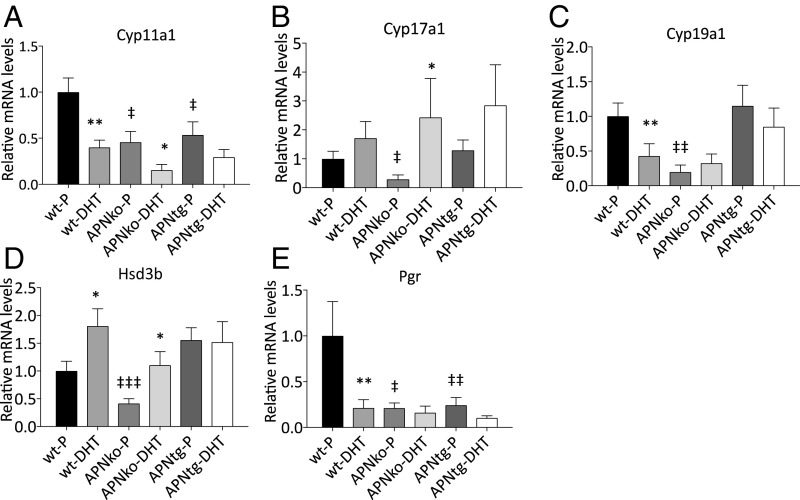
We measured the ovarian gene expression of four enzymes involved in sex hormone steroidogenesis: 3β-hydroxysteroid dehydrogenase (Hsd3b), 11α-hydroxylase (Cyp11a1), 17α-hydroxylase (Cyp17a1), and 19α-hydroxylase (Cyp19a1). Cyp11a1 and Cyp19a1 expressions were decreased with DHT exposure in WTs (Fig. 2). There was a significant main effect for DHT exposure across the genotypes for Cyp11a1 (P ≤0.001), Cyp17a1 (P < 0.05), and Hsd3b (P < 0.05). Cyp17a1 and Hsd3b increased while Cyp11a1 decreased with DHT exposure (Fig. 2). DHT exposure in APNtg mice did not alter Cyp19a1 and Hsd3b expression and did not differ from WT-P, suggesting adiponectin has some protective effects on ovarian steroidogenesis.
Fig. 2.
Mean mRNA expression levels of Cyp11a1 (A), Cyp17a1 (B), Cyp19a1 (C), Hsd3b (D), and Pgr (E) in the ovaries from WT, APNko, and APNtg mice with and without DHT exposure (n = 7–10/group). *P < 0.05, **P < 0.01 for the effect of DHT within genotypes; ‡P < 0.05, ‡‡P < 0.01 for the effect of genotype. A Mann–Whitney U test was performed to compare the effect of DHT within genotypes and between DHT-exposed groups.
Altered Pituitary Gene Expression in DHT-Exposed Mice.
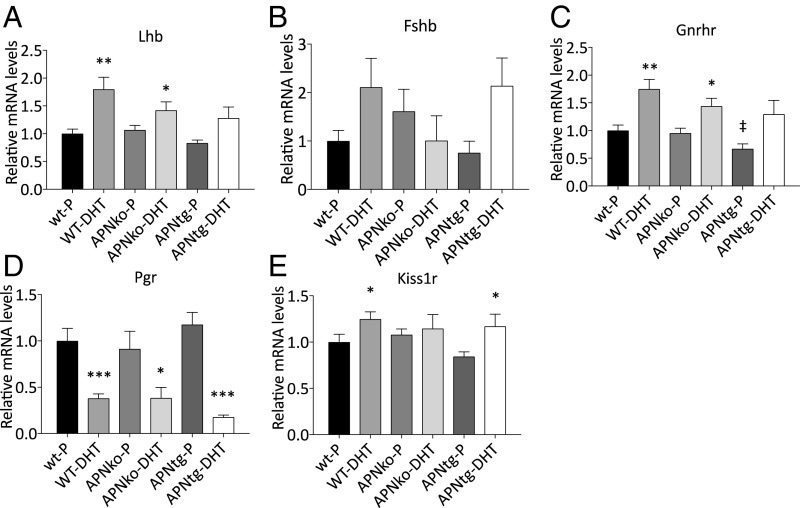
WT DHT-exposed mice had increased Lhb, Gnrhr, and Kiss1r and decreased Pgr mRNA levels in the pituitary (Fig. 3). Pituitary Lhb and Gnrhr were also increased in APNko-DHT mice, and Kiss1r was increased in APNtg-DHT mice (Fig. 3). The interaction effect between genotype and DHT exposure on pituitary gene expression was not significant for any of the investigated genes. There was a significant main effect for DHT exposure on Lhb, Gnrhr, and Pgr (P < 0.001) and Kiss1r (P < 0.05). There was no difference in gene expression between genotypes receiving placebo, indicating DHT exposure (and not genotype) has the main effect on the pituitary (Fig. 3). Thus, our data suggest adiponectin does not affect DHT-induced pituitary gene alterations.
Fig. 3.
Mean mRNA expression levels of Lhb (A), Fshb (B), Gnrhr (C), Pgr (D), and Kiss1r (E) in the pituitary in WT, APNko, and APNtg mice with and without DHT exposure (n = 7–10/group). *P < 0.05, **P < 0.01, ***P < 0.001 for the effect of DHT within genotypes; ‡P < 0.05 for the effect of genotype. A Mann–Whitney U test was performed to compare the effect of DHT within genotypes and between DHT-exposed groups.
Increased Adiponectin Levels Protect Against DHT-Induced Visceral Adiposity and Adipocyte Hypertrophy.
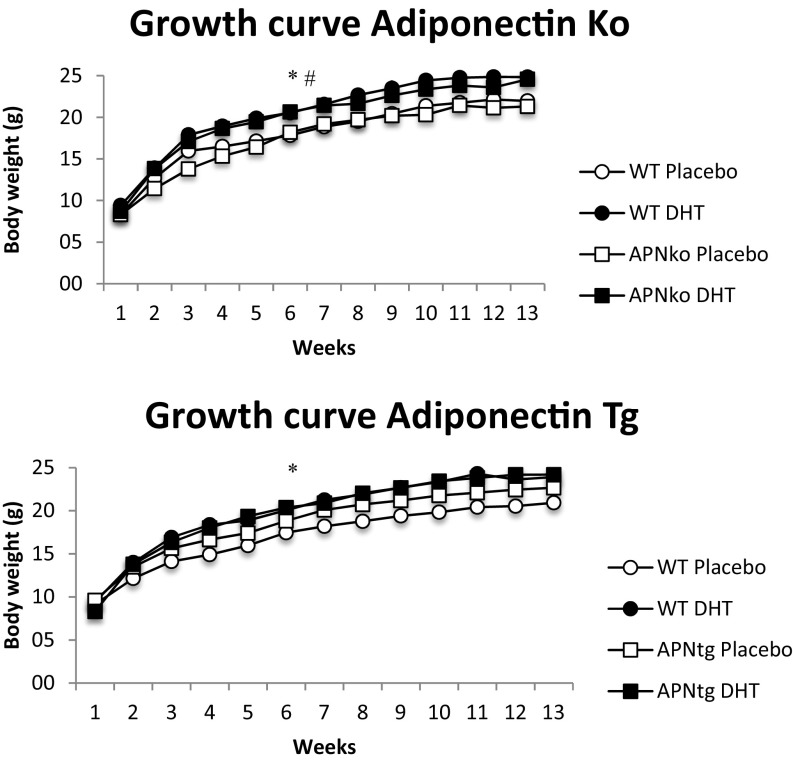
WT and APNko mice exposed to DHT had increased weight gain and body weight compared with their placebo controls (Table 1 and Fig. S2). There was, however, no difference between APNtg-P mice and APNtg-DHT-exposed mice (Table 1 and Fig. S2). At 16 wk of age, WT-DHT mice (on a transgenic background) had more total and abdominal fat compared with WT-P mice. APNtg-DHT mice, in contrast, did not demonstrate increased fat mass compared with APNtg-P mice (Table 1). APNko-DHT mice had more total body fat and, on average, 1.2 g more abdominal fat than their placebo controls, while their DHT-treated WT littermates tended to have more total body and abdominal fat than their placebo controls, but the difference did not reach statistical significance (P = 0.1; Table S1). There was no difference in s.c. fat mass percentage, and only a small increase in s.c. fat mass weight, between placebo and DHT in the knockouts (on average, 0.6 g more), indicating DHT-induced weight gain depends mostly on an increased expansion of the visceral adipose tissue compartment (Table S1). Bone mineral content and density were unaltered in APNko and their WT controls, irrespective of DHT exposure (Table 1). DHT exposure decreased bone mineral content in APNtg and WT controls, which was associated with decreased bone mineral density in APNtg (Table 1).
Fig. S2.
Growth curves for WT, APNko, and APNtg mice (n = 7–8/group). Values are mean ± SEM. *P > 0.05 WT-P vs. WT-DHT; #P > 0.05 APNko-P vs. APNko-DHT, using repeated measurement ANOVA.
Table S1.
Effects of DHT and adiponectin on body fat estimated by dual-energy X-ray absorptiometry
| WT-P | WT-DHT | APNko-P | APNko-DHT | APNtg-P | APNtg-DHT | |
| Body fat, g | 3.2 ± 0.2 | 4.6 ± 0.5* | 2.9 ± 0.3 | 4.7 ± 1.0* | 3.5 ± 0.5 | 3.3 ± 0.3†P = 0.071 |
| Visceral fat, g | 1.7 ± 0.1 | 2.7 ± 0.5** | 1.5 ± 0.2 | 2.7 ± 0.7* | 1.8 ± 0.3 | 2.1 ± 0.8 |
| s.c. fat, g | 1.5 ± 0.1 | 1.9 ± 0.2 | 1.4 ± 0.1 | 2.0 ± 0.3* | 1.8 ± 0.2 | 2.2 ± 0.5 |
Values are mean ± SEM.
P < 0.05 for the effect of DHT.
The effect of genotype, n = 7–8.
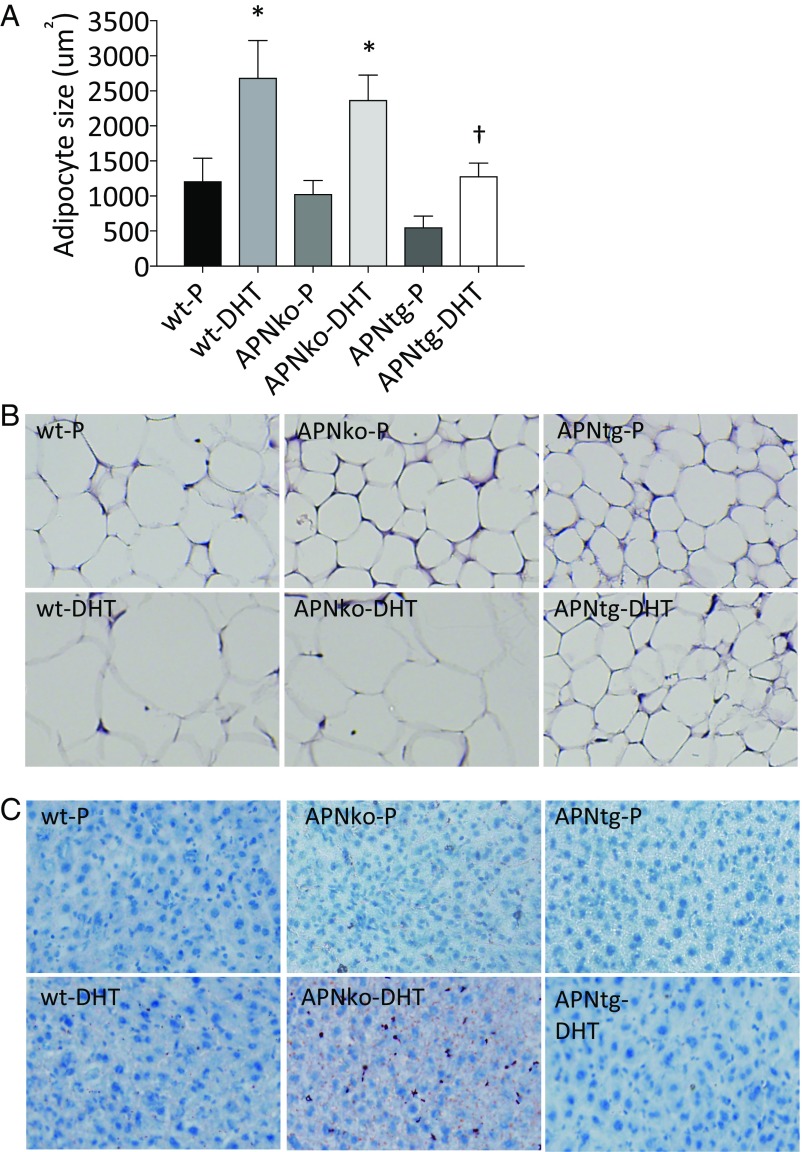
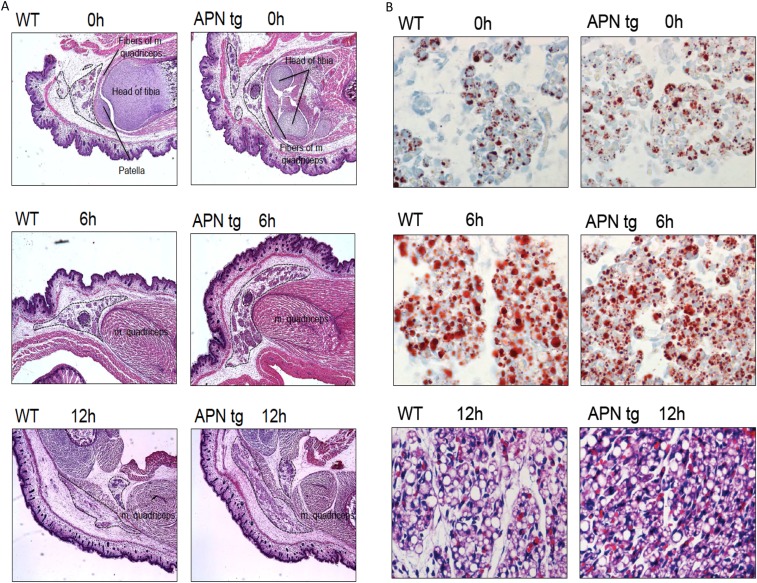
The mean adipocyte size in inguinal adipose tissue was about twofold larger in DHT-exposed mice than in their placebo controls (Fig. 4 A and B). In line with our previous study (16), we found a trend toward smaller adipocytes in APNtg compared with WT in the placebo group (P = 0.1). This difference between genotypes reached statistical significance in the DHT groups (Fig. 4 A and B). Thus, increased adiponectin levels do not prevent DHT-induced adipocyte hypertrophy; however, APNtg mice, by virtue of smaller adipocytes, appear to be better protected against adipocyte hypertrophy. Indeed, we have noticed that the inguinal adipose tissue development in APNtg animals is different from that in littermate controls. According to histological analysis of the inguinal area of newborn pups, we found that the area of differentiating adipocytes is larger and more cell dense in the APNtg mice (Fig. S3 A and B), which eventually leads to an increased number of mature adipocytes. Serum adiponectin was lower in WT-DHT mice compared with controls. APNko animals had as expected no detectable levels of adiponectin, while APNtg animals had elevated levels compared with controls. Adiponectin levels in APNtg-DHT animals were similar to APNtg-P (Table 1).
Fig. 4.
Subcutaneous adipocyte size (A, n = 4/group) in WT, APNko, and APNtg mice. Histological sections showing s.c. adipose tissue (B) and Oil Red O staining in liver (C). *P < 0.05 for the effect of DHT within genotypes; †P < 0.05 for the effect of DHT between genotypes. Values are mean ± SEM. A Mann–Whitney U test was performed to compare the effect of DHT within genotypes and between DHT-exposed groups. Chi-square tests were used to analyze liver steatosis.
Fig. S3.
(A) Representative H&E sections from the inguinal area of newborn pups (0, 6, and 12 h after birth) from APNtg and littermate controls at 4x magnification. Areas within the dashed lines are filled with cells containing lipid droplets (i.e., most likely newborn adipocytes), and these areas are larger in APNtg mice than in littermate WT controls. (B) Upper two rows show representative Oil Red O sections from inguinal adipose tissue of newborn pups (0 and 6 h after birth) from APNtg and littermate controls at 40× magnification. Lowest row shows representative H&E sections from inguinal adipose tissue of 12-h-old pups from APNtg and littermate controls at 40× magnification. APNtg mice display smaller lipid droplet size at 6 h of age and slightly smaller adipocyte size at 12 h of age. Overall, these data indicate that APNtg mice develop more, but smaller, adipocytes in their inguinal depot.
Decreased Serum Triglyceride Levels in APNtg Mice.
Serum levels of triglycerides were lower in DHT-exposed APNtg mice compared with WT-DHT mice, but were unaltered in APNko mice (Table 1). There was, however, an increased deposition of liver lipids in APNko-DHT mice compared with placebo controls (Fig. 4C; P = 0.043). All other groups had very low amounts of liver lipids, and there was no difference between placebo and DHT-exposed WT or APNtg mice (Fig. 4C).
Maintained Insulin Sensitivity and Glucose Tolerance in APNtg-DHT Mice.
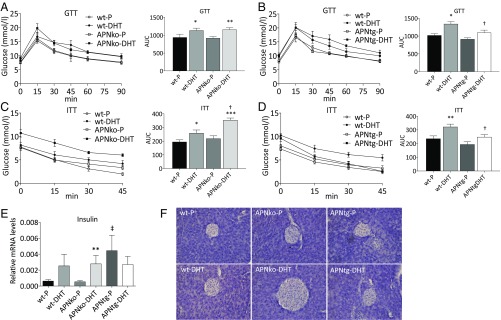
Glucose tolerance and insulin sensitivity were lower in WT-DHT–exposed mice (on both backgrounds) compared with placebo controls, as determined by area under the curve AUCglucose during glucose and insulin tolerance tests (Fig. 5 A–D). APNko-DHT animals had lower glucose tolerance compared with controls and were significantly more insulin resistant compared with both their placebo controls and littermate WT-DHT mice (Fig. 5 A and C). APNtg-DHT mice had similar insulin sensitivity and glucose tolerance levels as their controls and were more insulin sensitive and glucose tolerant than WT-DHT (Fig. 5 B and D). Fasting insulin was increased in APNko-DHT and WT-DHT mice compared with their placebo controls, while insulin levels were similar in DHT- and placebo-exposed APNtg mice (Table 1). Fasting glucose was increased in WT-DHT compared with WT-P animals (Table 1).
Fig. 5.
Oral glucose tolerance test (GTT; A and B), insulin tolerance test (ITT; C and D), gene expression of insulin in total pancreas (E) and histological pancreas sections showing islet size (F), in WT, APNko, and APNtg mice. *P < 0.05, **P < 0.01, ***P < 0.001 for the effect of DHT within genotypes; †P < 0.05 for the effect of DHT between genotypes; ‡P < 0.05 for the effect of genotype, n = 7–8/group in A–E. Values are mean ± SEM. A Mann–Whitney U test was performed to compare the effect of DHT within genotypes and between DHT-exposed groups.
Absence or Overexpression of Adiponectin Modulates Islet Size and Gene Expression in Pancreas of DHT-Treated Mice.
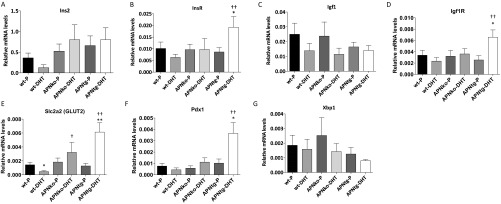
To assess beta cell functionality, we analyzed the expression of insulin and markers of beta cell viability and hyperplasia in the pancreas. The Ins1 expression was increased in DHT-treated APNko mice compared with their placebo controls. A similar, albeit not significant, trend was seen in WTs. In contrast, DHT exposure had no effect on pancreas Ins1 mRNA levels in APNtg mice (Fig. 5E). These data are in line with the fasting plasma insulin levels, which were elevated in DHT-treated WT and APNko mice, but not in APNtg-DHT mice (Table 1). Ins2 expression was unaltered (Fig. S4). Histological analysis also indicates that DHT-exposed APNko mice have larger islets than their placebo controls, whereas islets from the other groups appeared similar in size (Fig. 5F). The APNtg-P mice displayed, however, a higher insulin expression than WT-P (Fig. 5E), and mRNA levels of genes related with cell viability and hyperplasia, such as insulin receptor, Igf1 receptor, and Pdx1, were elevated in APNtg-DHT mice compared with their placebo controls (Fig. S4). DHT exposure provoked a decrease in the glucose transporter 2 (GLUT2) expression in WT, but the effect of DHT was prevented by overexpression of adiponectin (Fig. S4).
Fig. S4.
Gene expression of Ins2 (A), Insr (B), Igf1 (C), Igf1r (D), Slc2a2 (Glut2) (E), Pdx1 (F), and Xbp1 (G) in total pancreas from WT, APNko, and APNtg mice. *P < 0.05, **P < 0.01 for the effect of DHT within genotypes; †P < 0.05, ††P < 0.01 for the effect of DHT between genotypes. Values are mean ± SEM and the Mann–Whitney U test was performed to compare the effect of DHT within genotypes and between DHT-exposed groups.
Adiponectin Protects Against DHT-Induced Changes in Genes Involved in Metabolic Pathways in Gonadal Adipose Tissue.
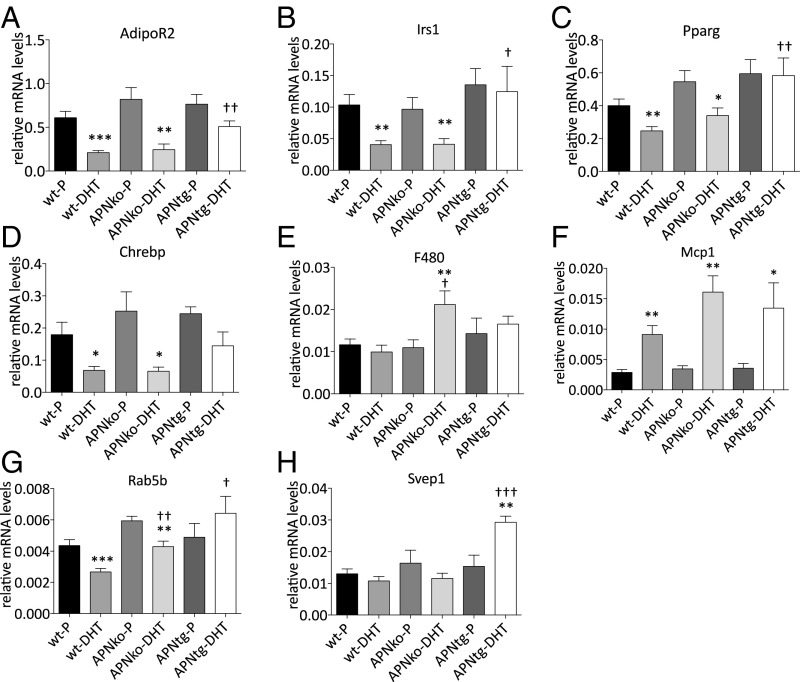
Gonadal adipose tissue showed decreased mRNA levels of genes involved in metabolic pathways such as AdipoR2, Irs1, Pparγ, and Chrebp in both WT-DHT and APNko-DHT, but this effect was not observed in APNtg-DHT mice (Fig. 6 A–D). Svep1, a type 2 diabetes susceptibility gene that is typically decreased in women with PCOS, was increased in APNtg-DHT mice and unaltered in all other groups (Fig. 6H). Gene expression of the inflammatory marker Mcp1 was increased with DHT exposure in all groups, while the pan-macrophage marker F4/80 was only increased in APNko-DHT mice (Fig. 6 E and F). A PCOS candidate gene, Rab5b, was decreased in DHT-exposed WT and APNko mice, but unaltered in APNtg-DHT mice (Fig. 6G).
Fig. 6.
Gene expression of AdipoR2 (A), Irs1 (B), Pparγ (C), Chrebp (D), F4/80 (E), Mcp1 (F), Rab5b (G), and Svep1 (H) in gonadal adipose tissue in WT, APNko, and APNtg mice. Data are expressed as mean 2−ΔCt ± SEM. *P < 0.05, **P < 0.01, ***P < 0.001 for the effect of DHT within genotypes; †P < 0.05, ††P < 0.01, †††P < 0.001 for the effect of DHT between genotypes, n = 7–8/group. A Mann–Whitney U test was performed to compare the effect of DHT within genotypes and between DHT-exposed groups.
DHT Exposure Alters BAT Gene Expression.
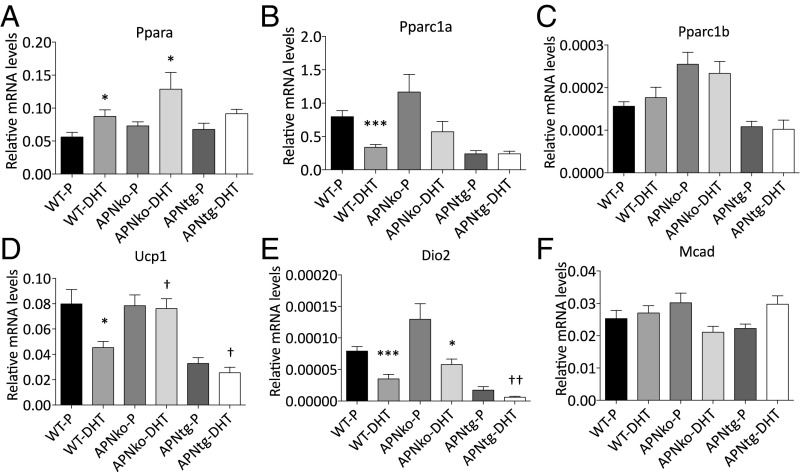
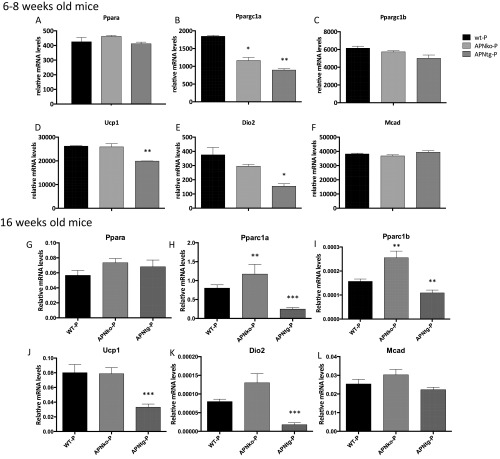
Brown adipose tissue (BAT) showed decreased levels of genes involved in mitochondrial function such as Pparc1α, Ucp1, and Dio2, and increased expression of Pparα in WT-DHT mice (Fig. 7 B, D, and E). Similar regulation was seen in APNko mice with increased Pparα and reduced Dio2 mRNA in APNko-DHT compared with their placebo controls (Fig. 7 A and E). There was no difference in Pparc1β or Mcad expression between groups and no significant effect of DHT exposure in APNtg mice compared with placebo (Fig. 7 A–F). However, APNtg-DHT mice had lower expressions of Ucp1 and Dio2 compared with DHT-exposed WT mice (Fig. 7 D and E). These differences are, however, most likely a result of developmental differences between genotypes, as both young and older untreated APNtg mice display decreased mRNA levels of Pparc1α, Ucp1, and Dio2 (Fig. S5).
Fig. 7.
Gene expression of Pparα (A), Pparc1α (B), Pparc1β (C), Ucp1 (D), Dio2 (E), and Mcad (F) in BAT in WT, APNko, and APNtg mice. Data are expressed as mean 2−ΔCt ± SEM. *P < 0.05, ***P < 0.001 for the effect of DHT within genotypes; †P < 0.05, ††P < 0.01 for the effect of DHT between genotypes, n = 7–8/group. A Mann–Whitney U test was performed to compare the effect of DHT within genotypes and between DHT-exposed groups.
Fig. S5.
Gene expression of Pparα (A, G), Pparc1α (B, H), Pparc1β (C, I), Ucp1 (D, J), Dio2 (E, K), and Mcad (F, L) in BAT in WT, APNko, and APNtg mice, n = 7–8/group. Data are expressed as mean 2−ΔCt ± SEM. *P < 0.05, ***P < 0.001 for the effect of DHT within genotypes; †P < 0.05, ††P < 0.01 for the effect of DHT between genotypes. The Mann–Whitney U test was performed to compare the effect of DHT within genotypes and between DHT-exposed groups.
Discussion
Our findings of this DHT-induced PCOS-like mouse model reveal an adipose tissue mechanism potentially underpinning dysfunctional whole-body glucose homeostasis, which could also be of relevance in women with PCOS. We find that mice overexpressing adiponectin that were exposed to continuous DHT from puberty to adult life are protected from the development of a PCOS-like metabolic phenotype, including insulin resistance, hypertrophic adipocytes, and dysfunctional gene expression profile in white and BAT, which is consistent with a metabolically healthy phenotype. We also show that adiponectin does not protect against the development of reproductive dysfunction to the same extent. Collectively, these experiments suggest increased adiponectin levels can prevent androgen-induced metabolic dysfunction. Although minor changes were observed related to reproductive function, ovarian morphology in mice overexpressing adiponectin and exposed to DHT do not differ from WT-DHT.
High levels of circulating androgens and insulin resistance are hallmarks of PCOS and increase the risk of women with PCOS developing type 2 diabetes (25). Reduced adiponectin levels may be one possible mechanism responsible for decreased insulin sensitivity in women with PCOS (8). As evidence for this hypothesis, insulin sensitivity and adiponectin levels were decreased in DHT-induced PCOS-like mice, and insulin sensitivity was further impaired in APNko-DHT mice. Adiponectin-overexpressing mice were, in contrast, protected against DHT-induced insulin resistance, further supporting the idea that adiponectin plays a crucial role in glucose homeostasis in PCOS.
Both obese and lean women with PCOS have aberrant adipose tissue function with enlarged adipocytes and altered adipose tissue gene expression (6–8, 26, 27). Androgens have been shown to impair adipogenesis in human adipose stem cells in vitro (28); however, it remains to be investigated whether models used in the present study have an altered recruitment of stem cells to adipogenesis. Research has shown that low circulating adiponectin (8, 29), together with increased waist circumference and enlarged adipocyte size (8, 30, 31), may explain insulin resistance in women with PCOS. Whether this is a consequence of hyperandrogenemia or hyperinsulinemia is unknown. Hyperandrogenism is associated with intra-abdominal fat deposition in lean women with PCOS (9). The association studies described in this section may lend some evidence for an interaction between PCOS-related hyperandrogenism and adiposity-dependent metabolic disturbances, but these findings do not give any mechanistic explanation. Moreover, adiponectin signaling seems to also be impaired, with decreased expression of adiponectin receptor 1 and 2 in women with PCOS (5, 32). Increased visceral adiposity and reduced adiponectin levels are also seen in WT and APNko mice with DHT-induced PCOS-like traits in this study, confirming the validity of this PCOS model in relation to metabolic alterations. In addition, both WT and APNko mice with DHT-induced PCOS-like characteristics displayed decreased expression of AdipoR2 in their adipose tissue. In contrast, APNtg mice had increased circulating adiponectin levels, even after DHT exposure, and their adipose tissue AdipoR2 mRNA levels did not change in response to DHT exposure.
PPARγ and IRS1 are type 2 diabetes susceptibility genes, and gene expression is decreased in adipose tissue in women with PCOS (5, 33). In line with these clinical data, Pparg and Irs1 were decreased in adipose tissue in mice with DHT-induced PCOS-like traits on WT and APNko backgrounds. Overexpression of adiponectin protected against this androgenic effect. SVEP1 is also a type 2 diabetes susceptibility gene and encodes a cell adhesion molecule expressed by cells related to skeletal tissues. SVEP1 is decreased in women with PCOS (33), but showed only a small trend toward a decrease (P = 0.15) in DHT-exposed mice. Adiponectin overexpression increases Svep1 in DHT-exposed mice, suggesting a compensatory mechanism by which these genes increase insulin sensitivity. The first genome-wide association studies on Han Chinese populations identified more than 10 susceptibility loci for PCOS, including RAB5B (34, 35). Although the functional role of this PCOS susceptible gene in adipose tissue is unknown, RAB5B expression is regulated by adiponectin signaling (36) and down-regulated in adipose tissue in women with PCOS (33). In support of these findings, we found that Rab5b mRNA levels were decreased in WT and APNko mice exposed to DHT and that increased adiponectin levels protected against this effect of DHT on adipose tissue. The target genes of a carbohydrate response element binding protein (ChREBP) are involved in glycolysis, lipogenesis, and gluconeogenesis. DHT exposure was associated with reduced adipose tissue Chrebp mRNA levels in WT and APNko mice. This effect of DHT was, however, not seen in APNtg mice, suggesting adiponectin protects against metabolic dysfunction.
In 3T3-L1 adipocytes, testosterone has been shown to decrease adiponectin secretion (37), and DHT exposure inhibits adipocyte differentiation (38). There is also evidence in rats that high androgen levels modulate proliferation and differentiation of preadipocytes differentially in specific fat depots (39), and studies in androgen receptor knockout mice suggest the androgens may serve as a negative regulator of adipocyte development (40). Adiponectin levels were decreased in DHT-exposed WT mice, and the s.c. adipocyte size was about twofold increased in all DHT-exposed animals. APNtg mice, however, had a trend toward smaller adipocytes at baseline, and this difference between genotypes reached significance after DHT exposure. DHT-exposed WT and APNko mice displayed increased fat mass compared with placebo; this difference depended largely on expansion of the visceral fat compartment. The adipocyte size in the s.c. inguinal fat depot of DHT-exposed mice was, however, significantly larger than placebo controls within all genotypes. Thus, our data suggest that early androgen exposure impairs adipogenesis in the s.c. compartment, leading to increased propensity toward visceral adiposity. Increased adiponectin levels protects against androgen-induced abdominal obesity, most likely by having a potent positive effect on adipogenesis in s.c. adipose tissue at birth.
Collectively, our findings indicate that adipose tissue dysfunction may contribute to the pathogenesis of PCOS. Specifically, our data suggest adiponectin can prevent these deleterious changes in adipose tissue morphology and function.
Androgen exposure is associated with decreased BAT mRNA levels of Pparc1α, Ucp1, and markers of mitochondrial activity such as Dio2 and Mcad in rodent models of PCOS (41). BAT transplantation can improve fertility and metabolic functions in a rat PCOS model, possibly by increasing circulating levels of adiponectin (41). However, in this study, WT and APNko mice displayed a similar BAT phenotype. In contrast, BAT mRNA levels of several mitochondrial markers were decreased in APNtg mice. Nevertheless, BAT in APNtg mice appears very active, with a fivefold greater triglyceride synthesis and turnover compared with littermate WT controls (42). Furthermore, APNtg mice have increased BAT mass already present at young ages (42). Thus, the gene expression pattern may not always reflect BAT functionality, and further research is needed to investigate the role of BAT in this PCOS model.
Adiponectin mediates its antidiabetic effects in part by increasing hepatic insulin sensitivity and by preventing hepatic lipid accumulation. APNko mice on a high-fat diet develop hepatic lipid accumulation and insulin resistance, an effect that was reversed by adiponectin supplementation (43). In line with these data, we found that APNko mice challenged with DHT have increased liver lipid content, while normal or elevated adiponectin levels protect against fatty liver in DHT-exposed mice. Liver triglyceride content did not correlate with serum triglyceride levels in APNko-DHT mice, while APNtg mice had lower circulating triglycerides. There may be multiple protective effects of adiponectin on hepatic steatosis and hypertriglyceridemia, including direct action on the liver, improved capacity for safe deposition of excess nutrients in the s.c. fat compartment, and an increased metabolic activity in BAT (16, 17, 42–44).
DHT-exposed WTs displayed decreased pancreatic expression of Glut2, which may be an early indicator of beta-cell dysfunction (45, 46). Such a decrease in GLUT2 was not seen in DHT-exposed APNko mice. In rodent pancreatic beta cells, GLUT2 is the major glucose transporter and is required for glucose-stimulated insulin secretion and for the physiological control of glucose-sensitive genes. GLUT2, which is expressed at a relatively low level, is not a primary factor for glucose-stimulated insulin secretion in human beta cells, since they mainly rely on GLUT1 and GLUT3 (47). The role of GLUT2 in humans is not clear, but GLUT2 in mice could be the physiological homolog to GLUT1 in humans. APNko-DHT mice also had higher pancreatic Ins1 mRNA levels, along with larger islets than their placebo controls. These data suggest APNko mice are, at least to some extent, able to compensate for their increased DHT-induced insulin resistance by beta cell hyperplasia, leading to glucose tolerance that is similar in DHT-exposed WTs. There was no difference in Ins2 mRNA levels between groups. There is some evidence the two rodent insulin genes are differently regulated, and increased Ins1 mRNA may reflect more severe hyperglycemia and increased cell–cell contact in APNko mice (48). Nevertheless, restoring circulating adiponectin levels improves insulin sensitivity and spares beta cells from working at a higher pace, thereby preventing unwanted hyperinsulinemia (49). In contrast, increased adiponectin levels in the APNtg-P mice were associated with increased Ins1 mRNA levels compared with WT-P mice. Furthermore, DHT exposure had no effect on either fasting insulin or pancreatic insulin 1 mRNA levels in APNtg mice. Instead, DHT led to an increased pancreatic expression of genes related to beta cell viability and proliferation (Glut2, InsR, Igf1R, Pdx1), suggesting increased adiponectin levels protect beta cells against the negative effect of DHT on beta cell function.
Cycle irregularity and the presence of PCO are hallmarks of the reproductive abnormalities seen in women with PCOS. Opposite to what is seen with women with PCOS, DHT-exposed rodents have unchanged (50, 51) or decreased ovarian weight (52). As previously reported, the DHT-induced model shows reproductive characteristics associated with PCOS in humans (e.g., anestrous and PCO morphology, including follicular cysts, increased theca cell layer, and decreased granulosa cell layer) (50–52). However, the neuroendocrine profile of PCOS, including elevated LH levels in combination with an increased LH/FSH ratio, is not reflected in this DHT mouse model. Elevated levels of adiponectin did not have a significant beneficial effect on estrous cyclicity or ovarian morphology. Another PCOS rodent model using letrozole exposure shows elevated LH levels and an altered mRNA expression in the pituitary. Both letrozole and DHT exposure lead to higher pituitary Gnrhr expression (53), which in turn may lead to enhanced GnRH signaling. Increased GnRH pulsatility is a neuroendocrine hallmark of PCOS and favors pituitary synthesis and secretion of LH, leading to elevated LH/FSH ratios (51, 54). Although pituitary Gnrhr Lhb, and Kiss1r mRNA was increased, the circulating LH and LH/FSH ratio was not altered in DHT-exposed WT mice (50, 51). Collectively, these data suggest GnRH signaling is not increased in this model and may even be decreased, based on the decreased testosterone and estrogen levels. Since DHT exposure, but not adiponectin levels, influenced pituitary gene expression, we decided to focus more on the role DHT plays in the ovary. In the ovary, DHT exposure may further enhance androgen production by increasing Cyp17a1 and Hsd3b expression and decreasing Cyp19a1, although we do not know which follicle cell type contributes to the difference in gene expression. Aromatase (CYP19A1) is responsible for converting androgens into estrogens, and decreased activity would lead to less of the androgens being converted to estrogens. CYP11A1, located in the mitochondria and regulating the first step in steroidogenesis, was likely down-regulated in DHT-exposed mice due to negative feedback. This is in line with data from DHT-induced rats (20) and supports the hypothesis that mitochondrial function is impaired in PCOS (55). As judged by the absence of DHT-induced changes in Cyp19a1 and Hsd3b gene expression in APNtg mice, our data suggest adiponectin has a small protective effect on ovarian function in DHT-induced mice with PCOS-like traits. However, one cannot rule out that the potent effects of DHT treatment on cyclicity and ovulation mask potential positive effects of adiponectin on reproduction. Experimental data supporting a direct effect of adiponectin on ovarian function is inconsistent, and research has mainly been performed in vitro (22). In line with our observation of high estradiol levels in APNtg mice, another study has found that high doses of adiponectin stimulates basal secretion of estradiol from porcine granulosa cells (56). In this same study, researchers observed decreases in testosterone secretion by adiponectin exposure. In both WT and in APNtg mice exposed to DHT, circulating testosterone was low, which most likely is evidence that the endogenous production of testosterone is dramatically decreased due to continuous exposure to DHT.
Despite the variety of rodent PCOS models currently available, there is no “golden standard” that mimics the complete range of abnormalities observed in women with PCOS. In this regard, it is important to select the most suitable model for the pathophysiological experiment to be performed or the treatment strategy to be tested. We selected the DHT-induced model based on its reproducible metabolic features (52), but one of the limitations of the model is the lack of a neuroendocrine phenotype. In this regard, the letrozole-induced PCOS-like model or prenatal androgenization of female mice with DHT may offer better models to study the role of adiponectin on reproductive dysfunction.
In summary, we conclude that elevated levels of adiponectin have a protective role on metabolic health associated with improved glucose homeostasis, reduced adipocyte size, decreased visceral fat, and maintained adipose tissue gene expression/function, and only a minor effect on reproductive function, in mice with DHT-induced PCOS-like characteristics.
Materials and Methods
Animals.
WT, APNtg, and APNko mice, on a C57BL/6J background (15, 57), were bred and maintained under standard housing conditions. They had ad libitum access to food and water under controlled conditions in a 12-h light/dark cycle environment at the animal facility, Sahlgrenska Academy, University of Gothenburg. All experiments were performed with permission of the Animal Ethics Committee of the University of Gothenburg, ethical number 116-14.
Study Design.
Genotyping was performed at days 14–17 on female WT, APNtg, and APNko mice. After weaning at 21–23 d of age, the mice were divided into 8 groups, and prepubertal female mice were implanted s.c. in the neck with a 90-d continuous slow-releasing pellet (Innovative Research of America) containing 2,5 mg DHT (27.5-µg daily dose) to induce a PCOS phenotype including obesity, insulin resistance, irregular cycles/anovulation, and PCO morphology. The controls received placebo pellets (Innovative Research of America), which were inserted during light anesthesia with isoflurane (2% in a 1:1 mixture of oxygen and air; Isoba vet, Schering-Plough ab). Body weight was recorded weekly. The estrus cycle stage was determined by microscopic analysis of the predominant cell types, obtained via the vaginal smears (53) taken daily when the animals were 6–7 and 13 wk of age. Glucose and insulin tolerance were evaluated at 14–15 wk of age. At week 16, body composition was analyzed, and fasted serum samples were taken in the diestrus phase in control mice, while samples were taken from the DHT-exposed mice, regardless of estrus phase, because these mice were acyclic and displayed a chronic pseudo diestrus (50). Then, fasted serum samples were taken and animals were decapitated and ovaries, uterus, pituitary adipose tissue, BAT, liver, and pancreas were dissected for histology and RNA expression analysis. One ovary was fixed in Histofix (Histolab) for 48 h, placed in 70% ethanol, dehydrated, and embedded in paraffin.
Genotyping.
Tissue samples were incubated at 55 °C overnight in DirectPCR lysis buffer (Viagen #102-T) and Proteinase K solution (Invitrogen Direct PCR #25530-049, 0.2 mg/mL) and centrifuged at 14,000 × g for 3 min. Two microliters of each sample was mixed with 18 µL mastermix containing Qiagen HotstarTaq MMx (#1010023, Qiagen) and primers. For WT, forward primers (5′-GGACCCCTGAACTTGCTTCAC-3′) and reverse primers (5′-TTCAATTCCCAGCACCCACAGTAA-3′) were used. For APNko animals, forward primers and reverse primers (5′-ATGAACTCCAGGACGAGGCA-3′ and 5′-GTAGCCGGATCAAGCGTATG-3′) were used. Forward primers (5′-GTTCCTCTTAATCCTGCCCAGTC-3′´) and reverse primers (5′-CCCGGAATGTTGCAGTAGAACTTG-3′) were used for genotyping APNtg mice. All primers were from Invitrogen. The PCR was performed with an enzyme activation step, 5 min at 95 °C, then 30 sec at 95 °C, 30 s at 58 °C, 1 min at 72 °C for 35 cycles, followed by 4 min at 72 °C when running the APNko/WT sample. A similar setup was used when running the APNtg samples; 5 min at 95 °C, then 30 sec at 95 °C, 45 sec at 64 °C, 1 min at 72 °C for 30 cycles, followed by 8 min at 72 °C. The PCR product was run on a 2% agarose gel in 1× TBE (45 mM Tis-borate and 1 mM EDTA) containing Gel Nucleic Acid stain (#14G0326, Invitrogen).
Insulin and Glucose Tolerance Tests.
Intraperitoneal insulin tolerance tests (ITT) were carried out in 14-wk-old mice, fasted for 3 h. Baseline blood glucose at 0 min was taken from the tail before the mice received 0.5 U/kg insulin (Actrapid, Novo Nordic) dissolved in saline. Blood glucose was measured at 15, 30, 45, and 60 min, using a glucose analyzer (OnetouchUltra2). A blood sample was taken at 0 and 15 min for insulin measurement. An oral glucose tolerance test was carried out 1 wk later in mice fasted for 6 h. Baseline glucose value was measured before the mice received 2 g/kg body weight of d-glucose (20%, Sigma-Aldrich) dissolved in saline by gavage. Blood glucose was measured at 15, 30, 60, and 90 min.
Dual-Energy X-Ray Absorptiometry.
Body composition was analyzed in 16-wk-old anesthetized mice (2% isoflurane; Isoba vet, Schering-Plough ab), using Lunar PIXImus Mouse Densitometer (Wipro GE Healthcare) (58). Bone mineral density, bone mineral content, lean body mass, and fat mass were recorded. Abdominal fat was calculated as the area extending from L1/L2 to L4/L5 vertebral space (59).
RNA Preparation and Real-Time PCR.
RNA isolation was performed using commercial kits (74804 for BAT and pituitary, 74704 for ovary; Qiagen and ReliaPrep RNA Cell Miniprep System for gonadal fat and pancreas; Promega). cDNA from pituitary, ovary, and BAT was prepared using a high-capacity RNA-to-DNA Kit (Life Technologies), and an iScript cDNA Synthesis Kit (Quanta Biosciences) was used for gonadal fat and pancreas, according to the manufacturer’s instructions. Real-time PCR products were detected using SYBR Green (Life Technologies), forward and reverse primer are found in Table S2. The norm finder algorithm was used to determine the most stable reference genes (60). Gapdh in ovary, Rplp0 in pituitary, Rpl19 in BAT, and β-actin in pancreas and fat had the lowest inter- and intragroup variability. RT-PCR was performed using Quant studio 7 flex (Applied Biosystems). Conditions were 95 °C for 20 s (1 cycle), 95 °C for 1 s, 60 °C for 20 s, 72 °C for 15 s (40 cycles), followed by a melting curve (0.5 °C/s) from 60 °C to 95 °C to confirm one PCR product. Gene expression levels were calculated using the 2-∆Ct method.
Table S2.
PCR sequences for RT-PCR primers
| Gene | Forward primer (5′–3′) | Reverse primer (5′–3′) |
| Rpl19 | GGAAGGGTACTGCCAATGCT | TCCATGAGGATGCGCTTGTT |
| Bactin | GACCCAGATCATGTTTGAGA | GAGCATAGCCCTCGTAGAT |
| Pparg | TTGAGTGCCGAGTCTGTGG | GGCATTGTGAGACATCCCCA |
| AdipoR1 | TCCTTCTACTGCTCCCCACA | TCAAGCCAAGTCCCAGGAAC |
| AdipoR2 | GCCCAGCTTAGAGACACCTG | GGCCTTCCCACACCTTACAA |
| InsR | TCATGGATGGAGGCTATCTGG | CCTTGAGCAGGTTGACGATTT |
| Igf1 | CTCTTCTACCTGGCGCTCTG | TCCGGAAGCAACACTCATCC |
| Igf1R | GGGCCAAACTCAACCGTCTA | AACCGGCAGAGCAATGATCA |
| Slc2a2 | GTCTCTGTGCTGCTTGTGGA | GGACCTGGCCCAATCTCAAA |
| Pdx1 | CCATGAACAGTGAGGAGCAGT | GTGATCCCAGCGAGCTTGTA |
| Xbp1 | GGTCTGCTGAGTCCGCAGCAGG | GAAAGGGAGGCTGGTAAGGAAC |
| Irs1 | TTAACCCCATCAGACGCCAC | ACAGGAGGTTTGGCATGAGG |
| Svep1 | AAAACCACTTCAATGCCGCC | AGGACATTTCCGCAGTGGAG |
| Chrebp | GCATCCTCATCCGACCTTTA | GATGCTTGTGGAAGTGCTGA |
| F480 | CTTTGGCTATGGGCTTCCAGTC | GCAAGGAGGACAGAGTTTATCGTG |
| Mcp1 | ACTGAAGCCAGCTCTCTCTTCC | TTCCTTCTTGGGGTCAGCACAG |
| Rab5b | GAGCCCCAGGACTGTTGAG | CACACGGATTGGGTGAGGAA |
| Cyp1b1 | AGCCAGGACACCCTTTCC | CCTGAACATCCGGGTATCTG |
| Ppara | GCTTCTTTCGGCGAACTAT | TTTCCTGCGAGTATGACCC |
| Pparc1a | ATGTGTCGCCTTCTTGCTCT | ATCTACTGCCTGGGGACCTT |
| Pparc1b | GACTGGATGAAGGCGACACA | TCTGCAGCAGTGAAAGCTCA |
| Ucp1 | TGCGCCTTCTTTTCTGCGAC | CCGGGACTTCATCAGCTCTTTC |
| Dio2 | ACGCCTACAAACAGGTTAAATTGG | CCGTCTTCTCTGAGGCACA |
| Mcad | GGCATATGGGTGTACAGGGG | ACGCAGTAGGCACACATCAT |
| Cyp11a1 | ACATGGCCAAGATGGTACAGTTG | ACGAAGCACCAGGTCATTCAC |
| Cyp17a1 | GAGTTTGCCATCCCGAAGGA | CCAGCTCCGAAGGGCAAATA |
| Cyp19a1 | TTTCGCTGAGAGACGTGGAG | AGGATTGCTGCTTCGACCTC |
| Hsd3b1 | ACATGGCTCTGGGAGTTATAAGGT | TTAGTGACTGGCAAGGCTTCTG |
| Lhb | CTGTCAACGCAACTCTGG | ACAGGAGGCAAAGCAGC |
| Fshb | GCCGTTTCTGCATAAGC | CAATCTTACGGTCTCGTATACC |
| Gnrhr | GCCCCTTGCTGTACAAAGC | CCGTCTGCTAGGTAGATCATCC |
| Kiss1r | GCTCTATCTGCTGCCGCTGC | CTTGAAGCACCAGGAACAGCTGG |
| Pgr | CATACCTTAACTACCTGAGG | GATTAAGCAGATCTTCTGAGG |
| Rplp0 | TGCACCACCAACTGCTTAG | GGATGCAGGGATGATGTTC |
| Gapdh | TGCACCACCAACTGCTTAG | GGATGCAGGGATGATGTTC |
Histological Methods.
Ovarian morphology.
The ovaries were sectioned at 3–3.5 µm, 40 µm between every section was discarded, and six sections from each ovary were collected, mounted on a glass slide, stained with H&E, and photographed (×20) and analyzed by conventional light microscopy.
Definition of corpus luteum, atretic/cystic follicles, and antral follicles was done according to the paper by Kauffman et al. (53).
Pancreas analysis.
Pancreas samples were fixed in 10% PBS-buffered formalin (VWR Chemicals), and 7-μm sections were stained with H&E. Images of islets were taken using a light microscope (Olympus BX60).
Oil Red O staining.
Frozen 10-μm liver samples were sectioned at −20 °C, mounted on slides, and air-dried for at least 30 min. The slides were rinsed in 60% isopropanol for 2 min and then in Oil Red O solution (0.3% in 60% isopropanol; Sigma Aldrich) for 20 min. The slides were rinsed in distilled water for 5 min and counterstained with Mayer’s hematoxylin (#01820; Histolab, Sweden) before mounting with medium containing glycerol (50%) and gelatin (7%). The samples were classified into positive (+), possible early (+/−), and negative (−) fatty liver (61).
Adipocyte size measurement.
Adipose tissue was dissected, fixed in 10% PBS-buffered formalin, and embedded in paraffin. The tissue was sectioned (5 μm) and stained with hematoxylin Gill III solution and eosin Y solution. Two representative micrographs were taken per sample at a 20× magnification with a light microscope (Olympus BX60 & PlanApo, 20×/0.7; Olympus). The adipocyte size was quantified with ImageJ. In brief, micrographs were transformed to a 16-bit grayscale, and the threshold was set to cover the adipocyte (=lipid droplet) areas and to exclude anomalies such as blood vessels. Thereafter, the micrographs were transformed to a black-and-white binary image in which broken adipocyte plasma membranes were mended by applying the watershed function. The adipocytes were further defined by circularity (0.5–1.0), on which the cell area was determined.
Adipose tissue development.
Caudal segments of day 0 pups were collected over the course of postnatal hours and fixed, embedded in paraffin, and cut before regressive H&E staining was performed. Staining for lipids was conducted on cryosections (SI Materials and Methods).
Serum Analyses.
Serum adiponectin and insulin levels were analyzed by commercial ELISA kits [Millipore (EZMADP-60K), and Mercodia (10-1249-01, 10-1247-01), respectively], and triglyceride levels were analyzed using the Infinity, Triglycerides-Liquid Stable Reagent kit (Thermo Scientific). Plasma concentrations of progesterone, testosterone, 17β-estradiol, and DHT were determined with a validated GC-MS system at Endoceutics (62). Serum LH and FSH were assayed with a mouse pituitary magnetic bead panel (Milliplex Panel; Millipore).
Statistical Analyses.
Statistical analyses were performed with SPSS (version 19.0). Chi-square tests were used to analyze estrus cyclicity and liver steatosis. A Kruskal–Wallis test was used for all other parameters, and if significant, a Mann–Whitney U test was performed to compare the effect of DHT within genotypes and between DHT-exposed groups. A two-way ANOVA between-groups analysis of variance was conducted to explore the effect of genotype and DHT exposure, followed by post hoc comparisons using the Tukey HSD test. Repeated measurement ANOVA was used to calculate differences in body weight. P < 0.05 was considered significant.
SI Materials and Methods
Adipose tissue development was determined in postnatal pups. Caudal segments of day 0 pups were collected over the course of postnatal hours and fixed in 10% neutral-buffered formalin (paraffin) or methanol-free 4% paraformaldehyde (cryo). Fixed specimens for routine H&E were transferred to 50% ethanol and staged for paraffin processing, while fixed specimens for lipid staining were cryoprotected in sequential equilibrations of 10% and 18% sucrose before cryoembedding in OCT (Sakura Tissue-Tek). Paraffin embeds were made and sections were prepared of matching hindlimb anatomy at 5-μm thickness. Regressive H&E was performed on paraffin sections using a Sakura automated stainer (DRS601; Sakura Fine-Tek) and reagents from Leica-Surgipath (Selectech Hematoxylin 560 and Selectech Eosin-Y 515) according to standard methods (60). Previously prepared cryoembedments stored at −80 °C were brought to −22 °C for cutting, and cryosections were prepared of matching hindlimb anatomy at 8-μm thickness. Resulting cryosections were air-dried and returned to −80 °C until the time of staining. Staining for lipids was conducted on cryosections, using Lillie’s method for Oil Red O with modifications by Churukian (60, 61). In brief, tissue sections were incubated in saturated 0.18% Oil Red O (Sigma-Aldrich) prepared in 0.4% dextrin/60% isopropyl alcohol, before counterstaining with hematoxylin and coverslipping with aqueous mounting medium (Fluoromount G; Electron Microscopy Sciences). Light micrographs of H&E and Oil Red O were prepared on a Leica DM200 compound microscope, equipped with an Optonics Microfire CCD camera. Images were captured using PictureFrame 2.0 acquisition software.
Acknowledgments
We thank Philipp E. Scherer at the University of Texas Southwestern Medical Center, Dallas, Texas, for the kind supply of APNtg and APNko mice. The DHT pellets were a gift from Stephen Franks at the Imperial College London, Hammersmith Hospital, London, United Kingdom. I.W.A. is supported by the Swedish Research Council (2012-1601 and 2013-7107), Novo Nordisk Excellence Project Award, Åke Wiberg Foundation (18431223, M14-0105, and M14-0014), Diabetesfonden (DIA2014-074), Diabetes Wellness Research Foundation (8349/2014SW), the Royal Society of Arts and Sciences in Gothenburg, and the Magnus Bergvall Foundation (2014-00169). A.B. is supported by Stiftelsen Handlaren Hjalmar Svenssons Foundation (HJSV2015050, HJSV2014026), Magnus Bergvall Foundation (2015-01087), Royal Society of Arts and Sciences in Gothenburg, and Adlerbert Research Foundation (2014/112). E.S.-V. is supported by the Swedish Research Council (2014-2775), Jane and Dan Ohlsson Foundation, Adlerbert Research Foundation (2015/78), Stiftelsen Handlaren Hjalmar Svenssons Foundation (HJSV2014006, HJSV2015003), Novo Nordisk Foundation (NNF15OC0015902, NNF16OC0020744), and SRP Diabetes Karolinska Institutet. The funders had no role in the study design, data collection, and analysis, or the decision to publish or prepare the manuscript.
Footnotes
The authors declare no conflict of interest.
This article is a PNAS Direct Submission.
This article contains supporting information online at www.pnas.org/lookup/suppl/doi:10.1073/pnas.1708854114/-/DCSupplemental.
References
- 1.Teede H, Deeks A, Moran L. Polycystic ovary syndrome: A complex condition with psychological, reproductive and metabolic manifestations that impacts on health across the lifespan. BMC Med. 2010;8:41. doi: 10.1186/1741-7015-8-41. [DOI] [PMC free article] [PubMed] [Google Scholar]
- 2.Corbould A. Insulin resistance in skeletal muscle and adipose tissue in polycystic ovary syndrome: Are the molecular mechanisms distinct from type 2 diabetes? Panminerva Med. 2008;50:279–294. [PubMed] [Google Scholar]
- 3.Legro RS, Kunselman AR, Dodson WC, Dunaif A. Prevalence and predictors of risk for type 2 diabetes mellitus and impaired glucose tolerance in polycystic ovary syndrome: A prospective, controlled study in 254 affected women. J Clin Endocrinol Metab. 1999;84:165–169. doi: 10.1210/jcem.84.1.5393. [DOI] [PubMed] [Google Scholar]
- 4.Ehrmann DA, Barnes RB, Rosenfield RL, Cavaghan MK, Imperial J. Prevalence of impaired glucose tolerance and diabetes in women with polycystic ovary syndrome. Diabetes Care. 1999;22:141–146. doi: 10.2337/diacare.22.1.141. [DOI] [PubMed] [Google Scholar]
- 5.Mannerås-Holm L, Benrick A, Stener-Victorin E. Gene expression in subcutaneous adipose tissue differs in women with polycystic ovary syndrome and controls matched pair-wise for age, body weight, and body mass index. Adipocyte. 2014;3:190–196. doi: 10.4161/adip.28731. [DOI] [PMC free article] [PubMed] [Google Scholar]
- 6.Cortón M, et al. Differential gene expression profile in omental adipose tissue in women with polycystic ovary syndrome. J Clin Endocrinol Metab. 2007;92:328–337. doi: 10.1210/jc.2006-1665. [DOI] [PubMed] [Google Scholar]
- 7.Chazenbalk G, et al. Abnormal expression of genes involved in inflammation, lipid metabolism, and Wnt signaling in the adipose tissue of polycystic ovary syndrome. J Clin Endocrinol Metab. 2012;97:E765–E770. doi: 10.1210/jc.2011-2377. [DOI] [PMC free article] [PubMed] [Google Scholar]
- 8.Mannerås-Holm L, et al. Adipose tissue has aberrant morphology and function in PCOS: Enlarged adipocytes and low serum adiponectin, but not circulating sex steroids, are strongly associated with insulin resistance. J Clin Endocrinol Metab. 2011;96:E304–E311. doi: 10.1210/jc.2010-1290. [DOI] [PubMed] [Google Scholar]
- 9.Dumesic DA, et al. Hyperandrogenism accompanies increased intra-abdominal fat storage in normal weight polycystic ovary syndrome women. J Clin Endocrinol Metab. 2016;101:4178–4188. doi: 10.1210/jc.2016-2586. [DOI] [PMC free article] [PubMed] [Google Scholar]
- 10.Kadowaki T, et al. Adiponectin and adiponectin receptors in insulin resistance, diabetes, and the metabolic syndrome. J Clin Invest. 2006;116:1784–1792. doi: 10.1172/JCI29126. [DOI] [PMC free article] [PubMed] [Google Scholar]
- 11.Ye R, Scherer PE. Adiponectin, driver or passenger on the road to insulin sensitivity? Mol Metab. 2013;2:133–141. doi: 10.1016/j.molmet.2013.04.001. [DOI] [PMC free article] [PubMed] [Google Scholar]
- 12.Brown JE, et al. Regulation of beta-cell viability and gene expression by distinct agonist fragments of adiponectin. Peptides. 2010;31:944–949. doi: 10.1016/j.peptides.2010.02.004. [DOI] [PubMed] [Google Scholar]
- 13.Rao JR, Keating DJ, Chen C, Parkington HC. Adiponectin increases insulin content and cell proliferation in MIN6 cells via PPARγ-dependent and PPARγ-independent mechanisms. Diabetes Obes Metab. 2012;14:983–989. doi: 10.1111/j.1463-1326.2012.01626.x. [DOI] [PubMed] [Google Scholar]
- 14.Holland WL, et al. Receptor-mediated activation of ceramidase activity initiates the pleiotropic actions of adiponectin. Nat Med. 2011;17:55–63. doi: 10.1038/nm.2277. [DOI] [PMC free article] [PubMed] [Google Scholar]
- 15.Nawrocki AR, et al. Mice lacking adiponectin show decreased hepatic insulin sensitivity and reduced responsiveness to peroxisome proliferator-activated receptor gamma agonists. J Biol Chem. 2006;281:2654–2660. doi: 10.1074/jbc.M505311200. [DOI] [PubMed] [Google Scholar]
- 16.Asterholm IW, Scherer PE. Enhanced metabolic flexibility associated with elevated adiponectin levels. Am J Pathol. 2010;176:1364–1376. doi: 10.2353/ajpath.2010.090647. [DOI] [PMC free article] [PubMed] [Google Scholar]
- 17.Kim JY, et al. Obesity-associated improvements in metabolic profile through expansion of adipose tissue. J Clin Invest. 2007;117:2621–2637. doi: 10.1172/JCI31021. [DOI] [PMC free article] [PubMed] [Google Scholar]
- 18.Palin MF, Bordignon VV, Murphy BD. Adiponectin and the control of female reproductive functions. Vitam Horm. 2012;90:239–287. doi: 10.1016/B978-0-12-398313-8.00010-5. [DOI] [PubMed] [Google Scholar]
- 19.Maliqueo M, et al. Circulating gonadotropins and ovarian adiponectin system are modulated by acupuncture independently of sex steroid or β-adrenergic action in a female hyperandrogenic rat model of polycystic ovary syndrome. Mol Cell Endocrinol. 2015;412:159–169. doi: 10.1016/j.mce.2015.04.026. [DOI] [PubMed] [Google Scholar]
- 20.Benrick A, et al. Resveratrol is not as effective as physical exercise for improving reproductive and metabolic functions in rats with dihydrotestosterone-induced polycystic ovary syndrome. Evid Based Complement Alternat Med. 2013;2013:964070. doi: 10.1155/2013/964070. [DOI] [PMC free article] [PubMed] [Google Scholar]
- 21.Comim FV, Hardy K, Franks S. Adiponectin and its receptors in the ovary: Further evidence for a link between obesity and hyperandrogenism in polycystic ovary syndrome. PLoS One. 2013;8:e80416. doi: 10.1371/journal.pone.0080416. [DOI] [PMC free article] [PubMed] [Google Scholar]
- 22.Kawwass JF, Summer R, Kallen CB. Direct effects of leptin and adiponectin on peripheral reproductive tissues: A critical review. Mol Hum Reprod. 2015;21:617–632. doi: 10.1093/molehr/gav025. [DOI] [PMC free article] [PubMed] [Google Scholar]
- 23.van Houten EL, et al. Reproductive and metabolic phenotype of a mouse model of PCOS. Endocrinology. 2012;153:2861–2869. doi: 10.1210/en.2011-1754. [DOI] [PubMed] [Google Scholar]
- 24.Mannerås L, et al. A new rat model exhibiting both ovarian and metabolic characteristics of polycystic ovary syndrome. Endocrinology. 2007;148:3781–3791. doi: 10.1210/en.2007-0168. [DOI] [PubMed] [Google Scholar]
- 25.Diamanti-Kandarakis E, Dunaif A. Insulin resistance and the polycystic ovary syndrome revisited: An update on mechanisms and implications. Endocr Rev. 2012;33:981–1030. doi: 10.1210/er.2011-1034. [DOI] [PMC free article] [PubMed] [Google Scholar]
- 26.Carmina E, et al. Subcutaneous and omental fat expression of adiponectin and leptin in women with polycystic ovary syndrome. Fertil Steril. 2008;89:642–648. doi: 10.1016/j.fertnstert.2007.03.085. [DOI] [PubMed] [Google Scholar]
- 27.Ek I, Arner P, Bergqvist A, Carlström K, Wahrenberg H. Impaired adipocyte lipolysis in nonobese women with the polycystic ovary syndrome: A possible link to insulin resistance? J Clin Endocrinol Metab. 1997;82:1147–1153. doi: 10.1210/jcem.82.4.3899. [DOI] [PubMed] [Google Scholar]
- 28.Chazenbalk G, et al. Androgens inhibit adipogenesis during human adipose stem cell commitment to preadipocyte formation. Steroids. 2013;78:920–926. doi: 10.1016/j.steroids.2013.05.001. [DOI] [PMC free article] [PubMed] [Google Scholar]
- 29.Toulis KA, et al. Adiponectin levels in women with polycystic ovary syndrome: A systematic review and a meta-analysis. Hum Reprod Update. 2009;15:297–307. doi: 10.1093/humupd/dmp006. [DOI] [PubMed] [Google Scholar]
- 30.Rebuffé-Scrive M, Andersson B, Olbe L, Björntorp P. Metabolism of adipose tissue in intraabdominal depots of nonobese men and women. Metabolism. 1989;38:453–458. doi: 10.1016/0026-0495(89)90198-4. [DOI] [PubMed] [Google Scholar]
- 31.Rebuffé-Scrive M, Cullberg G, Lundberg PA, Lindstedt G, Björntorp P. Anthropometric variables and metabolism in polycystic ovarian disease. Horm Metab Res. 1989;21:391–397. doi: 10.1055/s-2007-1009245. [DOI] [PubMed] [Google Scholar]
- 32.Seow KM, et al. Omental fat expression of adiponectin and adiponectin receptors in non-obese women with PCOS: A preliminary study. Reprod Biomed Online. 2009;19:577–582. doi: 10.1016/j.rbmo.2009.05.003. [DOI] [PubMed] [Google Scholar]
- 33.Kokosar M, et al. Epigenetic and transcriptional alterations in human adipose tissue of polycystic ovary syndrome. Sci Rep. 2016;6:22883. doi: 10.1038/srep22883. [DOI] [PMC free article] [PubMed] [Google Scholar]
- 34.Shi Y, et al. Genome-wide association study identifies eight new risk loci for polycystic ovary syndrome. Nat Genet. 2012;44:1020–1025. doi: 10.1038/ng.2384. [DOI] [PubMed] [Google Scholar]
- 35.Chen ZJ, et al. Genome-wide association study identifies susceptibility loci for polycystic ovary syndrome on chromosome 2p16.3, 2p21 and 9q33.3. Nat Genet. 2011;43:55–59. doi: 10.1038/ng.732. [DOI] [PubMed] [Google Scholar]
- 36.Deepa SS, Dong LQ. APPL1: Role in adiponectin signaling and beyond. Am J Physiol Endocrinol Metab. 2009;296:E22–E36. doi: 10.1152/ajpendo.90731.2008. [DOI] [PMC free article] [PubMed] [Google Scholar]
- 37.Homma H, et al. Estrogen suppresses transcription of lipoprotein lipase gene. Existence of a unique estrogen response element on the lipoprotein lipase promoter. J Biol Chem. 2000;275:11404–11411. doi: 10.1074/jbc.275.15.11404. [DOI] [PubMed] [Google Scholar]
- 38.Singh R, et al. Testosterone inhibits adipogenic differentiation in 3T3-L1 cells: Nuclear translocation of androgen receptor complex with beta-catenin and T-cell factor 4 may bypass canonical Wnt signaling to down-regulate adipogenic transcription factors. Endocrinology. 2006;147:141–154. doi: 10.1210/en.2004-1649. [DOI] [PMC free article] [PubMed] [Google Scholar]
- 39.Garcia E, Lacasa M, Agli B, Giudicelli Y, Lacasa D. Modulation of rat preadipocyte adipose conversion by androgenic status: Involvement of C/EBPs transcription factors. J Endocrinol. 1999;161:89–97. doi: 10.1677/joe.0.1610089. [DOI] [PubMed] [Google Scholar]
- 40.Matsumoto T, Takeyama K, Sato T, Kato S. Androgen receptor functions from reverse genetic models. J Steroid Biochem Mol Biol. 2003;85:95–99. doi: 10.1016/s0960-0760(03)00231-0. [DOI] [PubMed] [Google Scholar]
- 41.Yuan X, et al. Brown adipose tissue transplantation ameliorates polycystic ovary syndrome. Proc Natl Acad Sci USA. 2016;113:2708–2713. doi: 10.1073/pnas.1523236113. [DOI] [PMC free article] [PubMed] [Google Scholar]
- 42.Shetty S, et al. Enhanced fatty acid flux triggered by adiponectin overexpression. Endocrinology. 2012;153:113–122. doi: 10.1210/en.2011-1339. [DOI] [PMC free article] [PubMed] [Google Scholar]
- 43.Liu Y, et al. Metabolomic profiling in liver of adiponectin-knockout mice uncovers lysophospholipid metabolism as an important target of adiponectin action. Biochem J. 2015;469:71–82. doi: 10.1042/BJ20141455. [DOI] [PMC free article] [PubMed] [Google Scholar]
- 44.Combs TP, Marliss EB. Adiponectin signaling in the liver. Rev Endocr Metab Disord. 2014;15:137–147. doi: 10.1007/s11154-013-9280-6. [DOI] [PMC free article] [PubMed] [Google Scholar]
- 45.Thorens B, Wu YJ, Leahy JL, Weir GC. The loss of GLUT2 expression by glucose-unresponsive beta cells of db/db mice is reversible and is induced by the diabetic environment. J Clin Invest. 1992;90:77–85. doi: 10.1172/JCI115858. [DOI] [PMC free article] [PubMed] [Google Scholar]
- 46.Jörns A, Tiedge M, Sickel E, Lenzen S. Loss of GLUT2 glucose transporter expression in pancreatic beta cells from diabetic Chinese hamsters. Virchows Arch. 1996;428:177–185. doi: 10.1007/BF00200660. [DOI] [PubMed] [Google Scholar]
- 47.Thorens B. GLUT2, glucose sensing and glucose homeostasis. Diabetologia. 2015;58:221–232. doi: 10.1007/s00125-014-3451-1. [DOI] [PubMed] [Google Scholar]
- 48.Roderigo-Milne H, Hauge-Evans AC, Persaud SJ, Jones PM. Differential expression of insulin genes 1 and 2 in MIN6 cells and pseudoislets. Biochem Biophys Res Commun. 2002;296:589–595. doi: 10.1016/s0006-291x(02)00913-0. [DOI] [PubMed] [Google Scholar]
- 49.Mynarcik DC, et al. Adiponectin and leptin levels in HIV-infected subjects with insulin resistance and body fat redistribution. J Acquir Immune Defic Syndr. 2002;31:514–520. doi: 10.1097/00126334-200212150-00009. [DOI] [PubMed] [Google Scholar]
- 50.van Houten AF, et al. Reproductive and metabolic phenotype of a mouse model of PCOS. Endocrinology. 2012;153:2861–2869. doi: 10.1210/en.2011-1754. [DOI] [PubMed] [Google Scholar]
- 51.Caldwell AS, et al. Characterization of reproductive, metabolic, and endocrine features of polycystic ovary syndrome in female hyperandrogenic mouse models. Endocrinology. 2014;155:3146–3159. doi: 10.1210/en.2014-1196. [DOI] [PubMed] [Google Scholar]
- 52.Maliqueo M, Benrick A, Stener-Victorin E. Rodent models of polycystic ovary syndrome: Phenotypic presentation, pathophysiology, and the effects of different interventions. Semin Reprod Med. 2014;32:183–193. doi: 10.1055/s-0034-1371090. [DOI] [PubMed] [Google Scholar]
- 53.Kauffman AS, et al. A novel letrozole model recapitulates both the reproductive and metabolic phenotypes of polycystic ovary syndrome in female mice. Biol Reprod. 2015;93:69. doi: 10.1095/biolreprod.115.131631. [DOI] [PMC free article] [PubMed] [Google Scholar]
- 54.Maliqueo M, et al. Continuous administration of a P450 aromatase inhibitor induces polycystic ovary syndrome with a metabolic and endocrine phenotype in female rats at adult age. Endocrinology. 2013;154:434–445. doi: 10.1210/en.2012-1693. [DOI] [PubMed] [Google Scholar]
- 55.Skov V, et al. Reduced expression of nuclear-encoded genes involved in mitochondrial oxidative metabolism in skeletal muscle of insulin-resistant women with polycystic ovary syndrome. Diabetes. 2007;56:2349–2355. doi: 10.2337/db07-0275. [DOI] [PubMed] [Google Scholar]
- 56.Maleszka A, et al. Adiponectin expression in the porcine ovary during the oestrous cycle and its effect on ovarian steroidogenesis. Int J Endocrinol. 2014;2014:957076. doi: 10.1155/2014/957076. [DOI] [PMC free article] [PubMed] [Google Scholar]
- 57.Combs TP, et al. A transgenic mouse with a deletion in the collagenous domain of adiponectin displays elevated circulating adiponectin and improved insulin sensitivity. Endocrinology. 2004;145:367–383. doi: 10.1210/en.2003-1068. [DOI] [PubMed] [Google Scholar]
- 58.Nagy TR, Clair AL. Precision and accuracy of dual-energy X-ray absorptiometry for determining in vivo body composition of mice. Obes Res. 2000;8:392–398. doi: 10.1038/oby.2000.47. [DOI] [PubMed] [Google Scholar]
- 59.Chen W, Wilson JL, Khaksari M, Cowley MA, Enriori PJ. Abdominal fat analyzed by DEXA scan reflects visceral body fat and improves the phenotype description and the assessment of metabolic risk in mice. Am J Physiol Endocrinol Metab. 2012;303:E635–E643. doi: 10.1152/ajpendo.00078.2012. [DOI] [PMC free article] [PubMed] [Google Scholar]
- 60.Andersen CL, Jensen JL, Ørntoft TF. Normalization of real-time quantitative reverse transcription-PCR data: A model-based variance estimation approach to identify genes suited for normalization, applied to bladder and colon cancer data sets. Cancer Res. 2004;64:5245–5250. doi: 10.1158/0008-5472.CAN-04-0496. [DOI] [PubMed] [Google Scholar]
- 61.Sun M, et al. Maternal androgen excess reduces placental and fetal weights, increases placental steroidogenesis, and leads to long-term health effects in their female offspring. Am J Physiol Endocrinol Metab. 2012;303:E1373–E1385. doi: 10.1152/ajpendo.00421.2012. [DOI] [PubMed] [Google Scholar]
- 62.Stener-Victorin E, et al. Are there any sensitive and specific sex steroid markers for polycystic ovary syndrome? J Clin Endocrinol Metab. 2010;95:810–819. doi: 10.1210/jc.2009-1908. [DOI] [PubMed] [Google Scholar]


