Significance
The interaction of amyloids with chaperones, a large group of proteins responsible for proteostasis, is thought to play a significant role in the etiology of amyloidosis. Here, we study the interaction of the model chaperonin GroEL with a model amyloid protein, the prion domain of Het-s, by using NMR and EPR spectroscopies and electron and atomic force microscopies. We show that GroEL accelerates protofibril formation, eventually leading to the formation of fibrils densely decorated by GroEL. This type of chaperone–amyloid interaction may serve to reduce the toxicity of amyloidogenic oligomers and target the fully formed fibrils for rapid elimination by facilitating in vivo clearance.
Keywords: amyloid–chaperone interactions, NMR, EPR, electron microscopy, atomic force microscopy
Abstract
We have studied the interaction of the prototypical chaperonin GroEL with the prion domain of the Het-s protein using solution and solid-state NMR, electron and atomic force microscopies, and EPR. While GroEL accelerates Het-s protofibril formation by several orders of magnitude, the rate of appearance of fibrils is reduced. GroEL remains bound to Het-s throughout the aggregation process and densely decorates the fibrils at a regular spacing of ∼200 Å. GroEL binds to the Het-s fibrils via its apical domain located at the top of the large open ring. Thus, apo GroEL and bullet-shaped GroEL/GroES complexes in which only a single ring is capped by GroES interact with the Het-s fibrils; no evidence is seen for any interaction with football-shaped GroEL/GroES complexes in which both rings are capped by GroES. EPR spectroscopy shows that rotational motion of a nitroxide spin label, placed at the N-terminal end of the first β-strand of Het-s fibrils, is significantly reduced in both Het-s/GroEL aggregates and Het-s fibrils, but virtually completely eliminated in Het-s/GroEL fibrils, suggesting that in the latter, GroEL may come into close proximity to the nitroxide label. Solid-state NMR measurements indicate that GroEL binds to the mobile regions of the Het-s fibril comprising the N-terminal tail and a loop connecting β-strands 4 and 5, consistent with interactions involving GroEL binding consensus sequences located therein.
The interaction of amyloids with chaperones, a group of proteins responsible for maintaining protein homeostasis (1–3), has attracted considerable attention with regard to the etiology of amyloidoses and accumulation of amyloid plaques (4). Diseases associated with amyloidosis include type II diabetes and a number of neurodegenerative processes such as Alzheimer’s disease, Huntington disease, and spongiform encephalopathies (5).
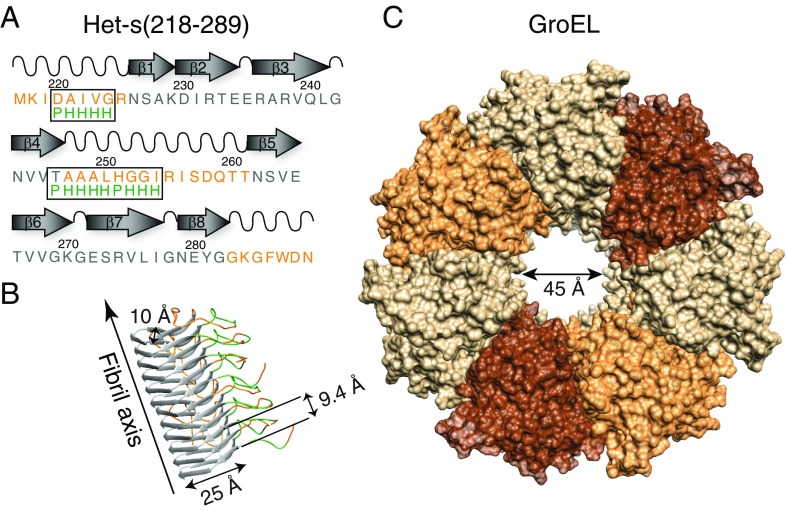
Amyloids are unbranched, highly ordered protein aggregates that contain a cross β-structure arranged perpendicular to the fibril axis (6). Amyloid fibrils, which can be readily identified by electron microscopy, are formed by an ordered array of many copies of the given amyloid protein. In addition to amyloids that lead to pathology, there are amyloids where the fibrils contribute a distinct biological function (7). An example of the latter is provided by the Het-s prion protein from the filamentous fungus Podospora anserina (Fig. 1A) where Het-s fibril formation serves to prevent exchange of cytoplasmic material between genetically dissimilar species (5, 7). Since the structure of the Het-s fibril is well established (Fig. 1B) and not polymorphic at neutral pH (8, 9), and the Het-s monomer is stable for several days at 4 °C, we have used Het-s to study the interaction of a model amyloidogenic protein with a prototypical chaperone, GroEL, at the molecular and atomic levels.
Fig. 1.
Het-s(218–289) and GroEL. (A) Primary and secondary structure of Het-s(218–289) fibrils. Sequences within the flexible tails and loop are colored in orange, and the sites of GroEL-binding consensus sequences (a polar residue, P, followed by four hydrophobic residues, H) are indicated in green. (Note the N-terminal methionine is not part of the natural Het-s sequence.) (B) Structure of the Het-s(218–289) fibril determined by solid-state NMR (PDB ID code 2KJ3; ref. 9). (C) Structure of apo GroEL (PDB ID code 1XCK; ref. 41) showing a single heptameric ring viewed orthogonal to the long axis of the cavity. The structures in B and C are drawn to scale. Four to five Het-s(218–289) termini can potentially bind within each GroEL cavity.
GroEL is a member of the Hsp60 chaperonin class of chaperones, characterized by two cylindrically stacked heptameric ring structures, each enclosing a large interior cavity (or folding chamber) that encapsulates substrate proteins (Fig. 1C) (10). Although GroEL is a bacterial protein, Hsp60 chaperonins are structurally highly conserved throughout prokaryotes and eukaryotes: for example, Escherichia coli GroEL and human mitochondrial Hsp60 are 55% sequence identical (11). In eukaryotes, Hsp60s exist not only intracellularly where they play a key role in protein homeostasis, but also extracellularly where they function as potent stimulators of the immune response (12). Each GroEL subunit comprises three domains: equatorial, intermediate, and apical (10). The latter forms the rim around the entrance to the cavity and is responsible for binding both the cochaperone GroES and protein substrates.
Studying amyloid–chaperone interactions and their impact on protofibril and fibril formation is challenging because the species present during the early stages of fibril formation are heterogeneous. Recent work has shown that the formation of toxic amyloid species can be inhibited in a diverse manner by a range of chaperones (2, 13–21). This may involve inhibition of aggregation and protofibril formation (22), disaggregation (23, 24), or targeting misfolded proteins for rapid clearance (25). Biophysical data, however, on the interaction of chaperones with amyloid protofibrils and fibrils are relatively sparse, largely relying on fluorescence measurements tracking fibril formation.
Here, we make use of solution and solid-state NMR spectroscopy, electron (EM) and atomic force (AFM) microscopies, and electron paramagnetic resonance (EPR) spectroscopy to study the interaction of the prion forming domain (residues 218–289) of Het-s with GroEL at atomic resolution during the course of the complete aggregation pathway from monomer to complete fibril formation. We show that GroEL accelerates the formation of Het-s aggregates/protofibrils by orders of magnitude, eventually leading to the formation of fibrils densely decorated at regular intervals with GroEL. The interaction, which is already present at the protofibril stage, occurs via the apical domain of GroEL and involves the mobile regions of Het-s.
Results and Discussion
Initial Aggregation.
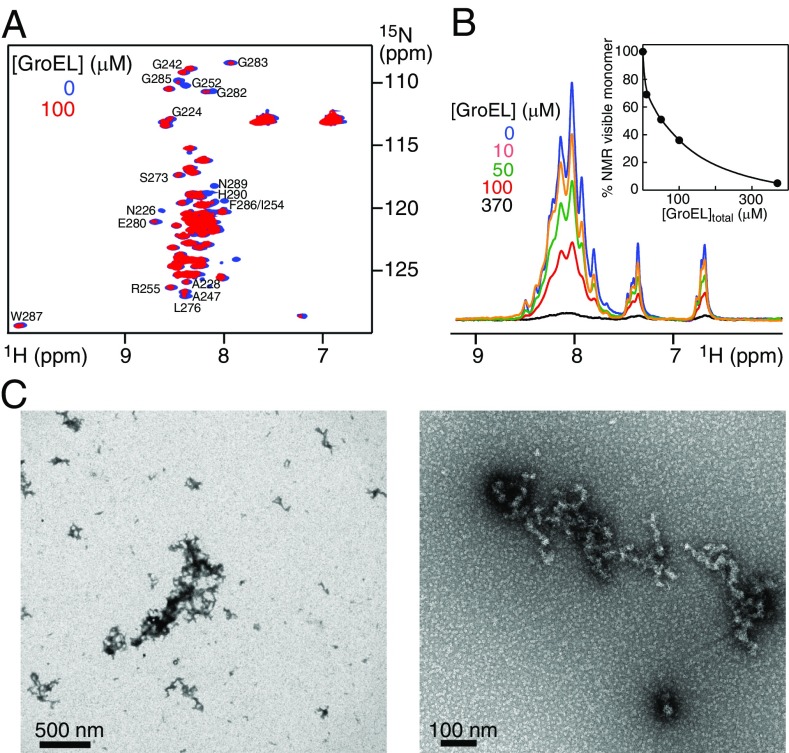
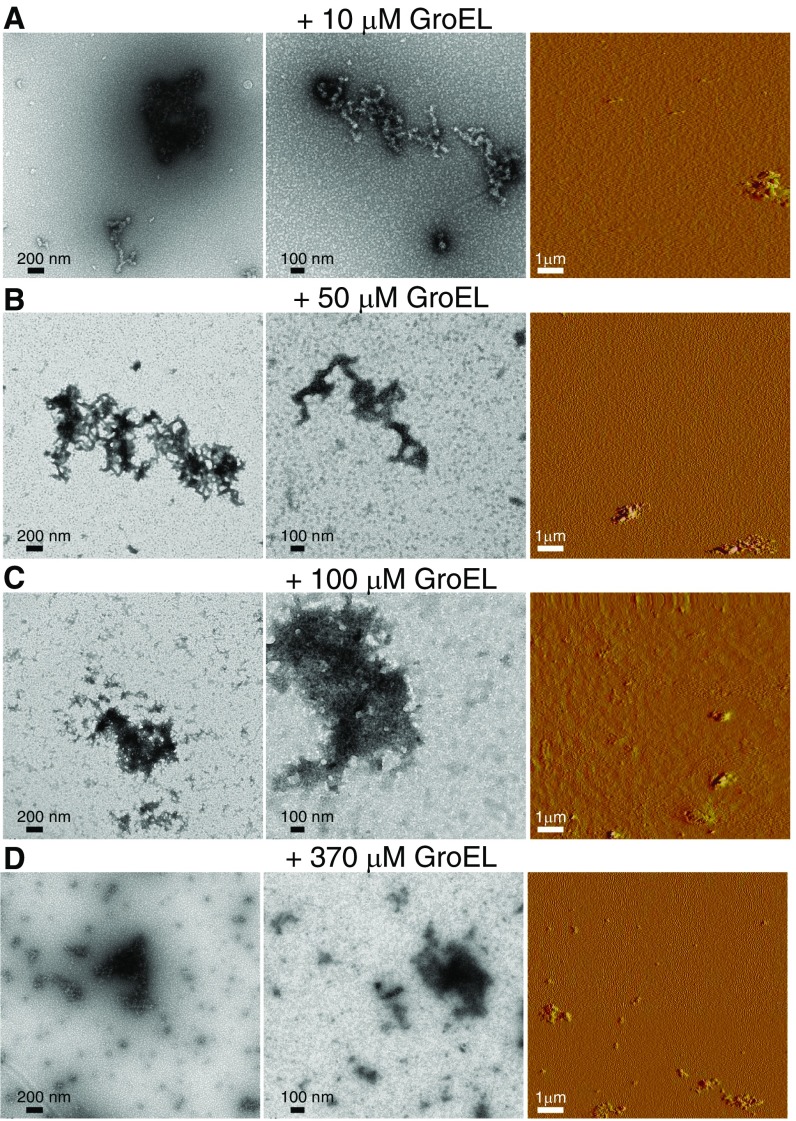
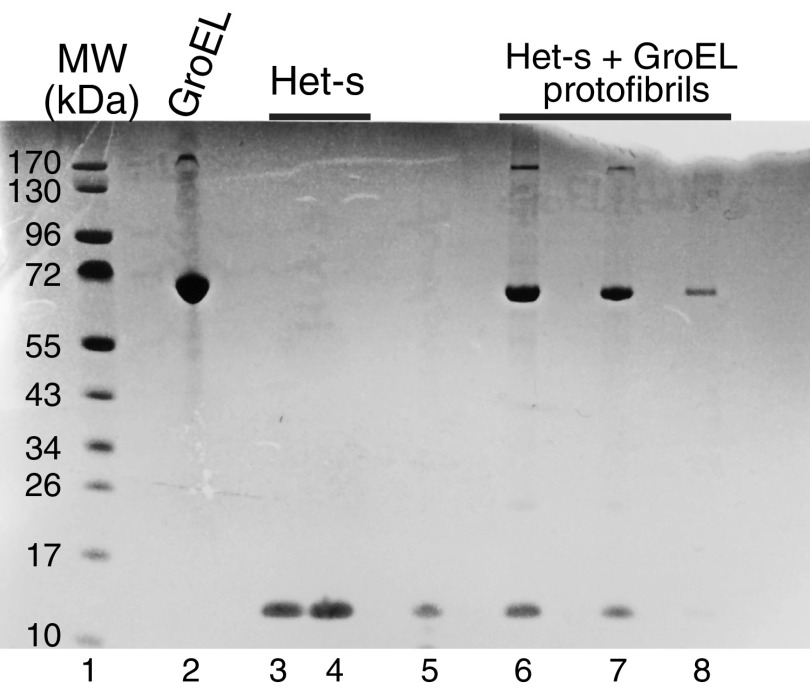
Addition of unlabeled GroEL (at natural isotopic abundance) to 1H/15N-labeled Het-s(218–289) monomer results in an immediate (within the first 5 min), GroEL concentration-dependent decrease in cross-peak intensities in the 1H-15N correlation spectrum of monomeric Het-s (Fig. 2 A and B), accompanied by the appearance of protein aggregates or protofibrils as seen by both EM (Fig. 2 C and D and Fig. S1) and AFM (Fig. S1). At a ratio of 4 Het-s monomers per GroEL 14-mer (corresponding to the sample at 100 μM Het-s and 370 μM subunits of GroEL) only ∼4–5% Het-s monomer remains visible by NMR (Fig. 2B). Further, the concentration of GroEL required to reduce the fraction of NMR-visible Het-s monomer by 50% (i.e., 50% aggregation) is ∼5 μM GroEL 14-mer (∼70 μM in subunits) (Fig. 2B). SDS/PAGE indicates that the aggregates comprise both Het-s and GroEL (Fig. S2). In the absence of GroEL, Het-s remains monomeric for at least a day at room temperature with no EM evidence of protofibril formation.
Fig. 2.
GroEL concentration-dependent aggregation of Het-s(218–289) at time point zero. (A) 1H-15N HSQC spectra of 100 μM Het-s(218–289) alone (blue) and immediately after addition of 100 μM (in subunits) GroEL (red). (B) First increment of 1H-15N HSQC spectra acquired on 100 μM Het-s(218–289) in the presence of 0–370 μM (in subunits) GroEL at time point zero (i.e., recorded immediately after addition of GroEL). Inset shows a plot of the fractional decrease in NMR visible monomer as a function of total GroEL concentration (in subunits). (C) Electron micrographs of the Het-s aggregates (protofibrils, 100 μM in monomer units) formed immediately after addition of 100 μM (in subunits) GroEL at room temperature. In the same time frame, no aggregates/protofibrils are observed in the absence of GroEL addition.
Fig. S1.
Negative stain electron micrographs (Left and Center) and amplitude AFM images (Right) of Het-s protofibrils obtained immediately after addition of GroEL at different concentrations. Ten (A), 50 (B), 100 (C), and 370 (D) micromolar (in subunits) GroEL was added to 100 μM Het-s(218–289) monomer.
Fig. S2.
Characterization of GroEL, Het-s, and Het-s/GroEL protofibrils by Coomassie-stained SDS/PAGE (4–12% wt/vol). Lane 1, molecular mass standards; lane 2, 10 μM (in subunits) GroEL (subunit theoretical molecular mass = 57.1 kDa); lanes 3 and 4, 10 and 20 μM Het-s(218–289) (theoretical molecular mass = 8.7 kDa), respectively; lane 5, supernatant after spinning down protofibrils obtained 5 min after addition of 100 μM (in subunits) GroEL to 100 μM Het-s; lanes 6–8, pelleted protofibrils (obtained 5 min after addition of 100 μM in subunits GroEL to 100 μM Het-s) dissolved in SDS loading buffer at concentrations of 7, 4, and 2 μM, respectively, in GroEL (subunit concentration) and Het-s in a 1:1 ratio.
Progression of Aggregation.
We followed the disappearance of 15N-labeled Het-s monomer as a function of time by solution NMR, monitoring overall signal intensity from the first increment of a 1H-15N correlation spectrum (Fig. 3A). Subsequent to the initial rapid decrease in monomer concentration occurring within the first 5 min after addition of GroEL as a result of protofibril formation (cf. Fig. 2 and Figs. S1 and S3B), there is a slow decrease in monomer concentration with a half-life of ∼2 d at GroEL concentrations of 10 and 50 μM (in subunits) and ∼2.7 d at 100 μM (in subunits) GroEL concentration. In the absence of GroEL, the decrease in Het-s monomer concentration is approximately monoexponential with a half-life of approximately, 2.5 d (Fig. 3A). After 11–14 d at room temperature under quiescent conditions (i.e., not shaken or stirred), both protofibrils and fibrils are clearly seen in the EM and AFM images of the Het-s/GroEL samples (Fig. 3B and Fig. S3D); in the absence of GroEL only fibrils are seen by EM and AFM under the same conditions (Fig. 3C and Fig. S3A).
Fig. 3.
Time dependence of Het-s(218–289) aggregation following addition of GroEL. (A) Disappearance of 100 μM Het-s(218–289) monomer over time as a function of GroEL concentration (specified in subunits), measured by solution-state NMR. (B) Electron micrographs of GroEL-induced Het-s protofibrils (Left) and fibrils (arrow, Right) obtained 11 d following the addition of 370 μM (in subunits) GroEL to 100 μM monomeric Het-s(218–289) at room temperature under quiescent conditions. (C) Het-s(218–289) fibrils obtained with 100 μM Het-s(218–289) alone at room temperature after 11 d under quiescent conditions.
Fig. S3.
Amplitude AFM images of Het-s protofibril/fibril formation over time in the absence and presence of GroEL. (A) Het-s(218-29) fibrils (100 μM in monomer) formed after 2 wk at room temperature. Het-s(218–289) protofibrils and fibrils (100 μM in monomer) obtained immediately (B), after 18 h (C), and after 2 wk (D) following the addition of 370 μM (in subunits) GroEL. In B and C, only protofibils are present; but after 2 wk (C), both fibrils and profibrils are clearly observed. Fibrilization was carried out at room temperature under quiescent conditions.
Characterization of Het-s/GroEL Fibrils by Electron Tomography.
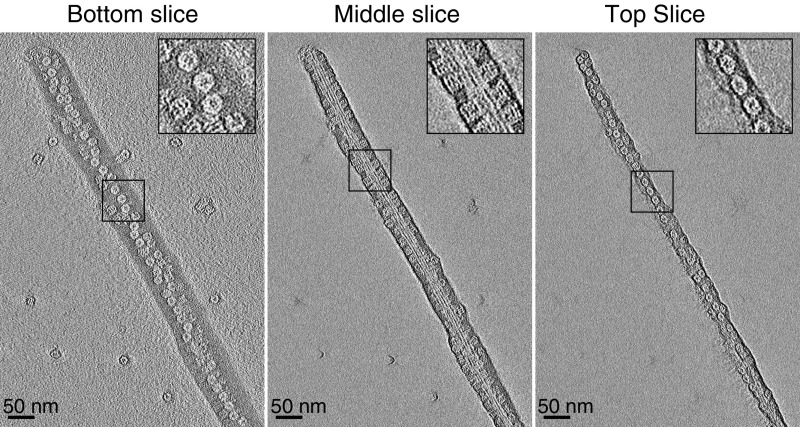
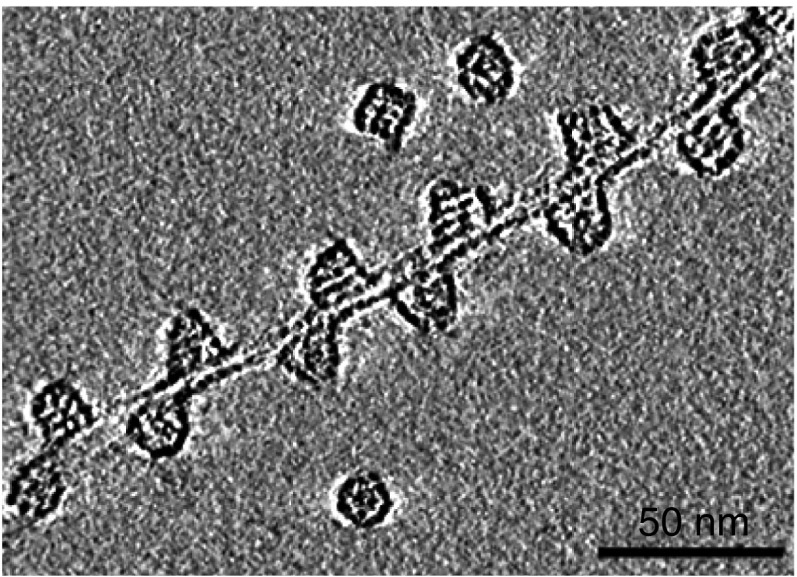
Electron tomograms taken 3 wk after addition of GroEL to Het-s reveals the presence of both multifilament fibril bundles (Fig. 4) and unifilament fibrils (Fig. 5) decorated in a regular, densely packed manner by GroEL with a center-to-center spacing of ∼200 Å between adjacent bound GroEL molecules. GroEL binds on the lower (Fig. 4, Left), side (Fig. 4, Center) and upper (Fig. 4, Right) faces of the fibril bundles. The observation that GroEL is present on both sides of a unifilament fibril suggests that the filament twists in a helical manner about the long axis of the fibril (Fig. 5). Similar images are also observed when GroEL is added to preformed Het-s fibrils (Fig. 6 and see Fig. S5). Further magnification (Fig. 5) also reveals that GroEL binding to Het-s fibrils occurs exclusively via the open ring face of GroEL comprising a heptameric ring of apical domains (10).
Fig. 4.
Negative stain electron tomogram images of Het-s fibrils 3 wk after addition of 100 μM (in subunits) GroEL to 100 μM monomeric Het-s(218–289) at room temperature under quiescent conditions. All three slices clearly show that GroEL binds via its apical domain to the Het-s(218–289) fibrils. Insets show a zoom of a region of interest (black box).
Fig. 5.
Regular spacing of GroEL bound via its apical domain to a Het-s monofilament. Shown is the middle slice of a negative stain electron tomogram image of a Het-s fibril formed 3 wk after addition of 100 μM (in subunits) GroEL to 100 μM Het-s(218–289) at room temperature under quiescent conditions. Also seen are three unbound GroEL molecules.
Fig. 6.
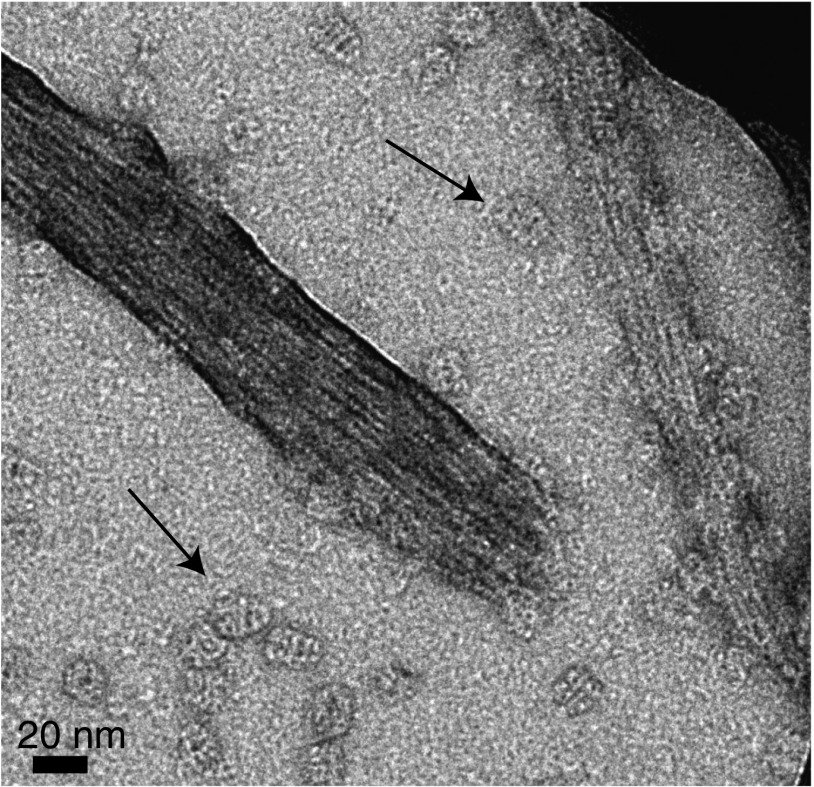
Negative stain electron micrographs of Het-s fibrils formed in the absence (A) and presence (B) of GroEL and GroES. Most of the GroEL bound to Het-s is in the uncapped form (red box); however, some bullet-shaped GroEL/GroES complexes are also bound to the Het-s fibrils (blue box). Right images show a collection of enlarged micrographs of differently prepared samples where uncapped bound GroEL (first and second rows, red), bullet-shaped bound GroEL/GroES complexes (third row, blue), and unbound football-shaped GroEL/GroES complexes (fourth row, black) are found. One hundred micromolar Het-s(218–289) was fibrilized for 3 wk at room temperature under quiescent conditions. Bullet- or football-shaped GroEL/GroES complexes (prepared as described in Experimental Methods) were mixed separately with Het-s fibrils leading to micrographs shown in the blue or black boxes (B, Right), respectively (see also Fig. S5).
Fig. S5.
Negative stain EM of Het-s fibrils in the presence of football-shaped GroEL/ES complexes. Most of the GroEL is still uncapped and bound to the fibrils; football-shaped GroEL/ES complexes can be clearly seen (typical examples are indicated by arrows) and are never observed bound to the fibrils. Het-s (100 μM monomer) was fibrilized at room temperature under quiescent conditions. Football-shaped GroEL/GroES complex (prepared as described in Experimental Methods) were added directly to the fibrils.
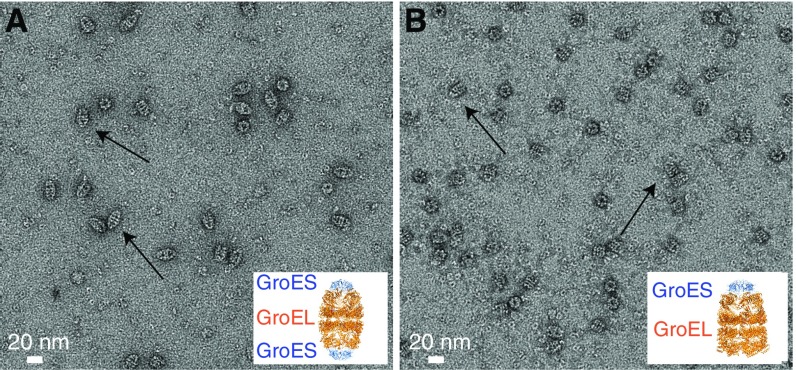
The binding site on GroEL was confirmed by addition of GroEL/GroES complexes to preformed Het-s fibrils (Fig. 6A). GroES binds to the apical domain of GroEL, thereby capping either one or both GroEL rings (depending on conditions; see Experimental Methods) to form bullet-shaped (Fig. S4A) or football-shaped (Fig. S4B) complexes, respectively. In the resulting electron micrographs, the majority of GroEL particles bound to the Het-s fibrils is in the uncapped form (Fig. 6B, red boxes). Bullet-shaped GroEL/GroES complexes, however, are also clearly seen bound to the fibrils (Fig. 6B, blue boxes), but we see no evidence of any bound, football-shaped GroEL/GroES complexes (Fig. 6B, black boxes, and Fig. S5). Thus, binding of GroEL to Het-s fibrils requires the presence of at least one uncapped ring.
Fig. S4.
Negative stain electron micrographs of 100 μM (in subunits) GroEL capped with 100 μM (in subunits) GroES. (A) Bullet-shaped GroEL complexes (one end capped by GroES) formed upon addition of ADP. (B) Football-shaped GroEL/GroES complexes (both ends capped by GroES) formed upon addition of ATP. Typical examples are indicated by arrows in both A and B. Insets in A and B show the X-ray structures of the football-shaped (PDB ID code 4PKN; refs. 45 and 46) and bullet-shaped (PDB ID code 1SX4; ref. 45) GroEL/GroES complexes, respectively. Details regarding the assembly of the two GroEL/GroES complexes are given in Experimental Methods.
Characterization of Het-s Fibrils by Continuous Wave EPR.
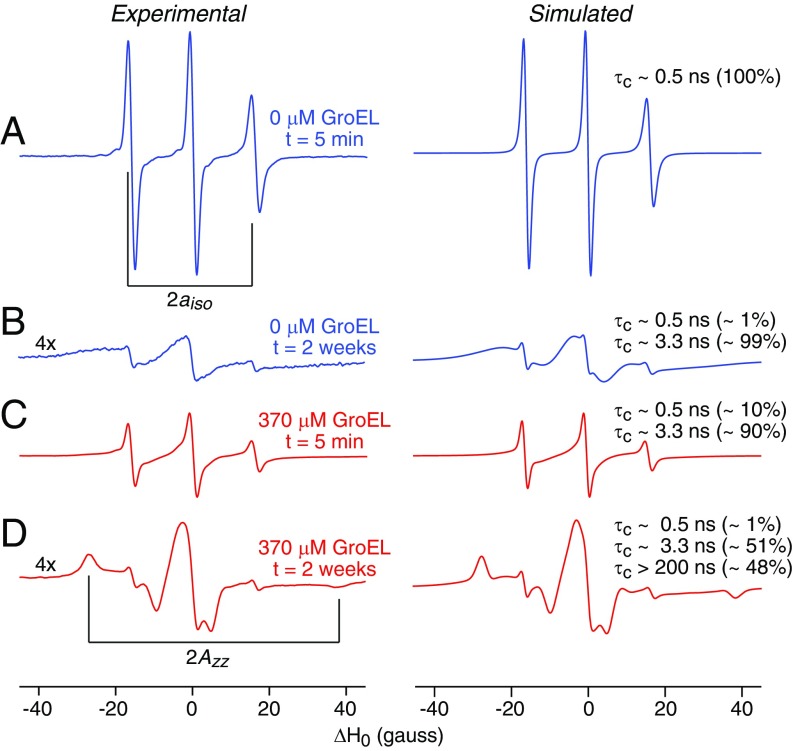
Continuous wave (CW) EPR spectroscopy provides a straightforward approach for probing the internal mobility of a nitroxide label [such as MTSL; (1-oxyl-2,2,5,5-tetramethyl-D3-pyrroline-3-methyl) methanethiosulfonate)]. We therefore MTSL-labeled Het-s(218–289) at position 227, located at the N terminus of strand β1, close to the disordered N-terminal tail (Fig. 1A), via an engineered cysteine mutation (S227C).
The lineshape of the EPR spectrum is sensitive to the mobility of the nitroxide label (26). At X-band, the EPR spectrum is dominated by the electron-nuclear hyperfine splitting tensor A. Rapid isotropic reorientation of the spin labels reduces the A tensor to a scalar value aiso = 1/3(Ax + Ay + Az), resulting in a three-line EPR spectrum with the two outer components separated by 2aiso; as rotational motion of the spin label is slowed down (or motion of the label hindered), the EPR lineshape changes, eventually reaching the powder limit in which the two outer components are separated by 2Azz (27).
The CW X-band EPR spectrum of the nitroxide labeled Het-s(S227C) monomer is well described by an effective correlation time (τeff) of ∼0.5 ns (Fig. 7A). The EPR spectrum of Het-s fibrils formed in the absence of GroEL (Fig. 7B) and Het-s protofibrils formed immediately upon addition of GroEL (Fig. 7C) are characterized by a two-species system comprising a slow component with τeff ∼ 3.3 ns corresponding to the fibrils and protofibrils, and a fast component τeff ∼ 0.5 ns corresponding to residual Het-s monomer present in the sample. The reduction in mobility of the nitroxide label in the fibrils and protofibrils can be attributed to the transition from a random coil to an ordered β-sheet structure containing the label. Finally, the EPR spectrum of the fibrils of Het-s formed in the presence of GroEL can be well reproduced by a three-species system comprising a powder (τeff > 200 ns or severely restricted motion with a high order parameter) characterized by the 2Azz splitting (Fig. 7D), in addition to the two faster components seen in the Het-s fibrils alone and the Het-s/GroEL protofibrils. We attribute the powder species of the EPR spectrum to the immobilization of the nitroxide label attached to Het-s through direct interaction with GroEL, presumably binding to the GroEL-binding consensus sequences (28) located either in the N-terminal tail or the β4/β5 loop of Het-s fibrils (Fig. 1A). Many of the Het-s fibrils bound to GroEL consist of a multifilament bundle. Since GroEL binds to the outside of the fibrils, the nitroxide labels of only Het-s molecules in the outer filaments of the bundle can be fully immobilized by GroEL, accounting for the roughly equal population of the τeff ∼ 3.3 and >200 ns species in the EPR spectrum.
Fig. 7.
Comparison of experimental and simulated CW X-band EPR spectra of MTSL-labeled Het-s (S227C) in different states. (A) Monomeric Het-s. (B) Het-s fibrils were obtained after 2 wk at room temperature, centrifuged, and the pellet was resuspended in water (C) Het-s protofibrils obtained within 5 min of addition of GroEL (the sample is not spun down). (D) Het-s fibrils obtained at room temperature 2 wk after the addition of GroEL, centrifuged, and the pellet was resuspended in water. The experimental and simulated first derivative EPR spectra are shown in the left and right columns, respectively. The simulated spectra were calculated with different correlation times and species populations as indicated (26). The derivative EPR spectra are normalized to the double integral.
Solid-State NMR of Het-s Fibrils in the Presence of GroEL.
To further characterize the interaction of GroEL with Het-s fibrils from the perspective of Het-s, we made use of solid-state NMR spectroscopy on uniformly 15N/13C-labeled Het-s fibers grown in the absence and presence of GroEL (Fig. 8 and Figs. S6 and S7).
Fig. 8.
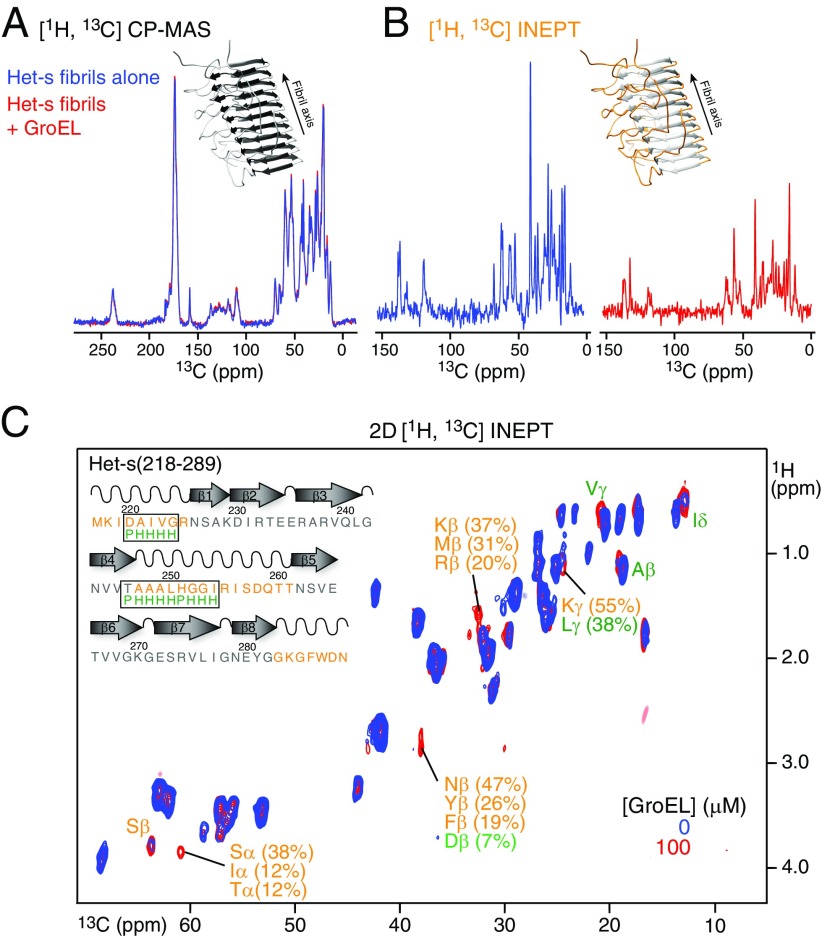
Solid-state NMR of Het-s fibrils formed in the presence and absence of GroEL. Comparison of 1D [1H, 13C] CP-MAS (A) and [1H, 13C] INEPT-MAS (B) spectra of Het-s fibrils formed in the absence (blue) and presence (red) of GroEL. Insets shows the structure of a Het-s(218–289) fibril (PDB ID code 2RNM; ref. 8) with the rigid portions colored in dark gray (A) and the mobile tails and loops in orange (B). (C) Comparison of 2D [1H,13C] INEPT-MAS spectra of Het-s fibrils formed in the absence (blue) and presence (red) of GroEL. The 1D CP-based spectra (A) overlap perfectly showing that the rigid segments (dark gray) of the Het-s(218–289) fibrils have the same overall structure in presence and absence of GroEL, confirmed by the 2D [13C,13C] Dipolar Assisted Rotational Resonance (DARR) spectra shown in Fig. S6). There are large differences in peak intensities in the INEPT-based experiments (B and C) indicating differences in the mobile portions of the fibrils upon GroEL binding. Cross-peaks of Het-s fibrils with significant chemical shift differences in the presence and absence of GroEL, together with assignments in terms of residue/atom type probabilities (31), are indicated. One hundred micromolar monomeric Het-s(218–289) was fibrilized at room temperature under quiescent conditions in the absence and presence of 100 μM (in subunits) GroEL.
Fig. S6.
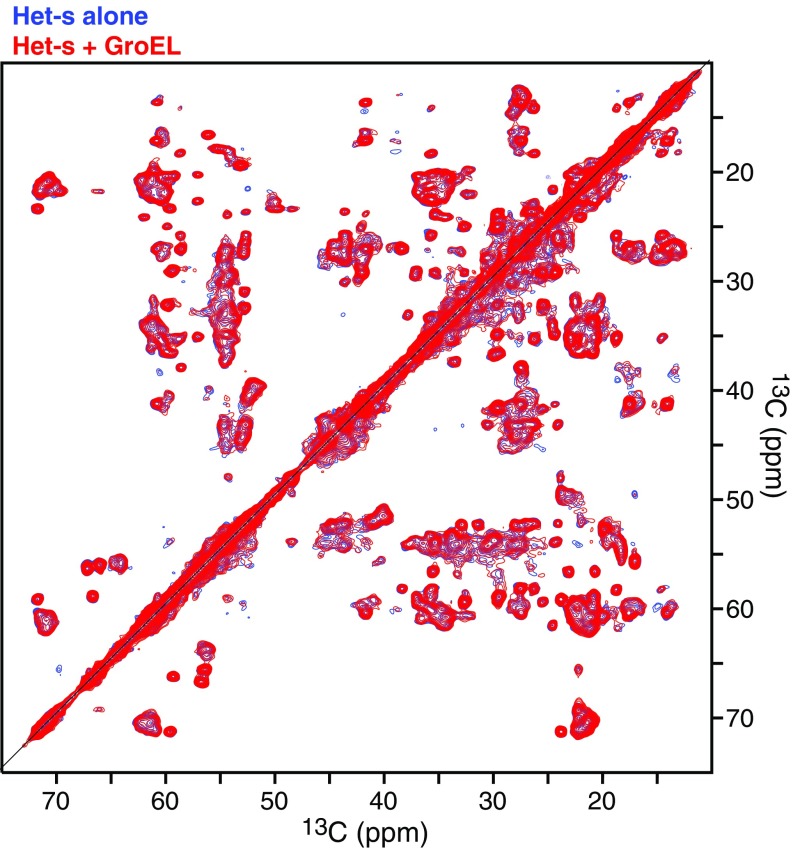
Comparison of 2D CP-MAS 13C/13C DARR correlation spectra of Het-s fibrils obtained in the absence (blue) and presence (red) of GroEL. During the 30-ms DARR mixing time, magnetization is transferred between adjacent 13C atoms by spin diffusion arising from 13C-13C dipolar couplings. Fibrilization of 100 μM Het-s(218–289) in the absence or presence of 100 μM (in subunits) GroEL was performed over a period of 3 wk at room temperature under quiescent conditions.
Fig. S7.
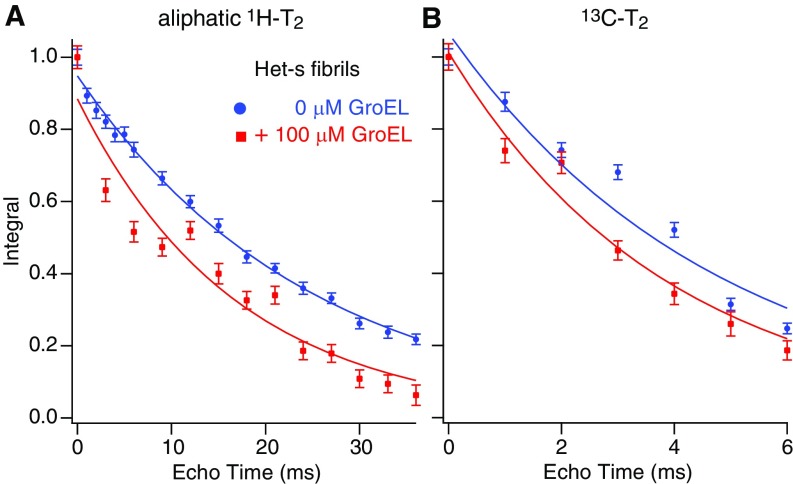
Global aliphatic 1H (A) and 13C transverse (B) relaxation rates (T2) of Het-s(218–289) fibrils formed in the absence (blue) and presence (red) of GroEL. 1H-T2 values are 24.7 ± 0.1 and 16.8 ± 0.1 ms for fibrils formed in the absence and presence of GroEL, respectively; the corresponding 13C-T2 values are 4.8 ± 0.1 and 3.9 ± 0.2 ms, respectively. Het-s fibrils were obtained by fibrilization of 100 μM Het-s monomer at room temperature for 3 wk under quiescent conditions in the absence and presence of 100 μM (in subunits) GroEL.
We first recorded a set of 1H-13C cross-polarization (CP)–based magic angle spinning (MAS) spectra, both 1D 13C (Fig. 8A) and 2D 13C/13C with dipolar assisted rotational resonance (29) transfer between 13C nuclei (Fig. S6). Under CP-MAS conditions, only rigid segments of the Het-s fibrils are probed (30). This is because molecular motions in dynamic regions prevent the dipolar coupling-based magnetization transfer used in CP-MAS–based experiments. The CP-MAS spectra of Het-s fibrils in the presence and absence of GroEL overlap perfectly, indicating that GroEL does not perturb the structure of the rigid fibril core.
Next, we recorded a set of 1D and 2D 1H/13C MAS spectra based on 1H-13C INEPT (insensitive nuclei enhanced by polarization transfer) transfers (Fig. 8 B and C) to probe the mobile regions of the Het-s fibrils (30), specifically, the N- and C-terminal tails and the long loop connecting β-strands 4 and 5. In INEPT-based experiments, magnetization is transferred from 1H to 13C via 1JCH scalar couplings, and 1H and 13C transverse relaxation rates must be longer than the time required for 1H-13C polarization transfer to observe a signal. In rigid segments of the protein with slow or anisotropic reorientations, the 1H-1H and 1H-13C dipolar couplings are not averaged to zero over time; in mobile regions, however, the dipolar interactions are time-averaged to zero, thereby eliminating the main mechanism of signal loss during INEPT transfer. Comparison of both the 1D (Fig. 8B) and 2D (Fig. 8C) 1H/13C INEPT spectra shows that the presence of GroEL results in significant differences. First, there is an obvious decrease in signal intensity in the 1D 1H/13C INEPT spectrum of Het-s fibrils with GroEL (Fig. 8B), accompanied by a corresponding decrease in the aliphatic 1H and 13C transverse relaxation times [from 24.7 ± 0.1 to 16.8 ± 0.1 ms, and from 4.8 ± 0.1 to 3.9 ± 0.2 ms, respectively (Fig. S7)]. Thus, one can conclude that GroEL binds to mobile and accessible segments of the Het-s fibrils. Further analysis of the 2D 1H/13C INEPT spectra reveals a few significant chemical shift differences as well, and the shifted cross-peaks can be assigned residue/atom type probabilities (31) (Fig. 8C). The latter are consistent with residues either in or close to the GroEL consensus-binding sequences (28) located in the N-terminal tail or β4/β5 loop (Fig. 8C).
Concluding Remarks
Using a range of biophysical and structural techniques, we have shown that the chaperonin GroEL interacts directly with the Het-s prion protein, resulting in a two order of magnitude or larger speed up of aggregation and protofibril formation. The rate of appearance of fully formed fibrils, however, is slowed down in the presence of GroEL. Thus, after 11 d, both protofibils and fibrils of Het-s are seen in the presence of GroEL (Fig. 3B), while only fibrils are observed for Het-s alone (Fig. 3C). After 3 wk, however, the Het-s protofibrils obtained in the presence of GroEL have largely been converted to fibrils. GroEL remains bound to Het-s throughout the aggregation process and decorates Het-s fibrils with a regular spacing of ∼200 Å. Given the diameter of the GroEL cavity, we surmise that GroEL interacts with four to five Het-s units within a fibril, thereby resulting in high avidity.
The interaction of GroEL with amyloid-type fibrils, in this instance Het-s, requires that mobile regions within the fibril (containing one or more GroEL consensus binding sequences) be able to access the inner rim of the central cavity of GroEL formed by the apical domain. Thus, amyloid fibrils without these particular characteristics would not be expected to interact with GroEL in the same manner as Het-s. For example, while GroEL binds to amyloid-β monomers via two GroEL-binding consensus sequences (32), these sequences are largely located in ordered β-sheet regions of the fibril (33–35). Hence, one would predict that interaction between GroEL and amyloid-β fibrils would only occur upon disruption of the fibril.
In the context of the etiology of amyloidosis, the type of interaction seen here between GroEL and Het-s protofibrils and fibrils may serve two functions. First, chaperone binding to toxic amyloid oligomers may render these nontoxic by sequestration into large aggregates, as has been demonstrated in the case of the interaction between the small heat shock protein HspB1 and amyloid-β protofibrils (36). Second, binding of chaperones to fully formed fibrils may facilitate in vivo clearance (e.g., in the liver) as was shown for the extracellular chaperone clusterin (25).
Experimental Methods
Expression and Purification.
Details of the expression and purification of GroEL, GroES, and Het-s(218–289) are provided in SI Experimental Methods. GroEL/GroES bullet-shaped and football-shaped complexes in which one or both GroEL rings are capped, respectively, were prepared essentially as described with some minor modifications (37). Fibrillization of Het-s(218–289) was carried out as described (38).
NMR and EPR Spectroscopy.
Solution NMR measurements were carried out on a Bruker 600 MHz NMR spectrometer with a triple resonance z axis gradient cryoprobe at 10 °C. Further details are provided in SI Experimental Methods. Solid-state NMR was carried out on a 17.5 T spectrometer (1H frequency of 746 MHz) using a Chemmagnetics console and a Black Fox magic angle spinning probe with 12 kHz spinning. Details of the 1H-13C CP and INEPT experiments are provided in SI Experimental Methods. CW EPR spectra at X-band were recorded on a Bruker EMX spectrometer (SI Experimental Methods).
EM and AFM.
Samples of Het-s/GroEL complexes were prepared in the same manner as for the solution-state NMR experiments (SI Experimental Methods). Aliquots were taken at different time points and diluted to a final GroEL concentration of 2.5 μM. For EM, 5-μL samples were blotted onto the carbon-coated copper EM grids (Ultrathin Carbon Film/Holey Carbon; Ted Pella) for 1 min, quickly washed with deionized water, and stained with 2% uranyl acetate for 40 s. Images were taken with an FEI Tecnai T12 electron microscope operating at 120 kV and a Gatan US1000 CCD camera.
For electron tomography, tilt series were collected using SerialEM (39) on an FEI Tecnai F20 electron microscope operating at 200 kV and equipped with a Gatan K2 direct electron detector. The tilt series ranges from –60 to +60 degrees in increments of 2 degrees. Tomograms were reconstructed using the ETomo routine in the IMOD package (40).
For AFM, the same samples were directly applied to freshly cleaved mica. The sample was incubated for 1 min, washed with deionized water, and further air dried. AFM images were taken in the tapping mode using a MultiMode AFM with a Nanoscope IV controller (Veeco). This included a SPM probe model ACT silicon (Applied Nanostructures) with a 5- to 6-nm tip radius, 40 N/m force constant, and oscillating at ≈300 kHz. Images were recorded at a scan rate of 0.7–1 Hz, 256 sampling points per line, and 256 lines.
SI Experimental Methods
Expression and Purification of GroEL.
GroEL was purified as described (42). Briefly, GroEL was expressed in E. coli (BL21DE3) in Luria Bertini (LB) medium at 37 °C and induced at OD600 = 0.8 with 0.5 mM isopropyl β-d-1-thiogalactopyranoside (IPTG) and grown overnight at 20 °C. After cell lysis, nucleic acids were removed by streptomycin sulfate precipitation. The supernatant was applied to a self-packed 60-mL ion exchange column (Q Sepharose FF; GE Healthcare). The GroEL-containing fractions were pooled and subjected to ammonium sulfate precipitation. The precipitate was dissolved and injected onto a HiPrep Sephacryl S-300 gel filtration column (GE Healthcare). GroEL was further purified with an acetone precipitation step as published (42). The purity was confirmed by mass spectrometry (MS), SDS polyacrylamide gel electrophoresis (SDS/PAGE), and the absence of tryptophan fluorescence (43). Since GroEL has no tryptophans, all fluorescence signal can be attributed to protein impurities. The GroEL assembly was confirmed by blue native polyacrylamide gel electrophoresis (BN-PAGE) and stored at 4 °C.
Expression and Purification of GroES.
GroES expressed in E. coli (BL21 DE3) was induced in LB medium at 37 °C at an OD600 of 0.8 with 0.5 mM IPTG. The protein was expressed for 5–6 h at 37 °C. The harvested cells were lysed in buffer A (50 mM Tris, pH 8, 300 mM NaCl, and 10 mM imidazole), and streptomycin sulfate was added to eliminate nucleic acids. The cells were centrifuged, and the supernatant was loaded onto a 5 mL nickel Sepharose column (HisTrap HP; GE Healthcare). The protein was eluted in buffer A containing in addition 250 mM imidazole. The GroES containing fractions as visualized by SDS/PAGE were pooled and dialyzed against the thrombin cleavage buffer (20 mM Tris, pH 8, 150 mM NaCl, 2.5 mM MgCl2) overnight. The next day, the buffer was changed, and thrombin was added to the dialysis cassette and left for another night. The protein was then loaded onto a 5-mL nickel Sepharose column, equilibrated in buffer B (50 mM Tris, pH 8 and 100 mM NaCl) to remove the uncleaved fraction. The flow-through was collected and applied to a benzamidine column (HiTrap Benzamidine FF; GE Healthcare) equilibrated with buffer B to remove thrombin from GroES. The purity of the protein was verified by SDS/PAGE, mass spectrometry, and solution-state NMR spectroscopy, and the assembly was affirmed by BN-PAGE. GroES was flash frozen in liquid N2 and stored at −20 °C.
GroEL and GroES Assembly.
GroES was added to GroEL to final concentrations of 400 and 100 μM (in subunits), respectively. The buffer was adjusted to 50 mM Tris, pH 7.4, 100 mM KCl, and 10 mM MgCl2. The final solution was incubated with ≈10 mM ATP for at least 15 min at room temperature. Two millimolar AlF3 (formed by premixing 2 mM AlCl3 and 40 mM NaF) was added with either ATP or ADP to form bullet-or football-shaped GroEL/GroES complexes (37), respectively (Fig. S4). The unbound GroES was removed by washing and filtering through a 100-kDa cutoff centrifugal filter (Amicon; Millipore). This solution was diluted 1,000 times and then added to 100 μM Het-s fibrils.
Expression, Purification, and Sample Preparation of Het-s(218–289).
Het-s(218–289) with a C-terminal His6 tag and a N-terminal methionine was purified under denaturing conditions as described (44). Briefly, 15N-labeled Het-s(218–289) was expressed in standard M9 minimal medium. Expression was induced with 0.5 mM IPTG at an OD600 of 0.8 and further grown at 37 °C overnight. The cells were harvested and resuspended in buffer C (6 M guanidinium chloride, 300 mM NaCl, and 50 mM Tris at pH 8) and stirred overnight at 4 °C. Cell lysis was achieved by heating to 60 °C overnight. The lysate was centrifuged, and the supernatant was batch bound to nickel Sepharose resin (GE Healthcare), preequilibrated with 10 mM imidazole, in buffer C overnight. Het-s(218–289) was eluted into buffer C containing additionally 250 mM imidazole. The Het-s(218–289)–containing fractions were pooled and desalted in 10% acetic acid using a HiTrap column (Amersham). The protein was lyophilized and stored at −20 °C. The purity of the sample was confirmed by SDS/PAGE and mass spectrometry.
For the S227C mutation, the codon encoding the Ser at position 227 was replaced by one for Cys using the QuikChange mutagenesis kit, and the plasmid was transformed into E. coli BL21 Star (DE3) competent cells (Life Technologies). Het-s (S227C) was purified as described above. For site-specific spin labeling, Het-s(S227C) was incubated with a 10-fold excess of either paramagnetic MTSL (Toronto Chemical Research) or diamagnetic (1-acetoxy-2,2,5,5-tetramethyl-d3-pyrroline-3-methyl)methanethiosulfonate (Toronto Research Chemicals), overnight at room temperature in buffer C before buffer exchange to 10% acetic acid. Spin-labeling was confirmed by mass spectrometry.
Fibrillization of Het-s(218–289) was carried out as published (38). In summary, 1 mg of lyophilized protein was dissolved in 200 μL of 45 mM HCl, filtered through a 0.2-μm filter, and the pH was adjusted to 7.4 by addition of 1 M Tris, pH 7.4, resulting in a final buffer composition of 230 mM Tris/45 mM HCl, pH 7.4. The protein was diluted to a concentration of ≈200 μM as measured by UV absorption at 280 nm, and then further diluted by a factor of two either by the addition of buffer or GroEL.
SDS/PAGE Analysis of Het-s Protofibrils.
One hundred micromolar (in subunits) GroEL was added to Het-s(218–289) in a 1:1 ratio and incubated overnight. The turbid sample was centrifuged for 5 min at 14,000 × g on a tabletop centrifuge. The supernatant was removed, and an aliquot of 5 μL was mixed with the SDS protein loading buffer from Quality Biological [containing Tris base, 4% (wt/vol) SDS, 0.2% (vol/vol) bromophenol blue, 20% (vol/vol) glycerol, and molecular biology grade water], and loaded on a SDS/PAGE gel (4–12% wt/vol). The pellet was washed three times with water, dissolved with the SDS protein loading buffer (Quality Biological), and diluted to the final concentration given in Fig. S2.
Solution NMR Spectroscopy.
Het-s(218–289) was treated as described above except for the addition of D2O (5% vol/vol) to the samples before measurements. Several microliters of either a ∼1 mM (in subunits) GroEL stock solution or the GroEL buffer (10 mM Tris, pH 7.4 and 10 mM MgCl2) were added to ≈200 μM Het-s(218-298) and further diluted to reach a final concentration of 100 μM Het-s and 0–370 μM (in subunits) GroEL. Fibrilization was achieved under quiescent conditions at room temperature for approximately 3 wk. Solution-state NMR experiments were performed in Shigemi tubes in a volume of 250 μL on a Bruker 600 MHz spectrometer with a triple resonance z axis gradient cryoprobe at 10 °C. Data processing was performed by using NMRPipe and analyzed either in Topspin3.5 or using the ccpNMR analysis suite (31). Standard [1H,15N] HSQC spectra were recorded to study the aggregation kinetics. Backbone resonance assignments of Het-s(218–289) were carried out using standard 3D triple resonance NMR experiments (HNCA, HNCACB, and HNCOCA) recorded on a 215 μM [15N,13C]-labeled Het-s(218–289) sample.
Solid-State NMR Spectroscopy.
The Het-s(218–289) fibrils with and without GroEL were packed into a thin-walled 3.2-mm Varian style NMR rotor by centrifugation at 5,000 × g. All experiments were performed on a 17.5 T NMR spectrometer operating at a 1H frequency of 746.0548 MHz using a Chemmagnetics console and a 3.2 mm Black Fox magic angle spinning (MAS) probe (Black Fox) with 12 kHz spinning and the variable temperature gas set to −15 °C to maintain the sample temperature at approximately +15 °C. For the 1D 1H-13C CP-based experiments, the length of the 1H 90° pulse was 4 μs and the radio-frequency (RF) field strength for 1H two-pulse-phase modulation (TPPM) decoupling was 85 kHz. During the 1.5-ms CP period, the RF field strengths used for 1H and 13C irradiation were ∼58 and ∼44 kHz, respectively. One thousand twenty-four complex points were acquired with a dwell time of 15 µs and a recycle delay of 1.75 s. The 13C-13C DARR experiment was obtained under the same conditions as the 1D CP spectra. The length of the 13C 90° pulse was 5 μs, the DARR mixing time was 30 ms, and the RF field strength of the DARR 1H pulse was ∼12 kHz. Five hundred t1 points were acquired with a 22.4-μs increment. Data were processed in “States” mode. One-dimensional and 2D INEPT spectra were obtained with 4-μs 1H 90°, 8-μs 1H 180°, 5-μs 13C 90°, and 10-μs 13C 180° pulses. The first and second J-evolution times were set to 0.9 and 1.4 ms, respectively. Ten kilohertz RF 1H decoupling was applied during the acquisition period comprising 2,048 complex points with a dwell time of 15 μs. For the 2D INEPT, the t1 increment was 133 μs for both samples. For the Het-s sample containing GroEL, 90 t1 points were collected with an evolution time of 12 ms; for the Het-s sample without GroEL, 135 t1 points were collected for an evolution time of 18 ms. All data were processed using a 60-Hz Gaussian apodisation window function and zero-filled to four times the original data size.
EPR Spectroscopy.
MTSL-labeled Het-s (S227C) samples (100 μM) with or without 370 μM (in subunits) GroEL were loaded into quartz capillaries (0.6-mm inner diameter × 0.84-mm outer diameter, VitroCom). Room temperature CW EPR spectra were recorded on a Bruker EMX spectrometer at X-Band with a scan width of 100 Gauss using an HS cavity and an incident microwave power of 20 mW. EPR spectra of Het-s fibrils were also recorded on a paramagnetically diluted sample comprising a 1:9 ratio of paramagnetic MTSL to diamagnetic MTS-labeled Het-s to determine the impact of dipolar coupling arising from neighboring Het-s units within the cross β-sheet fibril; for the purposes of the qualitative analysis presented in Fig. 7, no significant difference in effective correlation time for the spin label was seen in the paramagnetically diluted sample (τeff ∼3.1 ns versus ∼3.3 ns in the 100% MTSL-labeled Het-s fibrils) [i.e., dipolar couplings between spin labels spaced at 10-Å intervals along the fibril (cf. Fig. 1B) in the 100% MTSL-labeled sample result in only a small (<10%) increase in the fitted τeff value].
Acknowledgments
We thank Rob Tycko for useful discussions; James Baber, Dan Garrett, and Jinfa Ying for technical support; and Roland Riek for the gift of the Het-s(218–289) clone. M.A.W. was supported by an Early Postdoc.Mobility Fellowship from the Swiss National Science Foundation. D.T.M. was supported by the Postdoctoral Research Associate Program of the National Institute of General Medical Sciences, NIH Award Fi2GM117604. This work was supported by the Intramural Program of the National Institute of Diabetes and Digestive and Kidney Diseases, National Institutes of Health (G.M.C. and J.E.H.), and by the AIDS-Targeted Antiviral Program of the Office of the Director of the National Institutes of Health (G.M.C.).
Footnotes
The authors declare no conflict of interest.
This article contains supporting information online at www.pnas.org/lookup/suppl/doi:10.1073/pnas.1711645114/-/DCSupplemental.
References
- 1.Hartl FU, Hayer-Hartl M. Molecular chaperones in the cytosol: From nascent chain to folded protein. Science. 2002;295:1852–1858. doi: 10.1126/science.1068408. [DOI] [PubMed] [Google Scholar]
- 2.Balch WE, Morimoto RI, Dillin A, Kelly JW. Adapting proteostasis for disease intervention. Science. 2008;319:916–919. doi: 10.1126/science.1141448. [DOI] [PubMed] [Google Scholar]
- 3.Hartl FU, Bracher A, Hayer-Hartl M. Molecular chaperones in protein folding and proteostasis. Nature. 2011;475:324–332. doi: 10.1038/nature10317. [DOI] [PubMed] [Google Scholar]
- 4.Wyatt AR, Yerbury JJ, Dabbs RA, Wilson MR. Roles of extracellular chaperones in amyloidosis. J Mol Biol. 2012;421:499–516. doi: 10.1016/j.jmb.2012.01.004. [DOI] [PubMed] [Google Scholar]
- 5.Chiti F, Dobson CM. Protein misfolding, functional amyloid, and human disease. Annu Rev Biochem. 2006;75:333–366. doi: 10.1146/annurev.biochem.75.101304.123901. [DOI] [PubMed] [Google Scholar]
- 6.Eanes ED, Glenner GG. X-ray diffraction studies on amyloid filaments. J Histochem Cytochem. 1968;16:673–677. doi: 10.1177/16.11.673. [DOI] [PubMed] [Google Scholar]
- 7.Fowler DM, Koulov AV, Balch WE, Kelly JW. Functional amyloid––from bacteria to humans. Trends Biochem Sci. 2007;32:217–224. doi: 10.1016/j.tibs.2007.03.003. [DOI] [PubMed] [Google Scholar]
- 8.Wasmer C, et al. Amyloid fibrils of the HET-s(218-289) prion form a β solenoid with a triangular hydrophobic core. Science. 2008;319:1523–1526. doi: 10.1126/science.1151839. [DOI] [PubMed] [Google Scholar]
- 9.Van Melckebeke H, et al. Atomic-resolution three-dimensional structure of HET-s(218-289) amyloid fibrils by solid-state NMR spectroscopy. J Am Chem Soc. 2010;132:13765–13775. doi: 10.1021/ja104213j. [DOI] [PubMed] [Google Scholar]
- 10.Braig K, et al. The crystal structure of the bacterial chaperonin GroEL at 2.8 A. Nature. 1994;371:578–586. doi: 10.1038/371578a0. [DOI] [PubMed] [Google Scholar]
- 11.Zeilstra-Ryalls J, Fayet O, Georgopoulos C. The universally conserved GroE (Hsp60) chaperonins. Annu Rev Microbiol. 1991;45:301–325. doi: 10.1146/annurev.mi.45.100191.001505. [DOI] [PubMed] [Google Scholar]
- 12.Pei W, et al. 2016. Extracellular HSP60 triggers tissue regeneration and wound healing by regulating inflammation and cell proliferation. NPJ Regenerative Med, 16013.
- 13.Muchowski PJ, Wacker JL. Modulation of neurodegeneration by molecular chaperones. Nat Rev Neurosci. 2005;6:11–22. doi: 10.1038/nrn1587. [DOI] [PubMed] [Google Scholar]
- 14.Jones GW, Tuite MF. Chaperoning prions: The cellular machinery for propagating an infectious protein? BioEssays. 2005;27:823–832. doi: 10.1002/bies.20267. [DOI] [PubMed] [Google Scholar]
- 15.Dedmon MM, Christodoulou J, Wilson MR, Dobson CM. Heat shock protein 70 inhibits alpha-synuclein fibril formation via preferential binding to prefibrillar species. J Biol Chem. 2005;280:14733–14740. doi: 10.1074/jbc.M413024200. [DOI] [PubMed] [Google Scholar]
- 16.Knowles TP, et al. Kinetics and thermodynamics of amyloid formation from direct measurements of fluctuations in fibril mass. Proc Natl Acad Sci USA. 2007;104:10016–10021. doi: 10.1073/pnas.0610659104. [DOI] [PMC free article] [PubMed] [Google Scholar]
- 17.Perrett S, Jones GW. Insights into the mechanism of prion propagation. Curr Opin Struct Biol. 2008;18:52–59. doi: 10.1016/j.sbi.2007.12.005. [DOI] [PubMed] [Google Scholar]
- 18.Zhang H, Xu LQ, Perrett S. Studying the effects of chaperones on amyloid fibril formation. Methods. 2011;53:285–294. doi: 10.1016/j.ymeth.2010.11.009. [DOI] [PubMed] [Google Scholar]
- 19.Shammas SL, et al. Binding of the molecular chaperone αB-crystallin to Aβ amyloid fibrils inhibits fibril elongation. Biophys J. 2011;101:1681–1689. doi: 10.1016/j.bpj.2011.07.056. [DOI] [PMC free article] [PubMed] [Google Scholar]
- 20.Mannini B, et al. Molecular mechanisms used by chaperones to reduce the toxicity of aberrant protein oligomers. Proc Natl Acad Sci USA. 2012;109:12479–12484. doi: 10.1073/pnas.1117799109. [DOI] [PMC free article] [PubMed] [Google Scholar]
- 21.Månsson C, et al. DNAJB6 is a peptide-binding chaperone which can suppress amyloid fibrillation of polyglutamine peptides at substoichiometric molar ratios. Cell Stress Chaperones. 2014;19:227–239. doi: 10.1007/s12192-013-0448-5. [DOI] [PMC free article] [PubMed] [Google Scholar]
- 22.Arosio P, et al. Kinetic analysis reveals the diversity of microscopic mechanisms through which molecular chaperones suppress amyloid formation. Nat Commun. 2016;7:10948. doi: 10.1038/ncomms10948. [DOI] [PMC free article] [PubMed] [Google Scholar]
- 23.Mogk A, Bukau B. Molecular chaperones: Structure of a protein disaggregase. Curr Biol. 2004;14:R78–R80. doi: 10.1016/j.cub.2003.12.051. [DOI] [PubMed] [Google Scholar]
- 24.Doyle SM, Genest O, Wickner S. Protein rescue from aggregates by powerful molecular chaperone machines. Nat Rev Mol Cell Biol. 2013;14:617–629. doi: 10.1038/nrm3660. [DOI] [PubMed] [Google Scholar]
- 25.Wyatt AR, et al. Clusterin facilitates in vivo clearance of extracellular misfolded proteins. Cell Mol Life Sci. 2011;68:3919–3931. doi: 10.1007/s00018-011-0684-8. [DOI] [PMC free article] [PubMed] [Google Scholar]
- 26.Stoll S, Schweiger A. EasySpin, a comprehensive software package for spectral simulation and analysis in EPR. J Magn Reson. 2006;178:42–55. doi: 10.1016/j.jmr.2005.08.013. [DOI] [PubMed] [Google Scholar]
- 27.Nesmelov YE, Thomas DD. Protein structural dynamics revealed by site-directed spin labeling and multifrequency EPR. Biophys Rev. 2010;2:91–99. doi: 10.1007/s12551-010-0032-5. [DOI] [PMC free article] [PubMed] [Google Scholar]
- 28.Stan G, Brooks BR, Lorimer GH, Thirumalai D. Residues in substrate proteins that interact with GroEL in the capture process are buried in the native state. Proc Natl Acad Sci USA. 2006;103:4433–4438. doi: 10.1073/pnas.0600433103. [DOI] [PMC free article] [PubMed] [Google Scholar]
- 29.Takegoshi K, Nakamura S, Terao T. 13C-1H dipolar-driven 13C-13C recoupling without 13C rf irradiation in nuclear magnetic resonance of rotating solids. J Chem Phys. 2003;118:2325–2341. [Google Scholar]
- 30.Sackewitz M, et al. Structural and dynamical characterization of fibrils from a disease-associated alanine expansion domain using proteolysis and solid-state NMR spectroscopy. J Am Chem Soc. 2008;130:7172–7173. doi: 10.1021/ja800120s. [DOI] [PubMed] [Google Scholar]
- 31.Vranken WF, et al. The CCPN data model for NMR spectroscopy: Development of a software pipeline. Proteins. 2005;59:687–696. doi: 10.1002/prot.20449. [DOI] [PubMed] [Google Scholar]
- 32.Libich DS, Fawzi NL, Ying J, Clore GM. Probing the transient dark state of substrate binding to GroEL by relaxation-based solution NMR. Proc Natl Acad Sci USA. 2013;110:11361–11366. doi: 10.1073/pnas.1305715110. [DOI] [PMC free article] [PubMed] [Google Scholar]
- 33.Lührs T, et al. 3D structure of Alzheimer’s amyloid-β(1-42) fibrils. Proc Natl Acad Sci USA. 2005;102:17342–17347. doi: 10.1073/pnas.0506723102. [DOI] [PMC free article] [PubMed] [Google Scholar]
- 34.Paravastu AK, Leapman RD, Yau WM, Tycko R. Molecular structural basis for polymorphism in Alzheimer’s β-amyloid fibrils. Proc Natl Acad Sci USA. 2008;105:18349–18354. doi: 10.1073/pnas.0806270105. [DOI] [PMC free article] [PubMed] [Google Scholar]
- 35.Wälti MA, et al. Atomic-resolution structure of a disease-relevant Aβ(1-42) amyloid fibril. Proc Natl Acad Sci USA. 2016;113:E4976–E4984. doi: 10.1073/pnas.1600749113. [DOI] [PMC free article] [PubMed] [Google Scholar]
- 36.Ojha J, Masilamoni G, Dunlap D, Udoff RA, Cashikar AG. Sequestration of toxic oligomers by HspB1 as a cytoprotective mechanism. Mol Cell Biol. 2011;31:3146–3157. doi: 10.1128/MCB.01187-10. [DOI] [PMC free article] [PubMed] [Google Scholar]
- 37.Taguchi H, Tsukuda K, Motojima F, Koike-Takeshita A, Yoshida M. BeF(x) stops the chaperonin cycle of GroEL-GroES and generates a complex with double folding chambers. J Biol Chem. 2004;279:45737–45743. doi: 10.1074/jbc.M406795200. [DOI] [PubMed] [Google Scholar]
- 38.Daskalov A, et al. Contribution of specific residues of the β-solenoid fold to HET-s prion function, amyloid structure and stability. PLoS Pathog. 2014;10:e1004158. doi: 10.1371/journal.ppat.1004158. [DOI] [PMC free article] [PubMed] [Google Scholar]
- 39.Mastronarde DN. Automated electron microscope tomography using robust prediction of specimen movements. J Struct Biol. 2005;152:36–51. doi: 10.1016/j.jsb.2005.07.007. [DOI] [PubMed] [Google Scholar]
- 40.Kremer JR, Mastronarde DN, McIntosh JR. Computer visualization of three-dimensional image data using IMOD. J Struct Biol. 1996;116:71–76. doi: 10.1006/jsbi.1996.0013. [DOI] [PubMed] [Google Scholar]
- 41.Bartolucci C, Lamba D, Grazulis S, Manakova E, Heumann H. Crystal structure of wild-type chaperonin GroEL. J Mol Biol. 2005;354:940–951. doi: 10.1016/j.jmb.2005.09.096. [DOI] [PubMed] [Google Scholar]
- 42.Grason JP, Gresham JS, Widjaja L, Wehri SC, Lorimer GH. Setting the chaperonin timer: The effects of K+ and substrate protein on ATP hydrolysis. Proc Natl Acad Sci USA. 2008;105:17334–17338. doi: 10.1073/pnas.0807429105. [DOI] [PMC free article] [PubMed] [Google Scholar]
- 43.Todd MJ, Lorimer GH. Criteria for assessing the purity and quality of GroEL. Methods Enzymol. 1998;290:135–141. doi: 10.1016/s0076-6879(98)90012-x. [DOI] [PubMed] [Google Scholar]
- 44.Ritter C, et al. Correlation of structural elements and infectivity of the HET-s prion. Nature. 2005;435:844–848. doi: 10.1038/nature03793. [DOI] [PMC free article] [PubMed] [Google Scholar]
- 45.Chaudhry C, Horwich AL, Brunger AT, Adams PD. Exploring the structural dynamics of the E.coli chaperonin GroEL using translation-libration-screw crystallographic refinement of intermediate states. J Mol Biol. 2004;342:229–245. doi: 10.1016/j.jmb.2004.07.015. [DOI] [PubMed] [Google Scholar]
- 46.Fei X, Ye X, LaRonde NA, Lorimer GH. Formation and structures of GroEL:GroES2 chaperonin footballs, the protein-folding functional form. Proc Natl Acad Sci USA. 2014;111:12775–12780. doi: 10.1073/pnas.1412922111. [DOI] [PMC free article] [PubMed] [Google Scholar]


