

Abstract
Objective
Recent genome-wide association studies of coronary artery disease (CAD) have revealed 58 genome-wide significant and 148 suggestive genetic loci. However, the molecular mechanisms through which they contribute to CAD and the clinical implications of these findings remain largely unknown. We aim to retrieve gene subnetworks of the 206 CAD loci and identify and prioritize candidate regulators to better understand the biological mechanisms underlying the genetic associations.
Approach and Results
We devised a new integrative genomics approach that incorporated (1) candidate genes from the top CAD loci, (2) the complete genetic association results from the 1000 genomes-based CAD genome-wide association studies from the Coronary Artery Disease Genome Wide Replication and Meta-Analysis Plus the Coronary Artery Disease consortium, (3) tissue-specific gene regulatory networks that depict the potential relationship and interactions between genes, and (4) tissue-specific gene expression patterns between CAD patients and controls. The networks and top-ranked regulators according to these data-driven criteria were further queried against literature, experimental evidence, and drug information to evaluate their disease relevance and potential as drug targets. Our analysis uncovered several potential novel regulators of CAD such as LUM and STAT3, which possess properties suitable as drug targets. We also revealed molecular relations and potential mechanisms through which the top CAD loci operate. Furthermore, we found that multiple CAD-relevant biological processes such as extracellular matrix, inflammatory and immune pathways, complement and coagulation cascades, and lipid metabolism interact in the CAD networks.
Conclusions
Our data-driven integrative genomics framework unraveled tissue-specific relations among the candidate genes of the CAD genome-wide association studies loci and prioritized novel network regulatory genes orchestrating biological processes relevant to CAD.
Keywords: coronary artery disease, gene expression, gene regulatory networks, genomics, genome-wide association study
Coronary artery disease (CAD) is a major cause of morbidity and mortality for both men and women in the Western world. Several clinical risk factors have long been associated with CAD, including high blood pressure, cigarette smoking, elevated low-density lipoprotein cholesterol, and diabetes mellitus, and randomized clinical studies have consistently shown a 30% to 40% reduction in CAD-related deaths by modifying these factors.1–3 However, our ability to fully mitigate CAD remains limited because of the incomplete understanding of the molecular basis of CAD. CAD is highly heritable with genetic risk accounting for 40% to 60% of the susceptibility to CAD.4 Empowered by the genomic technologies, a total of ≈206 CAD susceptibility loci (58 genome-wide significant and 148 suggestive) have been identified by human genome-wide association studies (GWAS).5 The mechanisms of these loci/genes seem to be diverse. For example, genes involved in both lipid metabolism (APOB, ABCG5-ABCG8, PCSK9, SORT1, ABO, LDLR, APOE, and LPA) and blood pressure regulation (CYP17A1-NT5C2, SH2B3, GUCY1A3, FES, and ZC3HC1) are among the GWAS loci, providing molecular basis for the long-observed clinical importance of these intermediate clinical traits in CAD development.5 However, for the majority of the remaining significant loci, there is a lack of understanding of their functional relevance and molecular mechanisms involved. In addition, together the 206 genetic loci explain ≈25% of the heritability, leaving a large proportion of the genetic heritability to be further explored.6,7 These challenges make it difficult to translate the GWAS findings into clinical applications.
To address these challenges, various efforts have been made recently to decode CAD GWAS signals into pathways and gene networks through integrative systems biology approaches.8–11 The underlying concept emphasizes that instead of acting alone, disease genes interact through complex regulatory machinery that governs the overall genetic (and epigenetic) control of disease susceptibility.12,13 Genetic variants of both strong and subtle effects (ie, loci reaching genome-wide significance and those that are well below the significance cutoff) can perturb parts of the regulatory network, termed subnetworks. Moreover, disease genes do not play equal roles in disease development, that is, some important genes tend to regulate more CAD genes than others do in the regulatory networks, as demonstrated in recent studies of CAD8 and late-onset Alzheimer diseases.14 These studies have unraveled many novel molecular pathways and gene subnetworks in addition to confirming previously known mechanisms, testifying to the power of utilizing context-specific (eg, tissues, drug treatments, and diet changes) regulatory networks in conjunction with genetic signals to retrieve the perturbed subnetworks. Subsequently, the key regulators in the networks can be captured based on the network topology.8,9
Despite the progress, none of these previous studies has focused on the top 206 CAD loci to more closely investigate their tissue-specific network properties and whether they coordinate their actions to affect specific biological functions. Furthermore, the fact that a majority of these top CAD loci only exhibit moderate effects on CAD points to a role of these loci as disease-modifying genes, rather than strong disease-determining genes.6 From the point of view of clinical and therapeutic applications, it is perhaps more productive to identify potential central regulators that coordinate the actions of multiple genes affected by the top CAD loci. These central regulators, when perturbed, may elicit stronger effects on CAD, but can be missed by GWAS because of evolutionary constraints that eliminate common variants affecting the functions of the key regulators in the population.8,9,15
In this study, we device an integrative network approach that combines multiple types of CAD-related genomic data sets to examine the potential relationship and interactions between the candidate genes at these top CAD loci to better understand the molecular pathways involved in CAD pathogenesis, as well as to identify and prioritize key regulators in tissue-specific networks for CAD. By focusing on the top CAD candidate genes, we aim to (1) delineate the tissue-specific characteristics of CAD gene regulatory networks affected by the top loci, (2) highlight candidate key regulators for CAD, and (3) provide insights into the causal mechanisms of CAD loci/genes.
Materials and Methods
Materials and Methods are available in the online-only Data Supplement.
Results
Overview of the Analytic Pipeline
We designed and implemented an integrative genomics pipeline to pinpoint the gene networks of the top GWAS loci and potential regulators by integrating diverse genomic data sets and tools. The framework can be divided into 4 steps (Figure 1).
Figure 1.
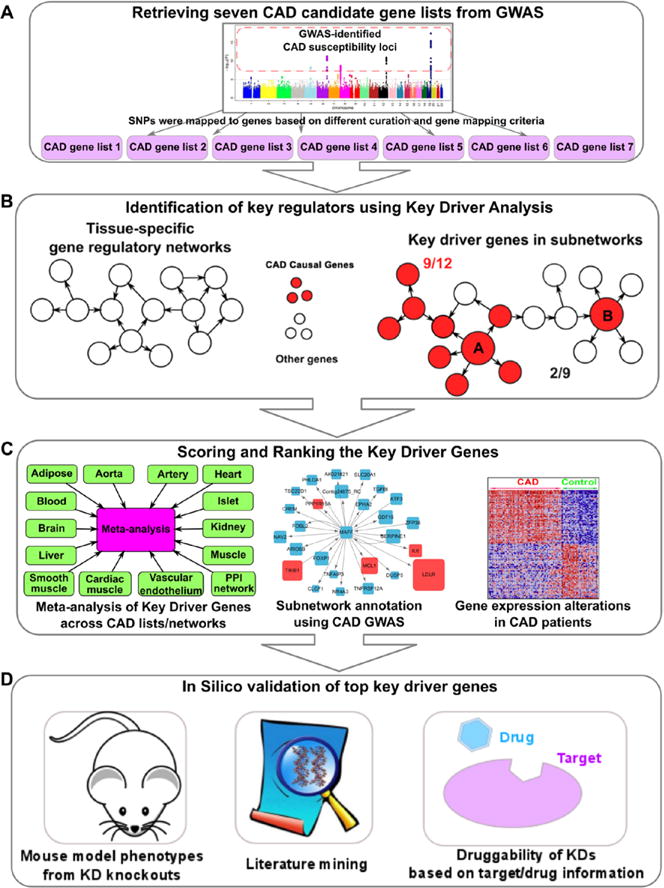
A framework for prioritizing coronary artery disease (CAD) genes using network-based approaches. The workflow contains 4 steps, including (A) retrieving CAD gene lists from genome-wide association studies (GWAS) and other functional studies, (B) key driver (KD) analysis, (C) scoring and ranking based on network consistency of KD analysis, GWAS gene annotation, and gene expression profiles between myocardial infarction and normal subjects, and (D) in silico validation.
First, we retrieve 7 CAD candidate gene lists from GWAS based on different curation and gene mapping criteria (Figure 1A; full list in Table I in the online-only Data Supplement). Comprehensive curation of CAD candidate genes is important because mapping disease-associated loci to candidate genes is not straightforward.16 The 7 gene lists include.
CAD GWAS Gene List (n=145)
We downloaded the NHGRI GWAS catalog (https://www.genome.gov/26525384) and extracted candidate GWAS genes for phenotypes relevant to CAD including coronary heart disease, myocardial infarction, and coronary artery calcification with association P<1e−5.
CAD+C4D Gene List (n=239)
The above CAD GWAS list based on GWAS catalog was supplemented with additional candidate genes identified through the Coronary Artery Disease Genome Wide Replication and Meta-Analysis Plus the Coronary Artery Disease (CARDIoGRAM-C4D) study,5 which was based on Metabochip data and therefore was not included in the GWAS catalog.
CAD GWAS No-Lipid Gene List (n=124)
Lipid metabolism genes were removed from the CAD GWAS gene list to prevent the lipid genes from overshadowing and diluting other novel mechanisms.17
CAD+C4D No-Lipid Gene List (n=149)
Similarly, lipid metabolism genes were removed from the CAD+C4D gene list to enable better exploration of novel mechanisms.
CAD+C4D Extend Gene List (n=559)
The above 4 CAD candidate lists were primarily based on chromosomal distance-based locus to gene mapping. As suggested by previous studies, disease loci may not affect their most adjacent genes but may function through long-range regulation of distant genes.16,18 To address this concern, we used an alternative locus-gene mapping that is based on empirical evidence provided by expression quantitative trait loci from CAD-relevant tissues, as described by Braenne et al.16 The expression quantitative trait loci studies included were retrieved from Genome-Wide Repository of Associations between single nucleotide polymorphisms and Phenotypes database,19 Stockholm Atherosclerosis Gene Expression (STAGE)20 study, a liver/adipose study,21 Cardiogenics consortium monocyte/macrophages study,22 RNA-sequencing study in blood,23,24 and aortic endothelial cells study.25
CAD 1000G Gene List (n=257)
The CAD+C4D list was supplemented with additional candidate genes from the recent 1000 genomes study.7
CAD 1000G Extend Gene List (n=880)
We applied the same expression quantitative trait loci–based mapping to the CAD 1000G supplemented loci to map candidate genes as described for the CAD+C4D extended list.
Second, we perform the key driver analysis (KDA)26–28 to identify potential network regulators, termed KDs of the CAD gene lists using 13 tissue-specific regulatory networks (adipose, aorta, artery, blood, brain, cardiac muscle, heart, islet, kidney, liver, skeletal muscle, smooth muscle, and vascular endothelium) and a protein–protein interaction network (Figure 1B; details of network construction in Supplemental Text in the online-only Data Supplement). We chose these tissues or network types because they are involved in CAD and related risk phenotypes. This step is essential for detecting the interactions and central orchestrators of the CAD genes.
Third, we evaluate the association strength between CAD and the predicted KDs as well as their direct partners in the gene subnetworks to confirm their relationship with CAD, based on 3 criteria: (1) the consistency of KDA performance for each KD across the 7 CAD gene lists and the 14 networks, (2) the CAD association strength of the KD subnetworks in CAD GWAS, and (3) tissue-specific gene expression pattern changes of the KD subnetworks between myocardial infarction and control subjects (Figure 1C). The KDs are scored and ranked based on these 3 data-driven criteria.
Finally, the associations between KDs and CAD are further validated using diverse bioinformatics databases and tools such as phenotypes from knockout mouse models, drug target databases, and literature mining (Figure 1D).
Identification of KD Genes in Tissue-Specific Networks
From the 98 sets of KDA (7 CAD lists × 14 networks), we detected a total of 287 KD genes at false discovery rate <0.05 (detailed KDs for each CAD gene set are listed in separate spreadsheets in Table II in the online-only Data Supplement), with 156 appearing in at least 2 KDA sets and 44 in at least 2 tissue-specific networks. Then, a meta-analysis, which considers both the consistency across the 98 sets of KDA analysis and the KDA statistics, was performed to derive meta P values for the KDs. This yielded 139 KDs with meta P<0.01(listed in the last spreadsheet in Table II in the online-only Data Supplement), among which 49 were captured by at least 3 networks and CAD gene lists and 22 were detected as multiple-tissue KDs (Table 1). Therefore, many of the KDs are less sensitive to the curation methods used to retrieve the top CAD GWAS candidate genes (ie, the 7 CAD gene lists) or the networks used in KDA.
Table 1.
Top Multitissue KD Genes in Gene Regulatory and Protein–Protein Interaction Networks Ranked by KD Analysis Meta P Value Across CAD Gene Lists and Networks
| KD | Ad | Ao | Ar | Bl | Br | CM | Ht | Is | Kd | Li | Mu | PP | SM | VE | Tissue Consist | List Consist | Meta P Values | KD P Values in 1000G CAD GWAS |
|---|---|---|---|---|---|---|---|---|---|---|---|---|---|---|---|---|---|---|
| DUSP6 | 0 | 2 | 2 | 0 | 0 | 3 | 0 | 0 | 0 | 0 | 0 | 0 | 6 | 2 | 5 | 15 | 1.35e−34 | 1.47e−03 |
| DUSP1 | 0 | 1 | 6 | 0 | 0 | 0 | 0 | 0 | 0 | 0 | 0 | 0 | 4 | 0 | 3 | 11 | 2.77e−26 | 2.07e−03 |
| KNG1 | 0 | 0 | 0 | 0 | 5 | 0 | 0 | 0 | 0 | 0 | 4 | 0 | 0 | 0 | 2 | 9 | 8.60e−15 | 2.65e−03 |
| F2 | 5 | 0 | 0 | 0 | 0 | 0 | 0 | 0 | 0 | 0 | 4 | 0 | 0 | 0 | 2 | 9 | 4.22e−13 | 2.62e−04 |
| APOA1 | 4 | 0 | 0 | 0 | 5 | 0 | 0 | 0 | 0 | 0 | 2 | 0 | 0 | 0 | 3 | 11 | 1.93e−09 | 5.60e−05 |
| HGD | 0 | 0 | 0 | 0 | 4 | 0 | 0 | 0 | 0 | 0 | 5 | 0 | 0 | 0 | 2 | 9 | 1.05e−08 | 4.15e−03 |
| GBP1 | 2 | 0 | 0 | 2 | 0 | 0 | 0 | 0 | 0 | 0 | 0 | 0 | 0 | 2 | 3 | 6 | 3.41e−08 | 6.76e−04 |
| GBP2 | 0 | 0 | 0 | 2 | 0 | 0 | 0 | 0 | 2 | 0 | 0 | 0 | 2 | 0 | 3 | 6 | 1.60e−07 | 6.76e−04 |
| ANXA1 | 0 | 0 | 3 | 0 | 0 | 0 | 0 | 0 | 0 | 0 | 0 | 0 | 1 | 0 | 2 | 4 | 9.70e−07 | 9.12e−03 |
| PLG | 4 | 0 | 0 | 0 | 0 | 0 | 0 | 0 | 0 | 1 | 0 | 0 | 0 | 0 | 2 | 5 | 3.13e−06 | 2.88e−34 |
| COL4A2 | 0 | 0 | 0 | 0 | 0 | 0 | 0 | 0 | 0 | 0 | 4 | 3 | 0 | 0 | 2 | 7 | 4.04e−06 | 1.83e−10 |
| MSN | 0 | 0 | 0 | 0 | 0 | 0 | 0 | 0 | 0 | 2 | 0 | 0 | 0 | 1 | 2 | 3 | 7.30e−06 | 1.00e+00 |
| ANXA2 | 0 | 0 | 0 | 0 | 0 | 2 | 0 | 0 | 0 | 0 | 0 | 2 | 0 | 0 | 2 | 4 | 1.47e−05 | 3.43e−03 |
| CXCL12 | 1 | 0 | 0 | 0 | 0 | 1 | 0 | 0 | 0 | 3 | 1 | 0 | 0 | 0 | 4 | 6 | 2.28e−05 | 2.95e−10 |
| ABCG5 | 1 | 0 | 0 | 0 | 0 | 0 | 0 | 0 | 0 | 2 | 0 | 0 | 0 | 0 | 2 | 3 | 3.70e−05 | 1.35e−07 |
| APOB | 2 | 0 | 0 | 0 | 0 | 0 | 0 | 0 | 0 | 0 | 0 | 3 | 0 | 0 | 2 | 5 | 6.48e−05 | 3.09e−08 |
| ADM | 0 | 0 | 1 | 0 | 0 | 0 | 0 | 0 | 0 | 0 | 0 | 0 | 1 | 0 | 2 | 2 | 7.95e−05 | 2.77e−04 |
| RDH16 | 0 | 0 | 0 | 0 | 2 | 0 | 0 | 0 | 0 | 0 | 2 | 0 | 0 | 0 | 2 | 4 | 0.000115 | 3.17e−03 |
| PAPSS2 | 0 | 0 | 0 | 0 | 0 | 1 | 0 | 0 | 0 | 0 | 0 | 0 | 2 | 0 | 2 | 3 | 0.000136 | 4.68e−03 |
| APOA5 | 0 | 0 | 0 | 0 | 1 | 0 | 0 | 0 | 0 | 2 | 0 | 0 | 0 | 0 | 2 | 3 | 0.0005 | 5.60e−05 |
| FN1 | 0 | 0 | 0 | 0 | 0 | 0 | 0 | 0 | 1 | 0 | 0 | 3 | 0 | 0 | 2 | 4 | 0.000759 | 5.14e−07 |
| IRF7 | 1 | 0 | 0 | 0 | 0 | 0 | 0 | 0 | 0 | 0 | 0 | 0 | 0 | 1 | 2 | 2 | 0.000912 | 8.68e−03 |
The numbers in each cell represent how many of the 7 CAD gene lists yielded the KD using the specific tissue network. Ad indicates adipose; Ao, aorta; Ar, artery; Bl, blood; Br, brain; CAD, coronary artery disease; CM, cardiac muscle; GWAS, genome-wide association studies; Ht, heart; Is, islet; Kd, kidney; KD, key driver; Li, liver; Mu, muscle; PP, protein–protein interaction; SM, smooth muscle; and VE, vascular endothelium networks.
We retrieved literature-based information about the KDs to assess their CAD relevance. Among the 139 KDs at meta P<0.01, 29 are within the 7 CAD candidate gene lists. These include APOA1, GBP1, GBP2, PLG, VEGFA, COL4A2, KCNK13, CXCL12, ABCG5, APOC2, APOB, ADM, SLIT3, PHACTR1, OSM, LARGE, IRF1, APOA5, LDLR, KLF6, APOC4, FN1, HEMGN, APOC3, ABCG8, NME6, SHC1, THADA, and PTPN11. There are 12 KDs satisfying GWAS significance of P<5.0e−08, including PHACTR1, APOA1, APOA5, APOC3, LDLR, COL4A2, PTPN11, PLG, APOC2, APOC4, APOB, and CXCL12 in CARDIoGRAM or CAD 1000 genomes GWAS. Notably, many of these KDs are lipid genes, confirming the importance of lipid metabolism in CAD. We found that 61 of the 139 KDs, when genetically perturbed in knockout mouse models, showed phenotypes directly related to CAD or CAD risk phenotypes such as lipid level changes, hypertension, and obesity based on the Mouse Genome Informatics database (http://www.informatics.jax.org/), representing a significant enrichment for genes linked to CAD phenotypes (Fisher exact test P=6.31e−16, fold change=5.09). In addition, 23 of the 139 KDs were included in the CADgene V2.0 database,29 which contains 583 CAD-related genes and detailed CAD association information from ≈5000 publications (Fisher exact test, P=44.36e–13; fold enrichment, 7.67). These lines of literature-based evidence support the relevance of the KDs to CAD.
Data-Driven Assessment of the Relevance of KDs and KD Subnetworks to CAD
To more objectively evaluate the CAD relevance of the KDs and their subnetworks, we used multiple data-driven approaches. The KD subnetworks are relatively independent (Figure I in the online-only Data Supplement). First, we utilized the 1000 Genomes–based CAD GWAS to assess the overall enrichment of the KD subnetwork genes for stronger CAD association, as compared to subnetworks derived from random genes or those derived from the CAD top genes in our initial CAD lists (detailed in Materials and Methods in the online-only Data Supplement). Our results indicate that KD subnetworks tend to include stronger CAD GWAS signals than the subnetworks of random genes (Table III in the online-only Data Supplement) or those of the CAD top genes (Table 2; Table III in the online-only Data Supplement), supporting that KDs and their subnetworks may play more important roles in CAD development than the candidate genes of the top CAD loci. For example, 26.7% (12 of 45) of the member genes in the brain subnetwork of LUM had CAD GWAS P<0.001 in 1000 genome-based CAD GWAS. In contrast, the average percentages of genes showing CAD association at the same GWAS P value cutoff were much lower in the subnetworks of randomly selected genes (1.9%). The GWAS P value distribution of the LUM subnetwork genes was significantly different from random networks (P<1.0e−16 in 1-sided 2-sample Kolmogorov–Smirnov test) and those of the CAD top GWAS genes (P=1.14e−3). Similarly, for another KD example KNG1, 44.8% of the members in the KNG1 subnet-work in muscle had CAD GWAS P<0.001, in contrast to the much lower percentages for random genes (1.9%; P<1.0e−16 by Kolmogorov–Smirnov test) and CAD top GWAS genes (23.9%; P=3.4e−3). These results support that our data-driven systems biology approach that focuses on the aggregate behavior and properties of CAD genes in gene networks derives potentially stronger candidate genes than standard, individual locus-based methods.
Table 2.
Top KDs Based on CAD GWAS Enrichment in the KD Subnetworks
| KD | Subnetwork Size | No. of Genes With CAD 1000 Genomes GWAS P<0.001 in KD Subnetworks | Genes With CAD 1000 Genomes GWAS P<0.001 in KD Subnetworks | P Values Compared With GWAS Genes |
|---|---|---|---|---|
| SLIT3 | 28 | 11 | APOE, SLIT3, EPB41L2, NID1, FN1, TGFBR3, DOCK1, ADM, SCARA5, PROCR, THBS3 | <0.00114 |
| AZGP1 | 23 | 8 | PLG, SLC22A1, UPB1, APOA5, AZGP1, ABCG5, CYP2A13, FBP1 | <0.00114 |
| APOF | 45 | 17 | PLG, APOC4, ITIH3, GLS2, APOB, APOA5, ARG1, APOF, AGXT, LIPC, ITIH4, MAT1A, PAH, PON1, CFI, APOC2, CYP2A13 | <0.00114 |
| LDLR | 11 | 7 | APOE, APOB, LRPAP1, LDLR, PCSK9, DAB1, AP1M2 | <0.00114 |
| ACCN1 | 13 | 4 | LARGE, ACCN1, ITGA2, CYP17A1 | <0.00114 |
| RIF1 | 11 | 2 | MALAT1, NBEAL1 | <0.00114 |
| STAT3 | 102 | 35 | CDKN1A, PDGFRA, JUN, FGFR3, FLT1, CXCR4, RPS6KA5, BRCA1, HDAC3, STMN1, NLK, STAT5B, STAT3, ZNF467, MAP3K7, MTOR, NMI, RAC1, PML, KAT5, EIF2AK2, PRKCD, PTPN11, JAK3, FOXM1, PDGFRB, HNF1A, SUMO4, FES, IL2RA, IL6R, IGF1R, RELA, FER, ZNF148 | <0.00114 |
| OAS2 | 12 | 4 | IFIT1, APOA4, OAS1, MMP12 | <0.00114 |
| F2 | Adipose (49); muscle (47) | Adipose (12); muscle (19) | Adipose (PLG, SERPIND1, SEC14L2, APOC3, APOA5, APOA4, APOF, LIPC, PAH, AKR1C1, APOA1, F2); Muscle (PLG, SERPIND1, HPX, APOC3, ATP2A2, KLKB1, UPB1, TNNT1, APOA5, MYL2, ARG1, ASGR1, GNMT, MAT1A, PAH, AKR1C1, CFI, APOA1, F2) | Adipose (0.0182); muscle (0.00114) |
| HGD | Brain (40); muscle (48) | Brain (8); muscle (12) | Brain (PLG, APOC4, HPX, APOA5, APOF, PAH, AKR1D1, APOA1); Muscle (PLG, APOC4, CA5A, UROC1, APOC3, UPB1, APOB, APOA5, AGXT, MAT1A, CYP2A13, FBP1) | Brain (0.00114); muscle (0.0136) |
| LUM | 45 | 12 | CXCL12, COL3A1, TGFBR3, BMP6, FIBIN, TFPI, GBP1, ANXA4, SMOC2, SPOCK3, PCOLCE, ZFPM2 | 0.00114 |
| MTMR11 | 80 | 25 | DUSP8, ARHGAP22, ARL2BP, VCL, NRG1, SORBS2, TAGLN2, NID1, COL3A1, COL4A1, SMOX, SH2B3, ABCG5, MYO9B, FST, ARF5, HELLS, NUDT18, WFDC3, PDGFRB, SCD, SLC20A1, ST6GALNAC4, SGSM1, OTUD7B | 0.00114 |
| COL1A1 | 73 | 23 | COL4A2, NCAM1, FBLN2, COL6A3, GINS2, TMSB10, ITGBL1, COL3A1, GAS6, COL4A1, LOXL4, WT1, SERPINH1, IGFBP2, CD163, PDGFRB, EFEMP2, MMP12, CCDC3, TREM2, EGR2, PCOLCE, LOXL1 | 0.00114 |
| CXCL12 | Adipose (47); cardiac muscle (170); liver (30); muscle (36) | Adipose (10); cardiac muscle (54); liver (9); muscle (11) | Adipose (PODXL, MMP3, CXCL12, TRERF1, KDR, SLC6A6, MRVI1, KLK10, SLC22A3, RAB19); Cardiac_muscle (CAV2, PYGL, HLA-DRA, COL4A2, ZCCHC24, CTGF, CXCL12, PPAP2B, ST5, GRK5, AXL, LRP1, NID1, ZCCHC14, PECAM1, SNED1, FGFR1, EPS8, WIPF1, VPS13D, PTRF, HLA-B, CRISPLD2, TMEM176A, NR2F2, COL4A1, LIPA, ZHX3, NPR1, CXCL1, SLC24A3, SFRP2, RHOQ, LPAR1, MYLK, RAB13, SGK1, CD302, FTO, PRCP, USP25, TRIB2, ZBTB20, PSD3, TIMP3, WIPI1, PCOLCE, LTBP1, LAMB2, GUCY1A3, LAMC1, ANGPT1, NFIB, KLC1); Liver (PLEKHA1, CXCL12, COL6A3, SLC2A1, RERG, SLC6A6, CUX2, HSD17B12, SFTPB); Muscle (COL4A2, AHR, PODXL, CXCL12, S100Z, SCUBE3, BRPF1, RNF213, ARHGDIB, CNIH3, OR4X2) | Adipose (0.0534); cardiac muscle (0.0182); liver (0.00341); muscle (0.00114) |
| CFB | 20 | 10 | PLG, APOC1, C3, APOA5, C4B, APOF, HP, CFI, APOC2, APOA1 | 0.00114 |
| APOC2 | 27 | 10 | APOC1, SLC22A1, APOC3, APOA5, AGT, CYP4F12, ARG1, ABCG5, APOF, APOC2 | 0.00114 |
| RDH16 | Brain (43); muscle (36) | Brain (10); muscle (11) | Brain (APOC4, SLC22A1, APOC3, KLKB1, MBL1P, APOA5, APOF, PON1, AKR1C1, CFI); Muscle (PLG, SEC14L2, APOC3, HAAO, APOB, ABCG5, C8G, APOA4, GNMT, CYP2A13, F2) | Brain (0.0273); muscle (0.00114) |
| NGRN | 32 | 10 | HDDC3, TRIM68, FURIN, KLHL25, RCCD1, SPC24, SLC22A3, MESDC1, APOC2, AKAP13 | 0.00114 |
| FN1 | Kidney (16); PPI (75) | Kidney (3); PPI (21) | Kidney (ERBB4, ADAM12, FN1); PPI (COL4A2, FBLN2, COL4A3, ITGB6, CXCL12, FSTL3, MMP9, GALNT6, FN1, COL7A1, COL4A1, SDC2, FST, LPA, FASLG, COL4A4, SMAD9, MEP1B, LTBP1, IGFBP5, FBLN1) | Kidney (0.00114); PPI (0.0477) |
| NCOR2 | 12 | 7 | NCOR2, ACAD10, UBC, AACS, CUX2, PTPN11, VPS33A | 0.00114 |
The detailed information for all the KD genes is available in Table III in the online-only Data Supplement. CAD indicates coronary artery disease; GWAS, genome-wide association studies; KD, key driver; and PPI, protein–protein interaction.
Second, we hypothesize that if the KD subnetworks are important for CAD, the expression levels of the genes in the subnetworks are more likely to be perturbed in patients with CAD. To this end, we analyzed the expression profile alterations of the KD subnetworks between non-CAD subjects and patients with acute myocardial Infarction, in 10 CAD-relevant cell types or tissues, namely, endothelial cells, CD34+ stem cells, CD4+ T cells, resting CD14+ monocytes, stimulated monocytes, peripheral blood mononuclear cells, whole blood, epicardial adipose tissue and subcutaneous adipose tissue, and macrophages. Among the 170 KD subnetworks of the 139 KDs (some KDs have subnetworks from multiple tissues), 58 and 81 showed significant up- or downregulation patterns in CAD versus controls in at least 1 cell type at false discovery rate <1% and false discovery rate <5%, respectively (Table IV in the online-only Data Supplement). Furthermore, 12 KD subnetworks were detected to be significantly perturbed in >2 cell types at false discovery rate <5%. For example, the LUM subnetwork was upregulated in CAD endothelial cells (P<1.0e−16; normalized enrichment score = 1.95), whereas down-regulated in resting CD14+ monocytes (P<1.0e−16; normalized enrichment score = −1.68) and T cells (P=1.92e−3; normalized enrichment score = −1.18), with a meta P value of 1.38e−13 (Figure 2).
Figure 2.
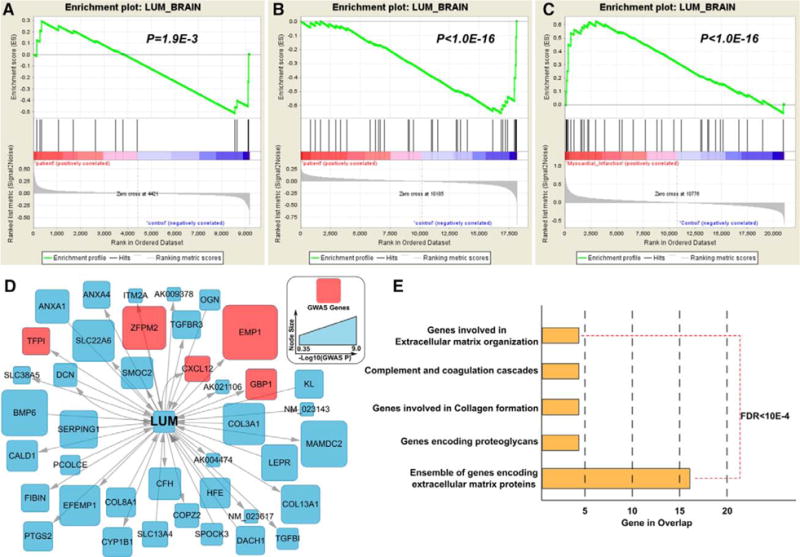
Gene expression perturbations of LUM subnetwork in brain tissue in myocardial infarction (MI) patients. The gene set enrichment analysis revealed significant gene expression perturbation in the LUM subnetwork in T cells (A), resting monocytes (B), and endothelial cells (C) in MI cases. Plots for the 7 nonsignificant cell or tissue types are not shown, but results are available in Table IV in the online-only Data Supplement. The red nodes in the LUM subnetwork (D) are coronary artery disease (CAD) genes from CAD extend list. Pathway analysis for the LUM subnetwork was performed using the Database for Annotation, Visualization and Integrated Discovery (DAVID), with all the pathways satisfying false discovery rate (FDR) <10e−4 (E).
Scoring and Ranking of the KDs
We assigned a summary score to each KD according to the scores from measurements of KDA strength and consistency, subnetwork enrichment for 1000 genome-based CAD GWAS signals, and gene expression alterations between CAD and controls (top 20 genes are shown in Table 3). Based on the summary scores, the 10 top-ranked KDs are LUM, COL1A1, DUSP6, HGD, MSN, CXCL12, DUSP1, GBP2, MTMR11, and CCL18. It is reassuring that the ranking of most of these genes is consistent across the 3 scoring methods. For example, LUM, COL1A1, HGD, MSN, CXCL12, and GBP2 are all within the top 40% in each of the 3 scoring schemes. Notably, none of the top 20 KDs was lipid-related genes although many lipid genes were among the 139 KDs.
Table 3.
Top 20 KDs Based on an Overall Ranking Score Derived From 3 Data-Driven Criteria
| KD | Meta P Value for KDA | P Value for GWAS Enrichment | Meta P Value for Differential Expression | Score 1 (KDA Strength and Consistency) | Score 2 (Subnetwork Enrichment for CARDIoGRAM-C4D GWAS Signals) | Score 3 (Gene Expression Alterations Between CAD and Controls) | Summary Score |
|---|---|---|---|---|---|---|---|
| LUM | 5.74e−08 | 1.14e−03 | 1.38e−13 | 0.935 | 0.923 | 0.978 | 2.836 |
| COL1A1 | 4.13e−06 | 1.14e−03 | 1.55e−05 | 0.848 | 0.923 | 0.819 | 2.590 |
| DUSP6 | 1.35e−34 | 6.82e−03 | 1.00e−16 | 1.000 | 0.538 | 1.000 | 2.538 |
| HGD | 1.05e−08 | 1.14e−03 | 3.76e−02 | 0.957 | 0.923 | 0.616 | 2.496 |
| MSN | 7.30e−06 | 4.55e−03 | 4.44e−16 | 0.826 | 0.619 | 0.993 | 2.438 |
| CXCL12 | 2.28e−05 | 1.14e−03 | 1.62e−02 | 0.797 | 0.923 | 0.652 | 2.372 |
| DUSP1 | 2.77e−26 | 1.02e−02 | 2.46e−08 | 0.993 | 0.427 | 0.928 | 2.348 |
| GBP2 | 1.60e−07 | 3.41e−03 | 9.42e−04 | 0.920 | 0.698 | 0.725 | 2.343 |
| MTMR11 | 8.93e−07 | 1.14e−03 | 3.61e−01 | 0.913 | 0.923 | 0.486 | 2.322 |
| CCL18 | 1.39e−06 | 9.09e−03 | 8.61e−11 | 0.877 | 0.474 | 0.949 | 2.300 |
| SLIT3 | 2.04e−04 | 1.00e−03 | 2.44e−01 | 0.717 | 1.000 | 0.507 | 2.225 |
| GBP1 | 3.41e−08 | 1.82e−02 | 1.05e−11 | 0.942 | 0.226 | 0.964 | 2.132 |
| F2 | 4.22e−13 | 1.14e−03 | 9.53e−01 | 0.971 | 0.923 | 0.232 | 2.126 |
| COL4A2 | 4.04e−06 | 5.68e−03 | 1.94e−03 | 0.855 | 0.582 | 0.688 | 2.126 |
| LOXL2 | 1.68e−04 | 3.41e−03 | 2.96e−02 | 0.725 | 0.698 | 0.638 | 2.061 |
| CXCL10 | 2.74e−04 | 1.02e−02 | 3.37e−12 | 0.659 | 0.427 | 0.971 | 2.058 |
| ANXA3 | 3.06e−03 | 1.14e−03 | 7.02e−07 | 0.246 | 0.923 | 0.877 | 2.046 |
| SLC2A3 | 2.74e−04 | 7.95e−03 | 4.76e−07 | 0.652 | 0.500 | 0.884 | 2.036 |
| SHC1 | 4.26e−03 | 1.14e−03 | 1.32e−09 | 0.167 | 0.923 | 0.942 | 2.032 |
| STAT3 | 3.50e−03 | 1.00e−03 | 3.27e−05 | 0.210 | 1.000 | 0.812 | 2.022 |
CAD indicates coronary artery disease; CARDIoGRAM-C4D, Coronary Artery Disease Genome Wide Replication and Meta-Analysis Plus the Coronary Artery Disease Consortium; KDA, key driver analysis; and GWAS, genome-wide association studies.
In Silico Validation of the Top KD Genes
We conducted comprehensive bioinformatics mining of the 20 top-ranked KDs using various databases and tools. As summarized in Table 4, 8 of the top 20 genes have been linked to CAD or risk factors (eg, hypertension and diabetes) using at least one of the literature mining tools including PolySearch (http://www.wishart.biology.ualberta.ca/polysearch/), COREMINE (http://www.coremine.com/medical/), and Linguamatics (http://www.linguamatics.com/). F2, SHC1, and CXCL12 have also been considered as CAD targets in drug development. The other genes including LUM, LOXL2, ANXA3, SLC2A3, MSN, GBP2, CCL18, SLIT3, HGD, and STAT3 represent novel CAD genes uncovered from a data-driven approach, with LUM, LOXL2, ANXA3, SLC2A3, and STAT3 suggested as potentially promising druggable targets based on drug databases DrugBank and Pharmaprojects as well as literature30,31 (detailed in Materials and Methods in the online-only Data Supplement).
Table 4.
In Silico Validation of the Top 20 Key Driver Genes Using Text-Mining and Drug Information
| KD | PolySearch (Z Score >0.5) | COREMINE (Significance <10e−4) | Top Associated Diseases in Linguamatics (PubMed >5)* | Drug Development† | Druggability‡ |
|---|---|---|---|---|---|
| LUM | No | No | Melanoma, myopia, breast neoplasms | N/A | Yes |
| COL1A1 | No | Yes | Osteogenesis imperfecta, otosclerosis, osteoporosis | Cancer, solid, unspecified; macular degeneration, age; scleroderma | Yes |
| DUSP6 | No | No | Malignant neoplasm pancreas, carcinogenesis, obesity | N/A | N/A |
| HGD | No | No | Alkaptonuria, metabolic diseases, Barrett esophagus | N/A | N/A |
| MSN | No | No | Neoplasm metastasis, pseudohermaphroditism female | N/A | N/A |
| CXCL12 | Yes | Yes | Diabetes mellitus, ischemia, myocardial infarction | Infection, HIV/AIDS; cancer, unspecified; infarction, myocardial | Yes |
| DUSP1 | No | No | Malignant neoplasm, diabetes mellitus | N/A | N/A |
| GBP2 | No | No | Breast neoplasms, neoplasm metastasis, vesicular stomatitis | N/A | N/A |
| MTMR11 | No | No | Obesity, prostatic neoplasms, atherosclerosis | N/A | N/A |
| CCL18 | No | No | Breast carcinoma | N/A | N/A |
| SLIT3 | No | No | Breast neoplasms, rheumatoid, brain ischemia | N/A | N/A |
| GBP1 | No | No | Inflammatory bowel diseases, vascular diseases | Anticancer, other; Gene therapy | Yes |
| F2 | Yes | Yes | Thrombosis, myocardial infarction, stroke | Thrombosis; cardiovascular disease, unspecified; atherosclerosis | Yes |
| COL4A2 | No | Yes | Anoxia, cerebral hemorrhage, edema | N/A | N/A |
| LOXL2 | No | No | Tumor progression | Anticancer, other; hepatoprotective; respiratory; vulnerary | Yes |
| CXCL10 | No | Yes | Communicable diseases, infection, inflammation | Traumatic brain injury; Crohn’s disease; arthritis, rheumatoid | Yes |
| ANXA3 | No | No | Neoplasm metastasis, ovarian neoplasms, prostatic neoplasms | N/A | Yes |
| SLC2A3 | No | No | Carcinoma, squamous cell; lipidoses | N/A | Yes |
| SHC1 | Yes | No | Breast neoplasms, carcinogenesis, diabetes mellitus | Neurological disease, unspecified; cardiovascular disease, unspecified | N/A |
| STAT3 | No | No | Breast neoplasms, carcinogenesis, inflammation | Inflammatory disease, unspecified; cancer, unspecified; Alzheimer disease | Yes |
N/A indicates not applicable.
The key driver genes were searched against all the disease PubMed databases using Linguamatics.
The drug target information was collected from DrugBank and Pharmaprojects databases. The listed diseases were the most targeted ones in the drug development.
Biological Pathways and Networks of the Top KDs
We conducted pathway-enrichment analysis for the CAD subnetworks of the top 20 KDs using pathways curated in MSigDB to explore the potential biological mechanisms (details in Materials and Methods in the online-only Data Supplement). The top over-represented pathways for the sub-networks of the top KDs are shown in Table 5 and those for all the KD subnetworks are in Table V in the online-only Data Supplement. We found that the subnetworks of the top KDs are enriched in cardiovascular processes, including immune and inflammatory responses, coagulation, cell activation, and lipid metabolism (all Bonferroni-corrected P<0.01 in Fisher exact test), consistent with findings from another recent integrative genomic study that focused on the overall CAD GWAS instead of the top loci.8 Notably, the subnetworks of 8 KDs, including LUM, COL1A1, DUSP1, SLIT3, COL4A2, ANXA3, and SLC2A3, were enriched for extracellular matrix (ECM) genes. ECM has been highlighted in recent integrative studies of both CVD and type 2 diabetes mellitus.9,32
Table 5.
Functional Enrichment of Subnetworks of Top 20 KDs
| KD | Subnetwork Sources | Subnetwork Size | Over-Represented Pathway Categories |
|---|---|---|---|
| LUM | Brain | 45 | ECM; proteoglycans |
| COL1A1 | Liver | 73 | ECM; collagen formation |
| DUSP6 | Aorta | 253 | FRA pathway |
| DUSP6 | Artery | 50 | IL-6, IL-7 pathway; syndecan 4 pathway |
| DUSP6 | Cardiac muscle | 108 | AP1 pathway; IL-6, IL-7 pathway |
| DUSP6 | Smooth muscle | 17 | MAPK targets nuclear events mediated by map kinases; ERBB1 downstream pathway |
| DUSP6 | Vascular endothelium | 122 | IL-6, IL-7 pathway |
| HGD | Brain | 40 | PPAR signaling pathway; synthesis of bile acids and bile salts via 7alpha hydroxycholesterol |
| HGD | Muscle | 48 | Complement and coagulation cascades |
| MSN | Liver | 56 | Fcγ R-mediated; CXCR4 pathway |
| MSN | Vascular endothelium | 105 | Focal adhesion; integrin1 pathway |
| CXCL12 | Adipose | 47 | Adenylate cyclase activating and inhibitory pathway |
| CXCL12 | Liver | 30 | Intestinal immune network for IGA production; amino acid and oligopeptide SLC transporters |
| DUSP1 | Aorta | 179 | ECM |
| DUSP1 | Artery | 71 | Integrin1 pathway |
| DUSP1 | Smooth muscle | 63 | HIF1 pathway; FRA pathway |
| GBP2 | Blood | 20 | Interferon signaling |
| GBP2 | Kidney | 12 | Interferon signaling |
| MTMR11 | Liver | 80 | Integrin3 pathway |
| CCL18 | Aorta | 214 | Immune system |
| SLIT3 | Muscle | 28 | ECM |
| GBP1 | Adipose | 25 | Interferon signaling |
| GBP1 | Blood | 18 | Interferon signaling |
| GBP1 | Vascular endothelium | 92 | Interferon signaling |
| F2 | Adipose | 49 | Complement and coagulation cascades; AMI pathway |
| F2 | Muscle | 47 | Complement and coagulation cascades; intrinsic pathway |
| COL4A2 | Muscle | 28 | Collagens |
| COL4A2 | PPI | 19 | ECM; platelet amyloid precursor protein pathway |
| LOXL2 | Liver | 28 | Collagen formation; NCAM1 interactions |
| CXCL10 | Liver | 46 | Chemokine signaling pathway |
| ANXA3 | Liver | 49 | Matrisome associated; ECM regulators |
| SLC2A3 | Aorta | 190 | ECM; P53 downstream pathway |
| SHC1 | PPI | 118 | ERBB signaling pathway; focal adhesion |
| STAT3 | PPI | 102 | JAK-STAT signaling pathway; pathways in cancer |
Fisher exact test was performed for the enrichment of the KD subnetworks in MSigDB canonical pathway database. Only the top 2 functional terms are shown based on the P values with Bonferroni corrections. All the pathways shown satisfy Bonferroni-corrected P<0.01. ECM indicates extracellular matrix; KD, key driver; PPAR, peroxisome proliferator-activated receptors; and PPI, protein–protein interaction.
We further explored the potential relationships between the top KDs and the CAD GWAS genes in gene regulatory networks. As shown in Figure 3, the top KDs and their sub-networks are closely connected, forming a large network linking multiple processes including complement and coagulation cascades, lipid metabolism, ECM, interferon signaling, focal adhesion, and JAK–STAT signaling. Importantly, the ECM genes constitute the center of the network and connect with the other biological processes through tissue-specific interactions. In addition, although some KDs such as COL4A2, CXCL12, SHC1, GBP2, GBP1, and SLIT3 are also top CAD GWAS genes, the majority of the CAD GWAS genes are not KDs but peripheral nodes interacting with one another through KDs in the network. This finding is consistent with our previous observations on the relationship between KDs and GWAS genes.8,9 Furthermore, the KDs also bring together many additional CAD candidate genes curated in the CADgene database, which are not necessarily among the top CAD GWAS genes we have focused on but nevertheless provide additional support for the relevance of the KD subnetworks to CAD.
Figure 3.
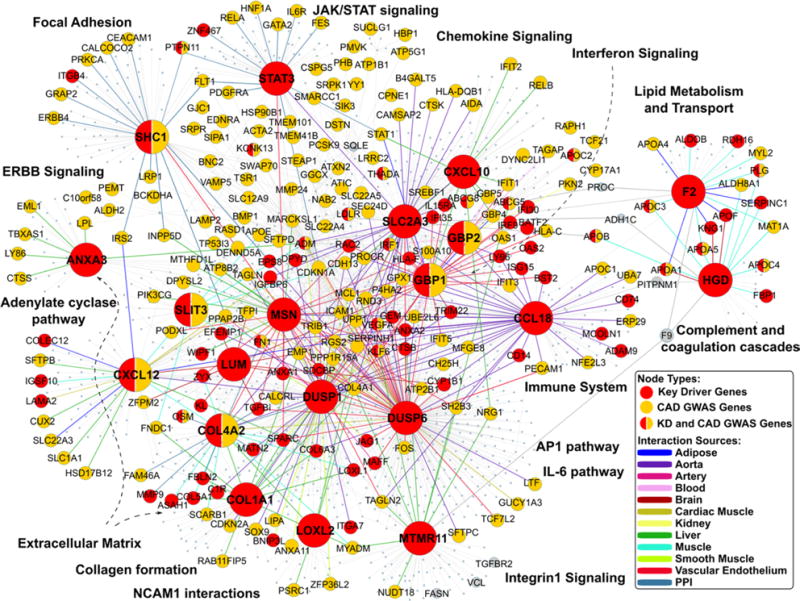
Top key driver (KD) subnetworks in tissue-specific gene regulatory and protein–protein interaction (PPI) networks. The largest nodes are the top 20 KDs. The nodes highlighted in red are KDs, whereas the yellow nodes are the coronary artery disease (CAD) genome-wide association studie (GWAS) genes. KDs that are also CAD GWAS genes are labeled half red and half yellow. The edge colors between genes denote the tissue or network sources of gene–gene interactions. JAK-STAT indicates Janus kinase-signal transducers and activators of transcription.
The convergence of our data-driven ranking and literature-based evidence supports the robustness of the top KDs, pathways, and networks revealed from our study. The data-driven summary scores provide an objective means to prioritize CAD genes for future studies, whereas the literature information can be used in flexible ways to further prioritize genes for different purposes. For instance, the data-driven score highlights LUM as the top-ranked CAD KD. In conjunction with information that it (1) has not been previously reported for CAD, (2) is druggable, (3) is a part of the ECM process that is supported by multiple KDs and also has known connection to CAD, and (4) is a part of a CAD subnetwork connecting with other CAD-relevant pathways, the potential novel role of Lum in CAD warrants further examination. If literature support for CAD involvement is considered important in prioritization, KDs CXCL12 and F2 can be ranked at the top because (1) extensive literature supports their connection to CAD and (2) they are known CAD drug target.
Discussion
The recent explosion in GWAS studies has contributed significantly to the identification of disease-associated genetic loci. However, the improved efficiency and accuracy in GWAS have not been translated into better biological insights and more effective therapeutic targets. As a result, incorporating other sources of evidence (such as gene regulation information and literature mining) is necessary to narrow down the candidate search space.16,33 As summarized recently,33 candidate disease genes can be prioritized through various computational methods, many of which carry the bias toward better characterized known genes for a given disease. In this study, we applied a data-driven approach by utilizing diverse tissue-specific regulatory networks and protein–protein interaction networks, which do not solely rely on previous knowledge about gene and protein functions. We found gene subnetworks that are concentrated with top CAD GWAS genes and identified potential key regulators or KDs of the CAD networks. We further ranked the KDs based on additional layers of data-rich analyses to provide high-confidence candidate genes for CAD. Our analyses not only detected well-implicated CAD disease genes such as lipid genes, COL4A2, and CXCL1234–36 but also unraveled novel key regulators for CAD such as LUM, HGD, F2, ANXA3, and STAT3.
Among the novel KDs, LUM is ranked on the top. This gene has been previously associated with posterior amorphous corneal dystrophy and high myopia,37 and there is little prior evidence for the link between CAD and LUM. LUM encodes lumican and belongs to a small leucine-rich proteoglycan protein family. SLRPs include lumican, decorin, biglycan, fibromodulin, keratocan, epiphycan, and osteoglycin. These proteins bind collagen fibrils and the highly charged hydrophilic glycosaminoglycans to regulate interfibrillar spacing.38 We speculate that LUM might regulate the downstream collagen genes that are important for CAD development. This notion is supported by the literature evidence on the role of LUM in collagen fibrillogenesis in CAD39,40 and the enrichment of collagen genes such as COL3A1 and COL8A1 in the LUM subnetworks found in our analysis. Interestingly, the LUM subnetworks are also enriched for genes important for complement and coagulation cascades, such as SERPING1, CFH, and TFPI, which have been implicated in CAD development.41,42 We also found that the LUM subnetwork from the brain tissue contains estrogen signaling-related genes such as EMP1, ANXA1, DCN, TGFBI, and PCOLCE. Within the brain, estrogen signaling pathway regulates glucose transport, aerobic glycolysis, and mitochondrial function to generate ATP; estrogen signaling also coordinates the brain and peripheral on metabolic homeostasis.43 The role of estrogen in angiogenesis, cellular regrowth, and downstream collagen formation has been well documented for cardiovascular diseases,44,45 and the connection between the small leucine-rich proteoglycan LUM with estrogen signaling revealed by our network analysis is intriguing and warrants further investigation. Notably, although our network selection included mostly peripheral and vascular tissues and cell types, LUM was identified as the no. 1 KD and the LUM brain subnetwork stood out as a key component of the CAD network. Based on the data, we feel that LUM and brain ECM perhaps play a previously underappreciated role in CAD. Encouragingly, a recent independent data-driven study provides strong evidence that brain may be one of the key tissues for CAD.46 However, it is possible that the brain ECM network derived from our analysis reflects the role of ECM in atherosclerotic plaque caused by homology in network organization between tissues. Without plaque data to assess this possibility in the current study, caution is required in the interpretation of the role of brain and brain ECM in CAD pathogenesis.
In addition to LUM, several other ECM genes including COL1A1 and COL4A2 were also ranked as top KDs. Even KDs that are not direct ECM components, such as DUSP1, SLIT3, ANXA3, and SLC2A3, are highly connected to ECM genes in their respective gene subnetworks, highlighting the importance of ECM. In the tissue-specific regulatory networks, the key regulators tend to bridge ECM with many other molecular mechanisms involved in CAD development,47,48 such as inflammatory responses, complement and coagulation, adhesion, and lipid metabolism (Table 5; Figure 3). These results suggest a central role of ECM in CAD, in agreement with the conclusion from a recent multiethnic genetic study,9 where the top KDs for the shared genetic signals between CAD and type 2 diabetes mellitus either encode ECM or are involved in cell–matrix interactions. It is postulated that the critical roles of ECM in cell integrity, cell adhesion, and cellular communication/signaling may underlie its connection with multiple CAD processes. Indeed, the importance of ECM in an array of complex diseases has been increasingly recognized.49
Besides the ECM genes, we detected other novel or less well-studied key regulators for CAD, such as STAT3, HGD, and GBP2. Although their direct roles in CAD development are poorly implicated, the biological processes involved in their subnetworks are biologically plausible. For example, STAT3 is a member of JAK–STAT signaling pathway, the principal signaling mechanism for a wide array of cytokines and growth factors and a critical pathway for many physiological activities such as immune development, hematopoiesis, and adipogenesis.50 The activation of JAK–STAT signaling has been implicated as a significant contributing factor to the pathogenesis of CAD,51 and the interactions between STAT3 and interleukin-6 signaling may play a role.52 In support of the interleukin-6 path, STAT3 is connected to the CAD GWAS gene IL6R in the CAD network derived through our analysis (Figure 3). Moreover, STAT3 is a hub linking multiple additional CAD GWAS genes such as PTPN11, HNF1A, and PDGFRA in the network. Another KD gene HGD encodes the enzyme homogentisate 1 to 2 dioxygenase, which is involved in the catabolism of the amino acids tyrosine and phenylalanine. Defects in HGD are responsible for alkaptonuria, a genetic disease with Mendelian autosomal recessive inheritance, by causing accumulation of a proinflammatory and pro-oxidative stress intermediate, 2,5-dihydroxyphenylacetic acid in connective tissues. Patients with alkaptonuria often have cardiovascular disease, kidney disease, and damages to other organs. In our data-driven networks (Figure 3), HGD is a KD connected with multiple apolipoproteins (eg, APOA1, APOA5, APOC3, and APOC4) and coagulation factors (eg, PLG, SERPINC1, F13B, and F9), supporting an intimate interaction between this enzyme and known CAD processes and implying an underappreciated role of this gene in CAD. Another novel KD, GBP2, has been identified as a possible control factor for tumor development and a marker of efficient T-cell response.53 In our analysis, GBP2 subnetworks in both blood and kidney were enriched with interferon signaling genes and may contribute to CAD by modulating inflammatory responses.
In addition to identifying both well-known CAD driver genes such as lipid metabolism genes and novel KDs for the top CAD GWAS genes, our network-based method also unravels intimate connections among the top CAD GWAS genes and pathways (Figure 3), which has not been achieved by previous efforts. For example, many CAD GWAS genes involved in lipid metabolism and transport (eg, APOA1, APOA4, APOA5, APOB, and APOC1-C4) are joined with coagulation and complement genes (eg, PLG, SERPINC1) via KD genes HGD and F2. This lipid metabolism-coagulation subnetwork is further connected to several immune and inflammatory subnetworks, which are in turn connected to ECM subnetworks. For other well-known lipid metabolism genes, such as PCSK9, LDLR, LPL, and LIPA, they tend to be spread around different subnetworks rather than strongly clustered (Figure 3), probably because of the limitations of gene regulatory networks in capturing biochemical and enzymatic reactions. These findings shed light on the complex interactions among CAD GWAS genes and between individual CAD processes via KDs, thus unraveling novel insights into the complex mechanisms of CAD development.
Recently, several pathway and network analysis of CAD utilizing CARDIoGRAM CAD GWAS have been conducted.8,32,54 These studies use the full set of GWAS, which includes both strong and subtle genetic signals to identify CAD pathways and networks. In contrast to these existing studies, our current analysis specifically focuses on the smaller number of strong and significant CAD GWAS loci. Encouragingly, our current analysis based on the top CAD loci revealed highly consistent pathways and networks when compared with the previous studies utilizing full GWAS data set. Lipid metabolism, complement and coagulation, ECM, inflammatory pathways, focal adhesion, peroxisome proliferator-activated receptors signaling, and cell cycle are all replicated in our current analysis. In addition, the current study involves more comprehensive coverage of networks, a novel, vigorous, and streamlined gene ranking and prioritization scheme, and incorporation of multidimensional data and resources for validation. As a result, the current study provides a detailed illustration of the network architecture connecting the top CAD candidate genes and pinpoint potential regulators of these top loci. The prioritized KDs with full annotation of their tissue-specific subnetworks, biological pathways, literature evidence, and druggability information represent a step further toward a better understanding of the top GWAS loci as well as clinical and therapeutic application of the recent powerful genetic discoveries.
Similar to several previous studies, here we again demonstrate that the KDs identified are not necessarily significant GWAS signals although their neighbors in gene networks tend to be GWAS signals.8,9,15 This phenomenon likely explains why GWAS hits have low selection pressure and commonality in the general population, and why each locus only explains a small fraction of heritability. These observations may argue against the importance of a majority of individual GWAS candidate genes as effective therapeutic targets because their subtle effects in disease modification. KDs, on the contrary, may serve as better drug targets because of their importance in regulating other GWAS genes. These hypotheses, however, need to be treated with caution. In fact, some of the GWAS genes such as HMGCR and PCSK9 are proven, effective drug targets in CAD therapeutics, yet they were not detected as KDs in our study. Instead, genes PMVK and LDLR that functionally relate to the known targets were KDs in our analysis. One potential explanation is that the mostly transcription-based gene regulatory networks used in our analysis cannot capture the various types of regulation important for CAD and thus may miss additional KDs. Although it is appealing to suggest that KDs are more potent drug targets based on network properties, this hypothesis awaits future validation. The importance of KDs in regulating large numbers of genes may also imply more severe side effects accompanying stronger therapeutic impact. Therefore, selection of KDs with partners and functions specific to CAD is necessary to avoid potential adverse effects.
The lack of signals of KDs in GWAS may be a result of negative selection pressure because of their critical roles in biological networks, as hypothesized and discussed by multiple previous studies.8,9,15 This negative pressure hypothesis is supported by the recent discovery of 3230 essential genes out of 31 345 human genes based on exome sequencing of 60 706 humans55 (Exome Aggregation Consortium, http://www.exac.broadinstitute.org/). These essential genes demonstrate near-complete depletion of truncating variants and have no currently established human disease phenotypes because of the lack of functional variants. Among the top 20 KDs identified in our CAD study, 6 were among the essential genes, including COL1A1, DUSP6, F2, MSN, SLIT3, and STAT3, representing a significant enrichment of essential genes among the top KDs (fold change, 2.91; Fisher exact test, P=0.0028). Another recent study revealed that BRD4 is essential for luminal cancer. However, there is lack of cancer GWAS signals in this gene.56 Furthermore, in our previous comparison of KDs versus non-KDs for a set of inflammatory genes shared across >10 diseases,26 we found 63.6% of KDs and 39.2% of non-KDs demonstrated observable phenotypes based on the Mouse Genome Informatics mouse phenome database. This represents a significantly higher percentage of genes with mutant phenotypes among KDs when targeted in mutant animals (P=0.001 by proportion test). Therefore, evidence from both humans and mice supports the essential role and stronger negative pressure of KDs. By focusing on gene networks connecting the top CAD GWAS genes and their KDs, our study offers a distinct angle to understand the complex CAD biology and detect more plausible therapeutic targets. In support of the therapeutic potential of the KDs, our study also provides evidence that many of the top KDs uncovered have been subject to drug development as druggable targets (Table 4) for multiple diseases, such as thrombosis, diabetes mellitus, and cancers. Based on their central locations in the network models, enrichment of CAD GWAS signals in their local subnetworks, and gene expression perturbations in myocardial infarction patients, these KDs are plausible potential targets for CAD.
Despite the advantages and novel discoveries discussed above, there are limitations in our study. First, the determination of candidate genes based on GWAS loci is not straightforward. Chromosomal location-based mapping lacks functional support, whereas functional data-supported mapping has incomplete coverage of tissue and lack of power in identifying weak cis-association and trans-regulation. Therefore, candidate gene mapping that was based on existing data can be far from comprehensive and may carry biases. To address these issues, we incorporated different CAD candidate gene lists according to different single nucleotide polymorphism-gene mapping approaches (ie, chromosomal location versus expression quantitative trait loci) and inclusion/exclusion criteria (eg, whether to consider or exclude genes in well-known lipid loci to avoid overshadowing novel genes and mechanisms by lipid genes). Interestingly, many top KDs do not seem to be sensitive to the CAD gene curation parameters, supporting the robustness of the network structures and KDs. This carries important implications that the main biological pathways and networks of CAD are relatively stable despite that new genes are continuously discovered and inaccurate mapping of certain candidate genes by any particular mapping method may exist. Second, although we aim to conduct a comprehensive data-driven analysis, our investigation is limited by the availability of tissue-specific regulatory networks, which may introduce bias because networks from other critical cell or tissue types such as vascular smooth muscle cells are missed. Third, the gene networks used in our current analysis do not include other regulatory molecules or elements such as noncoding RNAs and enhances, which will miss essential key regulators that are not protein-coding genes, such as the noncoding ANRIL transcript for the 9p21 locus. Fourth, for the gene expression pattern analysis of the KD subnetworks between CAD and controls, we were not able to identify CAD transcriptomic data sets involving the tissue types perfectly matching those used for the gene networks. Refinement of our analysis is necessary when additional data sets become available in the future. Finally, our study represents a bioinformatics data mining effort and is exploratory in nature. Although we provide multiple lines of in silico evidence to support the importance of the KDs, experimental validation of the novel KDs for their roles in regulating the CAD GWAS genes, networks, and disease development is beyond the scope of the current study but warrant further investigation in future studies.
In summary, our study provides a novel integrative genomics framework to understand the relations among CAD GWAS genes and prioritize the genes impacted by genetic variations in CAD. Our findings offer novel mechanistic hypotheses about CAD pathogenesis and pinpoint potential drug targets to more effectively counteract CAD. Other complex diseases or phenotypes such as cancers, Alzheimer disease, and drug responses also involve multiple genetic determinants. Our analytic framework can be adapted for other disease areas to help generate new hypotheses and benefit drug target discovery.
Supplementary Material
Significance.
Genome-wide association studies have successfully identified hundreds of regions in the genome that harbor genetic variants that increase risks for coronary artery disease (CAD). However, it has been challenging to understand the molecular mechanisms through which these loci contribute to CAD, and the clinical implications and utilities of these findings remain largely unknown. In this work, we designed and implemented an integrative method that leverages the genetic association strength, tissue-specific gene regulations, and gene expression perturbations in patients with CAD, to understand the relations among the CAD loci and prioritize causal genes for CAD that are more suitable for drug development. Our approach revealed intimate interactions among the genes underlying the CAD loci and identified potential novel regulators, many of which druggable, that coordinate the actions of CAD genes and pathways to impact CAD pathogenesis.
Acknowledgments
We thank Deepali Jhamb at GSK for her help with reviewing the article. We thank CADgenomics consortium and Themistocles Assimes at Stanford University School of Medicine for the assistance in generating the CAD gene lists.
Sources of Funding
The study was supported by research funds from GSK, the American Heart Association Scientist Development grant 13SDG17290032, and NIDDK R01DK104363 to X. Yang.
Nonstandard Abbreviations and Acronyms
- CAD
coronary artery disease
- ECM
extracellular matrix
- GWAS
genome-wide association studies
- KD
key driver
- KDA
key driver analysis
Footnotes
The online-only Data Supplement is available with this article at http://atvb.ahajournals.org/lookup/suppl/doi:10.1161/ATVBAHA.115.306725/-/DC1.
Disclosures
None.
References
- 1.Wilson PW, D’Agostino RB, Levy D, Belanger AM, Silbershatz H, Kannel WB. Prediction of coronary heart disease using risk factor categories. Circulation. 1998;97:1837–1847. doi: 10.1161/01.cir.97.18.1837. [DOI] [PubMed] [Google Scholar]
- 2.Berry JD, Dyer A, Cai X, Garside DB, Ning H, Thomas A, Greenland P, Van Horn L, Tracy RP, Lloyd-Jones DM. Lifetime risks of cardiovascular disease. N Engl J Med. 2012;366:321–329. doi: 10.1056/NEJMoa1012848. [DOI] [PMC free article] [PubMed] [Google Scholar]
- 3.Roberts R, Stewart AF. The genetics of coronary artery disease. Curr Opin Cardiol. 2012;27:221–227. doi: 10.1097/HCO.0b013e3283515b4b. [DOI] [PubMed] [Google Scholar]
- 4.Roberts R. Genetics of coronary artery disease. Circ Res. 2014;114:1890–1903. doi: 10.1161/CIRCRESAHA.114.302692. [DOI] [PubMed] [Google Scholar]
- 5.Deloukas P, Kanoni S, Willenborg C, et al. Large-scale association analysis identifies new risk loci for coronary artery disease. Nat Genet. 2013;45:25–U52. doi: 10.1038/ng.2480. [DOI] [PMC free article] [PubMed] [Google Scholar]
- 6.Björkegren JL, Kovacic JC, Dudley JT, Schadt EE. Genome-wide significant loci: how important are they? Systems genetics to understand heritability of coronary artery disease and other common complex disorders. J Am Coll Cardiol. 2015;65:830–845. doi: 10.1016/j.jacc.2014.12.033. [DOI] [PMC free article] [PubMed] [Google Scholar]
- 7.Nikpay M, Goel A, Won HH, et al. CARDIoGRAMplusC4D Consortium A comprehensive 1,000 Genomes-based genome-wide association meta-analysis of coronary artery disease. Nat Genet. 2015;47:1121–1130. doi: 10.1038/ng.3396. [DOI] [PMC free article] [PubMed] [Google Scholar]
- 8.Mäkinen VP, Civelek M, Meng Q, et al. Coronary ARtery DIsease Genome-Wide Replication And Meta-Analysis (CARDIoGRAM) Consortium Integrative genomics reveals novel molecular pathways and gene networks for coronary artery disease. PLoS Genet. 2014;10:e1004502. doi: 10.1371/journal.pgen.1004502. [DOI] [PMC free article] [PubMed] [Google Scholar]
- 9.Chan KH, Huang YT, Meng Q, Wu C, Reiner A, Sobel EM, Tinker L, Lusis AJ, Yang X, Liu S. Shared molecular pathways and gene networks for cardiovascular disease and type 2 diabetes mellitus in women across diverse ethnicities. Circ Cardiovasc Genet. 2014;7:911–919. doi: 10.1161/CIRCGENETICS.114.000676. [DOI] [PubMed] [Google Scholar]
- 10.Nelson CP, Schunkert H, Samani NJ, Erridge C. Genetic analysis of leukocyte type-I interferon production and risk of coronary artery disease. Arterioscler Thromb Vasc Biol. 2015;35:1456–1462. doi: 10.1161/ATVBAHA.114.304925. [DOI] [PubMed] [Google Scholar]
- 11.Yao C, Chen BH, Joehanes R, et al. Integromic analysis of genetic variation and gene expression identifies networks for cardiovascular disease phenotypes. Circulation. 2015;131:536–549. doi: 10.1161/CIRCULATIONAHA.114.010696. [DOI] [PMC free article] [PubMed] [Google Scholar]
- 12.Lee I, Blom UM, Wang PI, Shim JE, Marcotte EM. Prioritizing candidate disease genes by network-based boosting of genome-wide association data. Genome Res. 2011;21:1109–1121. doi: 10.1101/gr.118992.110. [DOI] [PMC free article] [PubMed] [Google Scholar]
- 13.Schnabel RB, Baccarelli A, Lin H, Ellinor PT, Benjamin EJ. Next steps in cardiovascular disease genomic research–sequencing, epigenetics, and transcriptomics. Clin Chem. 2012;58:113–126. doi: 10.1373/clinchem.2011.170423. [DOI] [PMC free article] [PubMed] [Google Scholar]
- 14.Zhang B, Gaiteri C, Bodea LG, et al. Integrated systems approach identifies genetic nodes and networks in late-onset Alzheimer’s disease. Cell. 2013;153:707–720. doi: 10.1016/j.cell.2013.03.030. [DOI] [PMC free article] [PubMed] [Google Scholar]
- 15.Goh KI, Cusick ME, Valle D, Childs B, Vidal M, Barabási AL. The human disease network. Proc Natl Acad Sci U S A. 2007;104:8685–8690. doi: 10.1073/pnas.0701361104. [DOI] [PMC free article] [PubMed] [Google Scholar]
- 16.Brænne I, Civelek M, Vilne B, et al. Leducq Consortium CAD Genomics Prediction of causal candidate genes in coronary artery disease loci. Arterioscler Thromb Vasc Biol. 2015;35:2207–2217. doi: 10.1161/ATVBAHA.115.306108. [DOI] [PMC free article] [PubMed] [Google Scholar]
- 17.Sazonova O, Zhao Y, Nürnberg S, Miller C, Pjanic M, Castano VG, Kim JB, Salfati EL, Kundaje AB, Bejerano G, Assimes T, Yang X, Quertermous T. Characterization of TCF21 downstream target regions identifies a transcriptional network linking multiple independent coronary artery disease loci. PLoS Genet. 2015;11:e1005202. doi: 10.1371/journal.pgen.1005202. [DOI] [PMC free article] [PubMed] [Google Scholar]
- 18.Smemo S, Tena JJ, Kim KH, et al. Obesity-associated variants within FTO form long-range functional connections with IRX3. Nature. 2014;507:371–375. doi: 10.1038/nature13138. [DOI] [PMC free article] [PubMed] [Google Scholar]
- 19.Eicher JD, Landowski C, Stackhouse B, Sloan A, Chen W, Jensen N, Lien JP, Leslie R, Johnson AD. GRASP v2.0: an update on the Genome-Wide Repository of Associations between SNPs and phenotypes. Nucleic Acids Res. 2015;43:D799–D804. doi: 10.1093/nar/gku1202. Database issue. [DOI] [PMC free article] [PubMed] [Google Scholar]
- 20.Foroughi Asl H, Talukdar HA, Kindt AS, et al. CARDIoGRAM Consortium Expression quantitative trait Loci acting across multiple tissues are enriched in inherited risk for coronary artery disease. Circ Cardiovasc Genet. 2015;8:305–315. doi: 10.1161/CIRCGENETICS.114.000640. [DOI] [PubMed] [Google Scholar]
- 21.Zhong H, Beaulaurier J, Lum PY, et al. Liver and adipose expression associated SNPs are enriched for association to type 2 diabetes. PLoS Genet. 2010;6:e1000932. doi: 10.1371/journal.pgen.1000932. [DOI] [PMC free article] [PubMed] [Google Scholar]
- 22.Rotival M, Zeller T, Wild PS, et al. Cardiogenics Consortium Integrating genome-wide genetic variations and monocyte expression data reveals trans-regulated gene modules in humans. PLoS Genet. 2011;7:e1002367. doi: 10.1371/journal.pgen.1002367. [DOI] [PMC free article] [PubMed] [Google Scholar]
- 23.Battle A, Mostafavi S, Zhu X, Potash JB, Weissman MM, McCormick C, Haudenschild CD, Beckman KB, Shi J, Mei R, Urban AE, Montgomery SB, Levinson DF, Koller D. Characterizing the genetic basis of transcriptome diversity through RNA-sequencing of 922 individuals. Genome Res. 2014;24:14–24. doi: 10.1101/gr.155192.113. [DOI] [PMC free article] [PubMed] [Google Scholar]
- 24.Lappalainen T, Sammeth M, Friedländer MR, et al. Geuvadis Consortium Transcriptome and genome sequencing uncovers functional variation in humans. Nature. 2013;501:506–511. doi: 10.1038/nature12531. [DOI] [PMC free article] [PubMed] [Google Scholar]
- 25.Erbilgin A, Civelek M, Romanoski CE, Pan C, Hagopian R, Berliner JA, Lusis AJ. Identification of CAD candidate genes in GWAS loci and their expression in vascular cells. J Lipid Res. 2013;54:1894–1905. doi: 10.1194/jlr.M037085. [DOI] [PMC free article] [PubMed] [Google Scholar]
- 26.Wang IM, Zhang B, Yang X, et al. Systems analysis of eleven rodent disease models reveals an inflammatome signature and key drivers. Mol Syst Biol. 2012;8:594. doi: 10.1038/msb.2012.24. [DOI] [PMC free article] [PubMed] [Google Scholar]
- 27.Yang X, Zhang B, Molony C, et al. Systematic genetic and genomic analysis of cytochrome P450 enzyme activities in human liver. Genome Res. 2010;20:1020–1036. doi: 10.1101/gr.103341.109. [DOI] [PMC free article] [PubMed] [Google Scholar]
- 28.Zhu J, Zhang B, Smith EN, Drees B, Brem RB, Kruglyak L, Bumgarner RE, Schadt EE. Integrating large-scale functional genomic data to dissect the complexity of yeast regulatory networks. Nat Genet. 2008;40:854–861. doi: 10.1038/ng.167. [DOI] [PMC free article] [PubMed] [Google Scholar]
- 29.Liu H, Liu W, Liao Y, Cheng L, Liu Q, Ren X, Shi L, Tu X, Wang QK, Guo AY. CADgene: a comprehensive database for coronary artery disease genes. Nucleic Acids Res. 2011;39:D991–D996. doi: 10.1093/nar/gkq1106. Database issue. [DOI] [PMC free article] [PubMed] [Google Scholar]
- 30.Griffith M, Griffith OL, Coffman AC, et al. DGIdb: mining the druggable genome. Nat Methods. 2013;10:1209–1210. doi: 10.1038/nmeth.2689. [DOI] [PMC free article] [PubMed] [Google Scholar]
- 31.Sainio A, Järveläinen H. Extracellular matrix macromolecules: potential tools and targets in cancer gene therapy. Mol Cell Ther. 2014;2:14. doi: 10.1186/2052-8426-2-14. [DOI] [PMC free article] [PubMed] [Google Scholar]
- 32.Ghosh S, Vivar J, Nelson CP, et al. Systems genetics analysis of genome-wide association study reveals novel associations between key biological processes and coronary artery disease. Arterioscler Thromb Vasc Biol. 2015;35:1712–1722. doi: 10.1161/ATVBAHA.115.305513. [DOI] [PMC free article] [PubMed] [Google Scholar]
- 33.Bromberg Y. Chapter 15: Disease gene prioritization. Plos Comput Biol. 2013;9 doi: 10.1371/journal.pcbi.1002902. [DOI] [PMC free article] [PubMed] [Google Scholar]
- 34.Kuo DS, Labelle-Dumais C, Gould DB. COL4A1 and COL4A2 mutations and disease: insights into pathogenic mechanisms and potential therapeutic targets. Hum Mol Genet. 2012;21(R1):R97–110. doi: 10.1093/hmg/dds346. [DOI] [PMC free article] [PubMed] [Google Scholar]
- 35.Konstandin MH, Toko H, Gastelum GM, Quijada P, De La Torre A, Quintana M, Collins B, Din S, Avitabile D, Völkers M, Gude N, Fässler R, Sussman MA. Fibronectin is essential for reparative cardiac progenitor cell response after myocardial infarction. Circ Res. 2013;113:115–125. doi: 10.1161/CIRCRESAHA.113.301152. [DOI] [PMC free article] [PubMed] [Google Scholar]
- 36.Kelloniemi A, Szabo Z, Serpi R, Näpänkangas J, Ohukainen P, Tenhunen O, Kaikkonen L, Koivisto E, Bagyura Z, Kerkelä R, Leosdottir M, Hedner T, Melander O, Ruskoaho H, Rysä J. The early-onset myocardial infarction associated PHACTR1 gene regulates skeletal and cardiac alpha-actin gene expression. PLoS One. 2015;10:e0130502. doi: 10.1371/journal.pone.0130502. [DOI] [PMC free article] [PubMed] [Google Scholar]
- 37.Lin HJ, Kung YJ, Lin YJ, Sheu JJ, Chen BH, Lan YC, Lai CH, Hsu YA, Wan L, Tsai FJ. Association of the lumican gene functional 3′-UTR polymorphism with high myopia. Invest Ophthalmol Vis Sci. 2010;51:96–102. doi: 10.1167/iovs.09-3612. [DOI] [PubMed] [Google Scholar]
- 38.Chakravarti S, Magnuson T, Lass JH, Jepsen KJ, LaMantia C, Carroll H. Lumican regulates collagen fibril assembly: skin fragility and corneal opacity in the absence of lumican. J Cell Biol. 1998;141:1277–1286. doi: 10.1083/jcb.141.5.1277. [DOI] [PMC free article] [PubMed] [Google Scholar]
- 39.Mienaltowski MJ, Birk DE. Mouse models in tendon and ligament research. Adv Exp Med Biol. 2014;802:201–230. doi: 10.1007/978-94-007-7893-1_13. [DOI] [PubMed] [Google Scholar]
- 40.Fassot C, Briet M, Rostagno P, Barbry P, Perret C, Laude D, Boutouyrie P, Bozec E, Bruneval P, Latremouille C, Laurent S. Accelerated arterial stiffening and gene expression profile of the aorta in patients with coronary artery disease. J Hypertens. 2008;26:747–757. doi: 10.1097/HJH.0b013e3282f4b3d0. [DOI] [PubMed] [Google Scholar]
- 41.Van Gaal LF, Mertens IL, De Block CE. Mechanisms linking obesity with cardiovascular disease. Nature. 2006;444:875–880. doi: 10.1038/nature05487. [DOI] [PubMed] [Google Scholar]
- 42.Wong TC, Piehler K, Meier CG, Testa SM, Klock AM, Aneizi AA, Shakesprere J, Kellman P, Shroff SG, Schwartzman DS, Mulukutla SR, Simon MA, Schelbert EB. Association between extracellular matrix expansion quantified by cardiovascular magnetic resonance and short-term mortality. Circulation. 2012;126:1206–1216. doi: 10.1161/CIRCULATIONAHA.111.089409. [DOI] [PMC free article] [PubMed] [Google Scholar]
- 43.Rettberg JR, Yao J, Brinton RD. Estrogen: a master regulator of bioenergetic systems in the brain and body. Front Neuroendocrinol. 2014;35:8–30. doi: 10.1016/j.yfrne.2013.08.001. [DOI] [PMC free article] [PubMed] [Google Scholar]
- 44.Barnabas O, Wang H, Gao XM. Role of estrogen in angiogenesis in cardiovascular diseases. J Geriatr Cardiol. 2013;10:377–382. doi: 10.3969/j.issn.1671-5411.2013.04.008. [DOI] [PMC free article] [PubMed] [Google Scholar]
- 45.Libby P, Ridker PM, Maseri A. Inflammation and atherosclerosis. Circulation. 2002;105:1135–1143. doi: 10.1161/hc0902.104353. [DOI] [PubMed] [Google Scholar]
- 46.Won HH, Natarajan P, Dobbyn A, Jordan DM, Roussos P, Lage K, Raychaudhuri S, Stahl E, Do R. Disproportionate Contributions of Select Genomic Compartments and Cell Types to Genetic Risk for Coronary Artery Disease. PLoS Genet. 2015;11:e1005622. doi: 10.1371/journal.pgen.1005622. [DOI] [PMC free article] [PubMed] [Google Scholar]
- 47.Jun JI, Lau LF. Taking aim at the extracellular matrix: CCN proteins as emerging therapeutic targets. Nat Rev Drug Discov. 2011;10:945–963. doi: 10.1038/nrd3599. [DOI] [PMC free article] [PubMed] [Google Scholar]
- 48.Bonnans C, Chou J, Werb Z. Remodelling the extracellular matrix in development and disease. Nat Rev Mol Cell Biol. 2014;15:786–801. doi: 10.1038/nrm3904. [DOI] [PMC free article] [PubMed] [Google Scholar]
- 49.Järveläinen H, Sainio A, Koulu M, Wight TN, Penttinen R. Extracellular matrix molecules: potential targets in pharmacotherapy. Pharmacol Rev. 2009;61:198–223. doi: 10.1124/pr.109.001289. [DOI] [PMC free article] [PubMed] [Google Scholar]
- 50.Rawlings JS, Rosler KM, Harrison DA. The JAK/STAT signaling pathway. J Cell Sci. 2004;117(Pt 8):1281–1283. doi: 10.1242/jcs.00963. [DOI] [PubMed] [Google Scholar]
- 51.Mascareno E, El-Shafei M, Maulik N, Sato M, Guo Y, Das DK, Siddiqui MA. JAK/STAT signaling is associated with cardiac dysfunction during ischemia and reperfusion. Circulation. 2001;104:325–329. doi: 10.1161/01.cir.104.3.325. [DOI] [PubMed] [Google Scholar]
- 52.O’Shea JJ, Plenge R. JAK and STAT signaling molecules in immunoregulation and immune-mediated disease. Immunity. 2012;36:542–550. doi: 10.1016/j.immuni.2012.03.014. [DOI] [PMC free article] [PubMed] [Google Scholar]
- 53.Godoy P, Cadenas C, Hellwig B, Marchan R, Stewart J, Reif R, Lohr M, Gehrmann M, Rahnenführer J, Schmidt M, Hengstler JG. Interferon-inducible guanylate binding protein (GBP2) is associated with better prognosis in breast cancer and indicates an efficient T cell response. Breast Cancer. 2014;21:491–499. doi: 10.1007/s12282-012-0404-8. [DOI] [PubMed] [Google Scholar]
- 54.Huan TX, Zhang B, Wang Z, et al. Coronary ARteryDIsease Genome wide Replication and Meta-analysis (CARDIoGRAM) Consortium, International Consortium for Blood Pressure GWAS (ICBP) A systems biology framework identifies molecular underpinnings of coronary heart disease. Arterioscl Throm Vas. 2013;33:1427–1434. doi: 10.1161/ATVBAHA.112.300112. [DOI] [PMC free article] [PubMed] [Google Scholar]
- 55.Lek M, Karczewski K, Minikel E, et al. Analysis of protein-coding genetic variation in 60,706 humans [published online ahead of print October 30, 2015] bioRxiv. doi: 10.1038/nature19057. doi: http://dx.doi.org/10.1101/030338. http://biorxiv.org/content/early/2015/10/30/030338. [DOI] [PMC free article] [PubMed]
- 56.Marcotte R, Sayad A, Brown KR, Sanchez-Garcia F, Reimand J, Haider M, Virtanen C, Bradner JE, Bader GD, Mills GB, Pe’er D, Moffat J, Neel BG. Functional genomic landscape of human breast cancer drivers, vulnerabilities, and resistance. Cell. 2016;164:293–309. doi: 10.1016/j.cell.2015.11.062. [DOI] [PMC free article] [PubMed] [Google Scholar]
Associated Data
This section collects any data citations, data availability statements, or supplementary materials included in this article.