

Abstract
We applied high-speed photoacoustic microscopy (PAM) for both cortical microenvironment studies and dynamic brain studies, with micrometer-level optical resolution and a millisecond-level cross-sectional imaging speed over a millimeter-level field of view. We monitored blood flow redistribution in mini-stroke mouse models and cerebral autoregulation induced by a vasoactive agent. Our results collectively suggest that high-speed PAM is a promising tool for understanding dynamic neurophysiological phenomena, complementing conventional imaging modalities.
Keywords: photoacoustic microscopy, MEMS scanning mirror, cortical hemodynamics, blood flow redistribution, microhemorrhage, cerebral autoregulation
1 Introduction
Modern brain imaging techniques have had a profound impact on neuroscience by providing structural, functional, and molecular imaging information about brain activities [1,2]. With the development of genetically altered mouse models, various human neurological diseases can be reproduced in mice [3]. Brain imaging of these mouse models has opened a new window for understanding the underlying brain mechanisms and studying disease developments at a much finer scale and in a more controllable manner.
The hemodynamics of the mouse brain have been studied in detail by biomedical imaging modalities such as small-animal functional magnetic resonance imaging (fMRI), wide-field optical microscopy, and two-photon microscopy. However, small-animal fMRI is primarily sensitive to deoxy-hemoglobin and is insufficient to resolve brain activities at length scales finer than 50 µm [4], wide-field optical microscopy lacks depth resolution [5], and two-photon microscopy relies on exogenously delivered fluorophores as the contrast agents [6]. Optical coherence tomography-based angiography exploits the optical contrast in dynamic backscattered light [7] and is complementary to photoacoustic tomography (PAT), which shows the optical absorption contrast [8]. By acoustically detecting optical absorption in tissues, PAT is capable of anatomical, functional, molecular, and metabolic imaging of small animals, with highly scalable spatial resolution and penetration depth [9, 10]. In particular, the rich spectroscopic and functional imaging capabilities of PAT suggest it could be a powerful tool for brain disease diagnosis and neuroimaging studies [11, 12].
As a major implementation of PAT, optical-resolution photoacoustic microscopy (OR-PAM) provides capillary-level spatial resolution by tightly focusing the laser beam at depths within the optical diffusion limit [13, 14]. Here, we present a high-speed OR-PAM with micrometer-level resolution and a millisecond-level cross-sectional imaging speed over a millimeter-level field of view. Using this high-speed OR-PAM, we quantified the blood flow redistribution in response to spontaneous microhemorrhage, as well as to laser induced occlusions of single microvessels. We also imaged cerebral autoregulation (CA) on single microvessels in an intact mouse brain.
2 Methods
2.1 High-speed OR-PAM
Compared with conventional OR-PAM [15], the distinguishing feature of high-speed OR-PAM is the confocal steering of the excitation laser beam and the detection acoustic axis by a lab-made water-immersible microelectromechanical system (MEMS) scanning mirror [Fig. 1]. The confocal steering ensures uniform detection sensitivity over a large field of view (FOV) [16]. The excitation laser beam (3 ns at 532 nm), generated by an Nd:YVO4 laser, is spatially filtered by a 50 µm diameter pinhole, then reflected to the MEMS mirror by an optical-acoustic beam combiner. The beam combiner provides optical-acoustic coaxial alignment by reflecting light but transmitting sound. The photoacoustic waves from the focus are selected by an acoustic lens and detected by an ultrasonic transducer (central frequency of 50 MHz; –6 dB bandwidth of 100%) [17]. The fast angular scanning of the MEMS mirror along the x-axis enables a cross-sectional (B-scan) imaging rate of 400 Hz over a 3 mm range. Volumetric imaging is achieved by a slow linear step motor that scans the object along the y-axis. The lateral resolution is ~3 µm at the optical focus. The axial resolution is estimated to be ~15 µm based on the transducer bandwidth and the speed of sound in tissue. The high laser repetition rate of 100 kHz enables dense sampling for capillary-resolution imaging over a large FOV [18]. The optical fluence at the tissue surface is around 18 mJ/cm2, just below the American National Standards Institute limit [19].
Fig. 1.
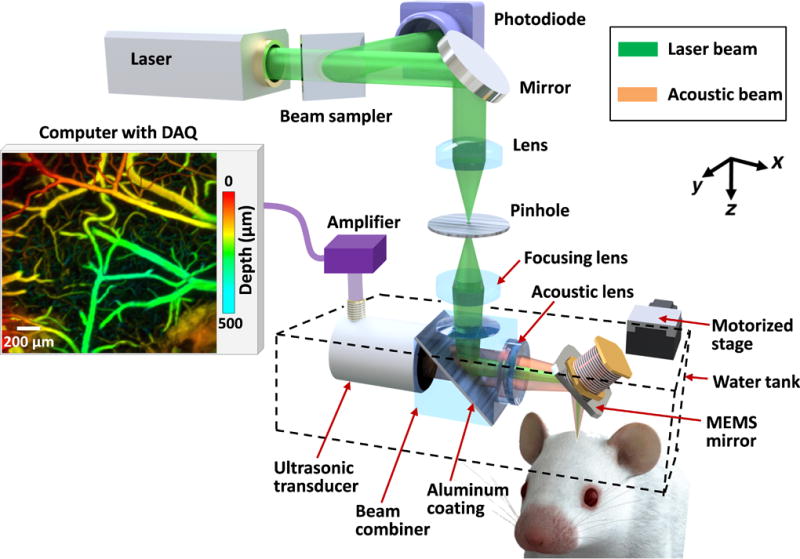
Schematic of the high-speed OR-PAM.
2.2 Animal preparation
To observe a spontaneous microhemorrhage, two-year-old female ND4 Swiss Webster mice (Harlan Laboratory, Inc.; 22 to 28 g) were used for blood flow redistribution measurement. The laboratory animal protocols for this work were approved by the Animal Studies Committee of Washington University in St. Louis. During experiments, the animals’ temperatures were kept at 37 °C by a heating pad. We used an intraperitoneal dose of 100 mg/kg α-chloral hydrate for anesthesia. Each experiment typically took less than three hours. Therefore, no additional injection of the anesthetic mixture was needed.
The scalp was surgically removed before imaging, but the skull was left intact. The skull surface was cleaned with phosphate buffered saline solution. A membrane (clear plastic wrap) at the bottom of a water tank was positioned in gentle contact with the skull surface, where ultrasound gel was applied in advance to couple the acoustic signals. The head of the mouse was fixed in a stereotaxic frame. A motor stage translated the animal and the water tank along the y-axis at a speed of 2–4 mm/s [Fig. 1].
For cerebral autoregulation (CA) imaging, with no need for aged animals, we used three female ND4 Swiss Webster mice (Harlan Laboratory, Inc.; 16–22 g, 4 weeks old). After mounting the animal in the imaging system, phenylephrine, a clinically used vasoconstrictor, was intravenously infused into the tail vein at a dose of 1 mg/kg. Other preparation procedures were the same as for the blood flow redistribution measurement.
2.3 Manipulating blood flow with photothrombosis of single vessels
Optical access to the vasculature offers the opportunity for laser-induced occlusion of single vessels as a model to study the effects of small-scale stroke in mice. In addition to imaging spontaneous microhemorrhage in aged mice brains, we studied blood flow redistribution due to a laser-induced vessel occlusion. We intentionally damaged the vessel wall by focusing a CW laser beam at 650 nm (50 mW) into the lumen of a vessel, and a blood clot formed closely downstream from the irradiation site. The CW laser beam and the PA imaging beam were aligned so that the two beams were focused in the same focal plane. The CW beam was roughly centered in the area that was raster-scanned by the imaging beam. The energy of the CW beam was varied, and the time of irradiation was controlled based on the clot formation assessed from the OR-PAM images.
3 Results
3.1 High-speed OR-PAM of blood flow redistribution in mini-stroke models
A spontaneous microhemorrhage was observed by high-speed OR-PAM at a cortical bifurcation in a two-year-old mouse [Fig. 2a]. The dynamic imaging showed that the hemorrhage stopped within 8 seconds and the extravasated red blood cells were cleared within 80 seconds [Fig. 2b, 2c and Video 1].Since the flow speed was low (~1.0 mm/s), a Matlab particle tracking method was used to extract the flow speed from the dynamic full-frame imaging (Matlab 2012, PIV Toolbox). After the hemorrhage, the blood flow in the hemorrhaged daughter vessel was completely stopped. By contrast, the blood flow speed in the intact daughter vessel was increased by ~100%, due to the conservation of volumetric blood flow. Since the vessel diameter did not change, the pressure gradient in the intact daughter vessel must have increased accordingly. In addition, the signal amplitude in the intact daughter vessel significantly increased, which reflected an elevated RBC density [Fig. 2d]. The escalated blood flow speed and RBC density increased the risk of further hemorrhages in the remaining vessels [20].
Fig. 2.
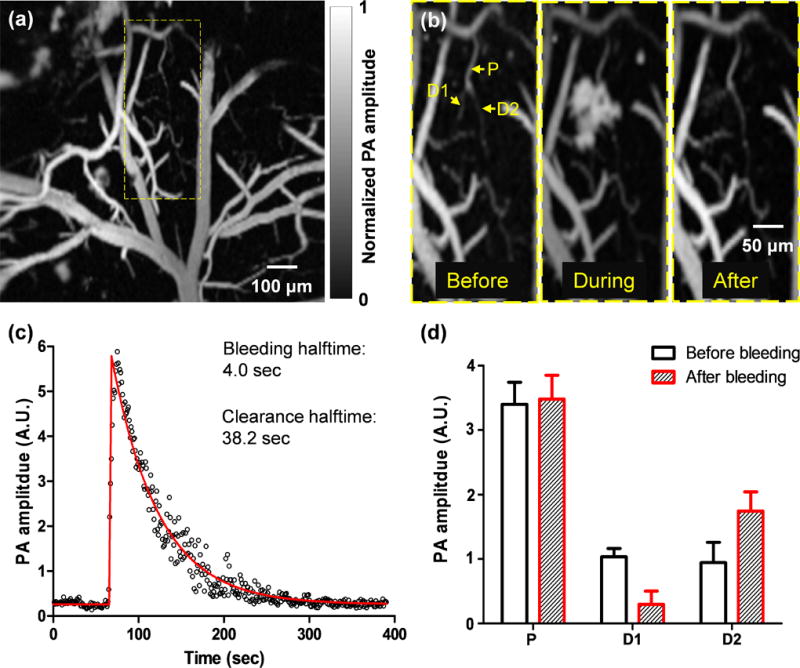
High-speed OR-PAM of ischemic mini-stroke dynamics in a mouse brain. (a) OR-PAM image of a 1 mm by 1 mm cortical area, where spontaneous bleeding was observed in the boxed region. (b) Zoomed-in images of the bleeding region, showing a capillary bifurcation composed of a parent vessel (P) and two daughter vessels (D1 and D2). Spontaneous bleeding was observed at daughter vessel D1. (c) The time course of the bleeding dynamics, which shows that the bleeding halftime was 4.0 seconds and the extravascular blood was cleared with a halftime of 38.2 seconds. On the fitted curve, the halftime is the time duration from the baseline to half of the peak or from the peak to half of the peak. (d) The PA signals from the parent vessels and daughter vessels show the blood volume redistribution after the bleeding, with the loss of the blood volume in the bleeding daughter vessel D1 compensated by the blood volume increase in the intact daughter vessel D2.
In addition to imaging a spontaneous microhemorrhage, we created an occlusion on the parent vessel of a bifurcation by focusing a high-power CW laser beam of 650 nm in wavelength. The formation of the occlusion was monitored by fast full-frame imaging [Fig. 3a and Video 2]. Before and after the occlusion, RBC flow speeds were measured at each vessel branch by the line scanning method [Fig. 3b] [18]. The dynamic imaging revealed a dramatic blood flow decrease in the parent vessel after occlusion [Fig. 3c]. Meanwhile, the blood flow in one of the daughter vessels, marked D1 in Fig. 3b, was quickly reversed after occlusion [Fig. 3d], and a new blood flow pathway was immediately formed between the two daughter vessels, which reflected the plasticity of the cortical vascular network. By governing the blood flow redistribution after vessel occlusion, such plasticity may have therapeutic implications for large and small-scale strokes [21].
Fig. 3.
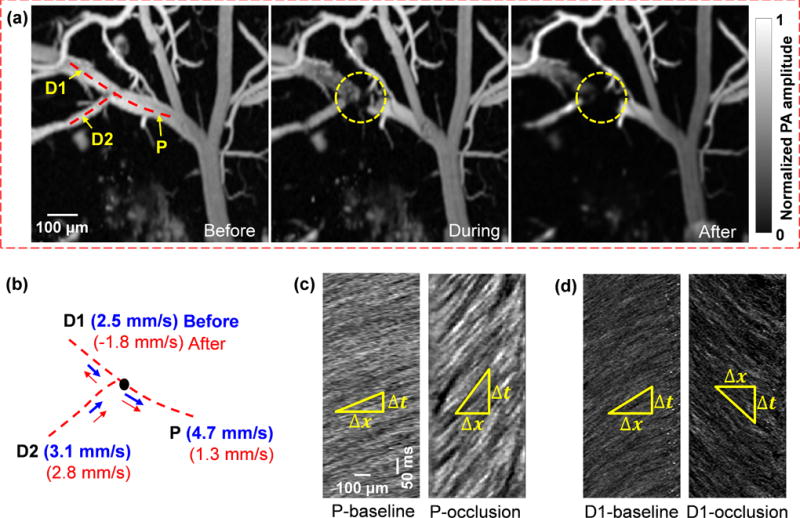
Blood flow dynamics in response to vessel occlusion. A CW laser at 650 nm was focused at the lumen of a vessel to induce photothrombosis. (a) The occlusion region is marked by the dashed circle. Snapshots are shown before, during, and after the occlusion. (b) Line scanning at the bifurcation, consisting of a parent vessel (P) and two daughter vessels (D1 and D2), shows a reduced flow speed in the parent vessel and the reverse flow in the daughter vessel (D1). (c-d) Line scanning images of the parent vessel (c) and one daughter vessel (d) before and after the occlusion, which show the blood flow slowing down in the parent vessel and reversing in the daughter vessel.
Interestingly, in both of the mini-stroke models, strong signals were observed from amoeboid structures scattered over the damaged region. These structures appeared ~30 seconds after the hemorrhage and ~80 seconds after vessel occlusion [Fig. 4, Videos 1 and 2]. Microglia are resident macrophages in the brain. They are rapidly activated, undergoing morphological changes to amoeboid morphology in response to brain injuries such as ischemic stroke [20, 22]. Multiple substances might contribute to the absorption contrast: In response to brain injuries, microglia quickly display several activation markers, including CD68 and major histocompatibility complex class II [22, 23]. Besides, microglia/macrophages are the makers of Peridinin-chlorophyll protein complex, which has ~60% of peak absorbance at 532 nm [24]. Therefore, given the diameters of these structures (~10 µm) and their highly confined locations, we speculate that the amoeboid structures at the mini-stroke/occlusion regions were microglia/microphages activated by a rapid inflammatory response.
Fig. 4.
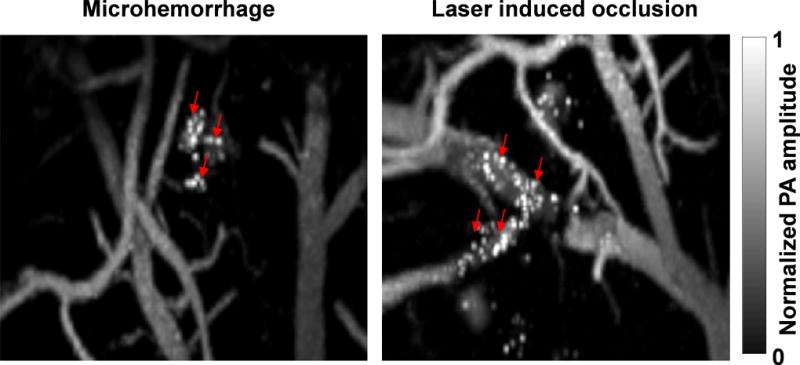
Amoeboid structures (indicated by arrows) were observed in the damaged regions after hemorrhage and vessel occlusion.
3.2 High-speed OR-PAM of cerebral autoregulation
The intravenous tail vein infusion of phenylephrine, a clinically used vasoconstrictor, induced a systemic decrease in vessel diameters. High-speed OR-PAM of the mouse brain showed that, despite the administration of phenylephrine, the majority of the cerebral blood vessels remained of constant diameter, indicating an intact CA system [Fig. 5a, 5b, and 5h]. The blood brain barrier (BBB) effectively blocked phenylephrine from diffusing out of the vessels [25]. Interestingly, blood perfusion to a subpopulation of vessels was completely stopped [Fig. 5b, 5c and 5h], which indicates that selectively turning off a subpopulation of vessels may be part of the CA mechanism for blood redistribution [Video 3]. Quantitatively, the volumetric changes of different vessel types were quantified after vessel segmentation [Fig. 5d] [18]. While the trunk vessels with diameters larger than 50 µm showed no significant change in volume, the smaller vessels had a slight volumetric decrease of ~10% [Fig. 5e].
Fig. 5.
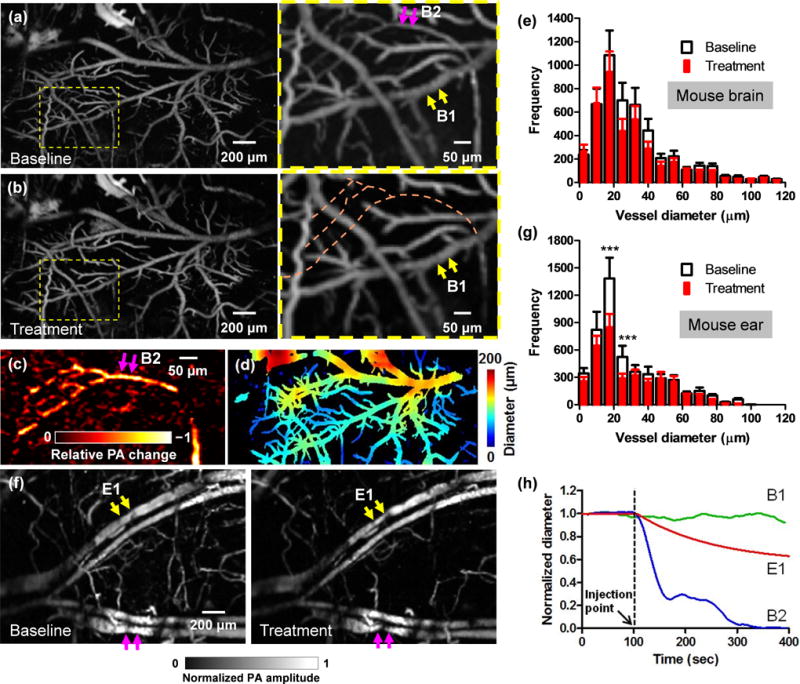
High-speed OR-PAM of mouse brain autoregulation in response to phenylephrine. (a-b) PA images of a 2 mm by 3 mm cortical area before (a) and after (b) the intravenous tail vein injection of phenylephrine, a vasoconstriction agent. While the brain autoregulation maintained the diameters of the majority of vessels, blood perfusion to a sub-population of vessels was completely stopped. (c) The relative PA signal change between the close-ups in (a) and (b), showing the vessels with stopped blood perfusion. (d) Automatic vessel segmentation was used to quantify the vessel diameters. (e) The statistical results show no significant difference in the vessel diameters in the mouse brain before and after the injection of phenylephrine. (f) A comparative study performed in the mouse ear shows clear vasoconstriction (marked by arrows) after the injection. (g) The statistical results also confirmed the decrease in vessel diameters in the mouse ear after the injection. Statistics: paired Student’s t-test. *** p < 0.001, n = 3. (h) Averaged diameter changes of representative vessel segments in the mouse brain and ear in response to phenylephrine. B1 and B2 are brain vessel segments marked in the close-up in (a), and E1 is an ear vessel segment marked in (f). While the diameter of E1 steadily decreased after the injection, the diameter of B1 remained constant and the blood perfusion in B2 stopped.
Phenylephrine does not penetrate the BBB, but it does increase systemic blood pressure, and thereby increases blood flow velocity to the brain [25]. The brain vasculature reacts by constricting so that cerebral blood flow is kept constant (this activity is not dependent on phenylephrine, but is a normal reactive change). Therefore, we think the turnoff of cerebral vessels was a reactive vasoconstriction caused by an increase in systemic blood pressure.
As a comparison, we also imaged the vasoactive effect of phenylephrine on the blood vessels in the mouse ear, where the vascular autoregulation system is much less developed [Fig. 5f]. After phenylephrine administration, we observed a clear systemic vasoconstriction in the mouse ear [Video 4]. While the trunk vessels showed an average decrease in volume of ~30%, the small vessels had a volumetric decrease of ~60% (Fig. 5g and 5h), which in turn confirmed the counter-vasoactive effect of CA in the brain.
4 Discussion
The pathways of cortical microhemodynamics are closely coupled in neuronal activity [26]. The vasculature network nourishing the mammalian cortex is highly interconnected with extensive redundant connections. Cortical microhemorrhage and occlusion in aged brains, so-called mini-strokes, do not produce acute clinical stroke symptoms, but they are nevertheless closely linked to cognitive decline and dementia. Blood flow redistribution after microhemorrhage and occlusion is a crucial mechanism that mitigates the adverse effects of vessel obstruction, which otherwise can induce severe brain damage via ischemia. Imaging the hemodynamic response to mini-strokes can provide information leading to a deeper understanding of stroke mechanisms. CA plays another important role in maintaining adequate and stable blood flow in the brain. Impaired cerebral autoregulation is clinically used as a diagnostic indication of brain cancers and many neurological disorders [27].
In this study, we demonstrated high-speed OR-PAM of microhemorrhage and CA. Using endogenous contrast, OR-PAM has high spatial-temporal resolution, enabling imaging the microvasculature of the mouse brain through the intact skull, and observing the hemodynamic responses evoked by various stimulations. Although other biomedical imaging modalities have demonstrated similarly high imaging speeds, they usually have either limited spatial resolution or a small FOV. With each laser pulse, OR-PAM can acquire a one-dimensional, depth-resolved image. Hence, it requires only two-dimensional scanning to acquire a volumetric image. The imaging speed of OR-PAM can be further improved if an ultrasonic transducer array is employed [28, 29]. Moreover, we can implement multiwavelength OR-PAM to quantify the oxygen saturation of hemoglobin and to target specific biomarkers. With a high volumetric scanning speed over a large FOV, high-speed OR-PAM could also quantitatively assess the energy metabolic information of cortical regions [30]. With its highly scalable spatial resolution and imaging speed, OR-PAM is a promising tool for neurophysiological studies.
Supplementary Material
Acknowledgments
The authors appreciate Prof. James Ballard’s close reading of the manuscript. We also thank Peng Hu for image processing. This work was sponsored by NIH grants R01 CA186567 (NIH Director’s Transformative Research Award), and R01 CA159959 (for L. V. Wang), and NSF grant IDBR-1255921 (for J. Zou). L. V. Wang has a financial interest in Microphotoacoustics, Inc., which, however, did not support this work.
Footnotes
Additional supporting information may be found in the online version of this article at the publisher’s website.
References
- 1.Pouratian N, Sheth SA, Martin NA, Toga AW. Trends Neurosci. 2003;26:277–282. doi: 10.1016/S0166-2236(03)00070-5. [DOI] [PubMed] [Google Scholar]
- 2.Hielscher AH. Curr. Opin. Biotechnol. 2005;16:79–88. doi: 10.1016/j.copbio.2005.01.002. [DOI] [PubMed] [Google Scholar]
- 3.Balaban RS, Hampshire VA. ILAR J. 2001;42:248–262. doi: 10.1093/ilar.42.3.248. [DOI] [PubMed] [Google Scholar]
- 4.Kim DS, Duong TQ, Kim SG. Nat. Neurosci. 2000;3:164–169. doi: 10.1038/72109. [DOI] [PubMed] [Google Scholar]
- 5.Hillman EM, Devor A, Bouchard MB, Dunn AK, Krauss GW, Skoch J, Bacskai BJ, Dale AM, Boas DA. Neuroimage. 2007;35:89–104. doi: 10.1016/j.neuroimage.2006.11.032. [DOI] [PMC free article] [PubMed] [Google Scholar]
- 6.Sakadzic S, Roussakis E, Yaseen MA, Mandeville ET, Srinivasan VJ, Arai K, Ruvinskaya S, Devor A, Lo EH, Vinogradov SA, Boas DA. Nat. Methods. 2010;7:755–759. doi: 10.1038/nmeth.1490. [DOI] [PMC free article] [PubMed] [Google Scholar]
- 7.Baran U, Wang RK. Neurophotonics. 2016;3:010902. doi: 10.1117/1.NPh.3.1.010902. [DOI] [PMC free article] [PubMed] [Google Scholar]
- 8.Lin L, Zhang P, Xu S, Shi J, Li L, Yao J, Wang L, Zou J, Wang LV. J. Biomed. Opt. 2016;22:041002. [Google Scholar]
- 9.Wang LV. Nat. Photonics. 2009;3:503–509. doi: 10.1038/nphoton.2009.157. [DOI] [PMC free article] [PubMed] [Google Scholar]
- 10.Yao J, Kaberniuk AA, Li L, Shcherbakova DM, Zhang R, Wang L, Li G, Verkhusha VV, Wang LV. Nat. Methods. 2016;13:67–73. doi: 10.1038/nmeth.3656. [DOI] [PMC free article] [PubMed] [Google Scholar]
- 11.Wang X, Pang Y, Ku G, Xie X, Stoica G, Wang LV. Nat. Biotechnol. 2003;21:803–806. doi: 10.1038/nbt839. [DOI] [PubMed] [Google Scholar]
- 12.Mallidi S, Luke GP, Emelianov S. Trends Biotechnol. 2011;29:213–221. doi: 10.1016/j.tibtech.2011.01.006. [DOI] [PMC free article] [PubMed] [Google Scholar]
- 13.Hai P, Yao J, Maslov KI, Zhou Y, Wang LV. Opt. Lett. 2014;39:5192–5195. doi: 10.1364/ol.39.005192. [DOI] [PMC free article] [PubMed] [Google Scholar]
- 14.Simandoux O, Stasio N, Gateau J, Huignard JP, Moser C, Psaltis D, Bossy E. Appl. Phys. Lett. 2015;106:094102. [Google Scholar]
- 15.Maslov KI, Zhang HF, Hu S, Wang LV. Opt. Lett. 2008;33:929–931. doi: 10.1364/ol.33.000929. [DOI] [PubMed] [Google Scholar]
- 16.Kim JY, Lee C, Park K, Lim G, Kim C. Scintific Reports. 2015;5:07932. doi: 10.1038/srep07932. [DOI] [PMC free article] [PubMed] [Google Scholar]
- 17.Yao J, Huang CH, Wang L, Yang JM, Gao L, Maslov KI, Zou J, Wang LV. J. Biomed. Opt. 2012;17:080505. doi: 10.1117/1.JBO.17.8.080505. [DOI] [PMC free article] [PubMed] [Google Scholar]
- 18.Yao J, Wang L, Yang JM, Maslov KI, Wong TTW, Li L, Huang CH, Zou J, Wang LV. Nat. Methods. 2015;12:407–410. doi: 10.1038/nmeth.3336. [DOI] [PMC free article] [PubMed] [Google Scholar]
- 19.American National Standard Institute. ANSI. 2007:Z135.1. [Google Scholar]
- 20.Rosidi NL, Zhou J, Pattanaik S, Wang P, Jin W, Brophy M, Olbricht WL, Nishimura N, Schaffer CB. Plos One. 2011;6:e26612. doi: 10.1371/journal.pone.0026612. [DOI] [PMC free article] [PubMed] [Google Scholar]
- 21.Schaffer CB, Friedman B, Nishimura N, Schroeder LF, Tsai PS, Ebner FF, Lyden PD, Kleinfeld D. Plos Biology. 2006;4:258–270. doi: 10.1371/journal.pbio.0040022. [DOI] [PMC free article] [PubMed] [Google Scholar]
- 22.Bok S, Wang T, Lee CJ, Jeon SU, Kim YE, Kim J, Hong BJ, Yoon CJ, Kim S, Lee SH, Kim HJ, Kim IH, Kim KH, Ahn GO. Biomed. Opt. Express. 2015;6:3303–3312. doi: 10.1364/BOE.6.003303. [DOI] [PMC free article] [PubMed] [Google Scholar]
- 23.Singer BH, Newstead MW, Zeng X, Cooke CL, Thompson RC, Singer K, Ghantasala R, Parent JM, M J, Murphy GG, Iwashyna TJ, Standiford TJ. PLoS One. 2016;11:e0149136. doi: 10.1371/journal.pone.0149136. [DOI] [PMC free article] [PubMed] [Google Scholar]
- 24.Song PS, Koka P, Prezelin BB, Haxo FT. Biochemistry. 1976;15:4422–4427. doi: 10.1021/bi00665a012. [DOI] [PubMed] [Google Scholar]
- 25.Meng L, Gelb AW, Alexander BS, Cerussi AE, Tromberg BJ, Yu Z, Mantulin WW. Br. J. Anaesth. 2012;108:815–822. doi: 10.1093/bja/aes023. [DOI] [PMC free article] [PubMed] [Google Scholar]
- 26.O’Herron P, Chhatbar PY, Levy M, Shen ZM, Schramm AE, Lu ZY, Kara P. Nature. 2016;534:378–382. doi: 10.1038/nature17965. [DOI] [PMC free article] [PubMed] [Google Scholar]
- 27.Paulson OB, Strandgaard S, Edvinsson L. Cerebrovasc. Brain Metabol. Rev. 1990;2:161–192. [PubMed] [Google Scholar]
- 28.Song L, Maslov KI, Shung KK, Wang LV. J. Biomed. Opt. 2010;15:021303. doi: 10.1117/1.3333545. [DOI] [PMC free article] [PubMed] [Google Scholar]
- 29.Hajireza P, Harrison T, Forbrich A, Zemp R. J. Biomed. Opt. 2013;18:090502. [Google Scholar]
- 30.Yao J, Maslov KI, Wang LV. SPIE Proceddings. 2011;7899 [Google Scholar]
Associated Data
This section collects any data citations, data availability statements, or supplementary materials included in this article.