In yeast, Hmo1p is important for communicating target of rapamycin (TOR) kinase activity to downstream targets. Results show that TOR kinase controls expression of the HMO1 gene and that an important component of this regulation is its direct association with the HMO1 gene. The implications are that TOR kinase may have more elaborate nuclear functions.
Abstract
The mechanistic target of rapamycin complex 1 (mTORC1) senses nutrient sufficiency and cellular stress. When mTORC1 is inhibited, protein synthesis is reduced in an intricate process that includes a concerted down-regulation of genes encoding rRNA and ribosomal proteins. The Saccharomyces cerevisiae high-mobility group protein Hmo1p has been implicated in coordinating this response to mTORC1 inhibition. We show here that Tor1p binds directly to the HMO1 gene (but not to genes that are not linked to ribosome biogenesis) and that the presence of Tor1p is associated with activation of gene activity. Persistent induction of DNA double-strand breaks or mTORC1 inhibition by rapamycin results in reduced levels of HMO1 mRNA, but only in the presence of Tor1p. This down-regulation is accompanied by eviction of Ifh1p and recruitment of Crf1p, followed by concerted dissociation of Hmo1p and Tor1p. These findings uncover a novel role for TOR kinase in control of gene activity by direct association with an RNA polymerase II–transcribed gene.
INTRODUCTION
Mechanistic target of rapamycin (TOR) kinase is an evolutionarily conserved serine/threonine protein kinase that may be incorporated into two functionally distinct complexes, mTORC1 and mTORC2 (Loewith and Hall, 2011). In Saccharomyces cerevisiae, mTORC1 contains either Tor1p or Tor2p in complex with Kog1, Lst8, and Tco89, and the complex is sensitive to rapamycin, which inhibits mTORC1 activity and mimics responses to nutrient limitation (Loewith et al., 2002; Wedaman et al., 2003). In contrast, mTORC2 contains Tor2p and is generally insensitive to rapamycin (Wullschleger et al., 2005). mTORC1 appears to be constitutively localized to the vacuole, which is a significant nutrient reservoir, rationalizing this cellular localization (Sturgill et al., 2008; Binda et al., 2009). While mTORC1 is active under nutrient sufficiency and promotes growth by phosphorylating downstream targets and controlling their cellular localization, nutrient starvation and rapamycin treatment results in a significant reduction in protein synthesis, in part by blocking initiation of translation (Barbet et al., 1996; Hardwick et al., 1999; Shamji et al., 2000; Huber et al., 2009). In addition, decreased mTORC1 activity is also associated with various stress conditions, including DNA damage (Reiling and Sabatini, 2006; Urban et al., 2007; Workman et al., 2014; Desantis et al., 2015). The cell cycle arrest that accompanies unrepaired DNA damage must be coordinated with metabolic arrest, and this process requires mTORC1 (Shen et al., 2007; Budanov and Karin, 2008; Dulic, 2013).
Two of the downstream targets of mTORC1, the AGC kinase Sch9p and the transcription factor Sfp1p have been implicated in activating expression of ribosomal protein (RP) genes and genes whose products are involved in ribosomal biogenesis (Ribi genes); together, these genes may account for ∼50% of transcriptional initiation by RNA polymerase (Pol) II (Rudra and Warner, 2004; Martin et al., 2006). In contrast, regulation of some Pol I– and Pol III–transcribed genes may be direct; Tor1p has been shown to bind to the yeast RNA Pol I– and III–transcribed 35S and 5S rRNA genes to activate transcription, whereas nutrient limitation and rapamycin treatment results in dissociation of Tor1p and its exit from the nucleus (Li et al., 2006; Wei et al., 2009). On the RNA Pol III–transcribed 5S rDNA (ribosomal DNA encoding rRNA), chromatin-bound mTORC1 is responsible for regulating phosphorylation of the negative regulator Maf1 (Wei et al., 2009). Direct regulation of transcription by TOR kinase is conserved in mammals, where mTOR was shown to interact with the Pol III transcription factor TFIIIC (Kantidakis et al., 2010; Tsang et al., 2010).
The yeast high-mobility group protein Hmo1p has been implicated in communicating mTORC1 signaling to downstream target genes (Hall et al., 2006; Xiao and Grove, 2009; Panday and Grove, 2017). It binds RP gene promoters and rDNA, and its presence is required for efficient down-regulation of gene activity when mTORC1 is inhibited (Gadal et al., 2002; Hall et al., 2006; Berger et al., 2007). On many RP gene promoters, Hmo1p assembles the transcription factors Forkhead-like 1 (Fhl1p) and Interacts with Fhl1p (Ifh1p) (Hall et al., 2006). A DNA sequence motif found in genes to which Fhl1p and Ifh1p bind, the IFHL motif is required for maximal RP gene transcription (Wade et al., 2004). Hmo1p and Fhl1p mutually promote binding of the other protein; it has been proposed that Fhl1p remains associated and recruits Ifh1p to promote transcription, whereas inhibition of mTORC1 results in nuclear import of phosphorylated Corepressor with Fhl1p (Crf1p), which displaces Ifh1p, resulting in repression of gene activity (Jorgensen et al., 2004; Martin et al., 2004; Schawalder et al., 2004; Wade et al., 2004; Rudra et al., 2005; Zhao et al., 2006). Because Hmo1p promotes binding of Fhl1p, its absence results in an attenuated response to rapamycin. Repression of RP gene expression was also reported to result in dissociation of Hmo1p and a concomitant ∼20–base pair upstream shift of the +1 nucleosome that buries the transcription start site within the nucleosome (Knight et al., 2014; Reja et al., 2015).
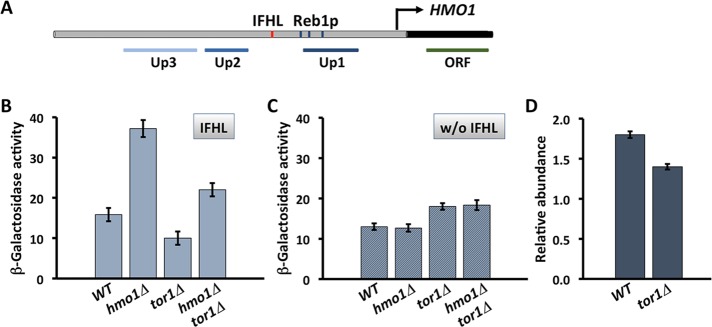
Hmo1p also localizes to its own promoter, and it negatively regulates its own expression. HMO1 promoter activity is likely stimulated by Fhl1p, as evidenced by reduced expression in hmo1Δ cells upon mutation of the IFHL site, which is located ∼605 base pairs upstream of the translational start (Figure 1A) (Xiao et al., 2011). Consistent with this inference, HMO1 promoter activity is reduced in the presence of rapamycin, and this response is attenuated in hmo1Δ. Because Fhl1p binds the HMO1 promoter, centered on the IFHL site, it is conceivable that the mechanism of the HMO1 gene repression that occurs on inhibition of mTORC1 is similar to that proposed for RP genes.
FIGURE 1:
Activity of the HMO1 promoter depends on Tor1p and the IFHL site. (A) Region upstream of HMO1 ORF (black). The IFHL site (red) is centered ∼605 base pairs upstream of the HMO1 start codon and followed by three predicted Reb1p binding sites. Positions of amplicons used in ChIP shown below. (B) Activity of HMO1 promoter using lacZ reporter constructs. (C) Activity of HMO1 promoter using lacZ reporter constructs in which IFHL site is mutated. Activity is reported in Miller units. (D) HMO1 expression in WT and tor1Δ cells. The mRNA levels are reported relative to IPP1 and calculated using the ΔCt method. Data represent mean and SD from three independent experiments.
We show here that Tor1p binds directly to the HMO1 gene to activate expression, particularly in the absence of Hmo1p. Persistent induction of DNA double-strand breaks (DSBs) or inhibition of mTORC1 by rapamycin results in a Tor1p-dependent reduction in HMO1 mRNA levels that is accompanied by fast displacement of Ifh1p and subsequent recruitment of Crf1p, followed by eviction of Hmo1p and Tor1p from the region surrounding the HMO1 transcriptional start. Our data suggest that Tor1p controls gene activity by direct association with the HMO1 gene, indicating that direct regulation of gene activity by promoter-bound TOR kinase includes RNA Pol II–transcribed genes.
RESULTS
Tor1p activates HMO1 expression
Using reporter constructs in which the lacZ gene encoding β-galactosidase is under control of the HMO1 promoter, we previously reported that absence of Hmo1p results in increased promoter activity, whereas overexpression of Hmo1p leads to repression by comparison to wild-type cells (Xiao et al., 2011). Considering that Hmo1p is implicated in coordinating responses to mTORC1 inhibition by rapamycin on rRNA, RP, and HMO1 genes, we created a tor1Δ strain and measured HMO1 promoter activity (Figure 1B). As previously reported, increased promoter activity was observed on deletion of HMO1 (∼2.4-fold), indicating that Hmo1p represses its own expression (Figure 1B). In a tor1Δ background, deletion of HMO1 likewise resulted in increased promoter activity (∼2.2-fold increase in promoter activity in the hmo1Δtor1Δ strain compared with tor1Δ). Deletion of TOR1 reduced gene activity, particularly in cells deleted for HMO1. Measurement of HMO1 transcript levels in wild-type (WT) and tor1Δ cells confirmed the modestly reduced HMO1 expression in tor1Δ cells (∼20%; Figure 1D). This suggests that Tor1p directly or indirectly functions to activate the HMO1 promoter, particularly in the absence of Hmo1p. The data also suggest that Hmo1p-mediated repression of the HMO1 promoter activity occurs regardless of Tor1p.
If HMO1 promoter activity were controlled by mTORC1 activity, and because both Tor1p and Tor2p may be components of mTORC1, the inability of Tor2p to compensate for loss of Tor1p was somewhat unexpected. A cognate site for Fhl1p was previously identified ∼605 base pairs upstream of the HMO1 start codon (IFHL; Figure 1A); Fhl1p was shown to bind preferentially to this genomic location, and its binding was shown to depend on Hmo1p (Xiao et al., 2011). Mutation of this site resulted in failure to activate the HMO1 promoter in the absence of Hmo1p, and deletion of TOR1 did not reduce gene activity (Figure 1C). Taken together, these data suggest that Tor1p-mediated activation of the HMO1 promoter requires the IFHL site and that Hmo1p represses activation by factor(s) that also require the IFHL site.
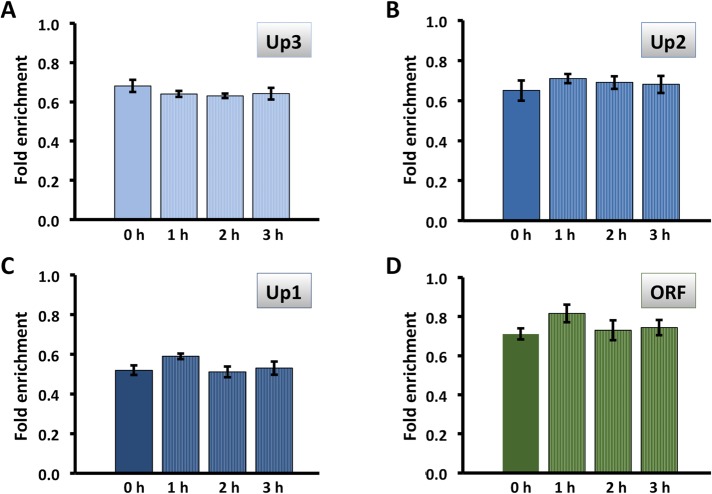
Tor1p binds the HMO1 gene and is required for reduced expression after persistent DSB
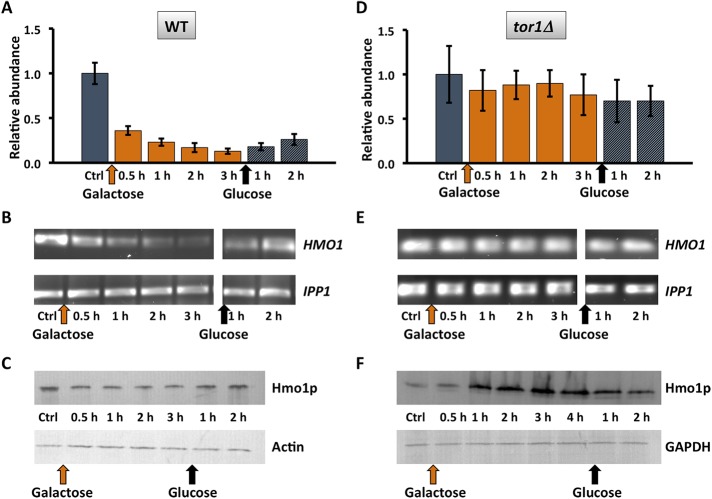
Persistent DNA damage is associated with an mTORC1-dependent reduction in metabolic activity. Hmo1p is also linked to the DNA damage response because it is evicted along with core histones in preparation for DSB repair, and its absence generates a chromatin environment in which repair is faster (Panday et al., 2015, 2017; Panday and Grove, 2016, 2017). A DSB was produced at the mating-type locus MAT, a locus to which Hmo1p associates (Panday et al., 2015), by addition of galactose to induce expression of homothallic switching (HO) endonuclease. As a result, HMO1 mRNA levels were significantly reduced and only slowly recovered upon DNA repair (addition of glucose; Figure 2, A and B). This reduction in gene activity was associated with only a modest decrease in cellular protein content (Figure 2C), perhaps reflecting slow protein turnover. Notably, HMO1 mRNA levels were not significantly affected in tor1Δ cells after persistent DSB, and this resulted in a modest accumulation of Hmo1p (Figure 2, D and F). These differences were not due to different efficiencies of DSB induction as a result of inactivating TOR1; as shown in Figure 3, the levels of DSB induction in WT and tor1Δ cells were not significantly different. We previously reported that inhibition of mTORC1 with rapamycin resulted in reduced HMO1 promoter activity and that this response to rapamycin requires Hmo1p (Xiao et al., 2011). Consistent with this observation, addition of rapamycin resulted in decreased HMO1 expression (Figure 4A), and deletion of TOR1 significantly attenuated the response to rapamycin (Figure 4B). This indicates that the reduction in HMO1 mRNA levels observed following DSB induction or inhibition of mTORC1 by rapamycin requires Tor1p.
FIGURE 2:
Reduced HMO1 expression after DSB induction requires Tor1p. (A, D) HMO1 expression in WT and tor1Δ cells before (Ctrl; gray bar) and after induction of HO endonuclease expression by addition of galactose (orange bars); HO endonuclease creates a DSB at the MAT locus. DNA repair is induced by addition of glucose (gray bars). Expression levels are normalized to that of control cells. Three independent experiments were performed. Error bars represent SD. (B, E) Representative gel images illustrating expression of HMO1 and IPP1 (reference gene) in WT and tor1Δ cells, respectively. (C, F) Western blot corresponding to expression data shown directly above using antibody to the FLAG tags. GAPDH or actin expression levels were used as internal loading controls, and the blots are representative of three independent experiments.
FIGURE 3:
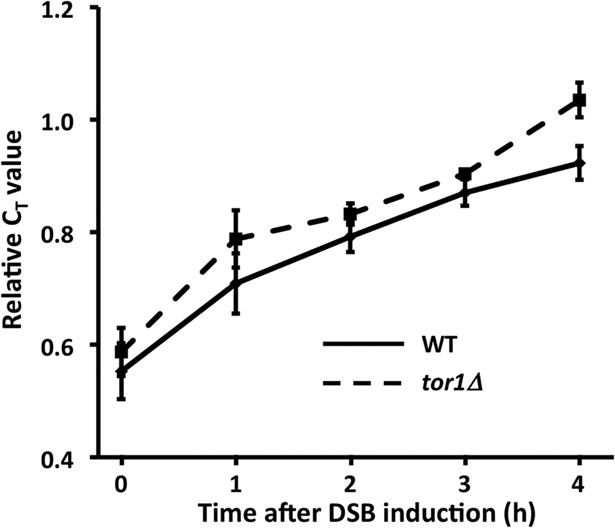
Efficiency of DSB induction. WT (solid line) and tor1Δ cells (dashed line) were collected before and after induction of HO expression by addition of galactose. Primers spanning the break site were used for amplification. Relative CT values are reported (using primers amplifying a fragment of POL5 as reference). An increase in relative CT value reflects reduced amount of template (a greater extent of DSB formation). Error bars represent SD from three measurements.
FIGURE 4:
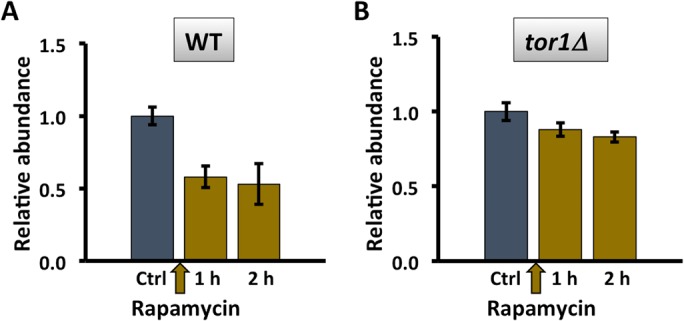
Reduced HMO1 expression after inhibition of mTORC1 activity by rapamycin requires Tor1p. (A, B) HMO1 expression in wild-type (WT) and tor1Δ cells before (Ctrl; gray bars) and after addition of rapamycin (olive bars). Three independent experiments were performed. Error bars represent SD.
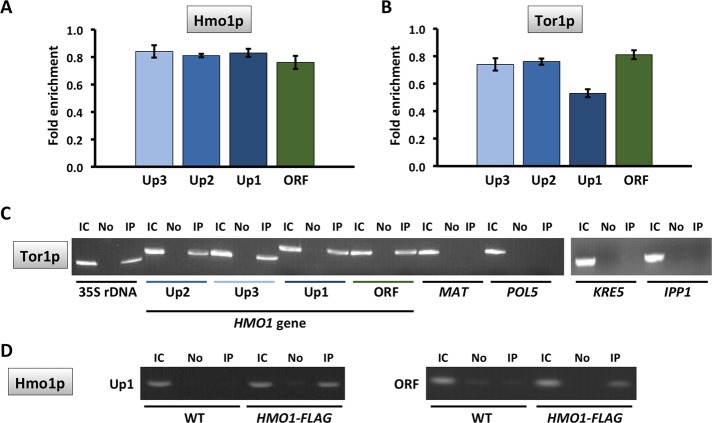
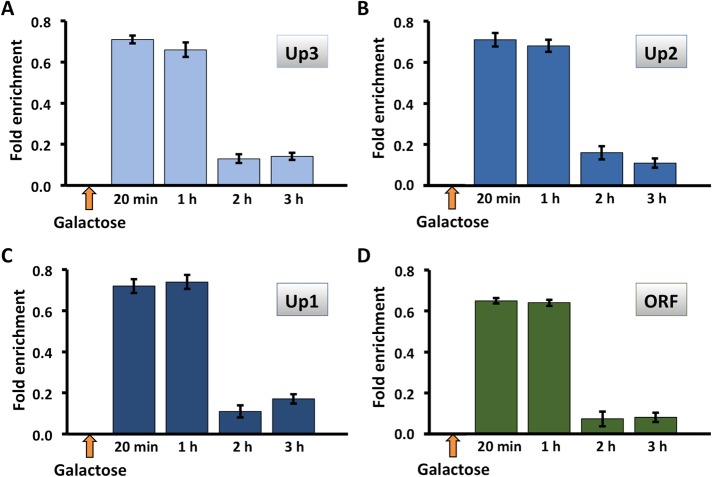
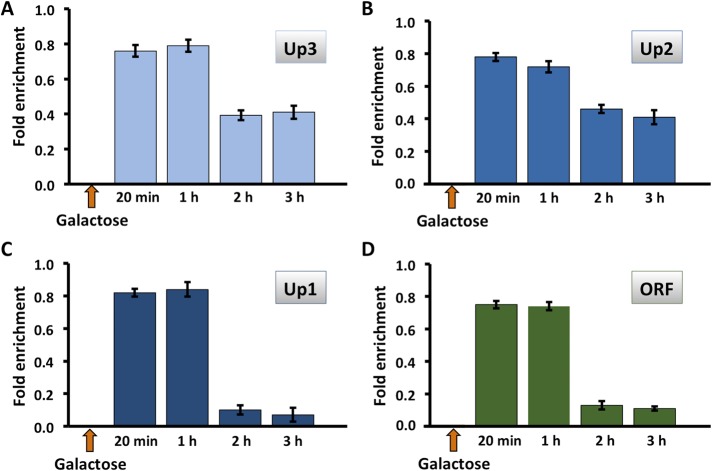
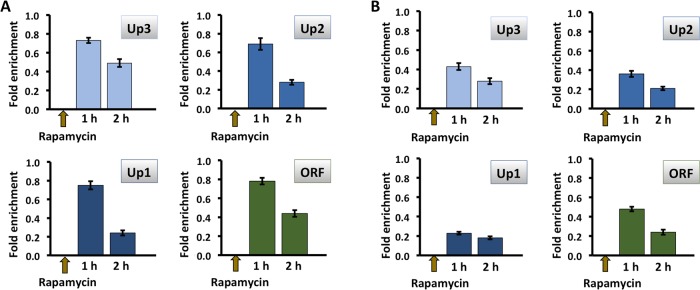
Considering the specific requirement for Tor1p for HMO1 gene regulation and previous reports that Tor1p associates with Pol I– and Pol III–transcribed genes, we used chromatin immunoprecipitation (ChIP) to investigate binding of FLAG-tagged Tor1p to the HMO1 gene. Notably, Tor1p was found throughout the promoter region (from ∼2 kb upstream of the translational start; positions Up1–Up3; Figure 1A) as well as within the coding region (ORF; Figure 5, B and C). Hmo1p, which was previously shown to bind its own promoter (Hall et al., 2006; Xiao et al., 2011), was also detected at all monitored loci (Figure 5A). By comparison, we observed the expected Tor1p accumulation at 35S rDNA (where Hmo1p also binds), whereas Tor1p was undetectable at MAT and at the POL5 and KRE5 promoters (sites to which Hmo1p binds at different levels) and at the IPP1 gene promoter (a site to which Hmo1p binding was reported to be below background levels) (Hall et al., 2006; Panday et al., 2015; Figure 5C). This suggests that Tor1p binding to the HMO1 gene is specific and that binding does not correlate with Hmo1p occupancy. Notably, introduction of a DSB at the MAT locus resulted in eviction of Hmo1p, but only after 2 h of DSB induction (Figure 6). Tor1p was also evicted after 2 h, but most efficiently in the vicinity of the HMO1 start site (Up1) and within the coding region (open reading frame [ORF]; Figure 7). Similarly, both Hmo1p and Tor1p dissociated from the HMO1 gene after prolonged exposure to rapamycin (Figure 8). The dissociation of Tor1p is consistent with reports that it exits the nucleus after nutrient deprivation or rapamycin treatment (Li et al., 2006).
FIGURE 5:
Hmo1p and Tor1p bind the HMO1 gene. Quantification by qRT-PCR of ChIP using antibody to FLAG-tagged Hmo1p (A) or Tor1p (B). Data were normalized to corresponding input control. Primer pairs amplify segments upstream of the HMO1 ORF (Up3–Up1, blue bars; Figure 1A) or within the ORF (green bars). Three independent experiments were performed. Error bars represent SD. (C) ChIP showing Tor1p binding to indicated loci. IC, input control; No, no antibody; IP, immunoprecipitation with anti-FLAG antibody. Hmo1p was previously shown to bind 35S rDNA, MAT, and POL5 at a very low level to KRE5, and not to IPP1 (Hall et al., 2006; Panday et al., 2015; Panday and Grove, 2016). (D) Control for specificity of anti-FLAG antibody; ChIP using WT cells expressing no FLAG-tagged proteins and cells expressing FLAG-tagged Hmo1p. Primer pairs amplifying fragments Up1 (left) and ORF (right) are shown.
FIGURE 6:
Hmo1p is evicted from the HMO1 gene after persistent DSB induction. Quantification by qRT-PCR of ChIP using antibody to FLAG-tagged Hmo1p after addition of galactose to induce DSB. Data were normalized to corresponding input control for each time point. Sites upstream of the HMO1 ORF (Up3–Up1, blue bars) or within the ORF (green bars) were monitored. Three independent experiments were performed. Error bars represent SD.
FIGURE 7:
Tor1p is evicted from the HMO1 gene after persistent DSB induction. Quantification by qRT-PCR of ChIP using antibody to FLAG-tagged Tor1p after addition of galactose to induce DSB. Data were normalized to corresponding input control for each time point. Sites upstream of the HMO1 ORF (Up3–Up1, blue bars) or within the ORF (green bars) were monitored. Three independent experiments were performed. Error bars represent SD.
FIGURE 8:
Binding of Hmo1p and Tor1p to the HMO1 gene is reduced after inhibition of mTORC1 by addition of rapamycin. Quantification by qRT-PCR of ChIP using antibody to FLAG-tagged Hmo1p (A) or Tor1p (B) after addition of rapamycin. Data were normalized to corresponding input control for each time point. Sites upstream of the HMO1 ORF (Up3–Up1, blue bars) or within the ORF (green bars) were monitored. Three independent experiments were performed. Error bars represent SD.
Repression of HMO1 is associated with differential binding of Ifh1p and Crf1p
While HMO1 mRNA levels were significantly reduced after 30 min of DSB induction (Figure 2, A and B), eviction of Hmo1p and Tor1p was not observed until 2 h after addition of galactose to induce expression of HO endonuclease, when gene activity was minimal (Figures 6 and 7). Fhl1p binds the IFHL site located ∼605 base pairs upstream of the HMO1 start codon (Xiao et al., 2011). We therefore investigated whether regulation of HMO1 expression might depend on the Fhl1p-associated factors Ifh1p and Crf1p, focusing on primer pairs Up2 and Up1 that amplify segments that flank the IFHL site (Figure 1A). While Fhl1p remained bound after 2 h of DSB induction (Figure 9A), induction of a DSB for 30 min resulted in significantly reduced Ifh1p binding and a concomitant increase in binding of Crf1p (Figure 9, B and C). Similarly, inhibition of mTORC1 by rapamycin resulted in reduced Ifh1p binding and increased occupancy of Crf1p, whereas Fhl1p binding was unaltered (Figure 10). Consistent with previous reports that Hmo1p and Fhl1p binding is interdependent and that repression of HMO1 promoter activity by rapamycin is attenuated in the absence of Hmo1p (Xiao et al., 2011), little binding of Fhl1p or Ifh1p was detected in an hmo1Δ strain (unpublished data).
FIGURE 9:
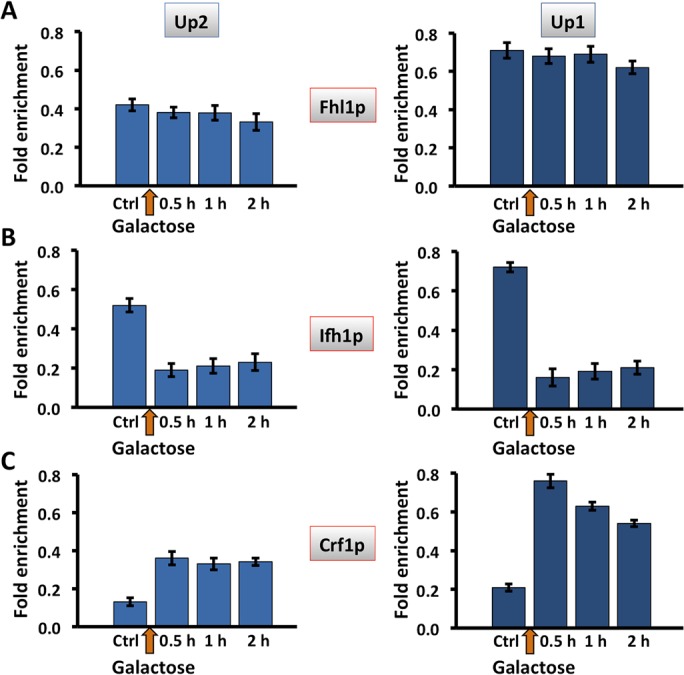
Differential association of transcription factors Ifh1 and Crf1 with the HMO1 gene promoter after DSB induction. Quantification by qRT-PCR of ChIP using antibody to FLAG-tagged Fhl1p (A), Ifh1p (B), or Crf1p (C) after induction of DSB by addition of galactose. Data were normalized to corresponding input control for each time point. Sites flanking the IFHL site (Up2, blue; Up1, dark blue) were monitored. Three independent experiments were performed. Error bars represent SD.
FIGURE 10:
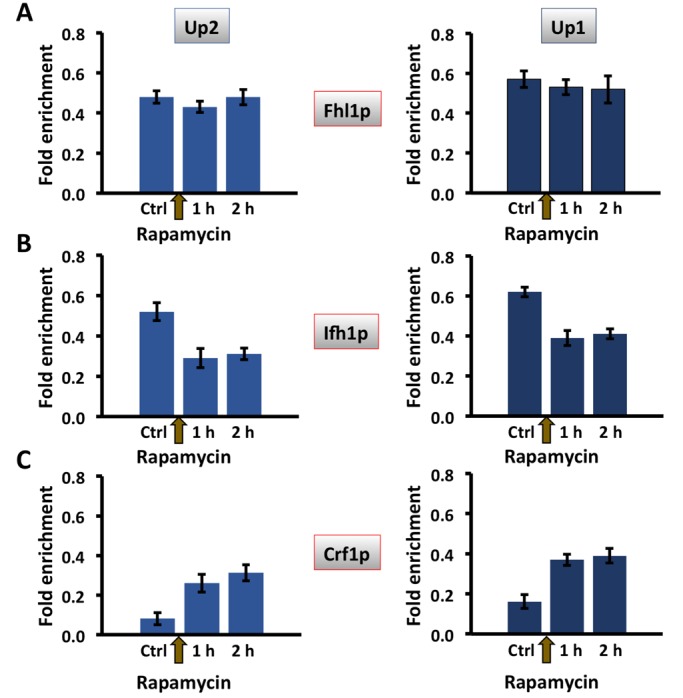
Differential association of transcription factors Ifh1 and Crf1 with the HMO1 gene promoter after inhibition of mTORC1 by addition of rapamycin. Quantification by qRT-PCR of ChIP using antibody to FLAG-tagged Fhl1p (A), Ifh1p (B), or Crf1p (C) after addition of rapamycin. Data were normalized to corresponding input control for each time point. Sites flanking the IFHL site (Up2, blue; Up1, dark blue) were monitored. Three independent experiments were performed. Error bars represent SD.
The increase in binding of corepressor Crf1p and the loss of the activator Ifh1p observed after 30 min of DSB induction and after 1 h of rapamycin treatment (Figures 9 and 10) correlates with reduced HMO1 mRNA levels (Figures 2 and 4) and with reduced HMO1 promoter activity upon addition of rapamycin (determined by β-galactosidase activity of constructs in which the lacZ gene is under control of the HMO1 promoter; Xiao et al., 2011). An interpretation consistent with these data and the reported roles of Crf1p and Ifh1p in controlling RP gene expression is that recruitment of RNA Pol II is compromised as a consequence of changing dynamics of Crf1p and Ifh1p binding. To address this inference experimentally, we performed a kinetic analysis of RNA Pol II binding by comparison with the kinetics of Crf1p and Ifh1p binding. On RPL30, a marked reduction in mRNA levels was seen 15 min after inhibition of mTORC1 with rapamycin with essentially undetectable mRNA levels after 90 min, whereas levels of Ifh1p were reduced to ∼20% of initial levels only 5 min after addition of rapamycin (Crf1p binding was not reported in this study; Schawalder et al., 2004). We therefore monitored binding at early time points after either HO induction or rapamycin addition.
Using primers that amplify a fragment near the IFHL site (Up1), Ifh1p was readily detected before addition of galactose to induce DSB, whereas Crf1p was not (Figure 11A). After 5 min, Ifh1p was barely detectable, consistent with its rapid dissociation from RPL30 after addition of rapamycin. Binding of Crf1p occurred after a delay, and it was clearly detectable 15 min after DSB induction. By comparison, RNA Pol II localized to the HMO1 gene before addition of galactose, as expected (Figure 11B, top row), but it was almost undetectable 10 min after DSB induction. Thus the dynamics of transcription factor binding is consistent with a failure to recruit RNA Pol II effectively if Ifh1p is absent; in addition, our data show that Crf1p recruitment occurs after dissociation of RNA Pol II, perhaps to maintain the repressed state. Similarly, addition of rapamycin led to rapid disappearance of RNA Pol II from the HMO1 promoter, and Pol II was detectable only with primers amplifying a fragment of the ORF after 10 min (Figure 11C).
FIGURE 11:
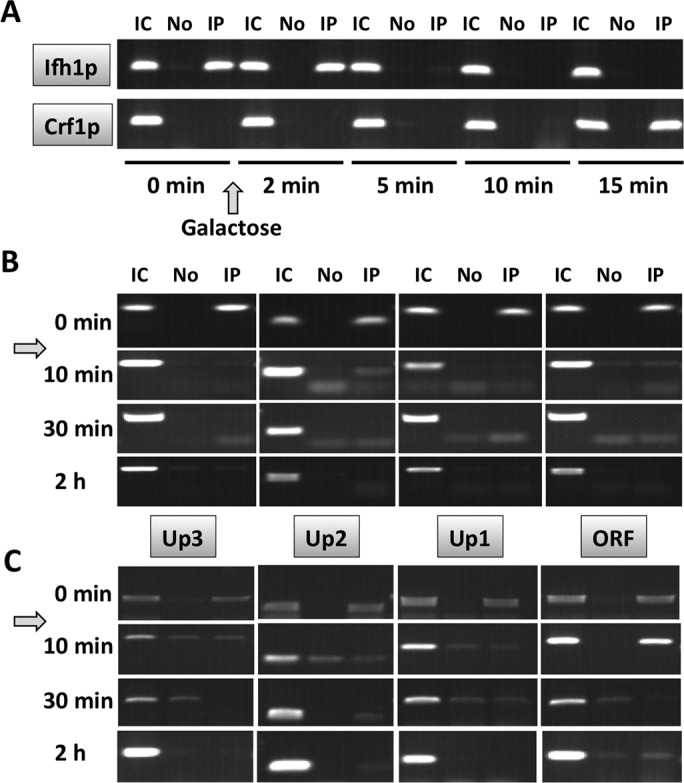
Dynamics of Ifh1p, Crf1p, and RNA Pol II binding to the HMO1 gene. (A) ChIP using antibody to FLAG-tagged Ifh1p or Crf1p before (0 min) and after addition of galactose to induce DSB. Primers amplifying fragment Up1 were used. IC, input control; No, no antibody; IP, immunoprecipitation with anti-FLAG antibody. (B) ChIP using antibody to RNA Pol II before (0 min) and after addition of galactose. (C) ChIP using antibody to RNA Pol II before (0 min) and after addition of rapamycin. Primer pairs amplifying fragments upstream of the HMO1 ORF (Up1–Up3) or the ORF are identified between B and C. IC, input control; No, no antibody; IP, immunoprecipitation with anti–Pol II antibody. Data are representative of duplicate experiments.
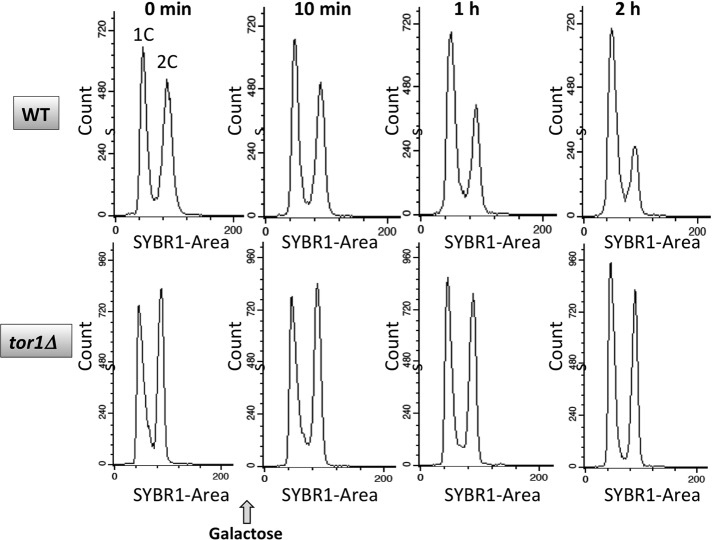
Cell cycle progression is also affected by the activity of mTORC1. To verify that changes in transcription factor binding were not a consequence of a cell cycle arrest, we used flow cytometry to assess cell cycle progression after addition of either galactose or rapamycin to asynchronous cells. As shown in Figure 12, no apparent change was observed 10 min after addition of galactose to induce DSB, the time at which both Ifh1p and RNA Pol II have left the HMO1 gene. After 2 h of DSB induction, the time at which both Hmo1p and Tor1p were seen to dissociate, an accumulation of cells in G1 was observed. We infer that binding of Ifh1p, Crf1p, and RNA Pol II is unrelated to cell cycle progression, whereas it is conceivable that dissociation of Hmo1p and Tor1p is a consequence of a G1 delay.
FIGURE 12:
Flow-cytometric analysis of cell cycle progression after induction of DSB. Total DNA content of asynchronous cells is presented on the x-axis and cell counts on the y-axis. WT (top) and tor1Δ cells (bottom) were collected before (0 min) and at the indicated times after addition of galactose to induce DSB. Data are representative of duplicate experiments.
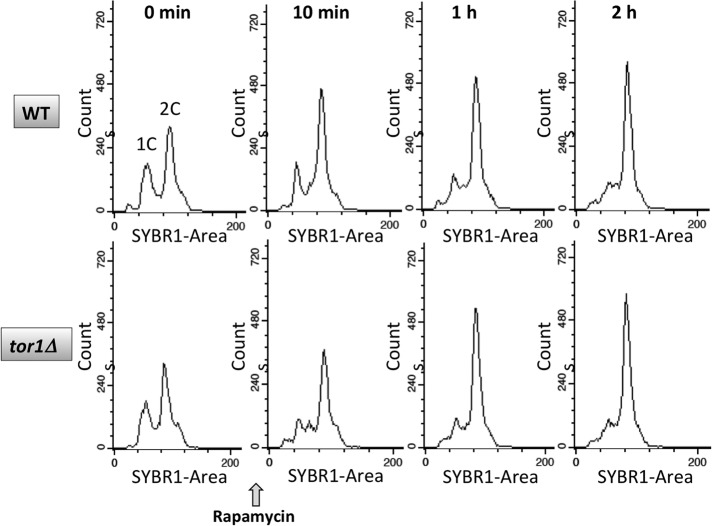
Arrest in G1 has been reported to occur after >6 h of incubation with rapamycin, primarily due to impaired protein synthesis, and a G2/M defect was reported to occur on inhibition of mTORC1 by rapamycin due to mTORC1-mediated regulation of polo-like kinase Cdc5 (Fingar and Blenis, 2004; Bernstein et al., 2007; Nakashima et al., 2008). We also noted a delay of G2/M progression after addition of rapamycin; however, a similar delay was observed in tor1Δ cells, consistent with the expectation that Tor2p can substitute for Tor1p as a component of mTORC1 (Figure 13). In addition, these data indicate that changes in HMO1 mRNA levels on deletion of TOR1 are not due to changes in cell cycle progression compared with WT cells.
FIGURE 13:
Flow-cytometric analysis of cell cycle progression after addition of rapamycin. Total DNA content is presented on the x-axis and cell counts on the y-axis. WT (top) and tor1Δ cells (bottom) were collected before (0 min) and at the indicated times after addition of rapamycin. Data are representative of duplicate experiments.
Excess Hmo1p displaces Reb1p but not Tor1p
The HMO1 promoter also features binding sites for the transcriptional regulator Reb1p (Figure 1A), which often binds near nucleosome-depleted regions (Hartley and Madhani, 2009). No change in Reb1p occupancy was observed after 30 min of DSB induction (Figure 14A), suggesting that Reb1p is not involved in mediating the initial decrease in gene expression. However, prolonged DSB induction (2 h) resulted in reduced Reb1p binding; the timing of reduced Reb1p binding corresponds to dissociation of Hmo1p and Tor1p (Figures 6 and 7). On the basis of the potential contribution of Reb1p to transcriptional activation, we monitored binding of Reb1p in cells in which HMO1 is expressed under control of the strong GAL1 promoter. Overexpression of Hmo1p resulted in modestly reduced Reb1p binding (Figure 14B), suggesting that displacement of Reb1p by excess Hmo1p may contribute to the reduced HMO1 promoter activity observed when Hmo1p is overexpressed. Consistent with the inference that Hmo1p-mediated repression of the HMO1 gene is independent of Tor1p (Figure 1B), overexpression of Hmo1p did not reduce association of Tor1p with the HMO1 gene (Figure 15).
FIGURE 14:
Correlation between Reb1p and Hmo1p occupancy. (A) Quantification by qRT-PCR of ChIP using antibody to FLAG-tagged Reb1p before (Ctrl, dark blue bar) and after induction of DSB by addition of galactose (gray bars). DNA repair was induced by addition of glucose (blue hatched bars). Data were normalized to corresponding input control for each time point. Primer pair amplifying region containing Reb1p sites (Up1) was used. (B) Quantification by qRT-PCR of ChIP using antibody to FLAG-tagged Reb1p before (dark blue bar) and after induction of HMO1 expression (light blue bars); HMO1 was under control of the strong GAL1 promoter. Data were normalized to corresponding input control for each time point. Primer pair–amplifying region containing Reb1p sites (Up1) was used.
FIGURE 15:
Overexpression of Hmo1p does not result in displacement of Tor1p. Quantification by qRT-PCR of ChIP using antibody to FLAG-tagged Tor1p before (solid bars) and after induction of HMO1 expression (striped bars); HMO1 was under control of the strong GAL1 promoter. Data were normalized to corresponding input control for each time point. Three independent experiments were performed. Error bars represent SD.
DISCUSSION
Tor1p associates with the HMO1 gene to activate transcription
mTORC1 controls transcription by all three nuclear RNA polymerases. In yeast, mTORC1 associates to a significant extent with the limiting membrane of the vacuole (the primary nutrient reservoir in yeast and the equivalent of lysosomes in higher eukaryotes), where it phosphorylates one of the main downstream targets, Sch9p, during nutrient sufficiency to activate downstream functions (Urban et al., 2007; Jin et al., 2014). Inactivation of mTORC1 has been linked to reduced expression of RP genes by a mechanism in which mTORC1 promotes phosphorylation of Crf1p by the cytoplasmic serine/threonine protein kinase Yak1p, which leads to localization of phosphorylated Crf1p to the nucleus, where it replaces Ifh1p. In addition, direct phosphorylation of the transcription factor Sfp1p by mTORC1 promotes its nuclear localization and binding to RP gene promoters, whereas rapamycin treatment results in Sfp1p dephosphorylation and its export from the nucleus (Jorgensen et al., 2004; Marion et al., 2004; Lempiäinen et al., 2009).
By contrast, TOR kinase from both yeast and mammals has been shown to associate directly with the RNA Pol I– and Pol III–transcribed rRNA genes in a nutrient-dependent manner, perhaps functioning to phosphorylate specific transcription factors or components of the transcription machinery. Our data suggest that TOR kinases likewise have a direct role in control of RNA Pol II–transcribed genes. Tor1p associates directly with the HMO1 gene (Figure 5, B and C), and it activates transcription, provided the IFHL site is present (Figure 1, B and C). While the mechanism by which Tor1p is recruited to the HMO1 gene is unclear, we note that HMO1 promoter activity is reduced in the absence of Tor1p, regardless of the presence of Hmo1p; we therefore infer that Tor1p is unlikely to be recruited by direct interaction with Hmo1p. Absence of Hmo1p results in significantly reduced binding of Fhl1p to the IFHL site (Xiao et al., 2011); however, we cannot rule out that residual Fhl1p binding may be sufficient to recruit Tor1p. It is also probable that the IFHL site is required not for Tor1p recruitment but for binding of a target for the TOR kinase.
During nutrient sufficiency, expression of HMO1 is repressed by Hmo1p, with overexpression of Hmo1p associated with further repression (Figure 1B; Xiao et al., 2011). Because binding of the transcription factor Reb1p is reduced under conditions of Hmo1p overexpression (Figure 14B), we speculate that accumulation of excess Hmo1p on the HMO1 gene may displace Reb1p and therefore contribute to decreased gene activity, perhaps by forcing a repressive localization of the +1 nucleosome. This negative-feedback loop may ensure that cellular levels of Hmo1p remain optimal; because Hmo1p stabilizes chromatin, excess Hmo1p may result in slower rates of chromatin remodeling and, therefore, compromised cellular function. That Reb1p dissociates after prolonged DSB induction when HMO1 expression levels are very low is consistent with its role as an activator (Figure 14A).
Tor1p is required for decreased HMO1 expression during stress
Both DSB induction and treatment with rapamycin results in reduced HMO1 mRNA levels (Figures 2 and 4). The initial reduction in mRNA levels upon DSB induction correlates with reduced Ifh1p binding and recruitment of Crf1p, and the dissociation of Ifh1p is followed by dissociation of RNA Pol II, suggesting that Ifh1p is a required activator for HMO1 expression (Figures 9 and 11, A and B). The delayed binding of Crf1p would be consistent with the need to import phosphorylated Crf1p into the nucleus. A similar response is also associated with rapamycin-mediated reduction in gene expression (Figures 10 and 11C). Notably, the reduced HMO1 mRNA levels characteristic of cells experiencing a DSB or rapamycin treatment are not seen in tor1Δ cells. This suggests that inhibition of a cytoplasmic (vacuolar) mTORC1 pool in which either Tor1p or Tor2p may be incorporated is unlikely to be sufficient for the observed change in mRNA levels. Assuming that inhibition of cytoplasmic mTORC1 is required for Crf1p phosphorylation and its accumulation in the nucleus as previously proposed (Martin et al., 2004; Schawalder et al., 2004), the failure to elicit a decrease in mRNA levels in the absence of Tor1p is intriguing and may suggest a need for promoter-bound kinase in maintaining the phosphorylation state of key transcription factors, thus rationalizing the binding of Tor1p to the HMO1 gene. Such transcription factors could include Sfp1p; Sfp1p is mainly localized in the nucleus during balanced growth, and it interacts directly with mTORC1, which was interpreted to suggest the existence of a nuclear pool of mTORC1 (Lempiäinen et al., 2009).
Repression of RP gene expression leads to dissociation of Hmo1p, while Fhl1p remains bound, an event that results in a movement of the +1 nucleosome, suggesting that Hmo1p is important for correct assembly of the preinitiation complex (Reja et al., 2015). Similarly, the dissociation of both Hmo1p and Tor1p from the HMO1 gene correlated with the lowest level of HMO1 expression (Figures 2, 6, and 7). These observations reveal a previously unappreciated function of TOR kinase in direct control of transcription by RNA Pol II, and they raise the possibility that control of RP or Ribi genes may likewise involve promoter-bound TOR kinase.
MATERIALS AND METHODS
Strains and plasmids
All yeast strains were derived from WT strain DDY3, which is isogenic to W303-1a (MAT a ADE2 his3-11 leu2-3,112 lys2Δ trp1-1 ura3-1 can1-100; Simms et al., 2008). The strain deleted for HMO1 (hmo1Δ) and strains expressing FLAG-tagged Hmo1p or Fhl1p were described previously (Xiao et al., 2011). Strains expressing FLAG-tagged Ifh1p, Crf1p, and Tor1p were created by amplification of the sequence encoding the 3×FLAG-tag and the KanMX6 marker using primers carrying homology to the target genes. PCR products were used for transformation of DDY3 (or hmo1Δ in case of Ifh1-FLAG), followed by selection for resistance to G418. Transformants were confirmed by PCR, and expression of tagged proteins was verified by Western blotting using antibody to the FLAG-tag (F1804; Sigma). Strains tor1Δ and hmo1Δtor1Δ were created by amplification of the TRP1 marker from plasmid pRS424 (Sikorski and Hieter, 1989), and the PCR product was used to transform DDY3 and hmo1Δ cells, followed by selection for tryptophan prototrophy and verification of transformants by PCR and sequencing.
Plasmids pGWt carrying the wild-type HMO1 gene under control of the GAL1 promoter, pHlacZ in which lacZ is expressed under control of the HMO1 promoter, and pHlacZm in which lacZ is expressed under control of the HMO1 promoter lacking the IFHL site were previously described (Xiao et al., 2011). Plasmid expressing HO endonuclease was a gift from J. Haber (Brandeis University) and plasmid expressing FLAG-tagged Reb1p was a gift from D. Donze (Louisiana State University; Wang and Donze, 2016).
High-efficiency transformation
Cells were grown in yeast extract, peptone, dextrose (YPD) at 30°C to OD600 ∼0.8, and the pelleted cells were washed with 1X phosphate-buffered saline (PBS); resuspended in 1X Tris, EDTA, and lithium acetate buffer (TEL); and left on a nutator overnight at room temperature. Cells were pelleted and resuspended in 100 μl 1X TEL per 10 ml culture and incubated at room temperature for 30 min. One hundred microliters of competent cells, 10 μl of carrier DNA, and 1 μg of plasmid DNA were mixed and incubated for 30 min. Seven hundred microliters of 40% polyethylene glycol (PEG) in 1X TEL were added to each tube and incubated at room temperature for 60 min without shaking. Eighty-eight microliters of dimethyl sulfoxide (DMSO) was added to each tube, and the cells were subjected to heat shock at 42°C for 45 min. The cells were spun at 8000 rpm for 30 s, and pellets were washed with 300 μl water and resuspended in 400 μl water. Two hundred microliters was plated on synthetic defined (SD) drop-out media.
β-Galactosidase assay
Cells were grown overnight in selection media and used to inoculate a fresh culture, which was grown to mid–log phase. The OD600 was recorded, and the cells were harvested immediately. An aliquot (1.5 ml) of the culture was centrifuged, the cell pellet was washed with Z buffer (60 mM Na2HPO4, 40 mM NaH2PO4, 10 mM KCl, 1 mM MgSO4, pH 7.0), and the cells were resuspended in 300 µl of Z buffer. One hundred microliters of the cell suspension was transferred to a fresh microcentrifuge tube, and the cells were lysed by freezing/thawing. Z buffer (0.7 ml) containing 0.3% β-mercaptoethanol was placed in reaction tubes and blanks, 160 µl of freshly prepared 4 mg/ml 2-nitrophenyl-β-galactoside (ONPG) in Z buffer was added, and samples were incubated at 30°C. Reactions were terminated by addition of 0.4 ml of 1 M Na2CO3, and the elapsed time was recorded. Reactions were clarified by centrifugation for 10 min at 14,000 rpm, and A420 was measured. The β-galactosidase activity was calculated using the following equation: β-galactosidase (Miller) units = 1000 × OD420/(t × V × OD600), where t is elapsed time and V is assayed culture volume (0.5 ml).
RNA isolation and in vivo gene expression
Cells were grown at 30°C to OD600 ∼0.8. One milliliter of culture was removed to extract RNA. Cells were mixed with ice-cold diethyl pyrocarbonate (DEPC)-treated water and centrifuged, and the pellet was frozen at −80°C. Total RNA was isolated using the illustra RNAspin Mini Isolation kit (GE Healthcare). Contaminating DNA was removed using Turbo DNase (Ambion), and absence of DNA was verified by PCR. RNA was quantified using NanoDrop (Thermo Scientific). The cDNA was prepared from 500 ng total RNA using 1X AMV reverse transcriptase buffer with 1 mM MgCl2, 1 mM dNTP, and 10 U of AMV reverse transcriptase (New England BioLabs) in a total reaction volume of 25 μl. The mixture was incubated at 42°C for 1 h. A ViiA 7 (Applied Biosystems) was used for quantitative PCR (qPCR) using Taq polymerase for amplification and SYBR Green I (Sigma) for detection. For analysis of expression after DSB induction or rapamycin addition, the data were normalized to the expression level in untreated control; expression of IPP1 (inorganic pyrophosphatase) was used as a reference, and relative expression in WT and tor1Δ cells was calculated using the ΔCt method. Each experiment was repeated three times, and average and SD are reported.
ChIP and PCR analysis
Yeast cells were grown at 30°C in 2% raffinose-containing yeast, peptone (YP) or in synthetic defined (SD) drop-out media to OD600 ∼1.0. A 100 ml culture aliquot was saved as the uninduced sample. Where indicated, galactose was added to the remaining culture to a final concentration of 2% to induce expression of HO endonuclease, or rapamycin was added at a final concentration of 200 ng/ml to inhibit mTORC1, and cells were collected at the indicated times. For repressing HO expression and prevent further DNA damage, 2% glucose was added and cells were harvested at indicated times for ChIP assay. Cells were fixed with 1.2% formaldehyde and incubated at room temperature for 20 min with gentle shaking. Cells were lysed by vortexing with glass beads for 40 min at 4°C in lysis buffer (50 mM HEPES, pH 7.5, 140 mM NaCl, 1% Triton X-100, and 0.1% sodium deoxycholate) containing protease inhibitors pepstatin A (1 μg/ml), leupeptin (1 μg/ml), and phenylmethylsulfonyl fluoride (PMSF; 100 μM). For shearing chromatin into fragments of a predominant size of ∼500 base pairs, the lysate was sonicated six times for 10 s each at 25% amplitude with intermittent chilling of the samples on ice. Sheared chromatin was then divided into 100 μl aliquots for ChIP. The lysate was precleared using protein G–Sepharose beads (GE Healthcare) to reduce nonspecific binding to the beads. For immunoprecipitation, 5 µl of anti-FLAG antibody (F1804; Sigma) or anti-RNA Pol II CTD (05-952; EMD Millipore) was used. PCR products were analyzed on 1.4% agarose gels and stained with ethidium bromide. Quantitative reverse transcriptase PCR (qRT-PCR) was conducted using an ABI ViiA 7 sequence-detection system and SYBR Green for detection. Four primer pairs amplifying different regions of the HMO1 gene were used (Figure 1A), and primer pairs amplifying segments of control loci 18S rDNA, MAT, POL5, KRE5, and IPP1 (Panday et al., 2015; Panday and Grove, 2016) were included where indicated. Data were normalized to corresponding input control at each time point. Each experiment was repeated three times, and average and SD are reported.
Efficiency of DSB induction
For determining the efficiency of DSB induction, qPCR was performed with primer pairs flanking the break site. Cells were grown at 30°C to an optical density at 600 nm of 1.0. An aliquot of cells was removed and used as no-damage control. Galactose was added to the remaining culture to a final concentration of 2% to induce DSB, and cells were collected after 1, 2, 3, and 4 h. Genomic DNA was isolated and used as template for PCR amplification. qPCR was conducted using an ABI ViiA 7 Real Time PCR system and SYBR Green for detection. Experiments were repeated three times, and data are reported as mean with SD. Primer sequences were previously reported (Panday et al., 2015).
Western blot
Cells were grown at 30°C to OD600 ∼0.8. Cells from 50 ml culture were lysed by vortexing with glass beads using lysis buffer (100 mM Tris-HCl, pH 8.0, 300 mM NaCl, 2 mM EDTA, 10% glycerol, 5% Triton X-100) containing 100 mM β-mercaptoethanol, 0.2 mM PMSF, and protease inhibitor cocktail tablet (Roche). Protein concentration was measured using the BCA Protein Assay Kit. Fifteen micrograms of protein was resolved on 12% SDS–PAGE, and the resolved proteins were transferred to a polyvinylidene fluoride membrane. Anti-FLAG (F1804; Sigma) antibody was added at a 1:1000 dilution, and secondary antibody was added at a dilution of 1:5000. As loading controls, anti-GAPDH (ab9485; Abcam) or anti–β-actin (ab184220) was added at 1:5000 dilution. The blots were developed using the CN/DAB substrate kit (ThermoFisher).
Flow-cytometric analysis of cell cycle progression
For determining the impact of rapamycin on the cell cycle, WT and tor1Δ cells were grown in YPD media to OD600 ∼0.8 cells, at which time rapamycin was added (200 ng/ml). Cells were collected at 0 min (before addition), 10 min, 30 min, 1 h, and 2 h. For assessment of the impact of DSB induction on the cell cycle, WT and tor1Δ cells, both transformed with plasmid expressing HO endonuclease, were grown in 2% raffinose-containing SD dropout media (−Ura) to OD600 ∼0.6, at which time galactose was added (2%) to induce DSB. After induction, cells were collected at 0 min (before induction), 10 min, 30 min, 1 h, and 2 h.
Cell pellets (107 cells) were washed with water and centrifuged. For fixing, 3.5 ml of 100% ethanol was added with vortexing to avoid aggregation, and cells were kept at room temperature for 1 h. The fixed cells were centrifuged and washed with 3.5 ml sodium citrate buffer. Cells were centrifuged and pellets were resuspended in 0.5 ml RNase solution (2 mg/ml RNase A in 50 mM Tris, pH 8.0, and 15 mM NaCl). Resuspended cells were kept at 50°C for 2 h. After addition of 20 μl proteinase K (20 mg/ml), cells were incubated for 1 h at 50°C. A 20 μl aliquot of SYBR-Green I (1 X SYBR-Green I in 50 mM Tris, pH 7.4) was added, and cells were incubated overnight at 4°C. After sonication (6 s, 10% power), samples were acquired on a FACScan flow cytometer (BD Biosciences, San Jose, CA) configured for SYBR1 fluorescence measurements. Forward and side-scatter measurements and fluorescence measurements for DNA replication were made using linear amplification. A total of 30,000 cells per sample were analyzed using Cellquest graphics software (BD Biosciences). A dot plot of SYBR1 width versus SYBR1 surface area was analyzed for the removal of aggregates by gating. Single cell–derived histograms were used to examine DNA cell cycle components, G1 and G2.
Acknowledgments
We thank M. Dietrich for assistance with flow cytometry, J. Haber for providing plasmid encoding HO endonuclease, and D. Donze for plasmid encoding FLAG-tagged Reb1p and for many helpful discussions.
Abbreviations used:
- ChIP
chromatin immunoprecipitation
- Crf1p
Corepressor with Fhl1p
- DSB
double-strand break
- Fhl1p
Forkhead-like 1
- HO
homothallic switching
- Ifh1p
Interacts with Fhl1p
- mTOR
mechanistic target of rapamycin
- PMSF
phenylmethylsulfonyl fluoride
- Pol
polymerase
- RP
ribosomal protein
- SD
synthetic defined
- WT
wild type.
Footnotes
This article was published online ahead of print in MBoC in Press (http://www.molbiolcell.org/cgi/doi/10.1091/mbc.E17-01-0024) on July 12, 2017.
REFERENCES
- Barbet NC, Schneider U, Helliwell SB, Stansfield I, Tuite MF, Hall MN. TOR controls translation initiation and early G1 progression in yeast. Mol Biol Cell. 1996;7:25–42. doi: 10.1091/mbc.7.1.25. [DOI] [PMC free article] [PubMed] [Google Scholar]
- Berger AB, Decourty L, Badis G, Nehrbass U, Jacquier A, Gadal O. Hmo1 is required for TOR-dependent regulation of ribosomal protein gene transcription. Mol Cell Biol. 2007;27:8015–8026. doi: 10.1128/MCB.01102-07. [DOI] [PMC free article] [PubMed] [Google Scholar]
- Bernstein KA, Bleichert F, Bean JM, Cross FR, Baserga SJ. Ribosome biogenesis is sensed at the Start cell cycle checkpoint. Mol Biol Cell. 2007;18:953–964. doi: 10.1091/mbc.E06-06-0512. [DOI] [PMC free article] [PubMed] [Google Scholar]
- Binda M, Peli-Gulli MP, Bonfils G, Panchaud N, Urban J, Sturgill TW, Loewith R, De Virgilio C. The Vam6 GEF controls TORC1 by activating the EGO complex. Mol Cell. 2009;35:563–573. doi: 10.1016/j.molcel.2009.06.033. [DOI] [PubMed] [Google Scholar]
- Budanov AV, Karin M. p53 target genes sestrin1 and sestrin2 connect genotoxic stress and mTOR signaling. Cell. 2008;134:451–460. doi: 10.1016/j.cell.2008.06.028. [DOI] [PMC free article] [PubMed] [Google Scholar]
- Desantis A, Bruno T, Catena V, De Nicola F, Goeman F, Iezzi S, Sorino C, Ponzoni M, Bossi G, Federico V, et al. Che-1-induced inhibition of mTOR pathway enables stress-induced autophagy. EMBO J. 2015;34:1214–1230. doi: 10.15252/embj.201489920. [DOI] [PMC free article] [PubMed] [Google Scholar]
- Dulic V. Senescence regulation by mTOR. Methods Mol Biol. 2013;965:15–35. doi: 10.1007/978-1-62703-239-1_2. [DOI] [PubMed] [Google Scholar]
- Fingar DC, Blenis J. Target of rapamycin (TOR): an integrator of nutrient and growth factor signals and coordinator of cell growth and cell cycle progression. Oncogene. 2004;23:3151–3171. doi: 10.1038/sj.onc.1207542. [DOI] [PubMed] [Google Scholar]
- Gadal O, Labarre S, Boschiero C, Thuriaux P. Hmo1, an HMG-box protein, belongs to the yeast ribosomal DNA transcription system. EMBO J. 2002;21:5498–5507. doi: 10.1093/emboj/cdf539. [DOI] [PMC free article] [PubMed] [Google Scholar]
- Hall DB, Wade JT, Struhl K. An HMG protein, Hmo1, associates with promoters of many ribosomal protein genes and throughout the rRNA gene locus in Saccharomyces cerevisiae. Mol Cell Biol. 2006;26:3672–3679. doi: 10.1128/MCB.26.9.3672-3679.2006. [DOI] [PMC free article] [PubMed] [Google Scholar]
- Hardwick JS, Kuruvilla FG, Tong JK, Shamji AF, Schreiber SL. Rapamycin-modulated transcription defines the subset of nutrient-sensitive signaling pathways directly controlled by the Tor proteins. Proc Natl Acad Sci USA. 1999;96:14866–14870. doi: 10.1073/pnas.96.26.14866. [DOI] [PMC free article] [PubMed] [Google Scholar]
- Hartley PD, Madhani HD. Mechanisms that specify promoter nucleosome location and identity. Cell. 2009;137:445–458. doi: 10.1016/j.cell.2009.02.043. [DOI] [PMC free article] [PubMed] [Google Scholar]
- Huber A, Bodenmiller B, Uotila A, Stahl M, Wanka S, Gerrits B, Aebersold R, Loewith R. Characterization of the rapamycin-sensitive phosphoproteome reveals that Sch9 is a central coordinator of protein synthesis. Genes Dev. 2009;23:1929–1943. doi: 10.1101/gad.532109. [DOI] [PMC free article] [PubMed] [Google Scholar]
- Jin N, Mao K, Jin Y, Tevzadze G, Kauffman EJ, Park S, Bridges D, Loewith R, Saltiel AR, Klionsky DJ, Weisman LS. Roles for PI(3,5)P2 in nutrient sensing through TORC1. Mol Biol Cell. 2014;25:1171–1185. doi: 10.1091/mbc.E14-01-0021. [DOI] [PMC free article] [PubMed] [Google Scholar]
- Jorgensen P, Rupes I, Sharom JR, Schneper L, Broach JR, Tyers M. A dynamic transcriptional network communicates growth potential to ribosome synthesis and critical cell size. Genes Dev. 2004;18:2491–2505. doi: 10.1101/gad.1228804. [DOI] [PMC free article] [PubMed] [Google Scholar]
- Kantidakis T, Ramsbottom BA, Birch JL, Dowding SN, White RJ. mTOR associates with TFIIIC, is found at tRNA and 5S rRNA genes, and targets their repressor Maf1. Proc Natl Acad Sci USA. 2010;107:11823–11828. doi: 10.1073/pnas.1005188107. [DOI] [PMC free article] [PubMed] [Google Scholar]
- Knight B, Kubik S, Ghosh B, Bruzzone MJ, Geertz M, Martin V, Denervaud N, Jacquet P, Ozkan B, Rougemont J, et al. Two distinct promoter architectures centered on dynamic nucleosomes control ribosomal protein gene transcription. Genes Dev. 2014;28:1695–1709. doi: 10.1101/gad.244434.114. [DOI] [PMC free article] [PubMed] [Google Scholar]
- Lempiäinen H, Uotila A, Urban J, Dohnal I, Ammerer G, Loewith R, Shore D. Sfp1 interaction with TORC1 and Mrs6 reveals feedback regulation on TOR signaling. Mol Cell. 2009;33:704–716. doi: 10.1016/j.molcel.2009.01.034. [DOI] [PubMed] [Google Scholar]
- Li H, Tsang CK, Watkins M, Bertram PG, Zheng XF. Nutrient regulates Tor1 nuclear localization and association with rDNA promoter. Nature. 2006;442:1058–1061. doi: 10.1038/nature05020. [DOI] [PubMed] [Google Scholar]
- Loewith R, Hall MN. Target of rapamycin (TOR) in nutrient signaling and growth control. Genetics. 2011;189:1177–1201. doi: 10.1534/genetics.111.133363. [DOI] [PMC free article] [PubMed] [Google Scholar]
- Loewith R, Jacinto E, Wullschleger S, Lorberg A, Crespo JL, Bonenfant D, Oppliger W, Jenoe P, Hall MN. Two TOR complexes, only one of which is rapamycin sensitive, have distinct roles in cell growth control. Mol Cell. 2002;10:457–468. doi: 10.1016/s1097-2765(02)00636-6. [DOI] [PubMed] [Google Scholar]
- Marion RM, Regev A, Segal E, Barash Y, Koller D, Friedman N, O’Shea EK. Sfp1 is a stress- and nutrient-sensitive regulator of ribosomal protein gene expression. Proc Natl Acad Sci USA. 2004;101:14315–14322. doi: 10.1073/pnas.0405353101. [DOI] [PMC free article] [PubMed] [Google Scholar]
- Martin DE, Powers T, Hall MN. Regulation of ribosome biogenesis: where is TOR. Cell Metab. 2006;4:259–260. doi: 10.1016/j.cmet.2006.09.002. [DOI] [PubMed] [Google Scholar]
- Martin DE, Soulard A, Hall MN. TOR regulates ribosomal protein gene expression via PKA and the Forkhead transcription factor FHL1. Cell. 2004;119:969–979. doi: 10.1016/j.cell.2004.11.047. [DOI] [PubMed] [Google Scholar]
- Nakashima A, Maruki Y, Imamura Y, Kondo C, Kawamata T, Kawanishi I, Takata H, Matsuura A, Lee KS, Kikkawa U, et al. The yeast Tor signaling pathway is involved in G2/M transition via polo-kinase. PLoS One. 2008;3:e2223. doi: 10.1371/journal.pone.0002223. [DOI] [PMC free article] [PubMed] [Google Scholar]
- Panday A, Grove A. The high mobility group protein HMO1 functions as a linker histone in yeast. Epigenetics Chromatin. 2016;9:13. doi: 10.1186/s13072-016-0062-8. [DOI] [PMC free article] [PubMed] [Google Scholar]
- Panday A, Grove A. Yeast HMO1: linker histone reinvented. Microbiol Mol Biol Rev. 2017;81:e00037-16. doi: 10.1128/MMBR.00037-16. [DOI] [PMC free article] [PubMed] [Google Scholar]
- Panday A, Xiao L, Grove A. Yeast high mobility group protein HMO1 stabilizes chromatin and is evicted during repair of DNA double strand breaks. Nucleic Acids Res. 2015;43:5759–5770. doi: 10.1093/nar/gkv498. [DOI] [PMC free article] [PubMed] [Google Scholar]
- Panday A, Xiao L, Gupta A, Grove A. Control of DNA end resection by yeast Hmo1p affects efficiency of DNA end-joining. DNA Repair (Amst) 2017;53:15–23. doi: 10.1016/j.dnarep.2017.03.002. [DOI] [PubMed] [Google Scholar]
- Reiling JH, Sabatini DM. Stress and mTORture signaling. Oncogene. 2006;25:6373–6383. doi: 10.1038/sj.onc.1209889. [DOI] [PubMed] [Google Scholar]
- Reja R, Vinayachandran V, Ghosh S, Pugh BF. Molecular mechanisms of ribosomal protein gene coregulation. Genes Dev. 2015;29:1942–1954. doi: 10.1101/gad.268896.115. [DOI] [PMC free article] [PubMed] [Google Scholar]
- Rudra D, Warner JR. What better measure than ribosome synthesis? Genes Dev. 2004;18:2431–2436. doi: 10.1101/gad.1256704. [DOI] [PubMed] [Google Scholar]
- Rudra D, Zhao Y, Warner JR. Central role of Ifh1p-Fhl1p interaction in the synthesis of yeast ribosomal proteins. EMBO J. 2005;24:533–542. doi: 10.1038/sj.emboj.7600553. [DOI] [PMC free article] [PubMed] [Google Scholar]
- Schawalder SB, Kabani M, Howald I, Choudhury U, Werner M, Shore D. Growth-regulated recruitment of the essential yeast ribosomal protein gene activator Ifh1. Nature. 2004;432:1058–1061. doi: 10.1038/nature03200. [DOI] [PubMed] [Google Scholar]
- Shamji AF, Kuruvilla FG, Schreiber SL. Partitioning the transcriptional program induced by rapamycin among the effectors of the Tor proteins. Curr Biol. 2000;10:1574–1581. doi: 10.1016/s0960-9822(00)00866-6. [DOI] [PubMed] [Google Scholar]
- Shen C, Lancaster CS, Shi B, Guo H, Thimmaiah P, Bjornsti MA. TOR signaling is a determinant of cell survival in response to DNA damage. Mol Cell Biol. 2007;27:7007–7017. doi: 10.1128/MCB.00290-07. [DOI] [PMC free article] [PubMed] [Google Scholar]
- Sikorski RS, Hieter P. A system of shuttle vectors and yeast host strains designed for efficient manipulation of DNA in Saccharomyces cerevisiae. Genetics. 1989;122:19–27. doi: 10.1093/genetics/122.1.19. [DOI] [PMC free article] [PubMed] [Google Scholar]
- Simms TA, Dugas SL, Gremillion JC, Ibos ME, Dandurand MN, Toliver TT, Edwards DL, Donze D. TFIIIC binding sites function as both heterochromatin barriers and chromatin insulators in Saccharomyces cerevisiae. Eukaryot Cell. 2008;7:2078–2086. doi: 10.1128/EC.00128-08. [DOI] [PMC free article] [PubMed] [Google Scholar]
- Sturgill TW, Cohen A, Diefenbacher M, Trautwein M, Martin DE, Hall MN. TOR1 and TOR2 have distinct locations in live cells. Eukaryot Cell. 2008;7:1819–1830. doi: 10.1128/EC.00088-08. [DOI] [PMC free article] [PubMed] [Google Scholar]
- Tsang CK, Liu H, Zheng XF. mTOR binds to the promoters of RNA polymerase I- and III-transcribed genes. Cell Cycle. 2010;9:953–957. doi: 10.4161/cc.9.5.10876. [DOI] [PMC free article] [PubMed] [Google Scholar]
- Urban J, Soulard A, Huber A, Lippman S, Mukhopadhyay D, Deloche O, Wanke V, Anrather D, Ammerer G, Riezman H, et al. Sch9 is a major target of TORC1 in Saccharomyces cerevisiae. Mol Cell. 2007;26:663–674. doi: 10.1016/j.molcel.2007.04.020. [DOI] [PubMed] [Google Scholar]
- Wade JT, Hall DB, Struhl K. The transcription factor Ifh1 is a key regulator of yeast ribosomal protein genes. Nature. 2004;432:1054–1058. doi: 10.1038/nature03175. [DOI] [PubMed] [Google Scholar]
- Wang Q, Donze D. Transcription factor Reb1 is required for proper transcriptional start site usage at the divergently transcribed TFC6-ESC2 locus in Saccharomyces cerevisiae. Gene. 2016;594:108–116. doi: 10.1016/j.gene.2016.09.004. [DOI] [PubMed] [Google Scholar]
- Wedaman KP, Reinke A, Anderson S, Yates J, III, McCaffery JM, Powers T. Tor kinases are in distinct membrane-associated protein complexes in Saccharomyces cerevisiae. Mol Biol Cell. 2003;14:1204–1220. doi: 10.1091/mbc.E02-09-0609. [DOI] [PMC free article] [PubMed] [Google Scholar]
- Wei Y, Tsang CK, Zheng XF. Mechanisms of regulation of RNA polymerase III-dependent transcription by TORC1. EMBO J. 2009;28:2220–2230. doi: 10.1038/emboj.2009.179. [DOI] [PMC free article] [PubMed] [Google Scholar]
- Workman JJ, Chen H, Laribee RN. Environmental signaling through the mechanistic target of rapamycin complex 1: mTORC1 goes nuclear. Cell Cycle. 2014;13:714–725. doi: 10.4161/cc.28112. [DOI] [PMC free article] [PubMed] [Google Scholar]
- Wullschleger S, Loewith R, Oppliger W, Hall MN. Molecular organization of target of rapamycin complex 2. J Biol Chem. 2005;280:30697–30704. doi: 10.1074/jbc.M505553200. [DOI] [PubMed] [Google Scholar]
- Xiao L, Grove A. Coordination of ribosomal protein and ribosomal RNA gene expression in response to TOR signaling. Curr Genomics. 2009;10:198–205. doi: 10.2174/138920209788185261. [DOI] [PMC free article] [PubMed] [Google Scholar]
- Xiao L, Kamau E, Donze D, Grove A. Expression of yeast high mobility group protein HMO1 is regulated by TOR signaling. Gene. 2011;489:55–62. doi: 10.1016/j.gene.2011.08.017. [DOI] [PubMed] [Google Scholar]
- Zhao Y, McIntosh KB, Rudra D, Schawalder S, Shore D, Warner JR. Fine-structure analysis of ribosomal protein gene transcription. Mol Cell Biol. 2006;26:4853–4862. doi: 10.1128/MCB.02367-05. [DOI] [PMC free article] [PubMed] [Google Scholar]


