

Abstract
Background
The available prognostic models for overall survival (OS) in patients with metastatic urothelial carcinoma (UC) have been derived from clinical trial populations of cisplatin-treated patients.
Objective
To develop a new model based on ‘real world’ patients.
Design, Setting, Participants
Individual patient-level data from 29 centres was collected, including metastatic UC and first-line cisplatin- or carboplatin-based chemotherapy administered between 01/2006 and 01/2011.
Intervention
First-line, platinum-based, combination chemotherapy.
Outcome measures and statistical analysis
The population was randomly split into a development and a validation cohort. Generalized boosted regression modelling was used to screen out irrelevant variables and address multivariable analyses. Two nomograms were built to estimate OS probability, the first based on baseline factors and platinum agent, the second incorporating objective response (OR). The performance of the above nomograms and that of other available models was assessed. We plotted decision curves to evaluate the clinical usefulness of the two nomograms.
Results and limitations
A total of 1,020 patients were analysed (development: 687; validation: 333). In a platinum-stratified Cox model, significant variables for OS were performance status (p<0.001); white blood cell count (p=0.013); body mass index (p=0.003); ethnicity (p=0.012); lung, liver, or bone metastases (p<.001); and prior perioperative chemotherapy (p=0.012). The c-index was 0.660. The distribution of the nomogram scores was associated with OR (p<0.001), and incorporating OR into the model further improved the c-index in the validation cohort (0.670).
Conclusions
We developed and validated two nomograms for OS to be used before and after completion of first-line chemotherapy for metastatic UC.
Patient summary
We proposed two models for estimating OS of patients with metastatic UC receiving firstline, platinum-based chemotherapy. These nomograms have been developed on real world patients who were treated outside of clinical trials and may be used irrespective of the chemotherapeutic platinum agent.
Keywords: Urothelial carcinoma, Overall Survival, Prognosis, Platinum chemotherapy, Nomogram
Introduction
After several decades of therapeutic stagnation in the field of urothelial carcinoma (UC), the advent of immunotherapy, that has just revitalized the therapeutic landscape of the salvage therapy options, hold promise to also change the paradigm in the first-line metastatic setting.[1–4] Therefore, there is growing interest in developing a new prognostic model that would allow investigators to compare results of experimental and standard therapies and that can be easily used in all patients in clinical practice. Many prognostic factors have been proposed over the last 15 years, and many of them were derived from clinical trial cohorts or small single-centre experiences. These factors included performance status (PS) and the presence of visceral (i.e., lung, liver, or bone [LLB]) metastases.[5,6] Subsequently, these characteristics have been augmented with additional factors like albumin, haemoglobin, leukocyte count and number of metastatic sites.[7,8] In general, all models have relied on clinical trial populations and included cisplatin-treated patients only. However, we know that almost half of the patients who require systemic therapy for metastatic UC are not considered eligible for cisplatin treatment for many reasons, and carboplatin is used instead, despite its documented inferior efficacy.[9,10] Currently, there are no prognostic models for carboplatin-treated patients, and some investigators are now questioning the need to separate cisplatin- from carboplatin-treated patients in clinical trials.[11]
If available, a unique prognostic model covering both of these therapeutic options would be more applicable in ‘real world’ practice as well as for better clinical trial planning. An additional benefit would be the possibility of updating the prognostic assessment on the basis of the response to chemotherapy observed in individual patients. The little information that is currently available is one post-treatment nomogram, which is also based on a cisplatin-treated and trial-based patient population.[12]
Patients and Methods
Patient selection
The Retrospective International Study of Invasive/Advanced Cancer of the Urothelium (RISC) is a retrospective study including individual patient-level data from patients with muscle-invasive or advanced UC or non-UC histology who have received systemic therapy in any clinical setting. This contemporary database includes data gathered from January 1st, 2006 to January 1st, 2011 from hospitals in the United States, Europe, Israel, and Canada.
At the end of October 2015, data were extracted to select patients who fulfilled the following characteristics: any tumour primary site, predominant UC histology, de novo metastatic UC (including regional lymph-nodes or distant metastatic disease) or relapse after radical surgery, and administration of cisplatin- or carboplatin-containing chemotherapy in the first-line metastatic setting. Data analysis was performed at the Fondazione IRCCS Istituto Nazionale dei Tumori, Milano, Italy. The present study was approved by the ethics committees at each participating institution.
Statistical analyses
The study objective was to determine prognostic features associated with overall survival (OS) in a large contemporary cohort of patients with metastatic UC treated with platinum-based chemotherapy outside of clinical trials. Accordingly, a nomogram for OS prediction was developed, including selected baseline factors and the platinum agent. An additional aim was to investigate the possible surrogate or prognostic role of the objective response (OR) to first-line chemotherapy to improve nomogram predictions. OR were assessed at each site by the local investigators. Descriptive statistics were used to summarize baseline characteristics, treatments and outcomes. The Kaplan-Meier method was used for estimation of progression-free survival (PFS) and OS, while the reverse Kaplan-Meier method described by Schemper and Smith was used for follow-up quantification.[13]
The analyses were performed using a split-sampling strategy: the overall sample was randomly split with stratification by centre into development and validation cohorts. The former was used for model building, and the latter was used only for model testing purposes.
For model building, generalized boosted regression modelling (GBM) was used first for exploratory purposes, i.e. to screen out irrelevant variables in terms of association with PFS and OS.[14] This tree-based regression approach, which is able to incorporate observations with partially missing data, also provided guidance for the detection of nonlinear effects and interactions among covariates, which was useful for the subsequent phase of analysis. The variables with a relative influence lower than 1 were discarded, while the remaining variables were entered into multivariable Cox proportional hazards (PH) regression models and selected with a p value-based backward procedure. Missing values were substituted with the median in case of continuous covariates or considered a separate class of categorical covariates. PH assumptions were graphically assessed, and the results of the final models were summarized using hazard ratios (HR), together with the corresponding 95% confidence intervals (CI) and Wald’s p-values. Finally, a nomogram was built for estimating 1-, 2- and 5-year OS probability (i.e. RISC1 nomogram). Furthermore, the distribution of the nomogram scores was compared between the distinct OR categories using a Kruskal-Wallis test. A second nomogram for OS was then derived from a Cox model including the first nomogram scores and OR as predictors (i.e. RISC2 nomogram). Performance testing of the two nomograms developed here, as well as the most important published models, was assessed in terms of discrimination (Harrell’s c-index),[15] calibration (calibration plots and slope of “fit2” model by Crowson et al.) [16] and predictive accuracy (Schemper and Henderson Dx statistic).[17] Furthermore, we plotted decision curves to assess the benefits of nomogram-assisted decisions in a clinical context.[18]
Statistical analyses were carried out with SAS (version 9.2, SAS Institute, Cary, NC) and R software (version 3.2.3, R Foundation for Statistical Computing, Vienna, Austria). Statistical significance was set at the conventional 5% two-sided threshold.
Results
Patient characteristics and outcomes
The study flow chart is presented in Figure 1. Of 3,024 registered cases, 1,020 patients, from 29 contributing centres, were suitable for analyses. The main characteristics of the study population are shown in Table 1. There were 639 (62.6%) patients who received cisplatin and 381 (37.4%) who received carboplatin chemotherapy. Kaplan-Meier curves of PFS and OS in the two groups are shown in Supplementary Figure 1A,B. The reasons for carboplatin administration were age (N=51), co-morbidities (N=46), impaired renal function (N=187), and other not specified (N=97). Globally, 813 patients had information on the response to chemotherapy: 85 (10.5%) achieved a complete response (CR) and 285 (35.1%) achieved a partial response (PR), with statistically significant differences between cisplatin and carboplatin (chi-squared test, p<0.001). The OS curves based on response are shown in Supplementary Figure 2A (for carboplatin chemotherapy) and Supplementary Figure 2B (for cisplatin chemotherapy).
Figure 1.

Study flow chart, with counts and reasons for patient selection.
Table 1.
Patient, disease, and treatment characteristics
| No. | % | |
|---|---|---|
| Total number of patients | 1,020 | - |
| Age, years: median (IQR) | 67 (59–73) | |
| Gender | ||
| Male | 802 | 78.6 |
| Female | 211 | 20.7 |
| Missing | 7 | 0.7 |
| Ethnicity | ||
| Not Hispanic/latino, White | 831 | 81.5 |
| Not Hispanic/latino, Black | 29 | 2.8 |
| Hispanic or latino | 81 | 7.9 |
| Other or mixed | 22 | 2.2 |
| Missing | 57 | 5.6 |
| Smoking history | ||
| Current smoker | 220 | 21.5 |
| Former smoker | 359 | 35.2 |
| Never smoker | 226 | 22.2 |
| Missing | 215 | 21.1 |
| Primary tumour location | ||
| Bladder | 828 | 81.2 |
| Renal pelvis or ureter | 165 | 16.2 |
| Urethra | 6 | 0.6 |
| Missing | 21 | 2.0 |
| Histology | ||
| Pure UC | 923 | 90.5 |
| UC with divergent histologies | 79 | 7.7 |
| Missing | 18 | 1.8 |
| BMI, Kg/m2: median (IQR) | 26.3 (23.6–29.1) | |
| ECOG-Performance Status | ||
| 0 | 303 | 29.7 |
| 1 | 392 | 38.4 |
| 2 | 110 | 10.8 |
| >2 | 20 | 2.0 |
| Missing | 195 | 19.1 |
| Baseline Haemoglobin, gr/dL: median (IQR) | 12.2 (10.9–13.5) | |
| Baseline WBC, ×103/μL: median (IQR) | 8.0 (6.3–10.3) | |
| Prior peri-operative systemic therapy | 171 | 16.8 |
| Time from end peri-operative chemotherapy to start first-line, months: median (IQR) | 11.0 (4.8–24.5) | |
| ≤12 months | 71 | 41.5 |
| >12 months | 61 | 35.7 |
| Undetermined | 39 | 22.8 |
| Number of metastatic sites | ||
| 1 | 415 | 40.7 |
| 2 | 306 | 30.0 |
| ≥3 | 254 | 24.9 |
| Missing | 45 | 4.4 |
| Site of metastases | ||
| Pelvic lymph-nodes | 391 | 38.3 |
| Retroperitoneal lymph-nodes | 305 | 29.9 |
| Other lymph-nodes | 183 | 17.9 |
| Lung | 258 | 25.3 |
| Bone | 256 | 25.1 |
| Liver | 189 | 18.5 |
| Pelvic soft tissue | 127 | 12.5 |
| Peritoneum | 30 | 2.9 |
| Brain | 16 | 1.6 |
| Other | 152 | 14.9 |
| Type of first-line chemotherapy | ||
| Cisplatin-based combination | 639 | 62.6 |
| Gemcitabine and cisplatin | 429 | 67.2 |
| MVAC or DD-MVAC | 167 | 26.1 |
| Taxane, cisplatin, and gemcitabine | 9 | 1.4 |
| Other | 34 | 5.3 |
| Carboplatin-based combination | 381 | 37.4 |
| Gemcitabine and carboplatin | 307 | 80.6 |
| Taxane and carboplatin | 39 | 10.2 |
| Taxane, carboplatin, and gemcitabine | 15 | 3.9 |
| Other | 20 | 5.3 |
| Response to first-line chemotherapy | Total: 813 | |
| CR | 85 | 10.5 |
| PR | 285 | 35.1 |
| SD | 215 | 26.4 |
| PD | 228 | 28.0 |
Abbreviations: CR: complete response; ECOG: Eastern Cooperative Oncology Group; IQR: interquartile range; (DD)-MVAC: (dose-dense)-methotrexate, vinblastine, doxorubicin, cisplatin; PD: disease progression; PR: partial response; SD: stable disease; UC: urothelial carcinoma; WBC: white blood cell count.
After median follow-up of 31.6 months (95%CI: 29.4–35.0) there were 853 progression and 664 death events. Of the latter, 594 (89.5%) were due to disease progression, 20 (3%) due to other causes and the remaining due to unknown reasons or toxicity. The data were split into a development sample (N=687, 67.4%) and a validation sample (N=333, 32.6%) targeting a 2:1 ratio, and PFS and OS curves were overlapping in the two groups (Supplementary Figure 3A,B).
Prognostic factors for PFS and OS
The variables selected for analysis of OS after GBM are provided in Supplementary Table 1, and results of the multivariable Cox analyses are shown in Table 2. Within the Cox models, using platinum type as a covariate or a stratification factor did not impact the results in terms of variables retained or model performance. Meaningful interactions between platinum type and the remaining covariates could also be ruled out. On this basis, we decided to present results obtained with stratified Cox models. This choice had the advantage of allowing calculation of a prognostic score independent of treatment and subsequently translating this score into the expected OS by accounting for the platinum type. The c-index for OS was 0.671 (95%CI: 0.641–0.701) in the development cohort and 0.660 (95%CI: 0.617–0.704) in the validation cohort. The results of the model assessments are shown in Table 3. Overall, performance statistics favoured our models (higher c-index and lower Dx, calibration slopes generally consistent with a value of one).
Table 2.
Results of the multivariate, platinum stratified, Cox model for OS (primary endpoint) and PFS using variable selection based on p-value significance. Factors in the final model in the development sample.
| OS | PFS | |||||
|---|---|---|---|---|---|---|
|
| ||||||
| Factor | HR | 95% CI | P* | HR | 95% CI | P* |
|
| ||||||
| WBC (×103/μL): | 0.013 | |||||
| 6.3 (1st Quartile) | Ref. | Ref. | ||||
| 10.3 (3rd Quartile) | 1.10 | 1.02–1.20 | ||||
|
| ||||||
| ECOG-PS: | <0.001 | <0.001 | ||||
| 0 | Ref. | Ref. | Ref. | Ref. | ||
| 1 | 1.76 | 1.37–2.26 | 1.54 | 1.25–1.90 | ||
| ≥2 | 2.39 | 1.69–3.38 | 1.81 | 1.35–2.42 | ||
| Unknown | 1.53 | 1.14–2.06 | 1.38 | 1.07–1.78 | ||
|
| ||||||
| BMI: | 0.003 | |||||
| 23.6 (1st Quartile) | Ref. | Ref. | ||||
| 29.1 (33d Quartile) | 0.80 | 0.69–0.93 | ||||
|
| ||||||
| Lung-Liver-Bone metastases: | <0.001 | <0.001 | ||||
| Yes vs No | 1.68 | 1.38–2.04 | 1.63 | 1.38–1.94 | ||
|
| ||||||
| Ethnicity: | 0.012 | |||||
| Not Hispanic/L, White | Ref. | Ref. | ||||
| Hispanic/L | 1.42 | 1.03–1.97 | ||||
| Not Hispanic/L, Black | 0.77 | 0.39–1.51 | ||||
| Other/mixed | 0.44 | 0.21–0.95 | ||||
| Unknown | 0.62 | 0.36–1.07 | ||||
|
| ||||||
| Prior peri-operative chemotherapy: | ||||||
| Yes vs No | 1.38 | 1.07–1.78 | 0.012 | 1.29 | 1.02–1.63 | 0.033 |
|
| ||||||
| Age | ||||||
| 59 (1st Quartile) | Ref. | Ref. | 0.030 | |||
| 73 (3rd Quartile) | 0.72 | 0.57–0.90 | ||||
Abbreviations: BMI: body-mass index; CI: confidence interval; ECOG-PS: Eastern Cooperative Oncology Group-Performance Status; HR: hazard ratio; L: latino; PFS: progression-free survival; OS: overall survival; WBC: white blood cell count.
P: two-sided Wald test p value.
Table 3.
Assessment on the RISC population of the performance of the available platinum-stratified Cox models for OS, in terms of discrimination (Harrell c-index), calibration (calibration slope) and accuracy (Schemper and Henderson Dx).
| Model | Development cohort | Validation cohort | ||
|---|---|---|---|---|
|
| ||||
| All patients | Cisplatin only | All patients | Cisplatin only | |
|
| ||||
| Bajorin, 1999* [6] | ||||
|
0.643 (0.613–0.672) | 0.622 (0.584–0.660) | 0.623 (0.579–0.666) 0.845 (0.683–1.045) 0.541 |
0.619 (0.563–0.675) 0.762 (0.542–1.071) 0.566 |
|
| ||||
| Apolo, 2013* [7] | ||||
|
0.659 (0.629–0.689) | 0.642 (0.603–0.681) | 0.636 (0.592–0.679) 0.854 (0.695–1.049) 0.540 |
0.641 (0.583–0.698) 0.798 (0.575–1.108) 0.564 |
|
| ||||
| Galsky, 2013* [8] | ||||
|
0.666 (0.635–0.696) | 0.657 (0.617–0.696) | 0.644 (0.600–0.688) 0.841 (0.674–1.049) 0.542 |
0.645 (0.587–0.702) 0.778 (0.553–1.094) 0.564 |
|
| ||||
| Present | ||||
|
0.671 (0.641–0.701) | 0.660 (0.617–0.704) 0.881 (0.715–1.087) 0.534 |
||
Abbreviations: CI: confidence interval; OS: overall survival; RISC: Retrospective International Study of Invasive/Advanced Cancer of the Urothelium.
Type of chemotherapy (cisplatin vs carboplatin) being included into the original model as a covariate.
estimated at 36 months
Development of a nomogram for OS
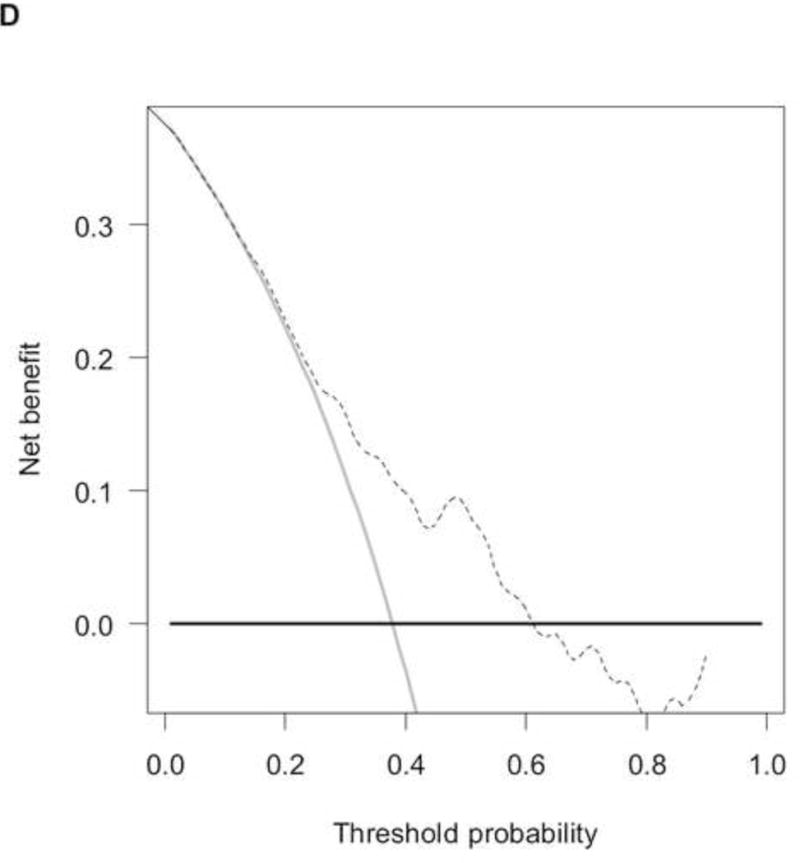
The RISC1 nomogram for estimating 1-, 2-, and 5-year OS is shown in Figure 2A, while 12- or 24-month calibration plots are shown in Figures 2B and 2C, respectively. Decision curves for the OS model are also shown in Figure 2. The plots show that model-based decisions are supported in the range of threshold probabilities of about 20–80% at 12 months (2D) and 50–80% at 24 months (2E).
Figure 2.
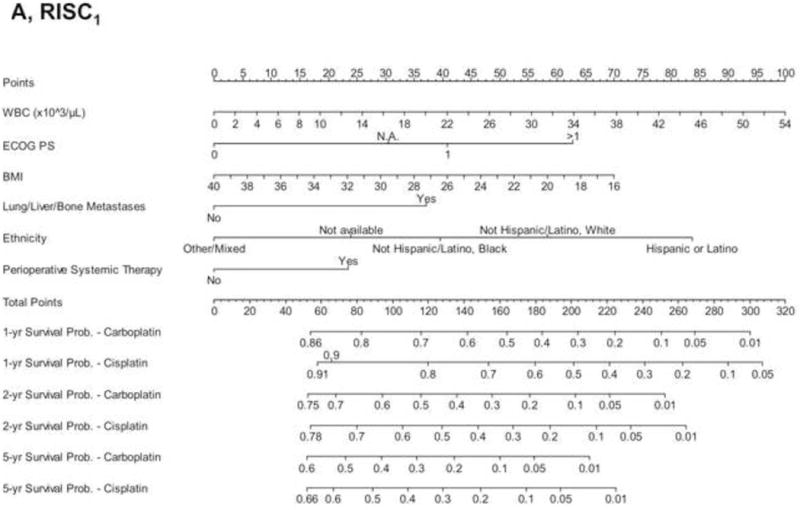
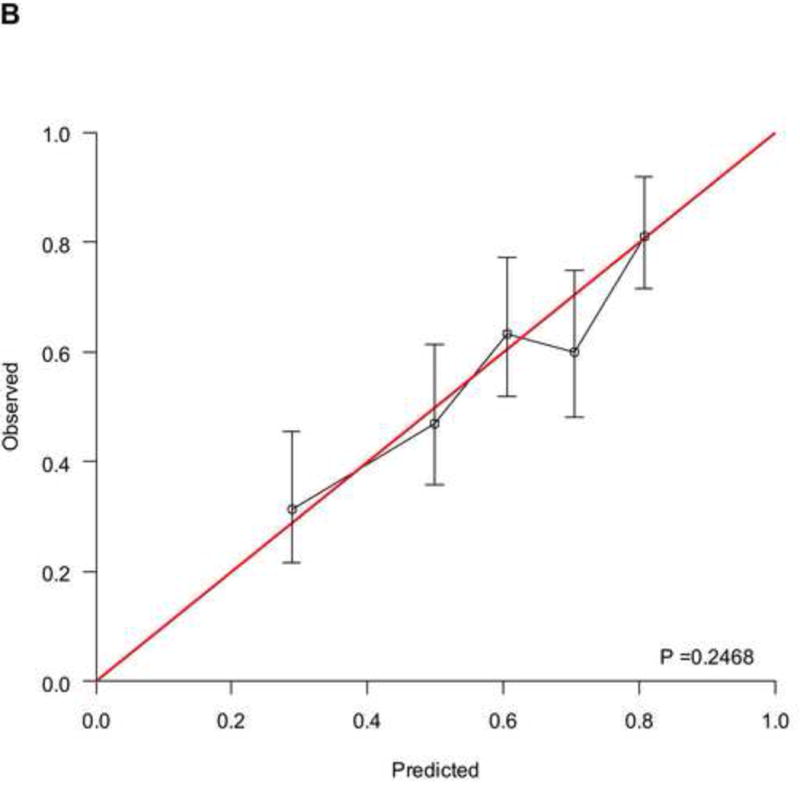
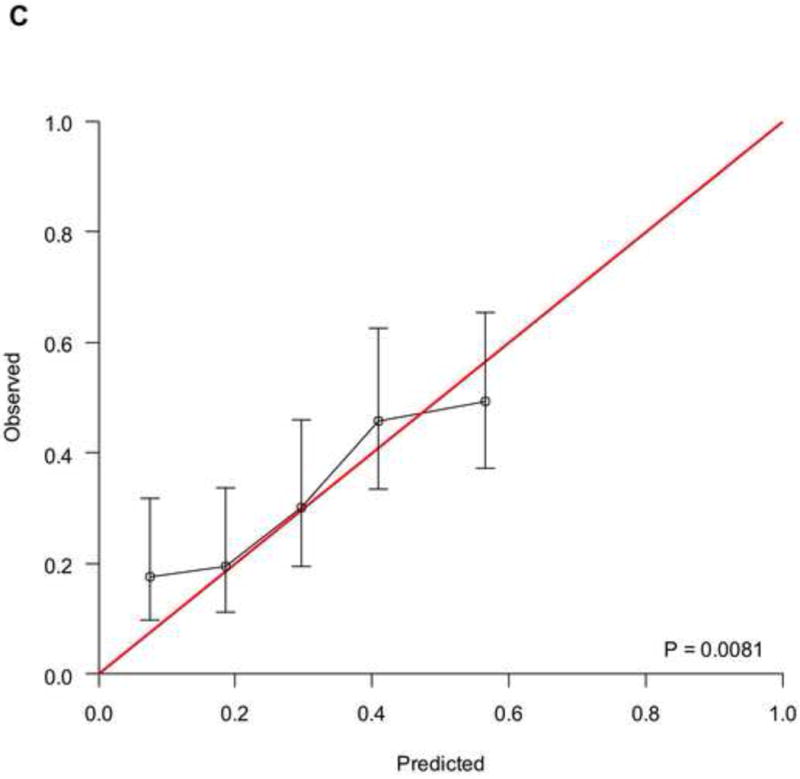
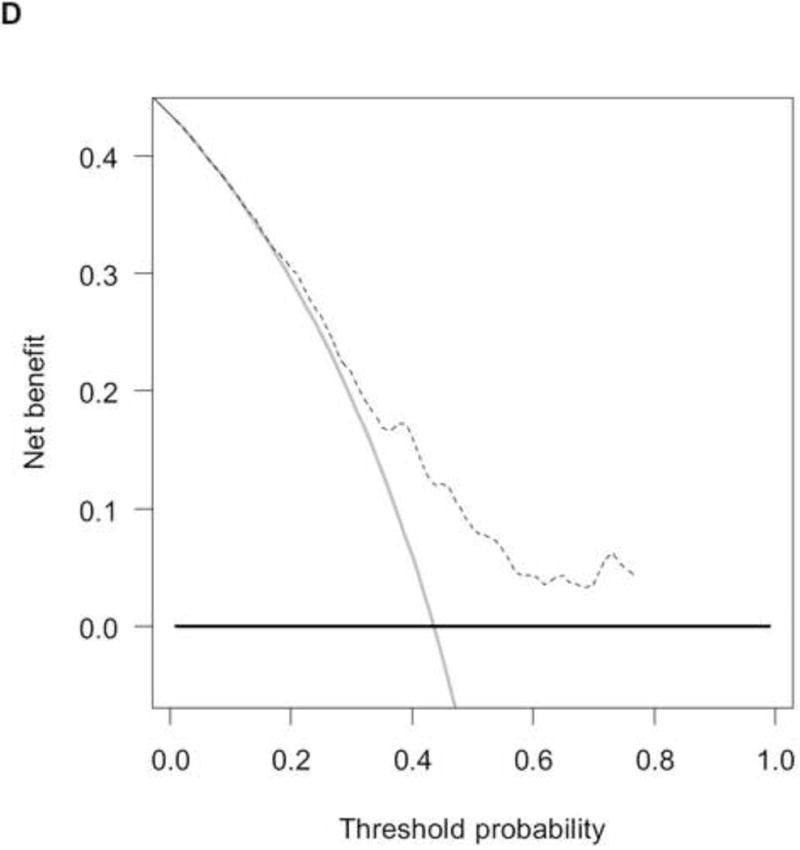
A) RISC1 nomogram to predict individual patient-level 1-, 2-, and 5-year overall survival based on baseline factors before starting first-line chemotherapy. B) Calibration plots for the validation sample of the RISC1 nomogram, estimated at 12 months, and C) 24 months. The average predicted probability (nomogram-predicted overall survival; x-axis) was plotted against Kaplan-Meier estimate (observed overall survival; y-axis). 95% confidence intervals of the Kaplan-Meier estimates are indicated with vertical lines. Red line indicates the reference line, indicating where an ideal nomogram would lie. D) Decision curves for overall survival at 12 and E) 24 months applied to the RISC1 nomogram.
Legend: solid thin line: net benefit of a strategy of treating all patients; solid bold line: net benefit of treating no patients; dotted line: net benefit of a strategy of treating patients according to the nomogram predictions.
Abbreviations: BMI: body-mass index; ECOG-PS: Eastern Cooperative Oncology Group Performance Status; NA: not available; RISC: Retrospective International Study of Invasive/Advanced Cancer of the Urothelium; WBC: white blood cell count.
Prognostic role of the response to first-line chemotherapy
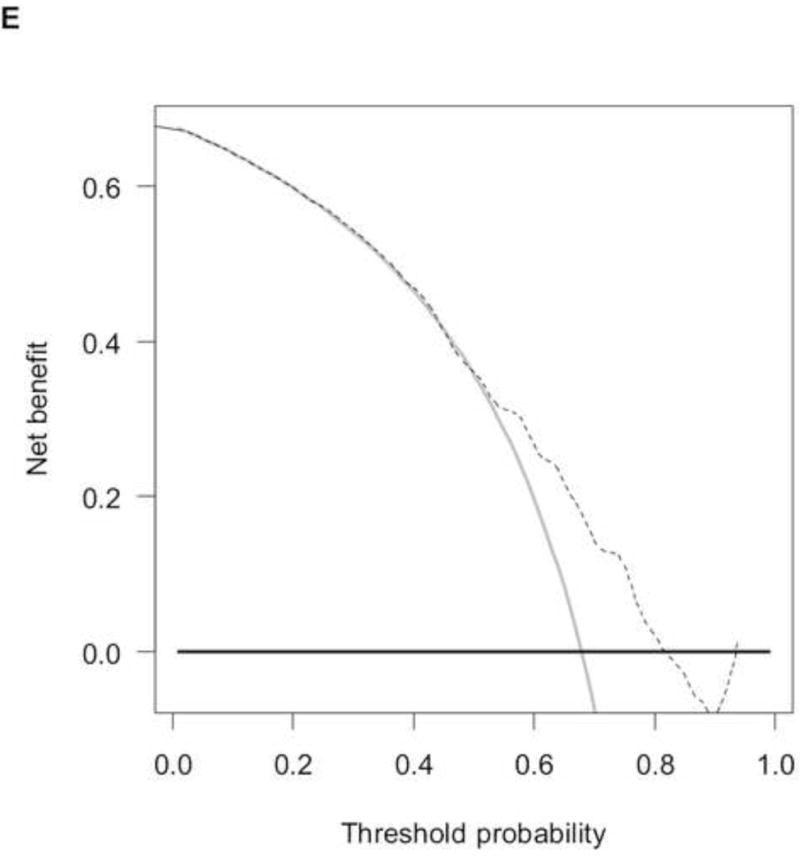
To analyse the interplay between predictions from baseline prognostic factors, response to chemotherapy and OS, we used the data from 737 patients (development cohort: N=506; validation cohort: N=231) who had information on response and fulfilled a 4-month landmark analysis. We found a significantly different distribution of nomogram scores according to the response to chemotherapy (Supplementary Figure 4, p<0.001). This finding implies that baseline covariates also predicted the response to chemotherapy. However, by modelling the response and nomogram scores together with a new Cox model for OS, both factors were statistically significant (Supplementary Table 2), and the c-index increased to 0.705 (95%CI: 0.670–0.739) and 0.670 (95%CI: 0.619–0.721) in the development and validation cohort, respectively. These findings suggest that tumour response must be considered an additional prognostic factor rather than a perfect surrogate for OS. The corresponding RISC2 nomogram is shown in Figure 3A, with calibration plots at 12 and 24 months (Figures 3B and 3C). Decision curves for the OS model are also shown in Figure 3. The plots show that model-based decisions are supported in the range of threshold probabilities of about 25–60% at 12 months (3D) and 30–85% at 24 months (3E).
Figure 3.
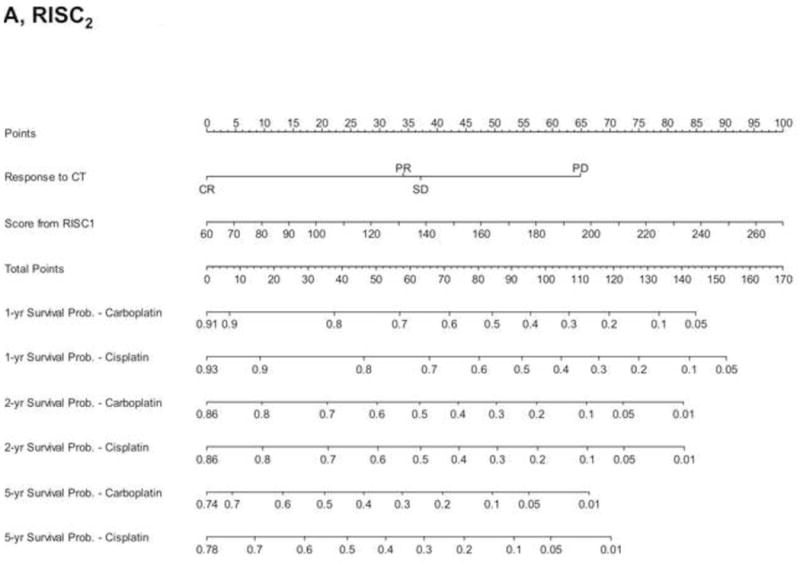
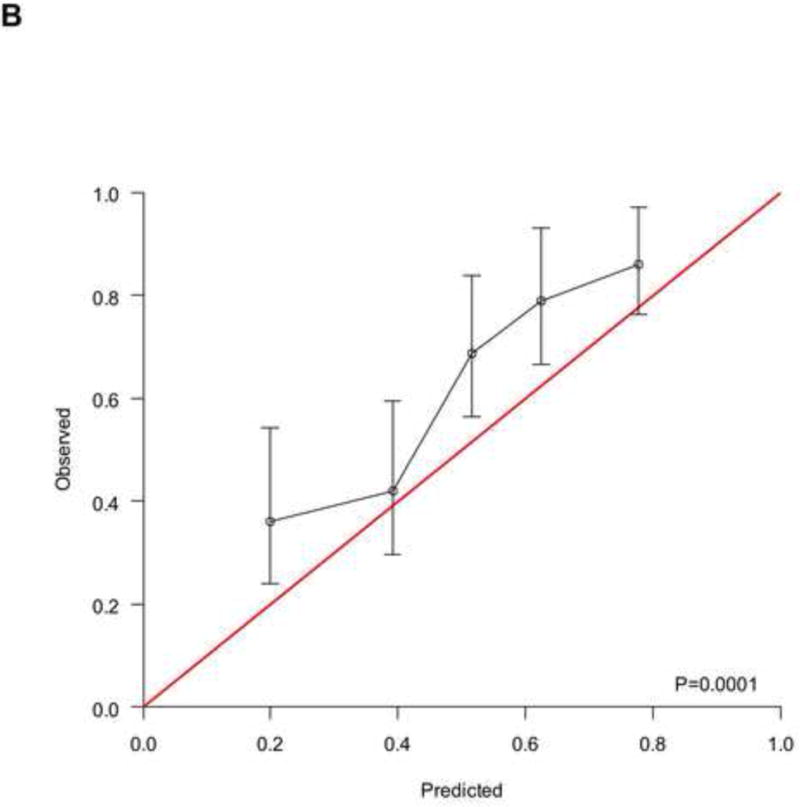
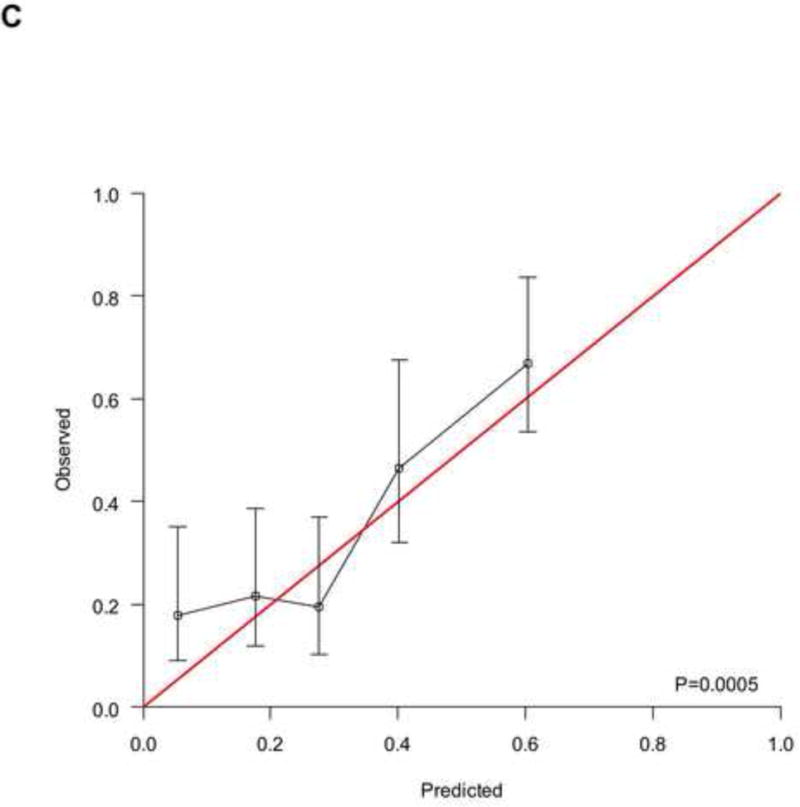

A) RISC2 nomogram to predict individual patient-level 1-, 2-, and 5-year overall survival based on the response to first-line chemotherapy added to the total score from RISC1. B) Calibration plots for the validation sample of the RISC2 nomogram, estimated at 12 months, and C) 24 months. D) Decision curves for overall survival at 12- and 24- (E) months applied to the RISC2 nomogram.
Legend: solid thin line: net benefit of a strategy of treating all patients; solid bold line: net benefit of treating no patients; dotted line: net benefit of a strategy of treating patients according to the nomogram predictions.
Abbreviations: CR: complete response; CT: chemotherapy; PD: progressive disease; PR: partial response; NA: not available; RISC1: nomogram with baseline factors from the Retrospective International Study of Invasive/Advanced Cancer of the Urothelium database; SD: stable disease.
Discussion
We developed and validated two new nomograms for estimating OS that apply to all patients with metastatic UC receiving platinum-based first-line chemotherapy. Also, we tested the available prognostic models for OS in a large, contemporary population of patients treated outside of clinical trials. The prognostic performance was analysed: in general, an improvement in the c-index in excess of 0.015 is deemed clinically relevant.[19] Consequently, we observed a meaningful performance improvement of our models compared to that of the Memorial Sloan-Kettering Cancer Center,[5] Apolo’s nomogram [6] and Galsky’s nomogram, which altogether accounted for PS, site of primary tumour, number of metastatic sites, albumin level, leukocyte count, and lymph node metastases.[8]
Remarkably, the most intriguing feature of our model is its applicability regardless of the type of platinum administered, a factor that has been further confirmed as having an impact on OS. Additionally, thanks to the construction of our models through a series drawn from current practice rather than a clinical trial population, many artificial factors typically arising in experimental setting (centre and patient selection, modalities of treatment administration and patient assessment) are unlikely to affect the results.
Some limitations must be recognized as well. First, in spite of the large sample size of both development and validation cohorts, an external validation would have strengthened our findings. Second, the retrospective nature of the study does not totally rule out that some patients were excluded from the RISC database because of missing records. Yet the number of missing data was not negligible for ECOG-PS and ethnicity factors, hence the “not available” category was introduced in the nomogram. Practical application of this choice might be the possibility to use the nomogram in retrospective case-series where the above information is also missing. Third, criteria for choosing carboplatin instead of cisplatin were rather heterogeneous, being based on either the clinical judgment or the policy of each centre. A way to account for the lack of standardization might be the inclusion of co-morbidity status (e.g. the Charlson comorbidity index) as a covariate into multivariable analysis, but this information could not be retrieved in our study. Similarly, we could not analyze other potentially meaningful factors like chemotherapeutic dosing, toxicity and tolerability, and need for dose reductions or treatment interruption. These factors might have accounted for the significant association of age with PFS in our multivariable model. Fourth, the study did not foresee a formal definition of response to chemotherapy. However, it is plausible that substantial overlap might exist in expert centres between Response Evaluation Criteria for Solid Tumours (RECIST) definitions and routine clinical practice. The lack of central response assessment and the possible variations in response assessment across the centres might partly explain the overlap between survival curves after PR and SD to first-line chemotherapy.
Finally, we were not confident in more finely assessing the impact of prior perioperative chemotherapy based on the time lapse to the initiation of first-line therapy owing to the lack of available data. Nevertheless, the suitability of cisplatin-based first-line therapy after prior perioperative cisplatin has been questioned [20] and analysing all platinum treatments does make sense.
The present model did incorporate the two historical factors that are common in most available models, i.e., ECOG-PS and LLB metastases, but two interesting and novel factors were shown to be significantly associated with OS: BMI and ethnicity. It is plausible that decreased BMI is associated with a shorter OS because it could be a surrogate for weight loss or cachexia. Regarding ethnicity, that was self-reported by patients in each case to avoid misunderstanding, it is possible that underlying differences in either the disease biology or pharmacogenomics may be responsible for the different survival, and further investigation is warranted. No differences in access to second-line therapy based on ethnicity could be found (data not shown), and socioeconomic information was not recorded in the database.
Despite the decision thresholds of the two nomograms suggested a net benefit over a fairly limited range at long term, these nomograms may be offered as possible aids to clinicians in the context of limited validated options for risk estimation. The RISC1 nomogram might be best applied to stratify the results in randomized clinical trials in which a standard chemotherapy arm is used. Examining the RISC2 nomogram, we observed an increase in the prognostic ability leading to a c-index of approximately 0.70 after the inclusion of tumour response as a predictor, together with baseline factors. Such a result was obtained in spite of a statistically significant association between the two nomogram components. This association is an original finding in the field of advanced UC, although caution is needed in interpreting the results owing to the acknowledged limitations.
Galsky et al. has already presented a post-treatment nomogram based on 317 cisplatin-treated patients, and its prognostic ability was equally good (c-index of 0.68).[12] Our proposal, however, has the advantage of expanding the field of applicability to all patients who had received a platinum-based combination chemotherapy. The applicability of the RISC2 may be twofold: in real world practice, where follow-up planning and patient counseling at the end of first-line chemotherapy may be better addressed; in the context of clinical trials, where the nomogram may provide the benchmark of expected OS with standard treatment and interest lies in investigating maintenance therapy. To make these new prognostication tools more user friendly, a free app called “RISCalculator” is being developed for smartphones and tablets and will be available in the app stores. Formulas for calculating estimated survival for individual patients are available to the reader upon request.
Conclusions
We developed and tested nomograms for estimating the OS of patients with metastatic UC receiving first-line platinum-based chemotherapy. The nomograms we developed were based on contemporary real world patients who were treated outside of clinical trials, included newly identified prognostic factors, and allowed for the response to chemotherapy. External validation of the present models and nomograms is warranted. Owing to the broad applicability of the baseline and post-treatment nomogram, and the comparatively improved performance of both, their use may be recommended.
Supplementary Material
Supplementary Figure 1: Kaplan-Meier curves of progression-free survival (A) and overall survival (B) in the overall population according to the platinum agent.
Legend: black line: carboplatin; red line: cisplatin.
Supplementary Figure 2: Kaplan-Meier curves of overall survival for carboplatin-treated (A) and cisplatin-treated (B) patients according to the response to chemotherapy.
Legend: black line: complete response; red line: partial response; green line: stable disease; blue line: progressive disease.
Abbreviations: CR: complete response; PD: progressive disease; PR: partial response; SD: stable disease.
Supplementary Figure 3: Kaplan-Meier curves of progression-free survival (A) and overall survival (B) in the development and validation groups, respectively.
Legend: black line: development group; red line: validation group.
Supplementary Figure 4: Box plots of RISC1 nomogram scores, according to the response to first-line chemotherapy.
Abbreviations: CR: complete response; CT: chemotherapy; PD: progressive disease; PR: partial response; RISC: Retrospective International Study of Invasive/Advanced Cancer of the Urothelium; SD: stable disease.
Acknowledgments
Funding: This work was not supported by any grant funding.
Footnotes
Conflict of interest statement: All authors have no conflict of interests to disclose.
References
- 1.Sonpavde G, Jones BS, Bellmunt J, Choueiri TK, Sternberg CN. Future directions and targeted therapies in bladder cancer. Hematol Oncol Clin North Am. 2015;29:361–376. doi: 10.1016/j.hoc.2014.10.008. [DOI] [PubMed] [Google Scholar]
- 2.Powles T, Eder JP, Fine GD, et al. MPDL3280A (anti-PD-L1) treatment leads to clinical activity in metastatic bladder cancer. Nature. 2014;515:558–562. doi: 10.1038/nature13904. [DOI] [PubMed] [Google Scholar]
- 3.Rosenberg JE, Hoffman-Censits J, Powles T, et al. Atezolizumab in patients with locally advanced and metastatic urothelial carcinoma who have progressed following treatment with platinum-based chemotherapy: a single-arm, multicentre, phase 2 trial. Lancet. 2016;387:1909–1920. doi: 10.1016/S0140-6736(16)00561-4. [DOI] [PMC free article] [PubMed] [Google Scholar]
- 4.Plimack ER, Bellmunt J, Gupta S, et al. Pembrolizumab (MK-3475) for advanced urothelial cancer: updated results and biomarker analysis from KEYNOTE-012. J Clin Oncol. 2015;33 suppl; abstr 4502. [Google Scholar]
- 5.Abida W, Bajorin DF, Rosenberg JE. First-line treatment and prognostic factors of metastatic bladder cancer for platinum-eligible patients. Hematol Oncol Clin North Am. 2015;29:319–328. doi: 10.1016/j.hoc.2014.10.005. [DOI] [PubMed] [Google Scholar]
- 6.Bajorin DF, Dodd PM, Mazumdar M, et al. Long-term survival in metastatic transitional-cell carcinoma and prognostic factors predicting outcome of therapy. J Clin Oncol. 1999;17:3173–3181. doi: 10.1200/JCO.1999.17.10.3173. [DOI] [PubMed] [Google Scholar]
- 7.Apolo AB, Ostrovnaya I, Halabi S, et al. Prognostic model for predicting survival of patients with metastatic urothelial cancer treated with cisplatin-based chemotherapy. J Natl Cancer Inst. 2013;105:499–503. doi: 10.1093/jnci/djt015. [DOI] [PMC free article] [PubMed] [Google Scholar]
- 8.Galsky MD, Moshier E, Krege S, et al. Nomogram for predicting survival in patients with unresectable and/or metastatic urothelial cancer who are treated with cisplatin-based chemotherapy. Cancer. 2013;11:3012–3019. doi: 10.1002/cncr.28146. [DOI] [PubMed] [Google Scholar]
- 9.Sonpavde G, Watson D, Tourtellot M, et al. Administration of cisplatin-based chemotherapy for advanced urothelial carcinoma in the community. Clin Genitourin Cancer. 2012;10:1–5. doi: 10.1016/j.clgc.2011.11.005. [DOI] [PubMed] [Google Scholar]
- 10.Galsky MD, Chen GJ, Oh WK, et al. Comparative effectiveness of cisplatin-based and carboplatin-based chemotherapy for treatment of advanced urothelial carcinoma. Ann Oncol. 2012;23:406–410. doi: 10.1093/annonc/mdr156. [DOI] [PubMed] [Google Scholar]
- 11.Sonpavde G, Galsky MD, Vogelzang NJ. First-line systemic therapy trials for advanced transitional-cell carcinoma of the urothelium: should we stop separating cisplatin-eligible and –ineligible patients? J Clin Oncol. 2010;28:e441–442. doi: 10.1200/JCO.2010.29.1047. [DOI] [PubMed] [Google Scholar]
- 12.Galsky MD, Moshier E, Krege S, et al. Posttreatment prognostic nomogram for patients with metastatic urothelial cancer completing first-line cisplatin-based chemotherapy. Urol Oncol. 2014;32:48.e1–8. doi: 10.1016/j.urolonc.2013.07.001. [DOI] [PubMed] [Google Scholar]
- 13.Schemper M, Smith TL. A note on quantifying follow-up in studies of failure time. Control Clin Trials. 1996;17:343–346. doi: 10.1016/0197-2456(96)00075-x. [DOI] [PubMed] [Google Scholar]
- 14.Hastie T, Tibshirani R, Friedman J, et al. The elements of statistical learning. Springer New York Inc; 2001. (New York: Springer series in statistics). [Google Scholar]
- 15.Harrell FE, Jr, Lee KL, Mark DB. Multivariable prognostic models: issues in developing models, evaluating assumptions and adequacy, and measuring and reducing errors. Stat Med. 1996;15:361–387. doi: 10.1002/(SICI)1097-0258(19960229)15:4<361::AID-SIM168>3.0.CO;2-4. [DOI] [PubMed] [Google Scholar]
- 16.Crowson CS, Atkinson EJ, Therneau TM. Assessing calibration of prognostic risk scores. Stat Methods Med Res. 2016;25:1692–1706. doi: 10.1177/0962280213497434. [DOI] [PMC free article] [PubMed] [Google Scholar]
- 17.Schemper M, Henderson R. Predictive accuracy and explained variation in Cox regression. Biometrics. 2000;56:249–255. doi: 10.1111/j.0006-341x.2000.00249.x. [DOI] [PubMed] [Google Scholar]
- 18.Vickers AJ, Elkin EB. Decision curve analysis: a novel method for evaluating prediction models. Med Decis Making. 2006;26:565–574. doi: 10.1177/0272989X06295361. [DOI] [PMC free article] [PubMed] [Google Scholar]
- 19.Nguyen CT, Kattan MW. How to tell if a new marker improves prediction. Eur Urol. 2011;60:226–228. doi: 10.1016/j.eururo.2011.04.029. [DOI] [PubMed] [Google Scholar]
- 20.Locke JA, Pond GR, Sonpavde G, et al. Cisplatin- versus non-cisplatin-based first-line chemotherapy for advanced urothelial carcinoma previously treated with perioperative cisplatin. Clin Genitourin Cancer. 2016;14:331–340. doi: 10.1016/j.clgc.2015.10.005. [DOI] [PMC free article] [PubMed] [Google Scholar]
Associated Data
This section collects any data citations, data availability statements, or supplementary materials included in this article.
Supplementary Materials
Supplementary Figure 1: Kaplan-Meier curves of progression-free survival (A) and overall survival (B) in the overall population according to the platinum agent.
Legend: black line: carboplatin; red line: cisplatin.
Supplementary Figure 2: Kaplan-Meier curves of overall survival for carboplatin-treated (A) and cisplatin-treated (B) patients according to the response to chemotherapy.
Legend: black line: complete response; red line: partial response; green line: stable disease; blue line: progressive disease.
Abbreviations: CR: complete response; PD: progressive disease; PR: partial response; SD: stable disease.
Supplementary Figure 3: Kaplan-Meier curves of progression-free survival (A) and overall survival (B) in the development and validation groups, respectively.
Legend: black line: development group; red line: validation group.
Supplementary Figure 4: Box plots of RISC1 nomogram scores, according to the response to first-line chemotherapy.
Abbreviations: CR: complete response; CT: chemotherapy; PD: progressive disease; PR: partial response; RISC: Retrospective International Study of Invasive/Advanced Cancer of the Urothelium; SD: stable disease.